an insight into gold
TRANSCRIPT

8/7/2019 An Insight Into Gold
http://slidepdf.com/reader/full/an-insight-into-gold 1/19
8/7/2019 An Insight Into Gold
http://slidepdf.com/reader/full/an-insight-into-gold 2/19
www.capitalheight.com
Phone- (0731)4295950
CONTENTS
Introduction
Gold Price Forecast of 2011
U.S Dollar Weakness
Central Bank Reserves
Investors’ Interest
Who Is Buying Gold
15 Fundamental Reasons to own Gold
Technical View

8/7/2019 An Insight Into Gold
http://slidepdf.com/reader/full/an-insight-into-gold 3/19
www.capitalheight.com
Phone- (0731)4295950
Introduction
Gold is a ubiquitous metal. Its uses vary from a milk man’s wedding to the crown of the
queen. The preference for gold ranges from ornamental value to increasing investment
options. The prices of Gold are witnessing an unprecedented rise in the recent past. In
2009 the price of gold registered an increase of around 15 percent. In the last three
years there has been a 70 percent increase in the price of the yellow metal. Forecasting
or predicting the price of gold is not an easy task. There is not a simple formula or chart
to consult when guessing where bullion prices will be in 2011. The entire economy is
similar to a living breathing organism with many complex parts. Isolating any one aspect
is done with the risk of being inaccurate. The price of gold is a difficult number to
determine in the overall economic outlook. To even begin the less than scientific
process of forecasting the price of gold, an investor would need to comprehend what is
fundamentally behind gold prices. What drives the price of gold up or down? What are
the reasons for this rise? This question is perplexing everyone from an economist to a
common man across the world.
Gold Price Forecast of 2011
There are some business applications for gold such as contacts and wires in semi-
conductors, or the use of gold in medical instruments. But has the rising price of gold
from 400 to 1,400 dollars per ounce in 5 years really come from the industrial or even
the jewelry market? There is another factor to consider.
The value of paper currency can be quite volatile. The FOREX market will take a
currency pair for trading and chart the relationship. Look at how the US dollar and the
Yen changed relative values over time. In 2002, one US dollar was worth 135 Yen, and
in 2010 this amount fell to a mere 85 Yen. Why is the price of paper currency so
unstable?
8/7/2019 An Insight Into Gold
http://slidepdf.com/reader/full/an-insight-into-gold 4/19
www.capitalheight.com
Phone- (0731)4295950
• Political unrest
• Economic depression
• Rising Inflation
There are many other micro-factors that affect gold prices, but essentially it is seen as a
form of currency with backing. Gold trading is an alternative monetary system when the
local government is in distress. Gold can be easily traded anywhere in the world so its
value is not tied directly into the country of one’s origin. Gold is the warm blanket that
many pull around them when fear of the outside world looms. With the economic and
political problems around the world it is easy to understand why many would desire aform of currency that has intrinsic value.
Gold Price Forecast for 2011 High from US Dollar Weakness
Traditionally, gold has been used as a hedge against the falling dollar. The idea behind
this trading is that gold is an alternative to currency that is not as strongly influenced by
any one economy. The relationship between gold and currency is an inverse one. In
addition to this, as gold is often quoted per ounce in US dollars, investors with
alternative currencies may find that their native dollar stretches further with more value
when the US dollar falls.
Central Bank Gold Reserves Buying Affect Predictive Price Models Per Ounce
Central banks typically hold gold as a portion of their reserves. If central banks engage
in net buying of gold this can drive spot prices up; if they sell, the price per ounce maysubside. Jeffrey Nichols, a leading precious metals economist for over 25 years, states
that China may be looking to add 5,000 tons of gold to their central bank reserves over
the next three to five years. If this is true, gold may have a supply downfall with this
8/7/2019 An Insight Into Gold
http://slidepdf.com/reader/full/an-insight-into-gold 5/19
www.capitalheight.com
Phone- (0731)4295950
potentially increased demand in 2011 as well as the following years -- thus extending
the bullish trend.
Investor Interest Increasing in Futures and Commodities
Another factor boosting the value of gold is the rising interest in commodities from
individual investors and investment funds alike. The recent decade has provide market
speculators an increasingly easy way to trade gold, silver, oil, coffee, and other
commodities through chart trading platforms in their own home. As the spot price of gold
continues to rise, this creates a self-generating buzz of excitement which in turn leads to
higher prices yet again.
Who is Buying Gold and Driving Prices Up?
In recent years there has been a large surge of interest amongst the commodity market
traders, but many others are buying gold too:-
1. Ordinary people can open up their trading platform and buy and sell future contracts
of gold.
2. The government can accumulate gold in its reserves. While paper currency is good
for funding local projects, gold is a better form of payment when dealing with other
countries.
3. Banks may add gold to their reserves as well.
4. Stock traders can buy and sell gold based ETF’s or exchange traded funds.
All of these sources create a buying and selling pressure that will ultimately drive up the
price of gold or crash it down.
8/7/2019 An Insight Into Gold
http://slidepdf.com/reader/full/an-insight-into-gold 6/19
www.capitalheight.com
Phone- (0731)4295950
15 Fundamental Reasons to Own Gold
Global Currency Debasement
The U.S. dollar is fundamentally and technically very weak and should fall dramatically
over the next few years. However, other countries are very reluctant to see their
currencies appreciate and are resisting the fall of the U.S. dollar.
Thus, we are in the early stages of a massive global currency debasement which willsee tangibles, and most particularly gold, rise significantly in price.
Rising Investment Demand
When the crowd recognizes what is unfolding, they will seek an alternative to paper
currencies and financial assets and this will create an enormous investment demand for
gold. Own both the physical metal and select mining shares.
Alarming Financial Deterioration in the U.S.
In the space of two years, the federal government budget surplus has been transformed
into a yawning deficit, which will persist as far as the eye can see. At the same time, the
current account deficit has reached levels, which has portended currency collapse in
virtually every other instance in history.

8/7/2019 An Insight Into Gold
http://slidepdf.com/reader/full/an-insight-into-gold 7/19
www.capitalheight.com
Phone- (0731)4295950
Negative Real Interest Rates in Reserve Currency (U.S. Dollar)
To combat the deteriorating financial conditions in the U.S., interest rates have been
dropped to rock bottom levels, real interest rates are now negative and, according to
statements from the Fed spokesmen, are expected to remain so for some time. There
has been a very strong historical relationship between negative real interest rates and
stronger gold prices.
Dramatic Increases in Money Supply in the US and Other Nations
Authorities are terrified about the prospects for deflation given the unprecedented debt
burden at all levels of society in the U.S. Fed Governor Ben Bernanke is on record as
saying the Fed has a printing press and will use it to combat deflation if necessary.
Other nations are following in the U.S.'s footsteps and global money supply is
accelerating. This is very gold friendly.
Existence of a Huge and Growing Gap between Mine Supply and Traditional Demand
Mined gold is roughly 2,500 tons per year and traditional demand (jewelry, industrial
users, etc.) has exceeded this by a considerable margin for a number of years. Some of
this gap has been filled by recycled scrap but central bank gold has been the primary
source of above-ground supply.
Mine Supply is anticipated to Decline in the next Three to Four Years
Even if traditional demand continues to erode due to ongoing worldwide economic
weakness, the supply/demand imbalance is expected to persist due to a decline in mine
supply. Mine supply will contract in the next several years, irrespective of gold prices,
8/7/2019 An Insight Into Gold
http://slidepdf.com/reader/full/an-insight-into-gold 8/19
www.capitalheight.com
Phone- (0731)4295950
due to a dearth of exploration in the post Bre-X era, a shift away from high grading
which was necessary for survival in the sub-economic gold price environment of the
past five years and the natural exhaustion of existing mines.
Large Short Positions
To fill the gap between mine supply and demand, Central Bank gold has been mobilized
primarily through the leasing mechanism, which facilitated producer hedging and
financial speculation. Strong evidence suggests that between 10,000 and 16,000 tons
(30-50% of all Central Bank gold) is currently in the market. This is owed to the Central
Banks by the bullion banks, which are the counter party in the transactions.
Low Interest Rates Discourage Hedging
Rates are low and falling. With low rates, there isn't sufficient contango to create higher
prices in the out years. Thus there is little incentive to hedge and gold producers are not
only hedging, they are reducing their existing hedge positions, thus removing gold from
the market.
Rising Gold Prices and Low Interest Rates Discourage Financial Speculation on the
Short Side
When gold prices were continuously falling and financial speculators could access
Central Bank gold at a minimal leasing rate (0.5 - 1% per year), sell it and reinvest the
proceeds in a high yielding bond or Treasury bill, the trade was viewed as a lay-up.
Everyone did it and now there are numerous stale short positions. However, these
trades now make no sense with a rising gold price and declining interest rates.

8/7/2019 An Insight Into Gold
http://slidepdf.com/reader/full/an-insight-into-gold 9/19
www.capitalheight.com
Phone- (0731)4295950
The Central Banks are nearing an Inflection Point when they will be Reluctant to
provide more Gold to the Market.
The Central Banks have supplied too much already via the leasing mechanism. In
addition, Far Eastern Central Banks who are accumulating enormous quantities of U.S.
Dollars are rumored to be buyers of gold to diversify away from the U.S. Dollar.
Gold is increasing in Popularity
Gold is seen in a much more positive light in countries beginning to come to the
forefront on the world scene. Prominent developing countries such as China, India and
Russia have been accumulating gold. In fact, China with its 1.3 billion people recently
established a National Gold Exchange and relaxed control over the asset. Demand in
China is expected to rise sharply and could reach 500 tons in the next few years.
Gold as Money is Gaining Credence
Islamic nations are investigating a currency backed by gold (the Gold Dinar), the new
President of Argentina proposed, during his campaign, a gold backed peso as an
antidote for the financial catastrophe which his country has experienced and Russia is
talking about a fully convertible currency with gold backing.
Rising Geopolitical Tensions
The deteriorating conditions in the Middle East, the U.S. occupation of Iraq, the nuclear
ambitions of North Korea and the growing conflict between the U.S. and China due to
China's refusal to allow its currency to appreciate against the U.S. dollar headline the
8/7/2019 An Insight Into Gold
http://slidepdf.com/reader/full/an-insight-into-gold 10/19
www.capitalheight.com
Phone- (0731)4295950
geopolitical issues, which could explode at anytime. A fearful public has a tendency to
gravitate towards gold.
Limited Size of the Total Gold Market Provides Tremendous Leverage
All the physical gold in existence is worth somewhat more than $1 trillion U.S. Dollars
while the value of all the publicly traded gold companies in the world is less than $100
billion US dollars. When the fundamentals ultimately encourage a strong flow of capital
towards gold and gold equities, the trillions upon trillions worth of paper money could
propel both to unfathomably high levels.
There is no definitive answer to where the price of gold will be in 2011. The best an
investor can do is to look at possibilities based on historical data. If an investor assumes
that paper currency will continue its debasing trend, what would be a high estimate on
gold prices per ounce? To answer that one needs to look for the highest that gold has
been in the past.
January 21st, 1980 saw the price of gold reach 850 US dollars per ounce. To
understand how much money this is worth today one would need to adjust the figures
according to the Consumer Price Index. 850 dollars in 1980 is worth 2,250 US dollars in
the year 2010. If gold were to repeat the value of a previous high it could double from
the price it is trading at in June of 2010.
Other analysts suggest that because the current economic output is many times greater
than 30 years ago, the peak price of gold could even reach 5,000 dollars per ounce.
On the other hand the argument could be made that markets are based on mass
psychology and trader emotions. Some might suggest that the average person would
not believe that the price of gold could ever reach up to 5,000 dollars, thus creating a
8/7/2019 An Insight Into Gold
http://slidepdf.com/reader/full/an-insight-into-gold 11/19
www.capitalheight.com
Phone- (0731)4295950
resistance to that level ever being achieved. Some analysts believe that as the market
recovers in 2011 and beyond, the price of gold will retreat dramatically as the economic
woe gets pushed to the backs of people’s minds and their hedging tactics are tossed
aside.
In next section, we have illustrated our technical view on Gold by presenting its various
averages, Fibonacci retracement levels, Expansion levels and indepth analysis using
various technical indicators on different time frames of charts supporting our technical
view, and on the basis of these our technical target on Gold.
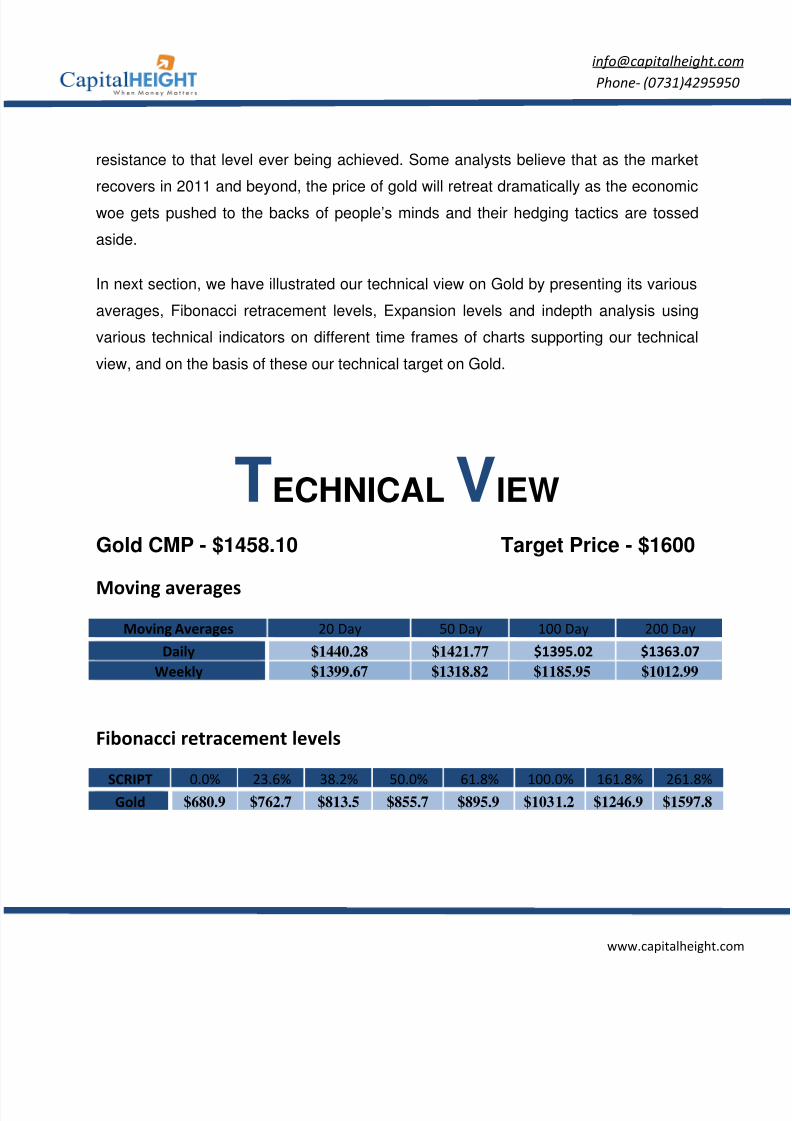
TECHNICAL VIEW
Gold CMP - $1458.10 Target Price - $1600
Moving averages
Moving Averages 20 Day 50 Day 100 Day 200 Day
Daily $1440.28 $1421.77 $1395.02 $1363.07
Weekly $1399.67 $1318.82 $1185.95 $1012.99
Fibonacci retracement levels
SCRIPT 0.0% 23.6% 38.2% 50.0% 61.8% 100.0% 161.8% 261.8%Gold $680.9 $762.7 $813.5 $855.7 $895.9 $1031.2 $1246.9 $1597.8
8/7/2019 An Insight Into Gold
http://slidepdf.com/reader/full/an-insight-into-gold 12/19
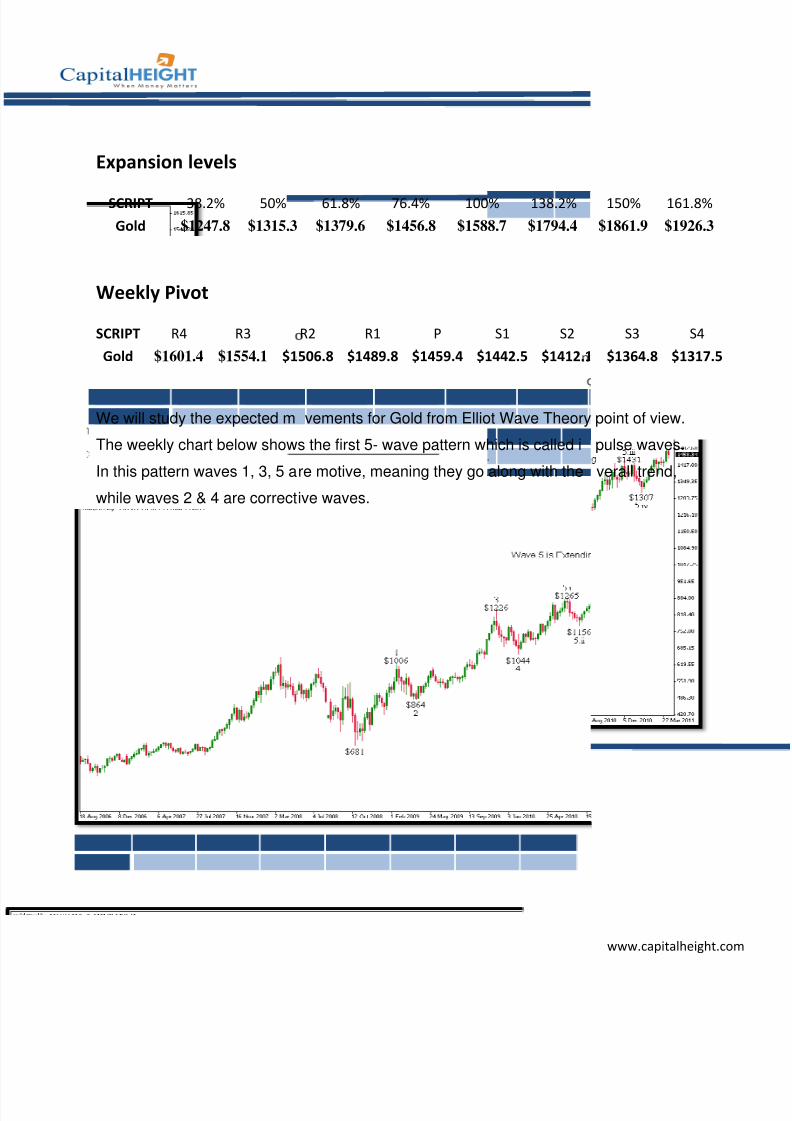
Expansion levels
SCRIPT 38.2% 50%
Gold $1247.8 $1315.3
Weekly Pivot
SCRIPT R4 R3
Gold $1601.4 $1554.1 $1
We will study the expected m
The weekly chart below show
In this pattern waves 1, 3, 5 a
while waves 2 & 4 are correct
61.8% 76.4% 100% 138.2%
$1379.6 $1456.8 $1588.7 $1794.4
R2 R1 P S1 S2
506.8 $1489.8 $1459.4 $1442.5 $1412.1
vements for Gold from Elliot Wave Theory
s the first 5- wave pattern which is called i
re motive, meaning they go along with the
ive waves.
www.capitalheight.com
Phone- (0731)4295950
150% 161.8%
$1861.9 $1926.3
S3 S4
$1364.8 $1317.5
point of view.
pulse waves.
verall trend,

8/7/2019 An Insight Into Gold
http://slidepdf.com/reader/full/an-insight-into-gold 13/19
www.capitalheight.com
Phone- (0731)4295950
We have numbered the waves starting from the wave 1 low of $681 and concluded that
wave 5 is extending. This opinion is based on the size of the corrections since the wave
4 low at $1044. The following analysis of the minor waves and their relative proportions
should make this quite clear:-
Wave 1 680.9 to 1006.1 +325.0 +47.75%
Wave 2 1006.1 to 864.4 -141.7 -14.08%
Wave 3 864.4 to 1226.2 +361.8 +41.85%
Wave 4 1226.2 to 1044.0 -182.2 -14.9%
Wave 5 is extending…
The similarity of the 14% declines of the corrective wave 2 & 4 above indicates that they
are part of the same impulse wave. The much smaller declines of 8.6% and 8.7% are
evidence that wave 5 is still extending.
Extended wave 5:-
Wave 5.i 1044.0 to 1265.0 +221.0 +21.2%
Wave 5.ii 1265.0 to 1156.6 -108.5 -8.6%
Wave 5.iii 1156.6 to 1431.3 +274.7 +23.8%
Wave 5.iv 1431.3 to 1307.5 -123.8 -8.7%
Wave 5.v 1307.5 to 1601.5 +294 +22.47% (forecast – assumes the
same % gain as in average of 5.i & 5.iii)
Total 5 1044.0 to 1601.5 +584 +53.4%
8/7/2019 An Insight Into Gold
http://slidepdf.com/reader/full/an-insight-into-gold 14/19
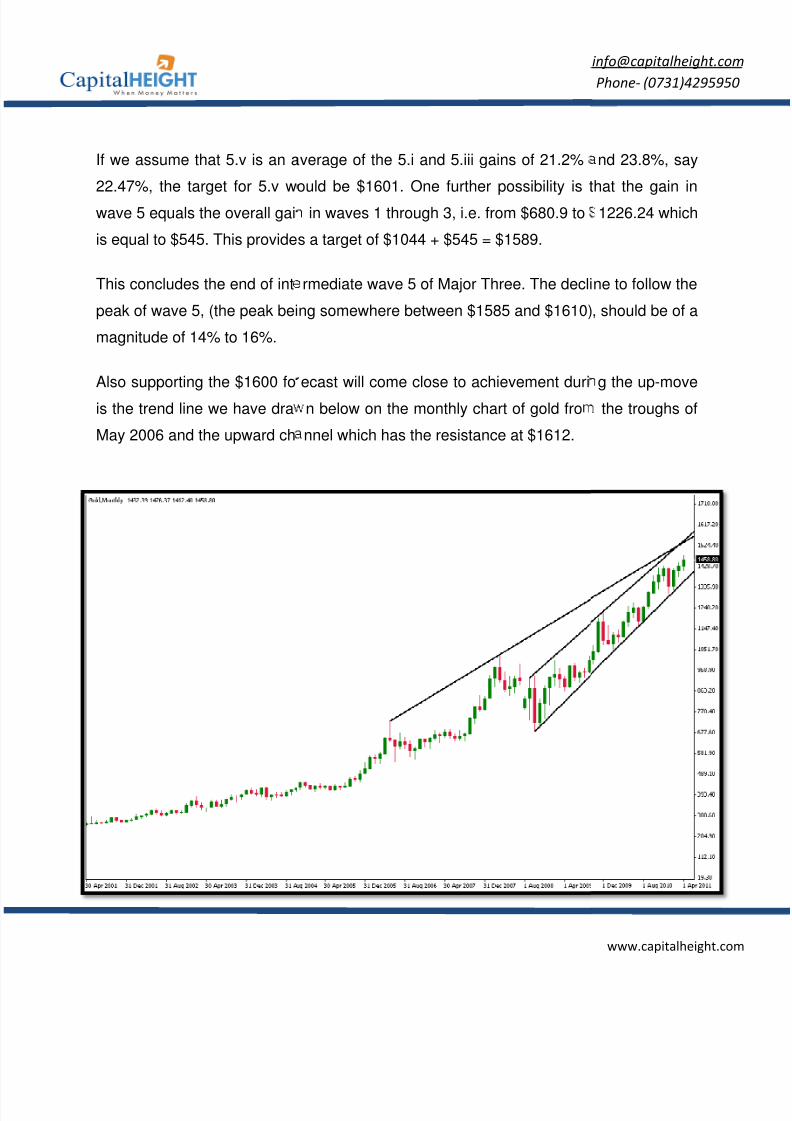
If we assume that 5.v is an a
22.47%, the target for 5.v w
wave 5 equals the overall gai
is equal to $545. This provide
This concludes the end of int
peak of wave 5, (the peak bei
magnitude of 14% to 16%.
Also supporting the $1600 fo
is the trend line we have dra
May 2006 and the upward ch
verage of the 5.i and 5.iii gains of 21.2%
ould be $1601. One further possibility is t
in waves 1 through 3, i.e. from $680.9 to
s a target of $1044 + $545 = $1589.
rmediate wave 5 of Major Three. The decli
ng somewhere between $1585 and $1610)
ecast will come close to achievement duri
n below on the monthly chart of gold fro
nnel which has the resistance at $1612.
www.capitalheight.com
Phone- (0731)4295950
nd 23.8%, say
hat the gain in
1226.24 which
ne to follow the
, should be of a
g the up-move
the troughs of

8/7/2019 An Insight Into Gold
http://slidepdf.com/reader/full/an-insight-into-gold 15/19
In the weekly chart of Gold
from March 2008 to October
during October 2009. It took
the gold took resistance and
breached 161.8% retraceme
uptrend taking support at th
previously mentioned target
suggests an upward breakou
$1430 level.
below, is its Fibonacci retracement of do
2008. If we see, the gold breached the 10
old a year to fully recover from the downt
consolidated at the retracement level if 16
nt level in the late 2010. Since then the
$1300 level. The next retracement of 2
of $1590 - $1610. The ascending triangle
t in gold but before that it may pullback to
www.capitalheight.com
Phone- (0731)4295950
ntrend starting
% retracement
end. After that
1.8%. The gold
gold is in the
1.8% is at our
formation also
take support at
8/7/2019 An Insight Into Gold
http://slidepdf.com/reader/full/an-insight-into-gold 16/19
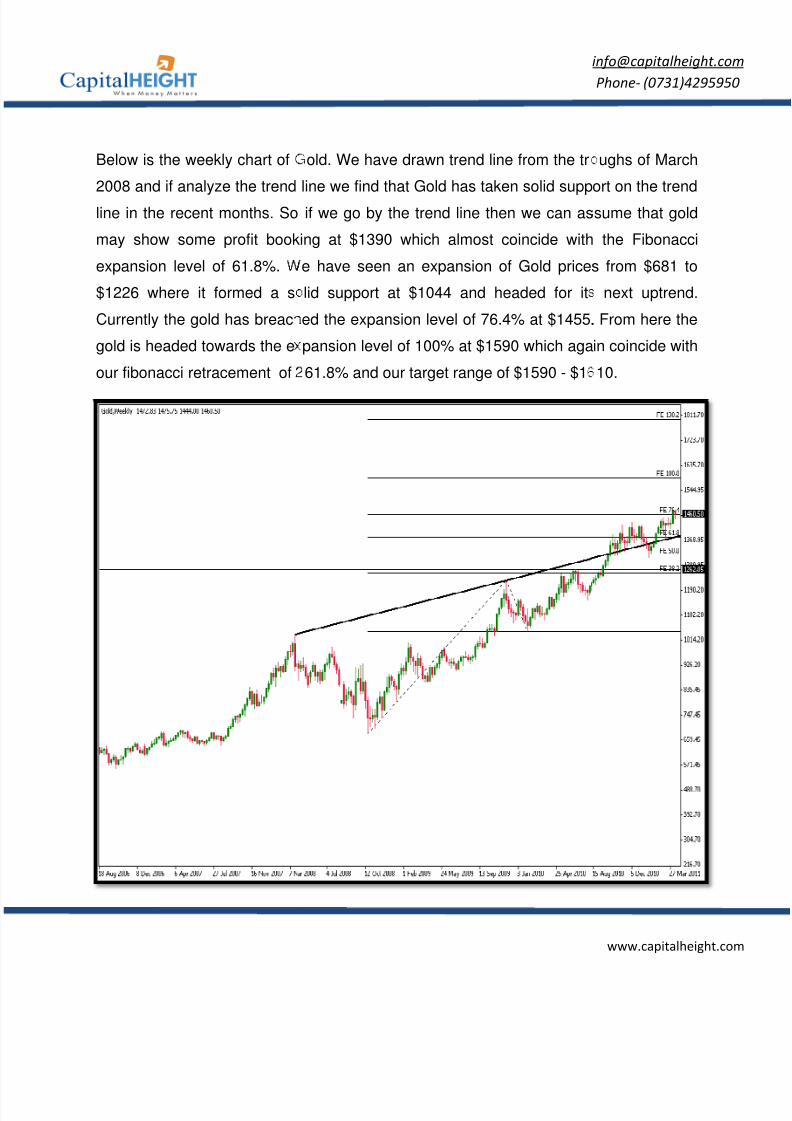
Below is the weekly chart of
2008 and if analyze the trend
line in the recent months. So
may show some profit book
expansion level of 61.8%.
$1226 where it formed a s
Currently the gold has breac
gold is headed towards the e
our fibonacci retracement of
old. We have drawn trend line from the tr
line we find that Gold has taken solid supp
if we go by the trend line then we can as
ing at $1390 which almost coincide with
e have seen an expansion of Gold price
lid support at $1044 and headed for it
ed the expansion level of 76.4% at $1455.
pansion level of 100% at $1590 which aga
61.8% and our target range of $1590 - $1
www.capitalheight.com
Phone- (0731)4295950
ughs of March
ort on the trend
sume that gold
the Fibonacci
s from $681 to
next uptrend.
. From here the
in coincide with
10.

8/7/2019 An Insight Into Gold
http://slidepdf.com/reader/full/an-insight-into-gold 17/19
To support our calculations o
trend of gold which is in gen
applied Ichimoku Kinko Hyo (
and determines future areas
the Senkou span (Orange), th
line serves as the second su
of future price movement. Th
could continue to climb highe
red line is moving up which
Chikou Span or the green line
buy signal.
n Gold we have applied some indicators t
ral reasonably bullish. In the weekly chart
IKH). It is an indicator that gauges future p
of support and resistance. In the chart, th
e top line serves as the first support level
pport level. Meanwhile, the Kijun Sen acts
e Gold price is higher than the blue line; s
r. The Tenkan Sen is an indicator of the m
pretty indicates that the market is in uptr
is crossing the price in the bottom-up dire
www.capitalheight.com
Phone- (0731)4295950
show you the
below we have
rice momentum
price is above
hile the bottom
as an indicator
o this means it
rket trend. The
nd. Lastly, the
tion, so that's a
8/7/2019 An Insight Into Gold
http://slidepdf.com/reader/full/an-insight-into-gold 18/19
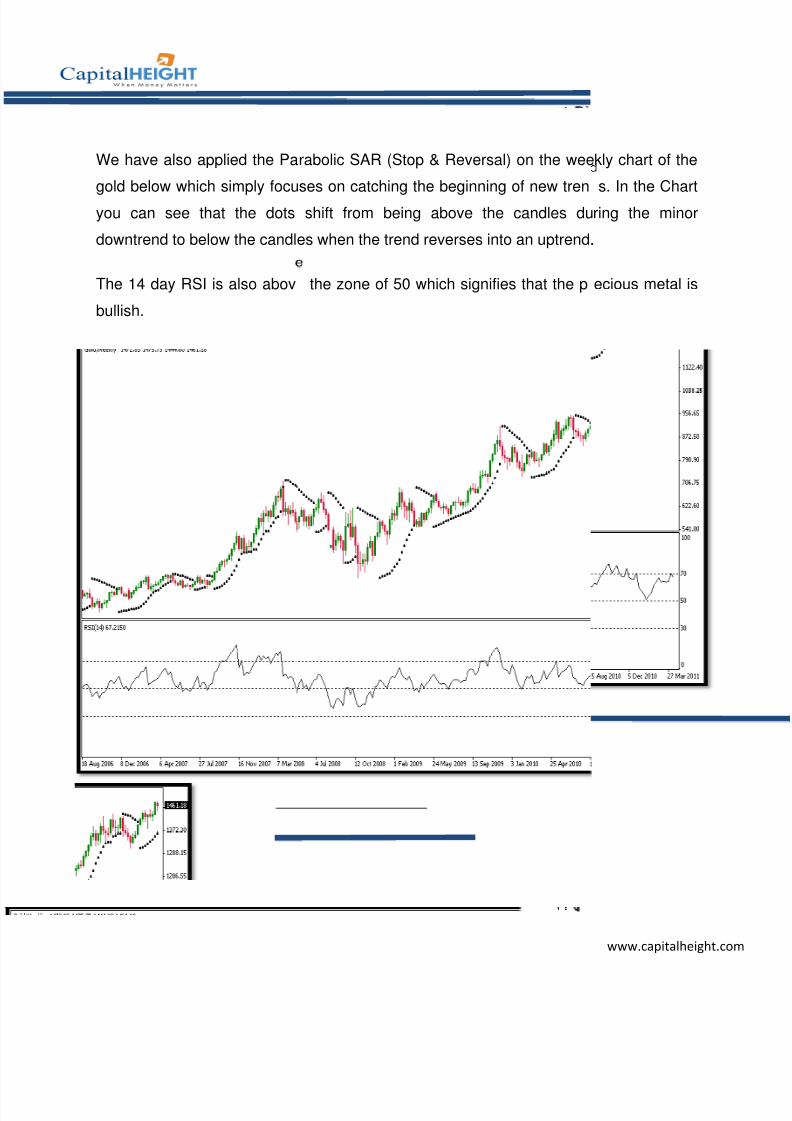
We have also applied the Pa
gold below which simply focu
you can see that the dots
downtrend to below the candl
The 14 day RSI is also abov
bullish.
rabolic SAR (Stop & Reversal) on the wee
ses on catching the beginning of new tren
shift from being above the candles du
es when the trend reverses into an uptrend.
the zone of 50 which signifies that the p
www.capitalheight.com
Phone- (0731)4295950
kly chart of the
s. In the Chart
ring the minor
.
ecious metal is
8/7/2019 An Insight Into Gold
http://slidepdf.com/reader/full/an-insight-into-gold 19/19
www.capitalheight.com
Phone- (0731)4295950
Disclaimer
The information and views in this report, our website & all the service we provide are believed to be reliable,
but we do not accept any responsibility (or liability) for errors of fact or opinion. Users have the right to
choose the product/s that suits them the most.
Sincere efforts have been made to present the right investment perspective. The information contained
herein is based on analysis and up on sources that we consider reliable.
This material is for personal information and based upon it & takes no responsibility
The information given herein should be treated as only factor, while making investment decision. The report
does not provide individually tailor-made investment advice. Capitalheight recommends that investors
independently evaluate particular investments and strategies, and encourages investors to seek the advice
of a financial adviser. Capitalheight shall not be responsible for any transaction conducted based on the
information given in this report, which is in violation of rules and regulations of NSE and BSE.
The share price projections shown are not necessarily indicative of future price performance. The
information herein, together with all estimates and forecasts, can change without notice. Analyst or any
person related to Capitalheight might be holding positions in the stocks recommended. It is understood that
anyone who is browsing through the site has done so at his free will and does not read any views expressed
as a recommendation for which either the site or its owners or anyone can be held responsible for . Any
surfing and reading of the information is the acceptance of this disclaimer.
All Rights Reserved.
Investment in Commodity and equity market has its own risks.
We, however, do not vouch for the accuracy or the completeness thereof. we are not responsible for any loss
incurred whatsoever for any financial profits or loss which may arise from the recommendations above.
Capital height does not purport to be an invitation or an offer to buy or sell any financial instrument. Our
Clients (Paid Or Unpaid), Any third party or anyone else have no rights to forward or share our calls or SMS
or Report or Any Information Provided by us to/with anyone which is received directly or indirectly by them.
If found so then Serious Legal Actions can be taken