an integer optimization approach to a probabilistic reserve site
TRANSCRIPT

AN INTEGER OPTIMIZATION APPROACHTO A PROBABILISTICRESERVESITE SELECTION PROBLEM
ROBERT G. HAIGHTU.S.D.A. Forest Service, North Central Research Station, 1992 Fo[well Avenue, St. Paul, Minnesota 55108, rhaight.fs.fea_us
CHARLES S. REVELLE
Johns HoPkins .University, Department of Geography and Environmental Engineering, 313 Ames Hall, Baltimore, Maryland 21218, revelle@jhtLedu
STEPHANIE A. SNYDERMinnesota Department of Transportation, 108 Cecil Street SE, Minneapolis, MN 55919, [email protected]
(Received June 1998; revisions received February 1999, June 1999; accepted June 1999)
tnterest in protecting natural areas is increasing as development pressures and conflicting land uses threaten and fragment ecosystems.A variety of quantitative approaches have been developed to help managers select sites for biodiversity protection. The problem is oftenformulated to select the set of reserve sites that maximizes the number of species or ecological communities that are represented, subjectto an upper bound on the number or area of selected sites. Most formulations assume that information about the presence or absence ofspecies in the candidate sites is known with certainty. Because complete information typically is lacking, we developed a reserve selectionformulation that incorporates probabilistic presence-absence data. The formulation was a discrete 0/1 optimization model that maximizedthe number of represented vegetation communities subject to a budget constraint, where a community was considered represented if itsprobability of occurrence in the set of selected sites exceeded a specified minimum reliability threshold. Although the formulation wasnonIinear, a log transformation allowed us to represent the problem in a linear format that could be solved using exact optimizationmethods. The formulation was tested using a moderately sized reserve selection problem based on data from the Superior National Forestin Mirmesota.
....
uman economic and agricultural activities contribute always be financially possible to protect all the species orto the endangerment of over 900 species that are cur- ecosystems in a region.This issue is of particular importancerently listed or proposed for listing under the federal Endan- when dealing with public lands in which multiple and con-gered Species Act in the United States (Dobson et al. 1997). flicting resource demands are the norm. Difficult decisionsOne approach to conserving the elements of biologi- must olden be made that recognize and evaluate the trade-cal diversity--including plants, animals, and ecological offs between biodiversity protection goals and alternativecommunities_is to establish and enhance biological land and resource uses. A haphazard selection of protectedreserves in which economic development is curtailed reserves such as RNAs may do little to contribute to bio-(Ando et al. 1998). For example, between 1927 and diversity protection goals. Automated, quantitative methods1998, the U.S. Forest Service established 427 research that can efficiently and effectively identify sets of sites fornatural areas (RNAs)coveting over 500,000 acres of reserve status could enhance the decision maker's or landland in national forests of the United States. These bi- manager's ability to make sound decisions regarding levelsological reserves are permanently protected and main- of reserve protection.tained in their natural condition for the purposes of A number of quantitative methods have been developedconserving species and ecosystems, conducting nonmani- over the past 15 years to address the reserve selection prob-pulative research and monitoring, and fostering education, lem, as it is commonly referred to in the biological conserva-Examples of land-use planning for the protection of biodi- tion literature. A common approach is to select the set of sitesversity abound, including cases in Australia, South Africa, that maximizes the number of species that are representedand Norway (Pressey et al. 1997). The establishmentand by the reservenetwork,where aspecies is consideredrepre-enhancementofbi01ogical reserves is viewed as the cor- sentedif at least one site witha known,viable populationofnerstone of biodiversityconservationthroughoutthe world the species is protected.Most of those models assume that(Noss and Cooperrider !994, PimrnandLawton 1998). the presenceandabsence of all the species in the candidate
Given the reality that protectedreservestatus may pro- reservesites areknownwith certainty.Inpractice,however,hibit otherland andresourceactivitieson a site, it may not predictionsof the presence and absence of species can be
Subjectclassifications:Environrnent:protectednaturalreserveson nationalforests.Programming,integer:discrete0/1 by exactsolutionmethods.Probability,applications:. presence-absencedataof speciesin reserves.
Area of review: ENVIRONMENT, ENERGY AND NATURAL RESOURCES.
OperationsResearch,.©2000 INFORMS 0030-364X/00/4805-0697$05.00Vol.48, No. 5, September--October2000,pp. 697-708 697 1526-5463electronicISSN

698 / HAtCH.T,REVELLE, AND SNYDER
erroneous. For example, species assumed to be absent be- solutions that are ineffectualor inefficient. An advantage ofcause they were not encountered in partial surveys of sites this approach to reserve selection, however, is the abilitymight actually be present. On the other hand, species as- to rapidly generate feasible solutions to what could be verysumed to be present because of their association with known large and complex problems.communities might actually be absent. Ecologists arebegin- A second approach to solving reserve selection prob-ning to quantify errors in predictions of species' occurrence lems involves the use of greedy-adding heuristics (Margules(Flather et al. 1997) and to use those errors to estimateprob- et al. 1988, Rebelo and Sieg_ed 1990, Vane-Wright et al.abilities of occurrence (Dean et al. 1997). Information on 1991, Bedward et al. 1992, Nicholls and Margules 1993,the likelihood of species presence and absence should not Pressey et al. 1993).Like the scoring and ranking methods,be ignored in the development of reserve selection models, greedy heuristics identify a prioritized sequence of sites for
We formulateda probabilistic reserve selectionmodel that reserve status. The first step is to select the best site in termsallowed the presence and absence of vegetation communities of the principal selection criterion(e.g., species richness).within potential reserve sites to be representedby probabilis- Next, the value of each remaining site is calculated, account-tic, rather than deterministic values, the COMPRESmodel ing for the species already represented. The site that best(Coveting Model for Probabilistic Reserve Selection). We supplements the species represented in previously selectedfocused on vegetation communities rather than species be- sites is added to the solution. This re-calculation and selec-cause protecting examples of a wide array of vegetation tion continues until an appropriate resource constraint (e.g.,communities should conserve most species, biotic interac- total cost) or a stopping rule (e.g., all species of concerntions, and ecological processes (Faber-Langendoen 1996). are represented) is met. In contrast to scoring and rankingThe model can also be applied to representation of species methods, greedy heuristics avoid redundancy or omissionsor other elements of biodiversity. The model was formu- of representation by accounting for species represented inlated as a 0/1 integer optimization problem that maximized previously selected sites and the species still in need of rep-the number Ofrepresented communities subject to a budget resentation. The principal drawback of greedy heuristics isconstraint, where a community was considered represented that they do not guarantee optimal solutions (e.g., findingif its probability of occurrence in the set of selected reserve the maximum number of species that can be represented by
' siteswasgreater than a specifiedminimum reliability thresh- a specified number of sites or finding the smallestnumber ofold, This threshold represented the degree of risk aversion sites sufficientto represent all of the species or ecosystemson the part of the decision maker. Although our formula- of concern), and there is no way to determine the degreetion was nonlinear,a logarithmictransformationallowed us of suboptimality(Underhill 1994). Work is continuinginto representthe problemin an analogous,linearformatthat the developmentof more sophisticatedheuristics,includingcouldbe solved using exact optimizationmethods.The ap- simulated annealingand genetic algorithms(Pressey et al.preachwas illustratedwitha researchnaturalareaselection 1996), that may providea betterapproximationof the op-problemon the SuperiorNational Forestin Minnesota. timal solution.As withthe scoringmethods,greedy-adding
heuristicshave the advantageof being able to rapidlygen-eratefeasible solutions.
1. LITERATUREREVIEW A third approach involves integer optimization models
Thereserve selection problem has been examined by re- that can be solved to optimalityusing conventionallinear.. .searchersin a numberof disciplines. Althougha variety of programming and branch and bound algorithms (Cocks
ecological or biological protection goals can be specified and Baird 1989; Saetersdal et al. 1993; Camm et al. 1996;(Pressey et al. 1993), two reserve selection problems are Church et al. 1996; Davis and Stoms 1996; Willis et al.commonly addressed in the conservation biology literature: 1996; Williams and ReVelle 1996, 1997, 1998; Snydermaximize the number of species that can be represented et al. 1999). Church et al. (1996) pointed out that the twowithin a specified number of sites, or identify the small- reserve selection problems commonly addressed in the con-est numbei"of sites sufficient to represent all the species of servation biology literature are applications or modificationsconcern, of two classic formulations from the location science liter-
The first quantitative methods developed to solve the ature: the maximal covering location problem (Church andreserve selection problem were straightforward scoring and ReVelle 1974), which maximizes the number of entities orranking procedures based upon metrics such as reserve amount of demand that could be covered or represented bysize or species richness (e.g., Ki'rkpatrick1983, Margules a specified number of facilities and the location set cover-et al. 1988, Cocks and Baird 1989). Sites are selected for ing problem (Toregas and ReVelle 1973), which minimizesprotection in a sequential fashion, based upon score, until a the number of facilities necessary to cover or represent allresource constraint, such as cost or area, is reached (e.g., demand nodes. Both of these formulations are amenable toMargules and Usher 1981, Terborgh and Winter 1983, integer optimization, an approach which guarantees optimalPressey and Nicholls 1989). A significant drawback of this mathematical solutions. Optimization differs from scoringapproach is that sites are scored and selected independently and heuristics approaches by identifying and evaluating en-of the composition of previously ranked sites. As a re- tire sets of sites according to the selection criteria,rathersuit, Strictlychoosing the highest ranked sites may lead to than sequentially selecting sites based on the characteristics
HAIGHT, REVELLE, AND SNYDER / 699
of the sites chosen in previous iterations. Furthermore, in was considered r_n'esented if its probability of occurrencecontrast to scoring and heuristic approaches, the solutions in the selected set of sites was at least as large as the spec-derived from optimization models are in no way depen- ified minimum reliability level (e.g., 95%). The followingdent on or sensitive to Starting conditions or order of site notation was utilized in the model:
selection. However, this approach to reserve selection is i,I index and set of communitiesnotwithoutits drawbacks.Integeroptimizationformulations j,J index and set of potentialreservesitescan be difficultto solve to optimality,proving intractablein T upper bound on reservenetworkareasome cases for moderatelysized reserve selection formula- Aj areaof site jtions (Pressey et al. 1996). P/j probabilitythatcommunityi is presentin site j
Throughthe progressionof the developmentof the so- • i thresholdreliabilitylevel for communityiI lution techniques outlined above, the reserve selection Ni set of sites that may contain (have a nonzero proba-
problem has been approached and solved with greater de- bility) community igrees of solution accuracy and efficiency. A next logical Xj {1/0variable; 1if site j is selectedfor inclusionin thestep in the development of more realistic reserve selection reserve network, and 0 otherwise)formulations is to address the issue of incomplete and un- Yi {1/0 variable; 1if the probability that community i iscertain data. Polasky et al. (2000) were the first to address represented by the selected set of sites is at least _,the issue of a probabilistic reserve site selection formula- and 0 otherwise)tion. They developed a model to maximize the expectednumber of species represented in a reserve network when The model was formulatedas follows:
the presence of species at potential reserve sites was rep- Maximize Z- _ Yi, (1)resentedas a probability, rather than a known value of 1 i_(present) or 0 (absent). A greedy-adding heuristic and avariant of the greedy-adding heuristic, e.g., an "expected subject to"
greedy algorithm," were developed and utilized to solve _ AgXj_<T, (2)the problem. Solutions derived from this probabilisticfor- j_j
' mulation were.compared to solutions from a deterministic
formulation when the probabilistic data were transformed 1"-[(1-P/y)Xj _<( 1-_i )Y' Vi_ I, (3)into presence-absencedata. That is, all probabilitiesgreater y_N,
than or equal to a specified value (e.g., 0.6) were set to Xj, Yi _ {0, 1) Vi_I, Vj _J. (4)a value of 1.0, and all probabilities less than this wereset to a value of 0.0. As one would assume, the authors The objective (1) maximized the number of communitiesfound that transforming the probabilistic data into presence- whose probability of occurrence, based on the selected set ofabsence data and solving the respective reserve selection sites, exceeded the specified reliability level. The first con-formulations changed the set of sites that would be chosen straint (2) ensured that the total area of the selected set ofand the expected number of species represented. The au- sites did not exceed T, the upperbound on network area.Thethors also found that the expected number of represented second set of constraints (3) defined the conditions underspecies was lower initially than the number represented which communities were considered represented. This con-
in a reserve network using transformed presence-absence straint stipulated that for any community i to be considereddata. However, theexpected value of an additional site represented,the probability of its absence _j_N,(1-P/j)'_
, was generally higher than it was with presence-absence from the selected set of sites had to be less than the speci-data. The model suggested that there is value in selecting fled risk threshold level of absence (1-0q). Thus, if themultiple sites in which a species has some possibility of specified threshold reliability level for a community's pres-being presentto ensure some chance that the species is ac- ence was 95%, the probability that the community was nottuatly represented in the network. Building upon the work present in the selected set of sites had to be no greater thanof Polasky et al. (2000), as well as the many deterministic 5%. If _j_N,(1-P/j)'_ >(1--tZi), then the corresponding Y/reserve selection formulations, we developed a specifica- in Equation (3) had to equal zero, indicating that the se-tion of the probabilistic reserve selection problem that takes lected sites did not represent community i with the required
into acc0untthe risk tolerance of the decision maker. Fur- probability. If I-[jeN,(1-P_j_ _<(1-_), then Y_- 1, indi-thermore, our 0/1 optimization formulation can be solved caring that community i was represented with the requiredusing exact optimization methods guaranteeing optimal probability. The last set of constraints (4) defined the inte-solutions, ger requirements for the decision variables.
Restating the nonlinear constraint in linear form facili-2. MODELDESCRIPTION tated a solution with exact optimization methods.This was
accomplishedby transformingEquation(3) to anequivalentA O-1integer optimizationmodel was formulatedto select linearset of equationswith a log transform:
. the network of sites thatmaximized the numberof vegeta-
tion communities represented,subjectto an upperboundon _ Xj In(1--P/j ) _ ri In(1-_i) ViEI. (5)the total areaof the reserve network. Again, a community jEN,

700 / HAI GHT , REVELLE, AND SNYDER
Because we Were dealing with probabilities, the logarithms that certain, perhaps priority or threatened, communities arcin both sides of Equation (5)were always negative values, represented in the set of selected sites at some specifiedThis allowed us to multiply through by (- 1) and switch the reliability level. To enforce this condition, the followingdirection of the inequality: constraint set was added to the base formulation:
_-'_Xj In(I-P/j) ( )y/_jeN, 1-- H(1-P/j)xj >_fli ViEM, (7)
ln(1 "_i) Vi El. (6) jEN,
If the probability of absence of a community i was greater where M is the set of identified priority communities, andthan the specified absence threshold (1 - _i), then the fli is the minimum required reliability for each priority com-
quotient in Constraint (6) would be less than one, forcing munity i. With this constraint set, the probability of pros-the corresponding Yi variable to be equal to zero, due to the ence of each priority community must exceed the specifiedintegrality restrictions on the variable. Solving the reserve reliability level fli. These constraints supplemented the cor-
selection problem with Equation (6_, the linear equivalent responding constraints in Equation (6), rather than replacedof Equation (3), enforced the same condition as that speci- them. Again, just as with Equation (3), log transformationfled in (3"). It is important to note that the manner in which and algebraic manipulation were needed to state this set of
constraint (6) was defined allowed a linear representation of nonlinear constraints as an analogous set of linear ones. Thewhat was inherently a nonlinear relationship, and as such, following, analogous constraint set was created by subtract-allowed this formulation to be solved as a linear, integer ing 1 from both sides, multiplying through by (-l) andformulation with conventional solution methods, such as taking the log of both sides:the-simplex method in conjunction with the branch-and-
bound algorithm. Without this transformation, this proba- _-_Xj ln(1 -P/j)_< ln(1 -fli) Vi EM. (8)bilistic formulation would have required heuristic solution jENi
methods, which could not guarantee optimal solutions. In this format, each constraint required the probability ofThe form of our probabilistic representation constraint (3) absence of a priority community i to be less than or equal to
. evolved from an idea in ReVelle and Hogan (1988, 1989) specified threshold level of absence (1 - fli). Equation (8)for the Maximum Availability Location problem. Those was added to the base formulation and the problem re-solvedauthors suggested that the probability of a vehicle being to generate an additional trade-off curve. This modified for-available to serve a demand region within a given time stan- mulation still maximized the number of communities repre-dard could be computed as one minus the product of the sented by the minimum reliability level _i, while ensuringbusy fractions of vehicles positioned in the region, where that a set of priority community was represented by a highereach busy fraction had a 0-1 exponent representing the vehi- reliability level, fli.cle placement variable. The left-hand side of our represen-tation constraints (3), which computes the probability thata community is absent from the selected sites, is analogous 3. APPLICATION
to the computation of the probability of vehicle availabil- 3.1. Problem Settingity. our contribution was the formulation of the right-handside of constraint (3), in which the representation variable We used the model to address a research natural area (RNA)
selection problem on the Superior National Forest, whichY could equal one 0nly if the probability of community ab-sence was less than the required threshold. This constraint is the largest national forest in the eastern United Statesstructure has not been utilized in the literature of reserve site and covers over 2.1 million acres in northeastern Minnesota
selection, nor to our knowledge has it been utilized in the (Figure 1) (USDA 1986). The goal of the RNA selectionmore general location literature, problem was to select a network of sites for protection that
maximized the number of plant community types consideredTo demonstrate the model, we generated trade-off curvesrepresented by the specified level of reliability.comparing the maximum number of communities repre-
sented given a limited total network acreage and a specified The analysis was conducted using 33 potential RNAs.•threshold reliability level. By varying the threshold reliabil- The 33 sites were part of a larger set of sites that had been
identified using high-altitude aerial photography, as havingity level and re-solving the problem for different levels of T,the "costs," in terms of the number of communities consid- potential to be high-quality examples of some of the eco-ered represented, were evaluated for different levels of risk systems found on the Superior National Forest (Vora 1997).aversion. A rapid assessment using aerial and ground surveys of these
33 sites was conducted in 1997 to map boundaries and in-ventory plant communities of the sites (Anderson 1997).
Ensuring Representation of Priority Communities The 33 sites were selected from the larger set because siteIn the base model above, the objective was to maximize the boundaries had been mapped and partial inventories of plant
. number of communities considered represented without re- communities had been conducted by the time of our studyquiring representation of any given communities. Situations (Figure 2). The sites ranged in size from 600 to 19,000 acresmay arise, however , when a manager may want to ensure and covered a total of 126,000 acres (Table 1). The use of

HAmrrr, REVELLE, AND SNYDER / 701
Figure .1. Location of the Superior National Forest these 33 potential RNAs does not imply that other sites do(shaded area), not merit further study as RNA candidates on the Superior
National Forest. Furthermore, the analyses conducted with
this data set were done to illustrate a methodological ap-0 KM 300
proach and do not imply or endorse any policy implications.0 u_ 20o Community types were defined using a combination of
Canada land and vegetation classes. Land classes were the subsec-
.._ tion level of the National Hierarchy for Ecological Units, aq¢ _Y system of mapped land units used in national forest plan-
ning (McNab and Avers 1994, Keys et al. 1995). A sub-Minnesota section is a unit of land distinguished by similar climatic
_ regimes, geologic structure, and other physio-graphic char-acteristics coveting thousands of square miles. Five subsec-
Wisconsin tions are present in the Superior National Forest, shown by
" Michigan the shaded areas in Figure 2. Vegetation classes were de-fined using the alliance level of The Nature Conservancy's(TNC) National Vegetation Classification hierarchy (Faber-Langendoen 1996). An alliance is a unit of vegetation dis-tinguished by the plants in the uppermost canopy or layerof vegetation. Twenty-five different alliances were knownto be present in one or more of the 33 potential RNAs. Al-liance names are listed in the left-hand column of Table 2.
Figure 2.- Ecological subsections and potential research natural areas of the Superior National Forest. (Lightly shadedareas with alphanumeric labels represent subsections.)
• .
• +}¢
1 PotentialResearchNaturalAreas
/_ SuperiorNationalForestboundary
0 20 40 Kilometers

702 / HAIGHT,REVELLE, AND SNYDER•
Table 1.. Potential research natural areas on the Superior allowed us to set 17% of these 825 elements equal to one.National Forest. Because we did not have means to assign the probabilities
of the presence of other community types in each site, wePotential RNA - Subsection Area (acres)arbitrarily set 33% of the 825 elements equal to probabili-
CascadeLake 212La 16,956 ties drawn from a uniform distribution on the range of 0 to
Locket Lake 791 1. The remaining elements were assumed to be zero. EachLullabyCreek 664 site had 8 to 15 nonzero probabilities, of which 6 to 11 wereRice Chain 3,886Trout Lake 1,657 randomly generated. For illustration, partial vectors ofprob-Barker.Lake 212Lb 4,311 abilities for two sites within the same subsection are shownBeaver Ri'ver 1,259 in Table 2.Cabin Creek 9,719Fall River Fen 1,039HeartbreakCreek 2,545Lillian Creek South . 3,434Lutsen Addition 2,061 Table 2. List of eligible community types and partialPearl Lake 4,040 vectors of probabilities for two sites within theSchroeder ,_,ddition 3,495 same subsection.South Brule River 1,573Watertank Lake 2,709 RNAsCandle Lake 212Le 1,872 Matrix Plant Communities 1 2Deepwater Lake 2,209Loka Lake 4,079 Jack Pine Forest Alliance 0.181 0.000PikeMountain 896 Red Pine Forest Alliance 0.459 0.000Rice Lakes 1,786 White Pine-(Red Pine)-Quaking Aspen 0.917 1.000Slow Creek- 2,804 Forest AllianceWatercress Lake 2,594 White Pine Forest Alliance 0.037 0.000
- Wyrme Creek " 3,196 White Spruce-Balsam Fir-Quaking Aspen 1.000 0.000Sullivan Creek 212Ld 4,032 Forest Alliance
. Wolf Lake . 1,470 Sugar Maple-Yellow Birch-(Amefiean Beech) 1.000 0.626Big Lake_7 Beavers 212Le 18,578 Forest AllianceDragon Lake 3,778 Quaking Aspen-Paper Birch Forest Alliance 0.897 0.000Dunka 1,947Little Isabella River 1,098 Large Patch Plant Communities
South Greenwood Creek 2,596 Black Spruce Forest Alliance 0.000 0.706Timber-Frear 10,883 Eastern White Cedar-Yellow Birch Forest 0.521 0.454White Pine Picnic 2,124 Alliance
Eastern White Cedar Forest Alliance 0.836 0.000Red Oak-Sugar Maple-(White Oak) Forest 0.000 0.000
Alliance
Combining the 25 alliances with the 5 subsections, we Paper Birch Forest Alliance 0.748 0.000obtained 125 community types in need of representation, Black Spruce Saturated Forest Alliance 1.000 1.000assuming each of the alliances could be present within each Eastern White Cedar Saturated Forest 1.000 1.000• Alliance
' Of the five subsections. Black Ash-Red Maple Saturated Forest 0.000 0.000Because of limited resources, only a portion of each of Alliance
the 33 potential RNA sites was surveyed for plant commu- Black Spruce Saturated Woodland Alliance 0.000 0.366nity types. This partial survey verified the presence of a total Speckled Alder Seasonally Flooded Shrubland 0.000 1.000of 63 community types across the set of 33 sites. In addi- AllianceLeatherleaf Saturated Dwarf-Shrubland 0.000 0.000tion to the plant communities in the portion of each site that Alliancewas field'surveyed, each site could include additional corn- Cattail-(Bulrush) Semipermanently Flooded 0.948 0.000munities that were not encountered. This uncertainty about Herbaceousthe preseneeof community types was the motivation for our Few-Seeded, Wiregrass Sedge Saturated 0.000 0.824model. Herbaceous
• Rock Outcrop/ButteSparse Vegetation 0.000 0.000To demonstrate the model, we constructed a matrix of
probabilities for the presence of community types in sites to Small Patch Plant Communitiessupplement the verified community data. With 125 eommu- Bog Birch---(Willow) Saturated Shrubland 0.814 0.000nity types and 33 eligible sites, the presence-absence matrix Allianceconsisted of 4,125 elements. Because each site was eligible Sedge (C. rostrata, utieulata) Seasonally 0.000 0.304only to be located in one subsection, each site could cover Flooded Herbaceousa maximum of 25 different community types. Therefore, a Open Bluff/Cliff Sparse Vegetation 0.633 0.829
. maximum of 20% (825) of the elements of the probabil- Cobble/Gravel Shore Sparse Vegetation 0.000 0.000
ity matrix could be nonzero. The results of the field survey 0.457 is the probabilitythat the community type i is present withindocumenting the presence of community types in each site site j (Po)"
an
HHAIGHT, REVELLE) AND SNYDER / 703 m
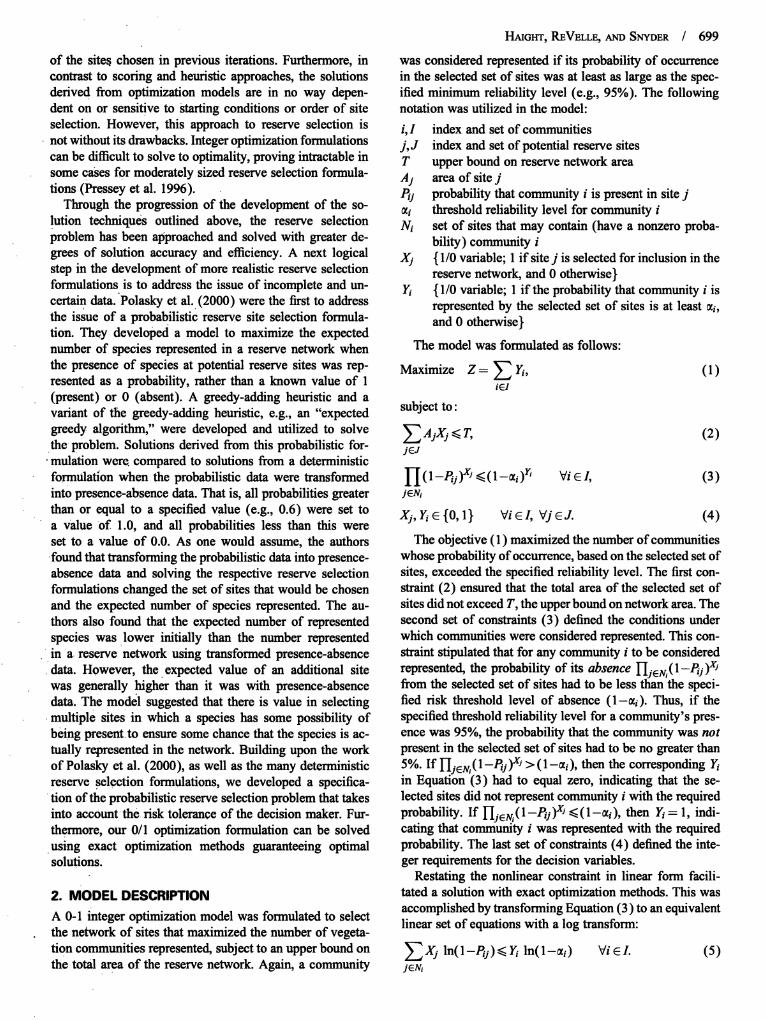
3.2. Trade-Off Analysis Figure 3. Trade-offcurves for differinglevels of mini- iDa
To analyzethe effects of imposing an upper bound on net- mum reliability. IIwork area,we used the optimizationmodel (Equations(1) ,2o Pthrough (4)) to compute a trade-offcurve with _i = 1 for .1,,oall i so that representationrequiredcertainty of occurrence.The trade-offsbetween the numberof communities consid- _ ,0o i
ered to be represented with 100% reliability and network _ 8o ._ . .area were Obtainedby decreasing the upper bound on net- 8 • • . ._
• _ 70 • • •
work area,in increments of 1,000 acres fromthe maximum i 60 At O .... Cam ... ee'e-of 126,000 acres, and re-solving the optimization problem. _ so
!If the decision maker was willing to gamble that more ,o "h_4.._communities couldbe representedby a differentnetworkof s 3oa given size, then the optimization model could be solved _o _ '_lusing a lower threshold reliability level for representation. ,o
We examinedthe effectof reducedrisk aversionby lowering ,_go ,0o_o0 _ _oo _o00 2oooo othe threshold reliability le_,el (applieduniformly acrossthe ,,0o0o _.-_community types) to 95% and recomputing the trade-offcurve.
A separate set of runs was conducted with the extended time, than the primal revised simplex in conjunction withformulation to evaluate the trade-offs when representation, the branch-and-bound algorithm in preliminary trials.at a high reliability level, was required for certain prioritycommunities. To illustrate this, five alliances in the 212Lbsubsectionwere identifiedas prioritycommunitiesand were 4. RESULTSrequiredto haverepresentationwithatleastthe95%reliabil-ity level (fli = 0.95), while the remainingcommunity types 4.1. Trade-Offs Between Communityrequired.an80% level of reliabilityto be consideredrepre- Representation and Network Areasented. Note, this approach is differentfromsettingmultiple The bottomcurve in Figure3 shows the trade-offsbetweenlevels of _ in the base formulationin which a higher g_sim- maximum number of communities considered representedply specifies that you want to be morecertainthat a commu- with certainty fordecreasingupperboundson network area.nity is present before you consider it represented,not that Each point on the curve represents a unique network ofyou must representit at a higher reliabilitylevel. Again, the RNAs. The flat portion of the curve between points A andvalue of T, maximum networkarea, was incrementallyvar- B shows that a maximum of 64 of the 125 communitiesied and the problem re-solved to produceanother trade-off (51%) could be representedwith certainty. Further, thesecurve between network area and the numberof communi- 64 communities could be representedby differentnetworksties considered represented with 80% reliability, given that covering a wide range of areas. If all 33 potential RNAs werepriority communities must be present with a reliability of selected, the protected network would cover 126,000 acres95% for representation. (Point A, Figure 3). Because many communities were found
• in morethan one site, the model was able to select a smaller
3.3. Software set of sites without reducing representation.For example,Point B (Figure 3) representedall 64 communities with 21
The model was solved on an IBM300PL personal corn- sites, coveting 87,000 acres--a 31% decrease in networkputer using the integrated solution package GAMS/OSL area. Additional networks can be found between points A2.25 (GA_MSDevelopment Corporation1990), which was and B on the trade-offcurve, all providing representation ofdesigned for large and complex linear and mixed integer 64 communities.programming problems. Input files were created using We found that the upper bound on network area couldGAMS (General Algebraic Modeling System), a pro- be decreased without great reductions in community rep-gram designed to generate data files in a format that resentation. For example, with an upper bound of 41,000standard optimization packages can read and process, acres_a 67%reductionin networkarea from the maximumThe model was solved using the Primal-Dual Predictor- of 126,000 acres_59 communities were considered repre-Corrector Barrier Interior point algorithm as the LP sented with certainty (Point C, Figure 3), an 8% reductionsolver, in conjunction with the branch-and-bound al- in representation from the maximum of 64 communities.gorithm for integer-variable problems. Both of these With an upper bound of 33,000 acres_a 74%reduction insolution algorithms were part of IBM's OSL (Opti- network area from Point A (Figure 3)_87.5% ofthe com-mization Subroutine Library), a FORTRAN-based munities were still represented with certainty. The declinesubroutine library designed to solve optimization problems, in the number of communities represented was more pro-The interior point solution algorithm was chosen because nounced as the upper bound on network area dropped belowit proved considerably more efficient, in terms of solution 30,000 acres.
704 / HA]GHT,I_V_LLE,ANDSNYDER
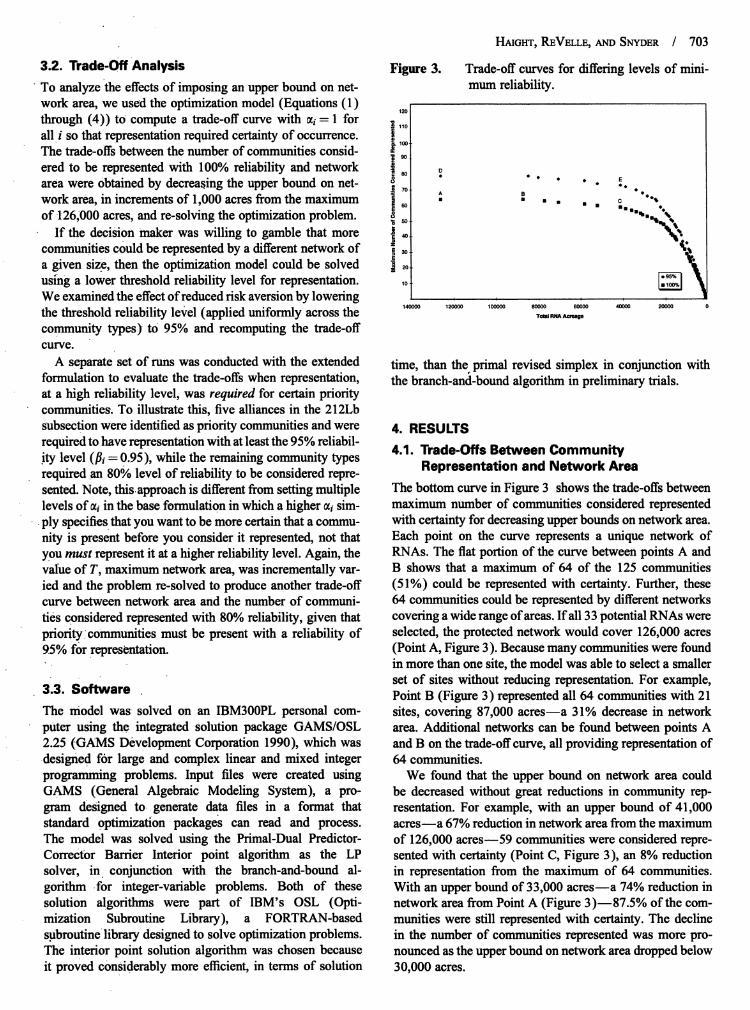
Lowering the thresholdreliabilitylevel to 95%increased Figure 4. Maximum number of communities repre-.the numberof communities that were considered repre- sented under differentlevels of reliabilitysented under each areaupper bound (top curve, Figure 3). whentotal networkareawas 41,000 acres.A maximumof 79 of the 125communities(63%) couldberepresentedWith
reliability(PointD, Figure3). ,_o]at least 95%
Community representationremained high for substantial ,,0 .... .reductionsin the upper bound on network area.As an ex- _':] . . . "ample, when this upper bound was 41,000 acres, a 67% |_o . .. • -" "reductionnetworkareafrom themaximum of 126,000 acres __0..o""(Point E, Figure 3), 73 communities were representedwith {60*95% reliabilityman 8% reduction in representationfrom _5othe maximum of 79 communities, i :i
Comparingthe optimal solutions fora.givenupperbound _2oon network area highlights the trade-offsassociated with the _ ,odifferentreliability thresholds.With an area upper bound 0Ioo 9o 8o 70 60 50 40 30 20 10 0
of 41,000 acres, the optimal solution associated with the __')100%reliability threshold(Point C, Figure 3) was a net-
work of !8 sites that included59 communitiesrepresented would be wise to evaluate the solution networks derivedwithcertainty,and9 communitiesrepresentedwithreliabil-
fromthe optimizationmodelat severalreliabilitythresholdsity between 95%and 99%.Althoughthese latternine com-in this range. Backing off slightly from the highest relia-munities were present withrelatively high reliability,they
were not factoredinto the objective function,nor did they bility scenariomight allow the decision makerto identifyand select networksthat may contain a greaternumberofinfluence the selection of the corresponding reserve sites
• communities consideredto be representedor to bettermeetbecause they did not meet the specified reliability thresh-old. The optimal solution associated with the 95% reliabil- additional, unmodeled criteria (e.g., political factors).ity threshold (Point E, Figure 3) was a different network
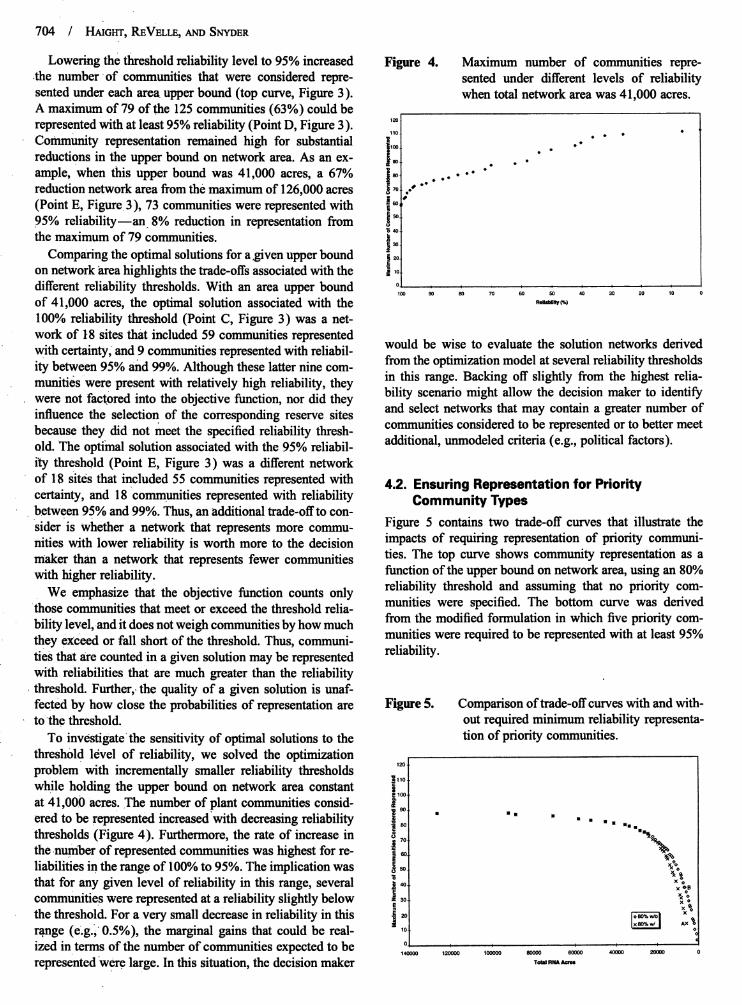
of 18 Sitesthat included 55 communities representedwith 4.2. Ensuring Representation for Prioritycertainty, and 18 communities representedwith reliability Community Typesbetween 95%and 99%.Thus, an additional trade-offto con-Sider is whether a network that represents more commu- Figure 5 contains two trade-off curves that illustrate thenities with lower reliability is worth more to the decision impacts of requiring representation of priority communi-maker than a network that represents fewer communities ties. The top curve shows community representation as awith higher reliability, function of the upper bound on network area, using an 80%
We emphasize that the objective function counts only reliability threshold and assuming that no priority corn-those communities that meet or exceed the threshold relia- munities were specified. The bottom curve was derived
from the modified formulation in which five priority com-bility level,and it does not weigh communities by how muchmunities were required to be represented with at least 95%they exceed or fall short of the threshold. Thus, communi-
ties that are counted in a given solution may be represented reliability.with reliabilities that aremuch greaterthan the reliabilitythreshold. Further,.the quality of a given solution is unaf-fected by how close the probabilities of representation are Figure 5. Comparison of trade-offcurves with and with-tothe threshold, out required minimum reliability representa-
To investigate the sensitivity of optimal solutions to the tion of priority communities.threshold level of reliability, we solved the optimizationproblem with incrementally smaller reliability thresholds ,_o
:_110.
while holding the upper bound on network area constant_1oo.
at 41,000 acres. The numberof plant communities consid- _-
eredto be represented increased'withdecreasingreliability _o|,o . .. . . . .. ..-.thresholds (Figure 4). Furthermore, the rate of increase in _ ,o. "_
the number of representedcommunities was highest forre- !6o __oliabilities in the rangeof 100%to 95%.The implicationwas _50 _:_that for any given level of reliabilityin this range, several _ ,o
|x %B
communities were representedata reliabilityslightly below =3o _°x o
the threshold. For a very small decrease in reliabilityin this _ _o io_..,ol xoIxeO_w/I kxrange (e.g.i 0.5%), the marginal gains that could be real- ,oized in terms of the number of communities expected to be o .......140000 120000 100000 80000 60000 40000 20000 0
representedwere large. In this situation, the decision maker ,0_--,..
HAIGHT, REVELLE, AND SNYDER / 705
A comparison of these two trade-off curves allowed the information about community presence is obtained from site•impacts associated with priority representation at one level surveys and maps of vegetation and land-use patterns (e.g.,of reliability to be assessed in terms of the total number of Lombard et al. 1997, Snyder et al. 1999). For objectivescommunities that could be represented with a lower level involving species representation, information about speciesof reliability. Priority community constraints influence the presence is obtained from species distribution maps; whensolution only when the upper bound on total network area is basic distribution data are lacking, predictions are madeless than 24,000 acres. Above this upper bound, the solutions based on habitat associations (e.g., Flather ct al. 1997).were identical, indicating that the five priority communities Most reserve selection models ignore errors in the inputwould be represented with at least 95% reliability without data. For example, our deterministic model (Snyder et al.theexplicit requirement. Below this acreage threshold, trade- 1999) failed to recognize that surveys of plant communi-offs were significant, and careful thought should be given ties in many of the potential RNAs were incomplete. As ato the importance of representing these priority communi- result, communities that we assumed to be absent becauseties. For example, Point A (Figure 5) represented a network they were not encountered might actually be present (errorsof 5800 acres, the smallest network sufficient to represent of omission). In other cases, errors occur when species orat least the five priority communities at the 95% reliability communities are assumed to be present based on distribu-level, This network represented a total of 14 communities: tion maps but are actually absent (errors of commission).the 5 with at least 95% reliability and the remaining 9 with Accuracy assessments of species distribution maps showatleast 80% reliability. An alternate network with this same that error rates vary widely among species and reach 50%acreage (Point B, Figure 5) represented 35 total communi- of the numbers of species predicted or observed (Flatherties with at least 80% reliability, but it did not enforce rep- et al. 1997)..resentation of the five priority communities. Therefore, to Our COMPRES model is among the first to account forbe certain that the five communities were represented with errors in reserve selection input data, and our applicationa high reliability, the decision maker must reduce the total demonstrated that RNA siting can be sensitive to errors ofnumber of communities that can be represented with at least omission. For example, if the decision maker was willing to80% reliability, accept a lower level of reliability of community representa-
• tion, then a set of reservescould be selected that potentiallyinclude a larger number of communities for a given upper
5. RESERVESELECTION MODELS IN PRACTICE boundontotalRNA area.This informationis importantbe-
To date, reserveselection models utilized inpractice assume cause it quantifiesthe impacts of differentlevels of risk as-that information about species or community presence in sumed by the decision maker. Furthermore, the results couldpotential reserves is known with certainty. For example, in help identify where to focus additional site surveys.COnsultationwith U.S. Forest Service planners, we used a While our COMPRES model accounts for errors in thedeterministic version of our model to address three basic input data, its applicationrequires estimationof the proba-questions (Snyder et al. 1999): bilities, or subjective probabilities, of species and commu-
nity presence. (Refer to Von Winterfeldt and W. Edwards1. What is the minimum area of RNAs required to repre- 1986 for a general description of elicitation of subjective
sent all the plant communities known to exist in the Superior probabilities.) One approach to eliciting subjective proba-National Forest? bilities is to obtain expert opinions about the likelihoods of
2. How sensitive is the sitingof RNAs to the way in which community presence based on aerial photography, physicalplant communities are defined? characteristics of the RNAs such as soil type and moisture
3. How do requiren_entsto protect priority plant commu- regime, and information about the co-occurrence of commu-nities affect RNA siting? nity types and rareness. For example,community presence in
In addition, we provided cost curves showing the a given RNA could be categorized as either likely, unlikely,trade-offs 'between the maximum number of plant com- or not at all likely. These responses could then be translatedmunities represented and total area of the selected set into subjective probabilities such as 0.6 for likely, 0.2 forof RNAs," and we estimated the costs of various con- unlikely, and 0.0 for or not at all likely. Another approachstraints on the number, size, and location of RNAs. is to obtain a plant community distribution map and cal-The planners used this information to propose alterna- culate errors of omission and commission based on groundtive sets of RNAs to include in comprehensive land use surveys. The map and error information could then be trans-plans. Similar published accounts of the application of re- lated into probabilities of community occurrence. We areserve selection models in land use planning include the pursuing both of these approaches in cooperation with U.S.construction of potential reserve systems in the Sierra Forest Service planners.Nevada region of California (Davis et al. 1996) and the Our application of the COMPRES model suggests thatAgulhas Plain in South Africa (Lombard et al. 1997). problems with up to 33 sites can be readily solved using
Reserve selection models utilize various kinds of data, exact solution methods. This scale of analysis is typical of'depending on model specifications and objectives. When RNA site selection problems in national forests. For ourthe objective involves plant community representation, data set, average solution times were 4.65 and 12.8 minutes

706 / HAIGHT,REVELLE, ANDSNYDER
for the 80% and 95% reliability curves, respectively. Av- candidate reserve sites be known with certainty. However,erage solution time for the modified formulation,requiting in real-worldplanning situations, complete information ispriority representation, was 2.2 minutes_less than half rareand is often prohibitivelyexpensive to obtain. The abil-the averagesolution time for the correspondingbase formu- ity to consider and include probabilisticdata adds a muchlation without requiredrepresentation.Run times of these needed element of realism to reserveselection planning.lengths would allow the COMPRESmodel to be used as a We developed a 0/1 integer optimization model thatreal-time decision tool. Although our application did solve incorporatedprobabilistic data and could be solved us-well computationally, it is possible that larger data sets ing exact optimization methods. Although the formulationcould requireprohibitivelylong solution times. As problem was nonlinear, we were able to convert it to an analogoussize increases, eitherin termsof the numberof communities linear statement using a log transformation.This transfer-in need of represen_tion or of the number of communi- mation allowed us to solve the model using conventionalties for which a probabilistic presence value is needed, optimization sothvare and obtain optimal solutions. Wesolution times may become larger than practical. Integer demonstrated the model by generating trade-off curvesprogramsare, in general, a very difficult class of problems showing the impacts of changing both the maximum net-to solve to optimality, and the threshold constraintutilized work area and minimum thresholdreliability level on thein this,model would not be considered "integer friendly," maximum numberof communities that couldbe consideredor likely to produce integer-valued variables without a cer- represented. These trade-offs provide the decision makertain amount of branch-and-bound(ReVel!e 1993). Thus, with valuable information on the impacts associated withour formulationmay not be tractableforexact optimization differentbounds on total RNA area and different levels ofmethods when applied to larger problems. In that case, a risk aversion.heuristicwould be required,and our model could be used While the obviousapplicationof this model is to naturalto assess the accuracyof a heuristic, reservesite selectionproblemswhenspecies informationis
•Decision makersinvolved in naturereserveselection can uncertain,themodel mayhave applicabilityorextensionstobe influencedby ecological considerationsthatwe did not otherprobabilisticproblemsettings. Onesuchareacouldbeconsider.For example, in our application,we assumedthat in the siting of detectiondevices, underbudgetlimitations,
communitywas adequatelyrepresentedif its probability to maximizethe numberof"violations" or occurrencesde-of occurrencemet a specifiedreliabilitylevel, regardlessof tected.One example mightbe siting groundwaterpollutionthearea, quality, or health of the representedcommunity, detectiondevices whenonehas probabilisticinformationonA communitycould satisfy the reliabilityconstraintwhile where plumes might be located or the direction in whichOccupyingonly a small amount of land that may not, in they aremoving. Additionally,one could use this modelingfact, be adequateto maintaina viable community. In real- approachto locate or dispatchpolice squad cars to maxi-ity, constraintsmay needto requireaminimumqualitylevel mize the numberof incidentsthat are detected or encoun-or amount of acreage_and further,contiguous acreage_ tered, utilizing historical data on crime rates to determinebefore a community was consideredrepresented.Although probabilitiesof crimesoccurring in certain neighborhoods.progresshas been made in the formulationand solution of Providingland managers with quantitative decision toolsdeterministicreserveselection problemsthat providebuffer to gain insight into complex resource allocation problemszonesar0und interioror core areas and promotecontiguity can enhance their ability to make informedand effectivede-and compactness (Williamsand ReVelle 1996, 1998), more cisions. The selection of naturalareas forprotectedshamsiswork is needed to account for errorsin inputdata in prob- rarelya simplematter,but ratheris full of conflict, compro-lems with spatial constraints.Otherconsiderations in RNA mise, and trade-offs.In this sense, optimization models offerselection includethe quality and successional status of plant a useful and powerful approach to such problems throughcommunities, disturbancessuch as fires or storms that al- their ability to generate and assess trade-offsand to deter°ter thestructure and composition of plant communities, and mine effects of policy parameters.The ability to account forclimatic changes that might affect the demography of pro- incomplete information in reserveselection is a step towardtected plants and animals. Whether or not these concerns addressinga more realisticplanning situation.can be adequately incorporatedin reserveselection modelsis an open question. Nevertheless,reserveselection modelsas currentlydesigned addresspractical questions, and re- ACKNOWLI:D(3MI:I_ITsuits arebeing usedin conjunctionwithotherecological and This research is supported by the North Central Re-political considerationsto advise decision makers, search Station. The authors thank Chel Anderson and
CarmenConverse of the Minnesota Departmentof Natu-ral Resources for providing field survey informationfor
6. CONCLUSION potential candidate Research Natural Areas in the Supe-We addressed the problem of incorporatingprobabilistic rior National Forest, Mark Nelson of the North Centraldata into a reserve selection optimization model. Most Research Station for assisting with site mapping, andreserve selection models formulatedto date require that Kristin Snow of The Nature Conservancy for providingthe presence-absence of species or communities within crosswalks between natural community classifications.
HAIGHT,REVELLE, ANDSNYDER / 707
They also gratefully acknowledge the insight and assis- of map unit tables). Atlanta, GA. (USDA, Forest Service,tance that Lucy Tyrrell, Regional RNA Coordinator, North presentation scale 1:3,500,000; colored.)
Central Research Station, provided for this research. Kirkpatrick, J. B. 1983. An iterative method for establishingpriorities for the selection of nature reserves: An examplefrom Tasmania. Biol. Conservation 25 127-134.
Lombard, A. T., R. M. Cowling, R. L. Prcssey, P. J. Mustart. 1997.REFERENCES Reserve selection in a species-rich and fragmented landscape
Anderson, C. E. 1997. Evaluation of Selected Potential Candidate on the Agulhas Plain, South Africa. Conservation Biol. 11
Research Natural Areas as Representative of Ecological 1101-1116.Landtype Associations on the Superior National Forest. Margulcs, C. R., A. O. Nicholls, R. L. Pressey. 1988. SelectingMinnesota Department of Natural Resources, Division of networks of reserves to maximize biological diversity. Biol.
Fish and Wildlife, Biological Report No. 58 (plus maps and Conservation 43 63-76.appendixes). , M. B. Usher. 1981. Criteria used in assessing wildlife
Ando, A., J. D. Camm, S. Polasky, A. R. Solow. 1998. Species conservation potential: A review. Biol. Conservation 21distributions, land values, and efficient conservation. Science 79-109.279 2126-2128. McNab, W. H., P. E. Avers, comps. 1994. Ecological subrcgions
Bcdward, M., R. L. Presscy, D. A. Kcith. 1992. A new approach for of the United States: Section descriptions. Administrativeselectingfully.representativereservenetworks:Addressing PublicationWO-WSA-5. U.S.Departmentof Agriculture,
efficiency,reservedesign,andlandsuitabilitywithanitcrative ForestService,Washington,DC.
analysis.Biol.Conservation62 I15-125. NichoUs,A. O., C. R. Margules.1993.An updatedreserve
Camm, J. D., S. Polasky, A. R. Solow, B. Csuti. 1996. A selection algorithm. Biological Conservation 64 165-169.note on optimal algorithrns for reserve site selection. Biol. Noss, R. F., A: Y. Cooperddcr. 1994. Saving Nature's Legacy.Conservation 78 353-355. Island Press, Washington, DC.
Church, R. L.; C. S. ReVelIc. 1974. The maximal covering location Pimm, S. L., J. H. Lawton. 1998. Planning for biodivcrsity. Scienceproblem. Papers in Regional Sci. 32 101-118. 279 2068-2069.
, D. M. Stores, F. W. Davis. 1996. Reserve selection as a Polasky, S., R. Ding, A. R. Solow, J. D. Camm, B. Csuti.maximal covering location problem. Biol. Conservation 76 2000. Choosing reserve networks with incomplete species
• 105-112. ' information. Biol. Conservation 94 1-10.
Cocks, K_D., I. A. Baird. 1989. Using mathematical programming Prcsscy, R. L., C. J. Humphrics, C. R. Margulcs, R. I. Vane-to address the multiple reserve selection problem: An example Wright, P. H. Williams. 1993. Beyond opportunism: Keyfrom the Eyrc Peninsula, South Australia. Biol. Conservation principles for systematic reserve selection. Trends Ecol. and49 113-130. Evolution 8 124-128.
Davis, F. W., D. Stores. 1996. A spatial analytical hierarchy for , A. O. Nicholls. 1989. Efficiency in conservation planning--Gap Analysis. J. M. Scott, T. H. Tear, F. Davis, cds. Gap Scoring versus itcrativc approaches. Biol. Conservation 50Analysis: A Landscape Approach to Biodiversity Planning. 199-218.American Society for Photogrammetry and Remote Sensing, , H. P. Possingham, J. R. Day. 1997. Effectiveness ofBethesda, MD, 15-24. alternative heuristic algorithms for identifying indicative
, R. L. Church, W. J. Okin, K. N. Johnson. minimum requirements for conservation reserves. Biol.1996. Selecting biodiversity management areas. In Sierra Conservation 80 207-219.
Nevada Ecosystem Project: Final Report to Congress. 1(58) _, , C. R. Margules. 1996. Optimality in reserve selectionUniversity of California at Davis, Centers for Water and algorithms: When does it matter and how much? Biol.Wildland Resources. Conservation 76 259-267.
, Dean, D. J., K. R. Wilson, C. H. Flather. 1997. Spatial Rebelo, A. G., W. R. Siegfried. 1990. Protection of fynboserror analysis of species richness for a gap analysis map. vegetation: Ideal and real world options. Biol. Con-Photogrammatic Engrg. Remote Sensing 63 1211-1217. servation 54 15-31.
Dobson, A. P-, J- P. Rodriguez, W. M. Roberts, D. S. Wilcove. ReVelle, C. S. 1993. Facility siting and integer friendly
i997. Geographic distribution of endangered species in the programming. Eur. J. Oper. Res. 65(2) 147-148.United States. Science 275 550-553. --, K. Hogan. 1988. A reliability constrained siting model with
Faber'Langendoen, D., ed. 1996. State Natural Heritage local estimates of busy fractions. Environ. Planning B15Program Ecologists. Terrestrial Vegetation of the Midwestern 143-152.united States. In International Classification of Ecological , . 1989. The maximum availability location problem.Communities: Terrestrial Vegetation of the United States. Trans. Sci. 23 192-200.The Nature Conservancy, Arlington, VA. Saetersdal, M., J. M. Line, H. J. B. Birks. 1993. How to maximize
Flather, C. H., K. R. Wilson, D. J. Dean, W. C. McComb. 1997. biological diversity in nature reserve selection: VascularIdentifying gaps in conservation networks: of indicators and plants and breeding birds in deciduous woodlands, westernuncertainty in geographic-based analyses. Ecological Appl. Norway. Biol. Conservation 66 131-138.
7 531-542. Snyder, S. A., L. E. TyrreU, R. G. Haight. 1999. An optimizationGAMS Development Corporation. 1990. General Algebraic approach to selecting research natural areas in national
Mode!ing System. Version 2.25.090. Washington, DC. forests. Forest Sci. 45(3) 458-469.
Keys, J., Jr., C. Carpenter, S. Hooks, F. Koenig, W. H. McNab, Tcrborgh, J. W., B. Winter. 1983. A method for siting parks andW. E. Russell, M. L. Smith. 1995. Ecological units of the reserves with special reference to Columbia and Ecuador.eastern united States--first approximation (map and booklet Biol. Conservation 27 45-58.

708 / HAmin:, REVELLE, AND SNYDER
Toregas, C.; C. S. ReVcll¢. 1973. Binary logic solutions to a class Unpublished report on file with the USDA Forest Service,of location problems. Geographical Anal. 5 145-155. North Central Forest Experiment Station, St. Paul, MN.
Undcr_ll, L. G. 1994. Optimal and suboptimal reserve s¢le,ction Williams, J. C., C. S. ReV¢lle. 1996. A 0-1 programming approachalgorithms. Biol. Conservation 70 85-87. to dclincating protected reserves. Environ. Planning B23
USDA Forest Service. 1986. Superior National Forest Land and 607-624.Resource Management Plan. Eastern Region, USDA Forest , . 1997. Applying mathematical programming toService. reserve selection. Environ. Model. Assessment 2 167-
Vane-Wright, R. I., C. J. Humphrics, P. H. Williams. 1991. 175.What to protcct?---Systematics and the agony of choice. Biol. --, --. 1998. Reserve assemblages of critical areas: A zero-
Conservation 55 235-254. one programming approach. Eur. J. Oper. Res. 104(3)Von Winterfcldt, D., W. Edwards. 1986. Decision Analysis 497-509.
and Behavioral Research. Cambridge University Press, Willis, C. K., A. T. Lombard, R. M. Cowling, B. J. Heydcnrych,
Cambridge, UK. C.J. Burgers. 1996. Reserve systems for limestone ¢ndcmicVora, R. S. 1997. Identification of potential natural areas, including flora of the Cape Lowland fynbos: Iterativc versus linear
representative ecosystems, on the Superior National Forest. programming techniques. Biol. Conservation 77 53-62.