an integrated 3d geodatabase for palladio’s work
TRANSCRIPT
An integrated 3D geodatabase for Palladio’s work
Fabrizio I. Apollonio1, Cristiana Corsi1, Marco Gaiani1, and Simone Baldissini2
1Università di Bologna Dept. DAPT Viale Risorgimento, 2 – 40136 Bologna, Italy [email protected]; [email protected], [email protected] 2CISAAP – Centro Internazionale di Studi di Architettura Andrea Palladio Contrà Porti, 11 - 36100 Vicenza, Italy [email protected]
Abstract The paper presents a novel digital 3D GIS web-based system entirely founded on Google Earth, built to
offer a deep insight into Palladio’s opera for restitution of its architectural surveys, reconstruction for
historical reasons, analysis for structural and other options, and assembly and presentation of all certified
Palladian documentation. The development of the application follows the philosophy of visual computing
and it is based on an architectural knowledge representation. The information system is conceived as a
typical Rich Internet Application and it is based on the digitalization of the complete Palladian corpus
documentation implemented by the Centro Internazionale di Studi di Architettura Andrea Palladio
(CISAAP). The 3D geodatabase system is, actually, in use at the Centro as the Palladian information
system for researchers and in two expositions at Barbaran da Porto Palace in Vicenza, and at Villa Poiana
at Poiana Maggiore, where is widely used by tourists for virtual visits to Palladian buildings.
1. INTRODUCTION In the panorama of sixteenth-century architecture, Palladio is an exceptional and impressive figure, whose
opera had a tremendous impact and influence in the following centuries all over the world. In the last years,
CISAAP focused part of its institutional mission in the application of information technology (IT) for
database management that facilitates research and public accessibility across numerous materials related to
Palladio, as well as quantitative and comparative researches. A first attempt to introduce IT to advance the
study of Palladian architectural history was the project “Digital Palladio” [1]. These CD-ROMs were the
first ones gathering in a systematic way all textual and graphical documentation of about 40 Palladian villas
and more than 30 palaces, churches and other civil buildings, making available spatial and temporal
navigation between the data via SQL queries.
Nowadays, the availability of digital 3D models rendered in real-time makes possible a new significant step
towards higher levels of knowledge: to have available all information in a visual and integrated way
limiting errors due to granularity [2]. Apart from the possibilities offered by the visualization of virtual
worlds, a powerful tool available in this field is the concept of 3D database. The architects are accustomed
to think primarily in spatial terms, so this might be a great improvement. For this reasons 3D modeling in
architecture helps not only to display and storage information, but it is useful to define a more precise,
organized and usable information.
Following the concept of 3D database and as part of the celebrations for the five hundred years from
Andrea Palladio’s birth and the opening of Villa Poiana to the public with a permanent exhibition, the
application “Palladio 3D Geodatabase” has been developed. This application allows a complete
representation of architecture whose complexity can hardly be approached and understood through textual
or iconographic documentation. From this point of view it is an updated evolution of the CISAAP CD-
ROMs, no longer usable due to technological obsolescence. Hopefully, “Palladio 3D Geodatabase” will
become the preferred interface for accessing this database, managed with ease and immediacy to give
access to the recordings relating to individual buildings by Palladio.
The added value of the new system is given by the inclusion of the buildings in the territory, allowing to
discover unknown relationships between the villas and the environment, to evaluate their architectural
occupancy and to quickly access a complex system of information collected by several extensive studies
along the years. The application has been designed for different types of users: tourists, architecture
historians, architects, curators charged of restoration, conservation and maintenance, and moreover
managers and their staff; these are the reasons why a largely scalable interface, able to support different
output devices and to work at different levels of iconicity, has been developed.
Overall, this 3D digital archive represents a complex cognitive system for Palladio’s opera finalized
through:
• 3D digital models representing the reality and, as metaphor of the observed objects, allowing a
direct and semantic knowledge of the data;
• 2D textual and iconographic materials approved and critically analyzed by the most qualified
researchers of Palladio’s opera;
• development of a new web-based architecture allowing a multi-user access from different
platforms, using standards.
The application is completely based on Google Earth (GE). The approach for the development of the
application comes from visual computing, has a strong architectural knowledge representation and is
deeply rooted in the philosophy of GE that inverts the role of Web browser as application and map as
content, resulting in an experience where the planet itself is the browser [3]. GE also features many layers
as a source of information on businesses and points of interest, as well as showcasing the contents of many
communities, such as Wikipedia and YouTube. In this way touristic information about Palladio villas or
logistic information will be added with no cost directly from the different actors that play a specific role in
the Palladio work management.
The paper has been organized as in the following: section 2 illustrates the related works and the used
technologies; section 3 describes methods and workflows applied to achieve 3D semantic modeling and
visualization; section 4 explains the development of the 3D Geographic Information System (GIS) and in
section 5 the geodatabase implementation is presented. Throughout the paper, examples and results coming
from the case studies, villa Badoer at Fratta Polesine, villa Emo, villa Pisani in Montagnana, villa Rotonda
and Valmarana palace in Vicenza are shown; concluding remarks are reported in section 6.
2. RELATED WORKS AND USED TECHNOLOGIES
2.1. 3D model semantic organization
Models are an excellent means of understanding architecture, describable as a collection of structural
objects, and identified through a precise architectural vocabulary. The availability of 3D semantic models
organized as cognitive systems allows to have geo-object items in a 3D GIS and an improved topological
control that allows a semantic approach to the classical problem of model levels of detail generation.

An architectural knowledge system is able to describe a series of structured objects using a specific
architectural lexicon. One of the most famous examples is the Andrea Palladio’s I quattro libri
dell’architettura (Venice, 1570) (Figure 1).
Figure 1: A. Palladio, I Quattro libri dell’architettura (1570). Left: first book, p. 36. Right: second book, p.
53.
A first major example of semantic methods for 3D models construction is the ‘shape grammars’ [4-5].
Quintrand [6] stated that the association of semantics and architectural shape is possible only considering
the building as a system of knowledge: the model is extracted from its description while its representation
is defined according to the objectives of the analysis.
De Luca [7] presented a methodological approach to the semantic description of architectural elements
based on theoretical reflections and on research experiences. Attene [8] developed the ShapeAnnotator, a
modular system to load a 3D triangular surface mesh (and its domain ontology), and to define the

meaningful shape parts, annotate them properly and save the result in a database. Semantic modeling and
classification has been also used in city modeling applications [9] and, as pre-step, for a successive
procedural modeling of architectures [10]. Similarly, Ullrich [11] defined a method, able to describe the
shape of 3D objects, that can be classified into two groups: methods following the approach of composition
of primitives and descriptions based on procedural shape representations. Schmittwilken [12] showed how
attribute grammar formalism can be used as a 3D modeling language.
Larry Sass [13] illustrated a method in which the rules for a shape grammar demonstrate the need for
additional information and illustration for rule building. Indeed the shape grammar generates information
for a physical construction using rapid prototyping or CMM techniques. The approach we adopted deals
with Sass procedure; the main difference relies on the fact that we refer to the real built object whereas his
method refers to its project. Therefore, in our proposal not only the schema but also the constructive rules
can be identified, highlighted and discussed (Figure 2).
Figure 2: 3D Model Semantic Structure. Left: Villa Pisani, at Montagnana. Right: Corinthian order
2.2. Ambient occlusion methods
The creation of realistic lighting or an accurate shadowing in real-time web-based applications is a tricky
and complicated problem. Indeed the most typical visualization standard for real-time rendering web-based
applications is the conventional texture-mapped Gouraud shaded, a very limited illumination method since
it misses fine details such as light spots on large polygons. Currently it is practically impossible to employ
any photorealistic quality methods such as ray-tracing or radiosity to calculate lighting in real time on a
web-based application. One of the approaches to improve the lighting quality is based on the pre-
calculation of static diffuse lighting of the scene using some advanced high-quality methods. The results
are then stored in a so-called light map textures [14]; even if a light map texture has much lower resolution
than the ordinary textures of the scene, it allows to store multiple light samples per polygon.
In 1998, Zhukov et al. [15] introduced obscurances, an efficient technique that achieved in a much more
inexpensive way some of the features available only in global illumination techniques [16]. Those features
included the realistic look of objects diffusely illuminated, presenting a darker appearance in those zones
that are more occluded. At the beginning the obscurances technique, was used in videogame environments
as a pre-computed texture map attached to the objects; then it was developed by Landis [17] and Bredow
[18], and named ambient occlusion (AO), in order to be used in production rendering for movies and
implemented in a photorealistic rendering environment as RenderMan.
Ambient occlusion is a lighting technique used to get a global illumination-like effect, as if it was lit from
an entire hemisphere. A set of visibility samples are collected from the hemisphere above a point, and a
scalar AO value is computed based on the percentage of unoccluded samples. Therefore AO measures how
much a point on a surface is obscured from light that might otherwise arrive from the outside. This average
occlusion factor is recorded at each surface element and used to simulate self-shadowing. Surface elements
located inside cast ambient occlusion, and surface elements outside are ignored.
From 2003 many different techniques that compute AO appeared, and consequently integrated in
commercial software. In the real-time rendering scenario, many approximations to AO exist. Object-based
methods calculate the AO at the object level [19, 20]. Depth maps are used by Whitehurst [21] in an
‘outside-in’ method consisting on a hemispherical array of spotlights to generate several depth maps.
Vertex-based methods are algorithms that compute the AO at the level of vertices. Martin Knecht in [22]
presents a good overview of some of these methods. Most of them require a very little pre-computation
effort, being able to perform AO calculation on the fly. Image-based methods are algorithms able to
calculate ambient occlusion with a viewing plane driven approach [23-25]. Therefore, compared to other
AO algorithms such as ray tracing, Screen Space Ambient Occlusion (SSAO) has the advantage of handling
dynamic geometry with significantly lower overhead. Unfortunately SSAO algorithms are not usable in this
study because the GE rendering engine does not support these algorithms neither external feature
programming.
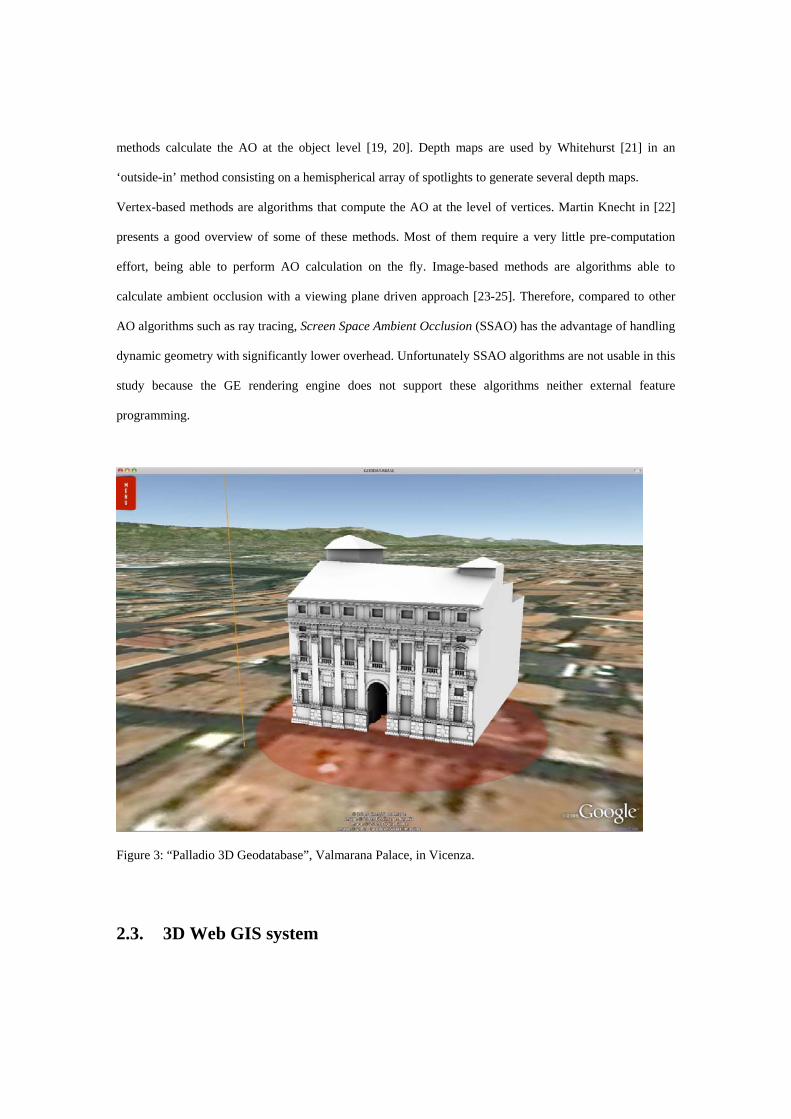
Figure 3: “Palladio 3D Geodatabase”, Valmarana Palace, in Vicenza.
2.3. 3D Web GIS system
The difficulties to realize a 3D Web GIS can be summarized in five points [26]:
1. Conceptual model: existing 2D and 3D objects data structures usually present lacks in spatial
representation of objects.
2. Data collection: a key point in the development of 3D GIS is the definition of techniques to store,
manipulate and display high quality and reality-based 3D data. Despite some interesting attempts
to implement automatic acquisition and 3D reconstruction of objects, manual work remains
dominant [27].
3. Visualization, navigation and user interface development: 3D visualization requires a number of
specific issues to be investigated, e.g. appropriate means to visualize 3D spatial analysis result,
tools to effortlessly explore and navigate through large models in real time, tools for walking
through the model, exploring particular phenomena and improving the cognitive perception.
4. Internet access: the World Wide Web has a remarkable ability to improve the accessibility of
spatial information.
5. Spatial analysis: similar to 2D variants, 3D GIS should be capable to perform metric (distance,
length, area, volume, etc), logic (intersection, union, difference), generalization, buffering,
network (shortest way) and merging operations.
The key point is the topological organization of spatial data. Ellul and Haklay [28] identified and reviewed
a list of requirements for topology in 3D applications. Three key areas were studied for the purposes of
identification requirements, supplies for visualization in 3D and for 3D analysis supported by topology.
This is a particularly demanding set of requirements; for this reason GIS software that handles reality-based
3D data are very rare. The problem is even more amplified for data defined by a large number of polygons.
Over the last few years we have seen an increasing amount of work in the fields of modeling and managing
geospatial 3D objects. Earlier projects were focusing on the modeling and management of complex 3D
objects – in a primarily relational DBMS environment [29, 30]. Some more recent projects employ object-
relational concepts to address these issues [31, 32]. In a geospatial model a 3D geospatial object can be
defined by its geometric or topological representation, or by using both representations [33]. Today
geospatial models represent large number of objects, mostly in 2D/2,5D, with simple geometric
representations. Recently 3D Information models were developed for representing the real world objects. A
notable example is CityGML [34], developed since 2002 by the members of the Special Interest Group 3D
(SIG 3D) in Germany with the aim to reach a common definition of the basic entities, attributes, and
relations that can be shared over different applications. The technology appears like a great improvement
over previous applications and a comprehensive framework. However CityGML does not seem to be
enough robust for high resolution architectural models, and the geometry is still limited to simple
representations. The DILAS (Digital Landscape Server) project [31] partially addressed this issue focusing
on object semantics, complex object geometries and photo-realistic textures, integration of existing
(geospatial) databases and temporal aspects. The DILAS 3D GIS technology combines an object-oriented
topological 3D data model with an XML-based 3D object storage in an object-relational DBMS. However,
these projects revealed a number of unsolved problems associated with the process of creating high-
resolution 3D models of typical cultural heritage objects [35].
2.4. Rich Internet applications
Rich Internet applications (RIA) are web applications that have the features and functionalities of
traditional desktop applications. RIAs typically allow to transfer the necessary processes for the user
interface to the web client and keep the bulk of the data (i.e., maintaining the state of the program, the data
etc) back on the application server. RIAs offer a greater functionality within a browser and are less
dependent on the server, compared to traditional web pages. The delivery and maintenance costs of RIAs
are low compared to standalone applications, since they require no installation, updates or patches, even
offering bigger advantages [36]. Even if some RIA platforms require a browser plug-in, RIAs have a high
degree of availability and flexibility, since they are accessible worldwide where networked computers are
available. In addition, RIAs are platform independent. For all these reasons they have been chosen as the
framework for this new edition.
3. MODEL CONSTRUCTION AND VISUALIZATION
3.1. High resolution model construction pipeline
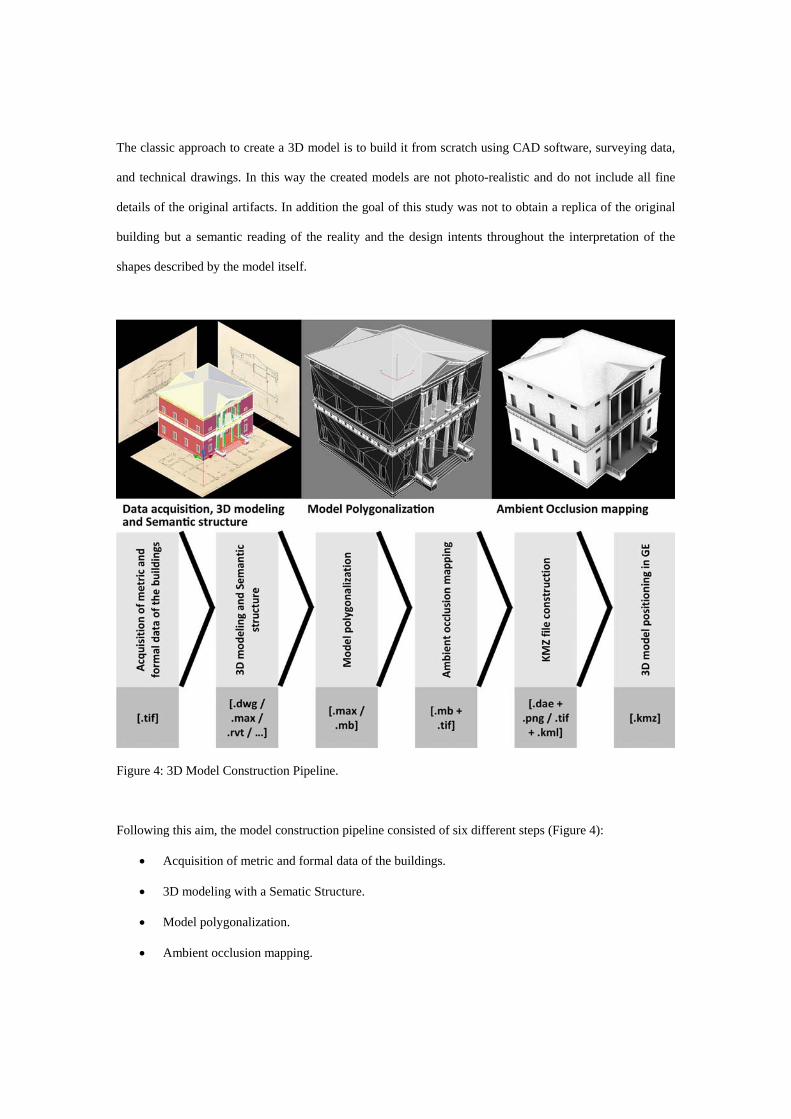
The classic approach to create a 3D model is to build it from scratch using CAD software, surveying data,
and technical drawings. In this way the created models are not photo-realistic and do not include all fine
details of the original artifacts. In addition the goal of this study was not to obtain a replica of the original
building but a semantic reading of the reality and the design intents throughout the interpretation of the
shapes described by the model itself.
Figure 4: 3D Model Construction Pipeline.
Following this aim, the model construction pipeline consisted of six different steps (Figure 4):
• Acquisition of metric and formal data of the buildings.
• 3D modeling with a Sematic Structure.
• Model polygonalization.
• Ambient occlusion mapping.

• KML file construction
• 3D model positioning in GE.
The pipeline started from digital scans (tiff format and resolution equal to 250 dpi) of the handmade survey
of the Corpus dei rilievi delle fabbriche palladiane performed by CISAAP with the support of the Italian
National Research Council (CNR). Drawings consist of a set of tables at different scales depending on the
type of representation (1/100 – 1/10); some drawings are quoted too. Deformations in drawings due to time
and suboptimal conservation were corrected thanks to the presence of the graphical scale.
Overall, for 1/100 scale drawings precision was less than 2.5 cm and for 1/50 scale drawings it was less
than 1.25 cm. An additional approximation of ±1 cm and ±0.5 cm characterized digital reproductions and
scans depending on the original scale (1/100 and 1/50 respectively).
This 3D modeling system was based on the accepted convention of architectural analysis whereby
structures were described as a series of structured objects using a specific architectural lexicon. We have
adopted the classification method of Tzonis and Oorschot [37] that subdivides various representations of
architectural space according to their level of ‘abstraction’ (clustering, topological and metric). Then,
component parts have been reassembled using a ‘put-together’ method as previously reported by Stiny and
Mitchell [5]. To do this we adopted a ‘shape grammar’ using a pre-established set of tree-shaped formal
rules which indicate a clear purpose and an evident structure. We therefore obtained semantic models
ready-to-use as a knowledge system. This type of numerical model organization allowed to manage 3D
models as multi-resolution models and to subdivide them in consistent and hierarchical subsets of a defined
number of triangles/polygons in order to be included and visualized in GE according to the limited amount
of triangles that it supports. Besides, this organization allowed highlighting and isolating individual model
portions through the consultation interface . Once the loading and parsing of kmz file has been completed
by the GE plug-in, the browser can access the various sub-nodes through the classical hierarchical
organization of nodes parent/children. The application code written in Javascript is able to extract the
structure of nodes and offer it to the users. Through the tree–shaped graph the user can select individual
elements and decide what to keep visible and what to hide.
To construct the 3D models we used several operators with different skills. For this reason the pipeline
could start using different modeling commercial software like Autodesk AutoCAD or 3DS Max Design or
other, with the only very large condition that the geometries used will be B-Rep or NURBS, or polygons to
ensure geometric interoperability. Starting from these raw models we generated the final KMZ file using
Autodesk Maya 9.0 as software environment. In Maya we realized the successive pipeline steps: model
segmentation; AO mapping; single element export in DAE format (the core file format of the pipeline).
The content of a KMZ file defined for the Palladio 3D-Geodatabase is a single root KML document
(notionally "doc.kml") and a series of referenced files (DAE, TIF or PNG) in the sub-directory “models”
referenced in the KML including network-linked KML files. DAE files describe geometry; while TIF or
PNG files include mapping information of the corresponding DAE files. Each model was placed using the
3D geographic longitude, latitude and altitude, used by KML for its reference system, according to the
internal coordinate system of GE based on the World Geodetic System of 1984 (WGS84) datum.
3.2. Model visualization - real-time rendering and ambient occlusion
The typical way of drawings by Palladio is a flat representation characterized by no depth, as can be seen in
I Quattro Libri dell’Architettura: a collection of two-dimensional drawings of plan and elevation
representing the relationship between them. Unfortunately this technical system, surely clear for its author,
resulted cryptic not only for occasional users, but also for architects and researchers that made many errors
in the interpretation of Palladio’s work, along the years. Therefore we looked for a form of representation
that could bring out volumes from flat drawings of Palladio, resolving, at the same time, another typical
problem of displaying 3D models in GE. The shading provided by the viewer is the simple Gouraud
shading, which causes a shimmering view and returns a 3D visualization of drawings by Palladio unable to
grasp the true volume of objects. Even the image obtained applying the feature “Displaying the Sun”
involves only flat shading from directional light without casting shadows or ambient diffuse shading.
Therefore, to show the true Palladian schemes in 3D, we applied AO techniques (Figure 5), using render-
to-texture (also called texture baking) techniques.

Figure 5: Villa Pisani, Montagnana. Left: Gourard Shading in GE. Right: Ambient Occlusion Mapping in
GE.
The process is standard for texture generation but requires a model pre-processing to export textured wire-
frame correctly in GE. The base shader library from Mental Images starting from Mental Ray version 3.4.3
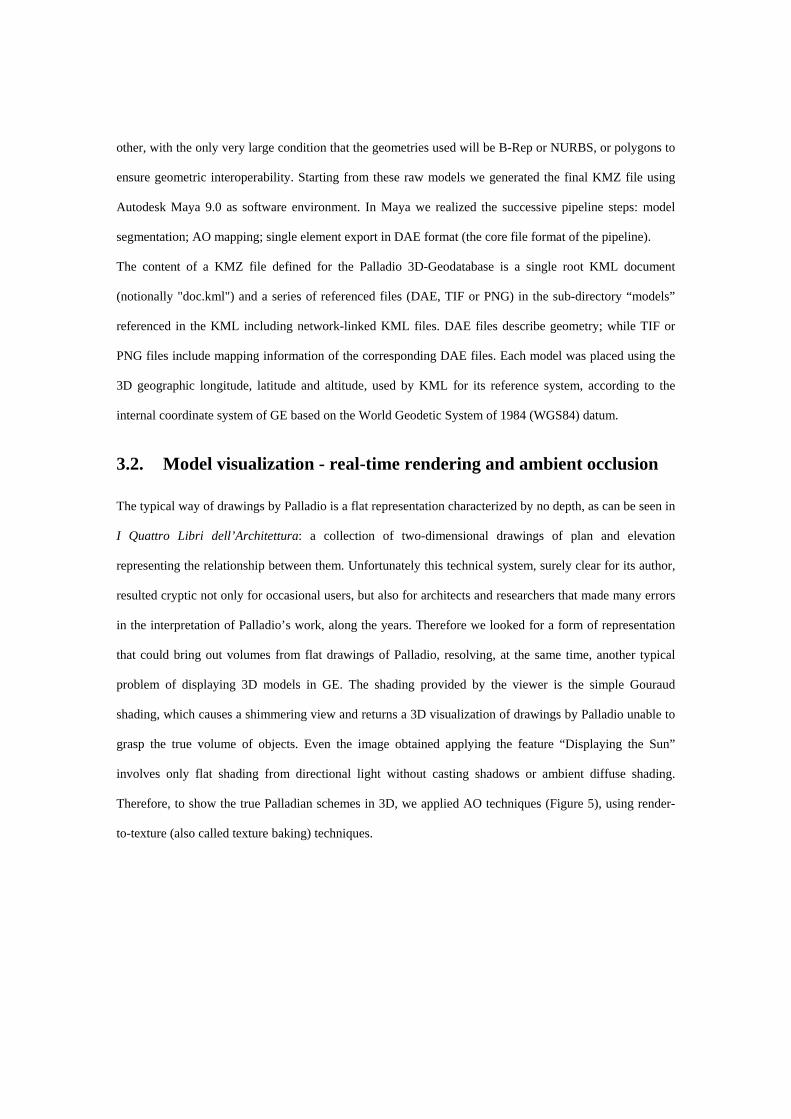
provides a set of utility shaders helpful to gather and control occlusion information. Our implementation
follow Occlusion tutorial with Mental Ray [50] and is accomplished at the shading level through the mib
amb occlusion shader. Examples of AO results on Valmarana Palace and Villa Badoer are shown in Figure
6.
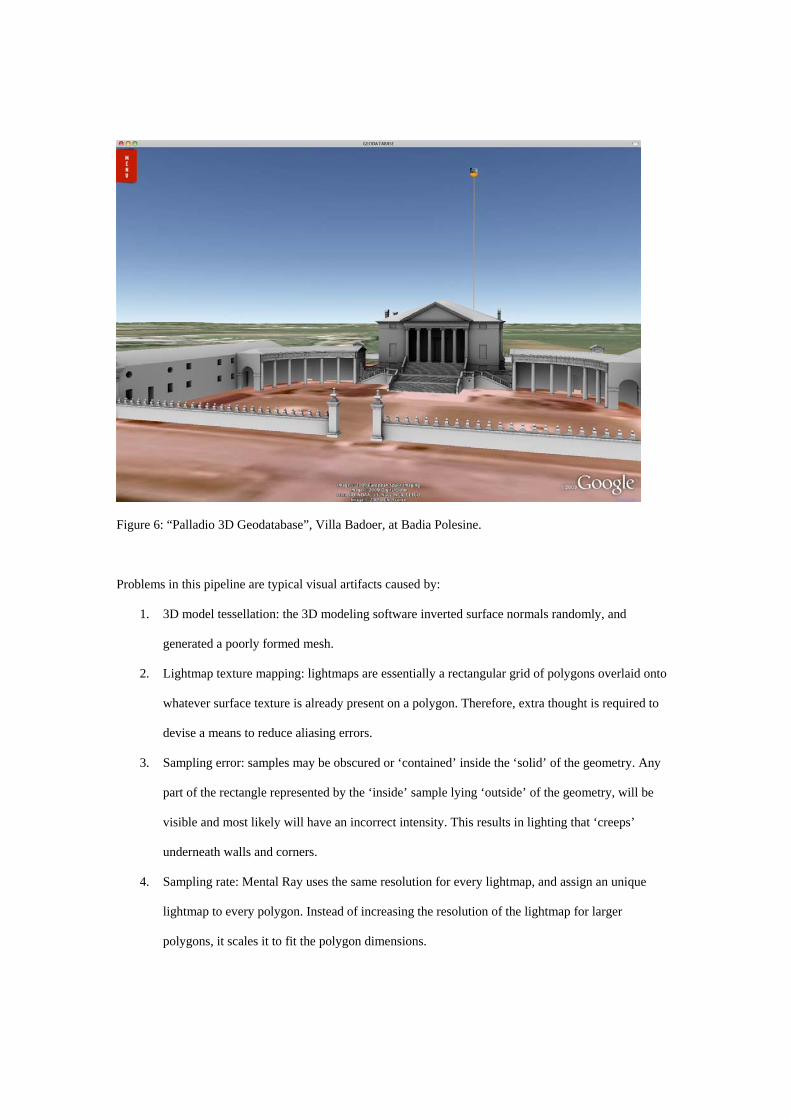
Figure 6: “Palladio 3D Geodatabase”, Villa Badoer, at Badia Polesine.
Problems in this pipeline are typical visual artifacts caused by:
1. 3D model tessellation: the 3D modeling software inverted surface normals randomly, and
generated a poorly formed mesh.
2. Lightmap texture mapping: lightmaps are essentially a rectangular grid of polygons overlaid onto
whatever surface texture is already present on a polygon. Therefore, extra thought is required to
devise a means to reduce aliasing errors.
3. Sampling error: samples may be obscured or ‘contained’ inside the ‘solid’ of the geometry. Any
part of the rectangle represented by the ‘inside’ sample lying ‘outside’ of the geometry, will be
visible and most likely will have an incorrect intensity. This results in lighting that ‘creeps’
underneath walls and corners.
4. Sampling rate: Mental Ray uses the same resolution for every lightmap, and assign an unique
lightmap to every polygon. Instead of increasing the resolution of the lightmap for larger
polygons, it scales it to fit the polygon dimensions.

The segmentation process was an excellent method to give solutions to the problems of point 2 and 4 just
using a single atlas texture map for each group of semantically similar elements and using the appropriate
dimensions for each group from 512x512 to 4096x4096 (Figure 7). Point 1 requires the control of the
normal direction and point 3 the control to avoid intersection or overlapping of surfaces or solids, but this is
a hypothesis of the modeling pipeline we applied.
Figure 7: Villa Pisani, Montagnana: AO maps.
4. THE 3D GIS SYSTEM
Andrea Palladio - 3D geodatabase is an application organized as a Rich Internet Application (RIA), a
typical client-server architecture with components in both sides. In the developed application we
incorporated four key components: an open relational database management system (RDBMS), a web
server, a web/virtual reality browser and a web server language side-oriented together with software for
dynamically recalling the contents (Figure 8). On the server side, the web server manages the client
requests of static and dynamic contents. It accepts the requests from the web browser and provides these
contents on internet using the HTML language. The local client consists of a collection of web pages and
allows to control the accesses and to register the events; a static GIS client side application includes the
control menu, display and visualization and the dynamic content required by the user, with calls back to
register the user state and align the server; it benefits of the application through the web and GE browsers.
The user accesses the data on the server side using a Graphics User Interface (GUI), a combination of
HTML forms and KML/KMZ models. HTML documents - through a simple query in SQL - are used to
specify queries and visualize text, images and movies as well as additional data supported by the web
browser. KMZ documents represent the visualization interface and – through a series of place marks –
point to objects for querying and visualization of spatial analysis.
Figure 8: “Palladio 3D Geodatabase”, key components.
The user interface is a key point of the project since it is completely different from the usual mode to
visualize information on a web browser. The GUI allows the user to control the different operative modes,
to select specific inputs, to check the current state and to surf inside the application, through different
modules. The main menu and the working area at the top of the screen allow to enter different sections and

at the same time and they offer the opportunity to evaluate the urban system and/or specific sites using the
interface as a virtual table.
The developed application (Figure 9) allows two types of query aimed to obtain additional information
regarding an object of interest and to search artifacts that meet specific requirements. These queries satisfy
two important interaction modes since the user can access environments and objects in the same 3D space
and, through GE, can select pages containing other types of information.
Figure 9: “Palladio 3D Geodatabase”, Queries interface.
The geodatabase was organized including:
• An architecture database;
• A 3D model repository;
• An iconographic documentation repository;

• A web structure for hosting the plug-in generated by the server, also including the client-side
processing logic;
• A local client including a web browser and GE plug-in;
• A client side Adobe Flash interface for showing and describing specific contents;
• An Internet connection for accessing 3D maps of the analyzed area.
3D model files, their textures, and the iconographic documentation database are hosted on a dedicated
server. For each villa or palace, the database keeps information about:
• building name;
• geographical location (county, municipality, street, etc.);
• geographic coordinates referring to a hypothetical building mass centroid;
• building type information;
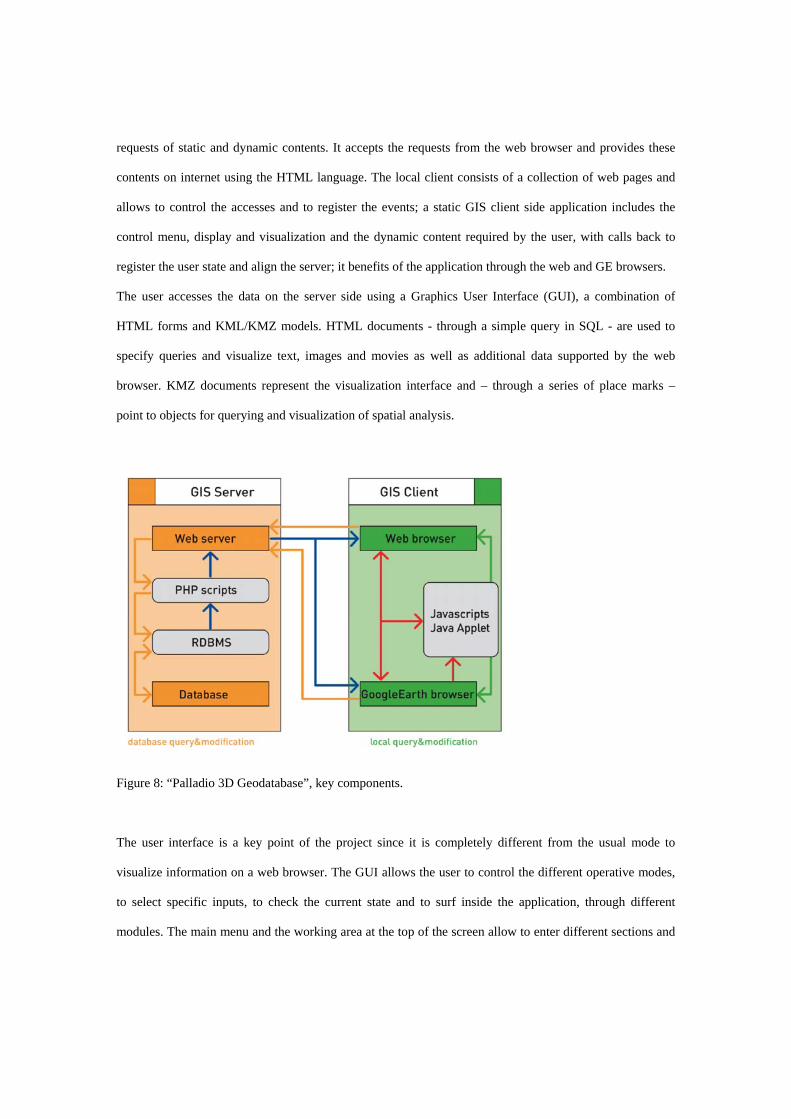
• historical information regarding architecture, construction, decoration, etc. (Figure 10);
• link with the 3D model file (Figure 11);
• link with available iconographic documentation.
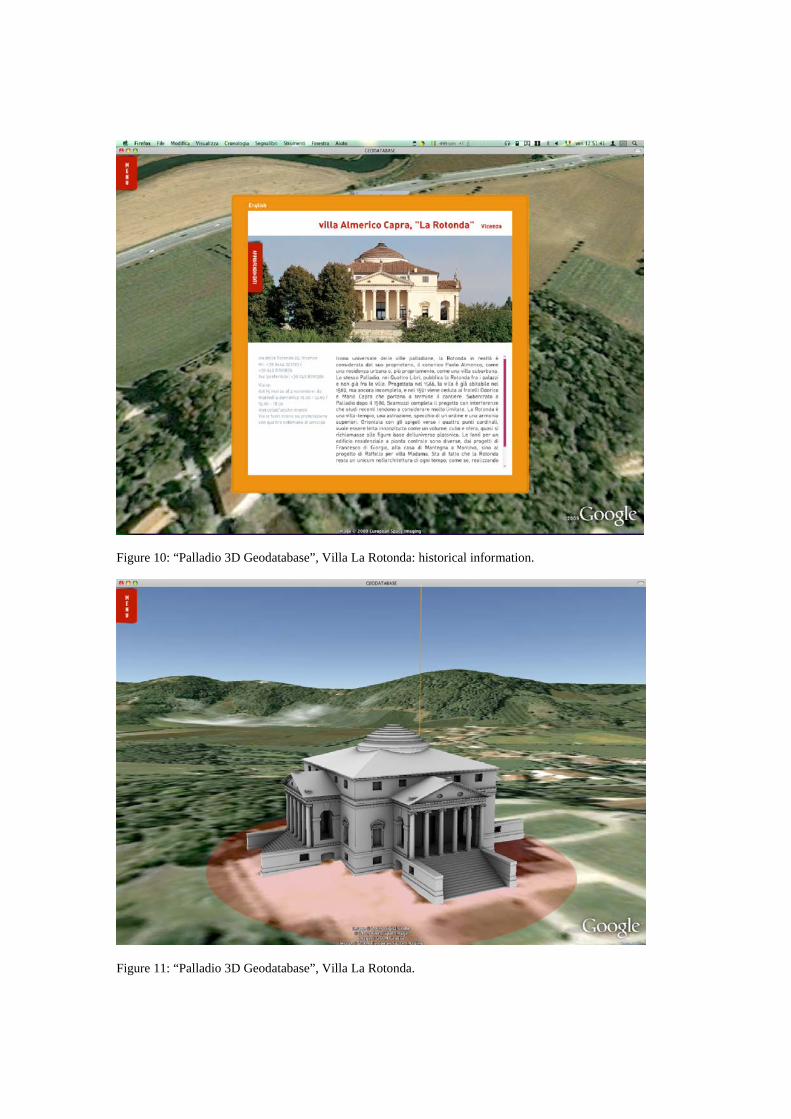
Figure 10: “Palladio 3D Geodatabase”, Villa La Rotonda: historical information.
Figure 11: “Palladio 3D Geodatabase”, Villa La Rotonda.
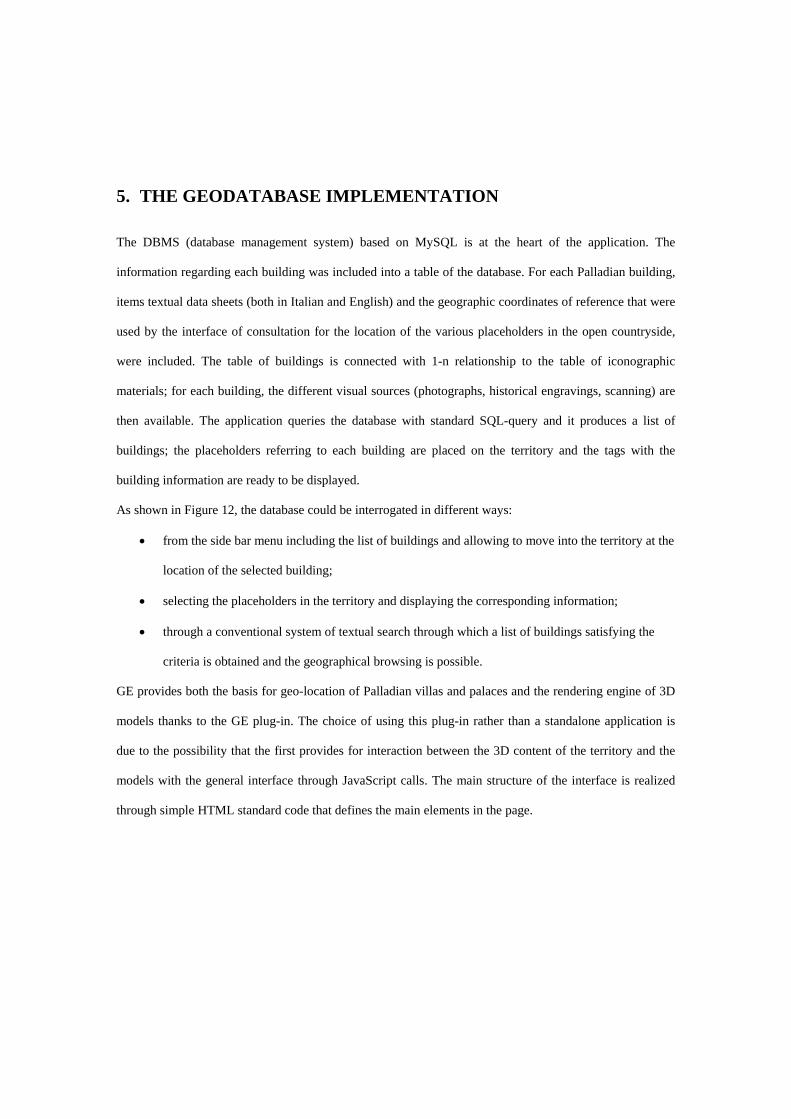
5. THE GEODATABASE IMPLEMENTATION
The DBMS (database management system) based on MySQL is at the heart of the application. The
information regarding each building was included into a table of the database. For each Palladian building,
items textual data sheets (both in Italian and English) and the geographic coordinates of reference that were
used by the interface of consultation for the location of the various placeholders in the open countryside,
were included. The table of buildings is connected with 1-n relationship to the table of iconographic
materials; for each building, the different visual sources (photographs, historical engravings, scanning) are
then available. The application queries the database with standard SQL-query and it produces a list of
buildings; the placeholders referring to each building are placed on the territory and the tags with the
building information are ready to be displayed.
As shown in Figure 12, the database could be interrogated in different ways:
• from the side bar menu including the list of buildings and allowing to move into the territory at the
location of the selected building;
• selecting the placeholders in the territory and displaying the corresponding information;
• through a conventional system of textual search through which a list of buildings satisfying the
criteria is obtained and the geographical browsing is possible.
GE provides both the basis for geo-location of Palladian villas and palaces and the rendering engine of 3D
models thanks to the GE plug-in. The choice of using this plug-in rather than a standalone application is
due to the possibility that the first provides for interaction between the 3D content of the territory and the
models with the general interface through JavaScript calls. The main structure of the interface is realized
through simple HTML standard code that defines the main elements in the page.
Figure 12: “Palladio 3D Geodatabase”, Query interface.
Data are loaded together with the page through AJAX calls to the server and to a web server that, through a
PHP script, pre-processes the data before returning it to the client. For each record, the name of the building
is extracted to form the list of Palladian works and their geographical coordinates. Then, using JavaScript,
the system places the placeholders on the territory and connects a mouse click on them with the opening of
an informative balloon.
All navigation actions exploit Google native instructions that allow easy and homogeneous surfing between
two points of the world. The information panel, activated by clicking the placeholder of the model, is
shown inside balloons directly created from GE. GE plug-in allows to dynamically define the balloon
contents through basic HTML code. To provide the geodatabase information inside the balloon, we applied
a template developed in Flash. The Flash applet queries the remote database recalling all the information of

the model and its iconographic content. The system includes a main tab introducing the opera and several
additional tabs with specific content.
The information is available in the 3D world, inside one box, overlapping the 3D world but never
completely hiding it. The initial script records a set of actions related to the user interaction with the 3D
world. The system registers the mouse click on the place mark and on the area around the model.
This option allows toggling the view of the complete model or just the territory without the building.
Clicking on the territory, the application shows/hides the 3D model; while selecting the placeholder the
user accesses the information panel with the information extracted from the database.
For each entry in the list of villas and palaces, the system associates an action that drives Google at the
location of the model. In addition the system allows to hide and recall the list to have it visible only when
necessary, leaving the maximum space for the 3D world exploration.
The system supports now 15 3D models of Palladian buildings well performing 50 fps at 1920x1200 pixel
of resolution using a PC equipped with an Intel Core 2 Duo E6850, 4 Gb RAM, Nvidia Geforce GTX 290
graphic card and it could be used with a minimal customization to manage other visual database of
architecture. At the moment, the platform has some limitations due to: (1) the limited number of triangles
for each portion of the model; (2) the rendering engine not supporting shading techniques; (3) the limited
number of APIs to get the model structure; (4) the navigation system that does not detect collisions with the
models, making the exploration difficult; (5) some countryside areas have low resolution textures of the
landscape; and (6) 32bit operating software tends to lose stability when several models are loaded
simultaneously.
6. CONCLUDING REMARKS
The proposed paper reports a new digital 3D web-based GIS system that will be the basis for several
platforms with different purposes: tourist information, scientific researches and projects, management,
conservation and maintenance activities of the Palladio’s work. This system works as a web-based
application and it is capable of using a single database for several user categories (asset managers,
researchers, tourists etc.) simply filtering the requirements. The framework is completely geo-referenced

using GE and 3D model based. The 3D models are generated using semantic techniques. The framework is
designed in order to be scalable in the visualization and the client PC systems, from large screen displays
and high-end workstations to desktop monitor displays and low-end PC. The system is completely based on
widely spread and standardized interchange file formats and data entry, and the final application is
completely founded on open source software. In this way the application will be opened to subsequent
implementation to follow the progress of the Palladian studies; the quality of the actual and future
implementation of information will be guaranteed also in case of different users and future changes in
software and platforms.
Figure 13: “Palladio 3D Geodatabase”, at work in Villa Pojana.
The quality of our system is witnessed by its use in two different expositions prepared by CISAAP at
Barbaran da Porto Palace in Vicenza, and at Villa Poiana at Poiana Maggiore (Figure 13), one of the most
famous Palladian Villas, in which the system is widely used by tourists visiting the Palladian buildings.
Acknowledgements
This paper is the result of a collaboration between the University of Bologna and the Centro Internazionale
di Studi di Architettura Andrea Palladio in Vicenza. Working group: Guido Beltramini and Simone
Baldissini at CISAAP, Fabrizio Ivan Apollonio, Valentina Baroncini, Cristiana Corsi, Marco Gaiani,
Matteo Grassi at University of Bologna.
References
1. Beltramini, G., The Multimedia CD-ROMs of the Centro Internazionale di Studi di Architettura
Andrea Palladio: A resource for the study of architectural history and for the scientific
examination and promotion of the works of Palladio, in: 8th International conference on Virtual
Systems and MultiMedia proceedings, Kiwisoft, Seoul, 2002, pp. 791-799.
2. Moles, A., Teoria informazionale dello schema, Versus, 1972, 2, 29-37.
3. Jones, M.T., Google’s geospatial organizing principle, IEEE Computer Graphics and
Applications, 2007, 27 (4), 8-13.
4. Stiny, G., Introduction to shape and shape grammars, Environment and Planning B: Planning and
Design, 1980, 7, 343-351.
5. Stiny, G., and Mitchell, W.J., The Palladian grammar, Environment and Planning B: Planning and
Design, 1978, 5, 5-18.
6. Quintrand, P., Autran, J., Florenzano, M., Fregier, and M., Zoller, J., La CAO en architecture,
Hermes, Paris, 1985.
7. De Luca, L., Florenzano, and M., Veron, P., A generic formalism for the semantic modeling and
representation of architectural elements, Visual Computer, 2007, 23, 181-205.
8. Attene, M., Robbiano, F., Spagnuolo, M., and Falcidieno, B., 2007, Semantic Annotation of 3D
Surface Meshes based on Feature Characterization, in: Falcidieno, B., Spagnuolo, M., Avrithis,
Y.S., Kompatsiaris, I., and Buitelaar, P., eds., Proceedings of the Second International Conference
on Semantic and Digital Media Technologies, Springer, Berlin, 2007, 126-139.
9. Emgard, K.L., and Zlatanova, S., Design of an integrated 3D information model, in: Zlatanova, S.,
Fendel, E., eds., Urban and regional data management: UDMS annual 2007, Taylor & Francis,
London, 2008, 143-156.
10. Mueller, P., Wonka, P., Haegler, S., Ulmer, A., and Van Gool, L., Procedural modeling of
buildings, in: Finnegan, J., and Dorsey, J., eds., Proceedings of 2006 Symposium on Interactive
3D Graphics, ACM Press, New York, 2006, 614-623.
11. Ullrich, T., Settgast, V., and Fellner, D.W., Semantic fitting and reconstruction, ACM Journal on
Computing and Cultural Heritage, 2008, 1(2), 1-20.
12. Schmittwilken, J., Dörschlag, and D., Plümer, L., Attribute Grammar for 3D City Models, in:
Proceedings of Urban Data Management Symposium (UDMS) 2009, Taylor & Francis, London,
2009, 49-58.
13. Sass, L., A Palladian construction grammar - design reasoning with shape grammars and rapid
prototyping, Environment and Planning B: Planning and Design, 2007, 34, 87–106.
14. Zhukov, S., Iones, A., and Kronin, G., On a practical use of light maps in real-time application, in
Proceedings of SCCG’97 International Conference, Bratislava, 1997.
15. Zhukov, S., Iones, A., and Kronin, G., An ambient light illumination model, in: Rendering
Techniques ’98 (Proceedings of the Eurographics Workshop on Rendering), Springer-Wien, 1998,
45–55.
16. Méndez-Feliu, À., and Sbert, M., From obscurances to ambient occlusion: A survey, The Visual
Computer: International Journal of Computer Graphics, 2009, 25 (2), 181-196.
17. Landis, H., Production-Ready Global Illumination, SIGGRAPH 2002 Course 16 notes,
RenderMan in Production, 2002.
18. Bredow, R., RenderMan on Film, SIGGRAPH 2002 Course 16 notes, RenderMan in Production,
2002.
19. Kontkanen, J., and Laine, S., Ambient occlusion fields, in: SI3D ’05: Proceedings of the 2005
symposium on Interactive 3D graphics and games, ACM Press, NewYork, 2005, 41 - 48.
20. Malmer, M., Malmer, F., Assarson, U., and Holzschuch, N., Fast precomputed ambient occlusion
for proximity shadows, Journal of Graphics Tools, 2007, 12(2), 59 - 71.
21. Whitehurst, A., Depth map based ambient occlusion lighting, http://www.andrew-
whitehurst.net/amb occlude.html [1-12-2009].
22. Knecht, M., State of the Art Report on Ambient Occlusion, Technical Report, Institute of
Computer Graphics and Algorithms, University of Technology, Wien, 2007,
http://www.cg.tuwien.ac.at/research/publications/2007/knecht-2007-ao/ [1-12-2009].
23. Shanmugam, P., and Orikan, O., Hardware accelerated ambient occlusion techniques on GPUs, in:
Gooch, B., and Sloan, P.-P., eds., I3D ’07: Proceedings of the 2007 Symposium on Interactive 3D
Graphics and Games, ACM Press, New York, 2007, 73-80.
24. Mittring, M., Finding next gen: Cryengine 2, SIGGRAPH 2007 Course 28 notes, Advanced real-
time rendering in 3D graphics and games, 2007.
25. Kajalin, V., Screen Space Ambient Occlusion, in: Engel, W., Shaderx7: Advanced Rendering
Techniques, Charles River Media, 2009.
26. Rahman, A.A., and Pilouk, M., Spatial Data Modeling for 3D GIS, Springer, Berlin, 2008.
27. Gaiani, M., and Micoli, L.L., A framework to build and visualize 3D models from real world data
for historical architecture and archaeology as a base for a 3D information system, Proceedings of
the 2nd Italy-United States Workshop on The Reconstruction of Archaeological Landscapes
through Digital Technologies, BAR International series, 1379, Berkeley, USA, 2005, 103-125.
28. Ellul, C., and Haklay, M., Requirements for Topology in 3D GIS, Transactions in GIS, 2006,
10(2), 157-175.
29. Pfund, M., Topological Data Structure for a 3D GIS, International Archives of Photogrammetry
and Remote Sensing, 2001, XXXIV(2W2), 233-237.
30. Wang, X., and Grün, A., A Hybrid GIS for 3-D City Models, International Archives of
Photogrammetry and Remote Sensing, 2000, XXXIII(B4), 1165-1172.
31. Nebiker, S., DILAS - The Digital Landscape Server for the Generation and Management of Large
3D City Models, in: Fritsch D., ed., Photogrammetric Week '03, Herbert Wichmann Verlag,
Heidelberg, 2003, 227-236.
32. Gröger, G., Reuter, and M., Plümer, L., Shall 3D-City Models be managed in a commercial
database?, GIS - Geoinformationssysteme - Journal for Spatial Information and Decision Making,
2004, 9, 9-15.
33. Breuning, M., and Zlatanova, S., 3D Geo-DBMS, in: Zlatanova, S., and Prosperi, D., eds., 3D
large scale data integration: challenges and opportunities, Taylor & Francis Group, London, 2006,
87-115.
34. Kolbe, T.H., Representing and Exchanging 3D City Models with CityGML, in: Lee, J., and
Zlatanova, S., eds., 3D Geo-Information Sciences, Springer, Berlin, 2009, 15-32.
35. Emgard, K.L., and Zlatanova, S., Design of an integrated 3D information model, in: Zlatanova, S.,
Fendel, E., eds., Urban and regional data management: UDMS annual 2007, Taylor & Francis
Group, London, 2008, 143-156.
36. Noda, T., and Helwig, S., Rich Internet Applications, UW E-Business-Consortium, 2005.

37. Tzonis, A., and Oorschot, L., Frames, Plans, Representation Concept dicta at Inleiding
Programmatische en Functionele Analyse, Faculty of Architecture, Delft University of
Technology, 1987.
38. Berto, P., Occlusion tutorial, Mental Images, 2005,
http://www.lamrug.org/resources/doc/occlusion_tutorial.pdf [1-12-2009]
39. Beltramini, G., and Gaiani, M., eds., Una metodologia per l’acquisizione e la restituzione dei
giacimenti documentali dell’architettura. I materiali per lo studio di Andrea Palladio, Edizioni
POLI.design, Milano, 2003.