an integrated approach to conservation of forests with development...
TRANSCRIPT
An Integrated Approach to Conservation of Forests with Development of Villages in Tamilnadu∗
C.K. SREEDHARAN
Office of the Chief Conservator of Forests
Forest Department of Tamilnadu No. 1 Jeenis Road, Panagal Building
Saidapet, Chennai – 600015 Tamilnadu, India
E-mail: [email protected]
Abstract
Tamilnadu, the southernmost peninsular state in the Republic of India, has less than 1/6 of its land mass under forests. Out of 22,800 km2 of forests, about 7,000 km2 are badly degraded due to heavy biotic interference from more than 2,000 villages nearby. Thus, the forest in the state of Tamilnadu is in a precarious condition, unable to meet the ecological security of the state and the economic well-being of the poor in the adjacent villages. A project strategy based on watershed development, participatory forest management, and poverty alleviation programs was designed and implemented in Tamilnadu from 1997 to 2002 with funding from Japanese Bank for International Cooperation. Joint Forest Management programs in 999 watersheds/villages integrating the conservation of forests with the development of villages have produced encouraging results. A study was conducted to assess the impact of the project intervention on the ecological status, hydrological status, and socio-economic status of the watershed. An evaluation of 60 randomly selected watershed, comprising forests and villages were made and the results were analyzed. Baseline data collected in the initial year of the project implementation were compared with the data collected after 3 years to measure the level of impact. The ecological impact is considered upon studying the vegetational status of degraded forests, diversity of tree species, shrub and herb population, grass cover, and the saplings planted in gaps and patches by way of supplemented regeneration. In determining the hydrological impact, water table level, net area cultivated, area under irrigated cultivation, cultivation of cash crops, and intensity of paddy cultivation were observed. Socio-economic impact also including annual household income, source of livelihood, poverty status, dependence on forest, and other related factors were recognized. The innovative and holistic approach of empowering people through Joint Forest Management and integrating forest conservation with poverty alleviation programs has produced considerable enthusiasm and hopes among all people concerned. But, to sustain the benefits and gains and to ensure the firm establishment of the Joint Forest Management practices much more effort is required.
1. INTRODUCTION
Forests are vital for hospitable planetary living conditions for humans. The World Commission on Forests and Sustainable Development (1998) emphasizes crisply that “forests are fundamental to the maintenance of a habitable biosphere, they conserve biological diversity, shield the earth’s landscapes from abrupt changes, bring order to the flow and quality of water and help stabilize climate regionally and globally.” Naturally the human race depends heavily on forests for food, fodder for livestock, fibre for roofing, fuel for cooking and fertilizer for cropland. Complex economic factors led to a situation wherein forests were looked upon as an easy source for valuable livelihood resources and naturally their exploitation became a necessity. The population of India has grown exponentially from 361 million in 1951 to 1 billion in 2001. We constitute 18% of the global population and share 2% of the global geographical area and only 1% of world’s forest
1
∗ Paper presented at the IUFRO Science/Policy Interface Task Force regional meeting held in Chennai, India at the M.S. Swaminathan Research Foundation, 16-19 July 2002.
area. While the recorded forest area has shrunk at one end, rapid degradations of the existing forests have been witnessed at the other end. The sustained onslaught on virgin forest lands has degraded the forest soils and destroyed natural regeneration of biodiversity. Compounding these problems is relentless grazing, especially during monsoon seasons, destroying the newly emerging regenerated seedlings. During the summer month forest fires, both manmade and natural, wipe out the parched vegetation giving no chance for the forest lands to survive. Considering the high level of dependence on forests for fodder and fuel wood, degradation of forests has serious repercussions for the rural population and village economy. It is well known that capacity of perennial vegetation, i.e. leaves and branches break the force of rain drops and protect against splash erosion. Even the leaf and litter provides a protective cover to the soil. The roots of trees, herbs, shrubs and grasses effectively bind the soil and conserve moisture in their respective root zones. Such is the vitality of vegetative cover. Due to inadequate vegetative cover, soil erosion and silting of the downstream lands and water bodies, the productive capacity of the land has deteriorated. The capacity of the land for water retention and infiltration has been badly affected. Non-availability of water for domestic and farming needs has seriously affected agriculture, which is the backbone of the rural economy and household self-sufficiency at the micro level. This social and economic disequilibrium has serious repercussions such as migration, dying out of traditional occupations and artisanship, dismantling of local social institution and culture. The root cause is traced to the destruction of the environment viz., forests, land and water. Forests are the only source for surface water as they are the main catchments for big river basins as well as for small streams and ponds. Plant resources and water are essential for the very existence of the human race and any disharmony in human and habitat interrelation will spell doom on the future of mankind, especially the poor who constitute the majority. Mankind is on the threshold of a catastrophe and is in urgent need of restoring the lost harmony. One silver lining on the dark horizon is the fact that all the three resources under threat viz., forest, water and land are capable of natural recuperation and restoration when biotic stress is lifted. As developing nations have started giving serious thought to stopping depletion and degradation of forests, several management alternatives are emerging in every part of the world where the environment-especially forests-are under threat. 2. JOINT FOREST MANAGEMENT (JFM) - A MANAGERIAL ALTERNATIVE Forest management now has different responsibilities than in the past. No technical measures can work unless there is a conducive social environment. Forests as a common property resource ultimately benefit the society and hence society cannot be kept away from its management. The National Forest Policy (1988) has rightly made it mandatory and guidelines were issued in 1990 and fine-tuned in 2000. Almost all Indian States are implementing JFM in different dimensions. The stakeholders in JFM are usually socially and economically downtrodden. They are disorganized and under privileged due to their poverty. They have no say in the political system of governance. These sections are principally focused in the JFM concept, bringing into play the principles of equity and empowerment. This is what that makes JFM distinctly different from other participatory practices. 3. EXPERIENCES IN TAMILNADU Tamilnadu is endowed with unique bio diversity in the Western Ghats and Eastern Ghats and pockets of Tropical Evergreens and Mangrove Wet lands. The total forest area of the State is 22,865 sq. km, or 17.4.% of the total geographical area. But due to severe biotic pressure more than 7000 sq. km of forests are in various stages of degradation. About 3000 villages are badly affected by the devastation of environmental security. Realising the seriousness and urgency of the situation the Tamilnadu Forest Department has embarked on a massive watershed based JFM programme to restore the degraded forests. This five year project captioned Tamilnadu Afforestation Project envisages the restoration of 3.5 lakh ha of degraded forests abutting 1000 interface villages with an outlay of
2
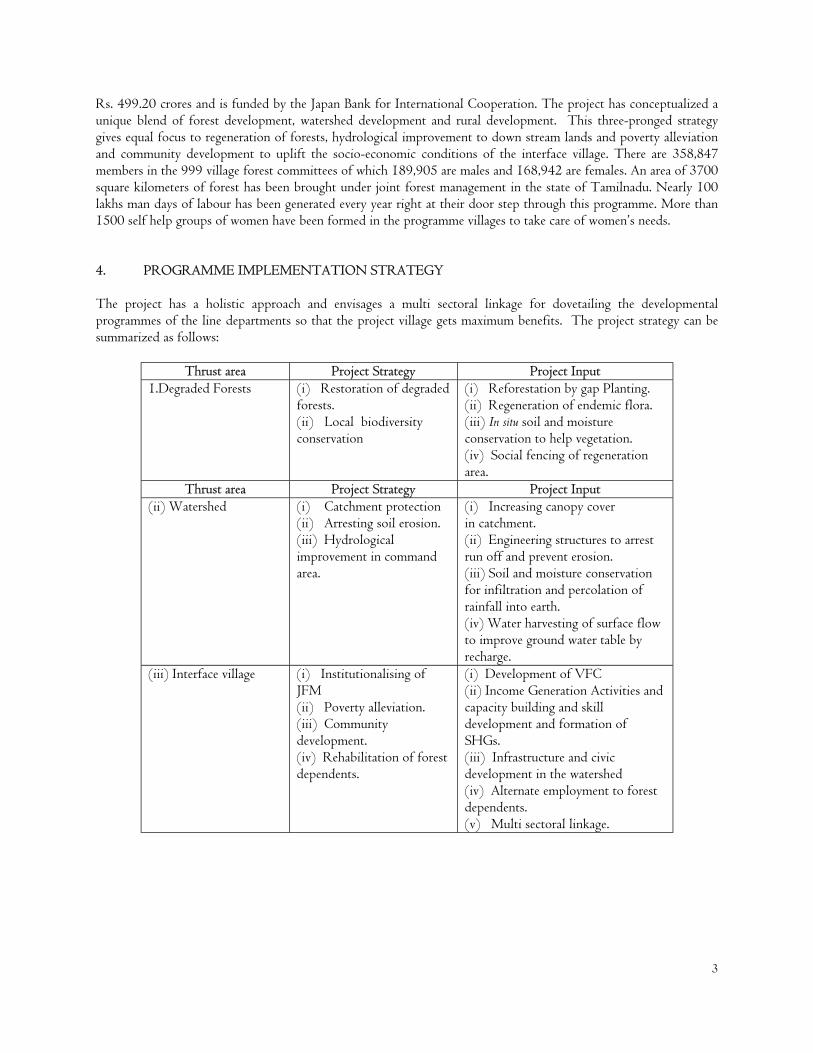
Rs. 499.20 crores and is funded by the Japan Bank for International Cooperation. The project has conceptualized a unique blend of forest development, watershed development and rural development. This three-pronged strategy gives equal focus to regeneration of forests, hydrological improvement to down stream lands and poverty alleviation and community development to uplift the socio-economic conditions of the interface village. There are 358,847 members in the 999 village forest committees of which 189,905 are males and 168,942 are females. An area of 3700 square kilometers of forest has been brought under joint forest management in the state of Tamilnadu. Nearly 100 lakhs man days of labour has been generated every year right at their door step through this programme. More than 1500 self help groups of women have been formed in the programme villages to take care of women’s needs. 4. PROGRAMME IMPLEMENTATION STRATEGY The project has a holistic approach and envisages a multi sectoral linkage for dovetailing the developmental programmes of the line departments so that the project village gets maximum benefits. The project strategy can be summarized as follows:
Thrust area Project Strategy Project Input 1.Degraded Forests (i) Restoration of degraded
forests. (ii) Local biodiversity conservation
(i) Reforestation by gap Planting. (ii) Regeneration of endemic flora. (iii) In situ soil and moisture conservation to help vegetation. (iv) Social fencing of regeneration area.
Thrust area Project Strategy Project Input (ii) Watershed (i) Catchment protection
(ii) Arresting soil erosion. (iii) Hydrological improvement in command area.
(i) Increasing canopy cover in catchment. (ii) Engineering structures to arrest run off and prevent erosion. (iii) Soil and moisture conservation for infiltration and percolation of rainfall into earth. (iv) Water harvesting of surface flow to improve ground water table by recharge.
(iii) Interface village (i) Institutionalising of JFM (ii) Poverty alleviation. (iii) Community development. (iv) Rehabilitation of forest dependents.
(i) Development of VFC (ii) Income Generation Activities and capacity building and skill development and formation of SHGs. (iii) Infrastructure and civic development in the watershed (iv) Alternate employment to forest dependents. (v) Multi sectoral linkage.
3
5. PROCEDURE FOR IMPLEMENTATION
The project is implemented in the following sequential manner:
• Selection of village and Regeneration Area of 250-300 hectares in degraded forests (with less than 0.4 density).
• NGO/VA involvement for awareness creation and mobilisation. • Baseline survey, PLA exercises and resource inventory. • Formation of VFC and election of EC and President • Micro-Plan documentation by VFC and Forest Department. • Planning and implementation of forestry development works - choice of species, nursery, regeneration
works etc., • Identification of natural drainage line with the help of VFC members and site selection for water harvesting
structures. • Identification of forest dependents and alternate employment for rehabilitation. • Identification of beneficiaries for Income generation activities (individual) for poverty alleviation. • Prioritization of Community Development works and identification of line Departments for Multi-sectoral
linkage. • Benefit sharing. • Monitoring and evaluation.
6. ALTERNATE EMPLOYMENT Alternate employment has been provided to forest dependents and rural poor in the project villages through several income generation activities. These measures are designed to increase the earning capacity and wean the forest dependents away from the forests. Women who are engaged in firewood collection and grazing are greatly benefited by these activities. The achievement in this field is as follows: alternate employment has been provided to 52,517 males and 30,673 females in four years from 97-98 to2000-01. 7. COMMUNITY DEVELOPMENT All programme villages tackled under the Tamilnadu Afforestation Project are interior, remote and poor with least civic amenities like transport, protected drinking water, education, etc. The project gives a facelift to these villages by taking up several development activities according to the aspirations of the local villagers. Construction of overhead tanks, drilling borewells, construction of community halls, providing infrastructure for schools, electrification, installation of TV sets, construction of fair price shops, libraries and sanitation facilities are some of the activities carried out. 8. IMPACT A study was conducted to assess the impact of the project intervention on the ecological status, hydrological status and socio-economic status of the JFM Unit. The project conducted an internal evaluation in sixty randomly selected JFM areas all over the State. The JFM areas were covered from 1997-98 to 1999-2000.
4
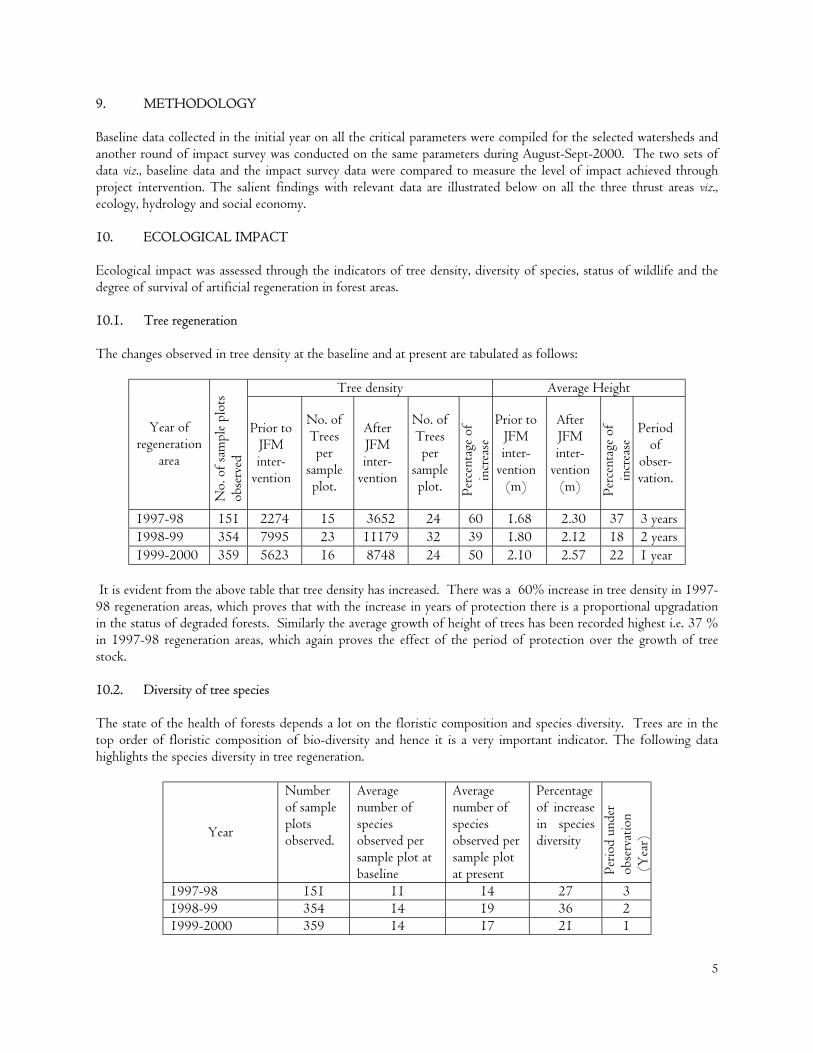
9. METHODOLOGY Baseline data collected in the initial year on all the critical parameters were compiled for the selected watersheds and another round of impact survey was conducted on the same parameters during August-Sept-2000. The two sets of data viz., baseline data and the impact survey data were compared to measure the level of impact achieved through project intervention. The salient findings with relevant data are illustrated below on all the three thrust areas viz., ecology, hydrology and social economy. 10. ECOLOGICAL IMPACT Ecological impact was assessed through the indicators of tree density, diversity of species, status of wildlife and the degree of survival of artificial regeneration in forest areas. 10.1. Tree regeneration The changes observed in tree density at the baseline and at present are tabulated as follows:
Tree density Average Height
Year of regeneration
area
No.
of s
ampl
e pl
ots
obse
rved
Prior to JFM inter-
vention
No. of Trees per
sample plot.
After JFM inter-
vention
No. of Trees per
sample plot. Pe
rcen
tage
of
incr
ease
Prior to JFM inter-
vention (m)
After JFM inter-
vention (m) Pe
rcen
tage
of
incr
ease
Period of
obser-vation.
1997-98 151 2274 15 3652 24 60 1.68 2.30 37 3 years 1998-99 354 7995 23 11179 32 39 1.80 2.12 18 2 years 1999-2000 359 5623 16 8748 24 50 2.10 2.57 22 1 year
It is evident from the above table that tree density has increased. There was a 60% increase in tree density in 1997-98 regeneration areas, which proves that with the increase in years of protection there is a proportional upgradation in the status of degraded forests. Similarly the average growth of height of trees has been recorded highest i.e. 37 % in 1997-98 regeneration areas, which again proves the effect of the period of protection over the growth of tree stock. 10.2. Diversity of tree species The state of the health of forests depends a lot on the floristic composition and species diversity. Trees are in the top order of floristic composition of bio-diversity and hence it is a very important indicator. The following data highlights the species diversity in tree regeneration.
Year
Number of sample plots observed.
Average number of species observed per sample plot at baseline
Average number of species observed per sample plot at present
Percentage of increase in species diversity
Perio
d un
der
obse
rvat
ion
(Y
ear)
1997-98 151 11 14 27 3 1998-99 354 14 19 36 2 1999-2000 359 14 17 21 1
5
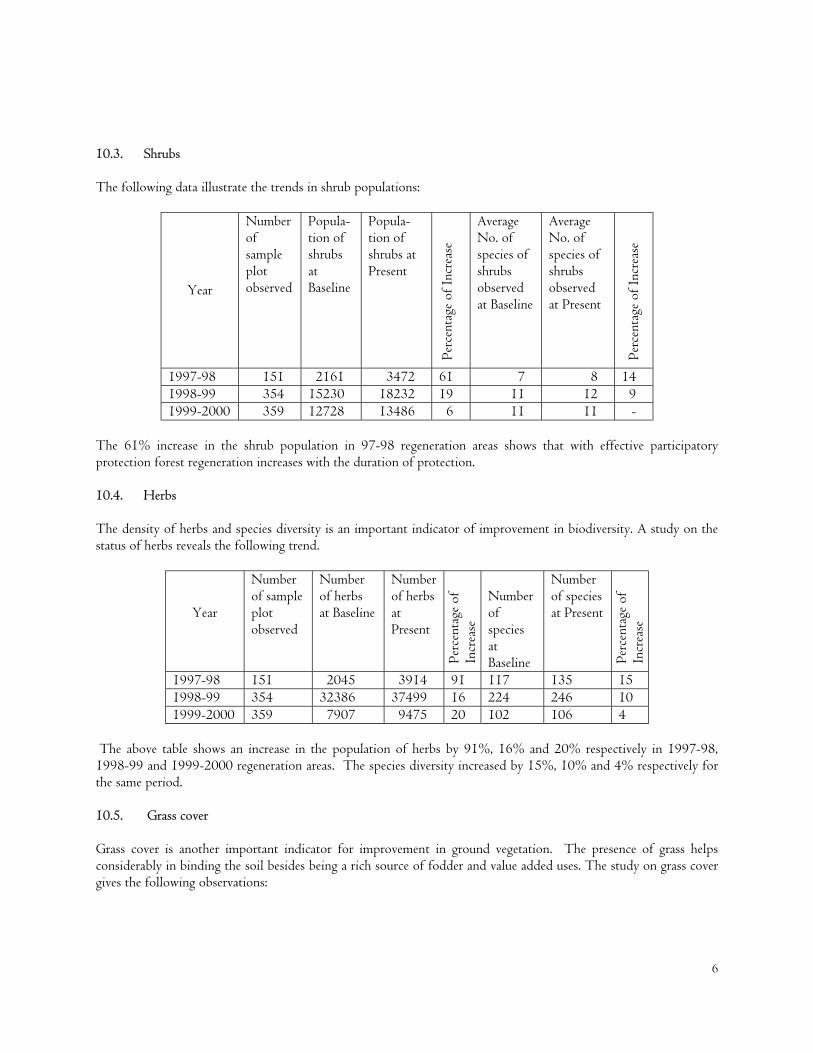
10.3. Shrubs The following data illustrate the trends in shrub populations:
Year
Number of sample plot observed
Popula-tion of shrubs at Baseline
Popula-tion of shrubs at Present
Perc
enta
ge o
f Inc
reas
e
Average No. of species of shrubs observed at Baseline
Average No. of species of shrubs observed at Present
Perc
enta
ge o
f Inc
reas
e
1997-98 151 2161 3472 61 7 8 14 1998-99 354 15230 18232 19 11 12 9 1999-2000 359 12728 13486 6 11 11 -
The 61% increase in the shrub population in 97-98 regeneration areas shows that with effective participatory protection forest regeneration increases with the duration of protection. 10.4. Herbs The density of herbs and species diversity is an important indicator of improvement in biodiversity. A study on the status of herbs reveals the following trend.
Year
Number of sample plot observed
Number of herbs at Baseline
Number of herbs at Present
Perc
enta
ge o
f In
crea
se
Number of species at Baseline
Number of species at Present
Perc
enta
ge o
f In
crea
se
1997-98 151 2045 3914 91 117 135 15 1998-99 354 32386 37499 16 224 246 10 1999-2000 359 7907 9475 20 102 106 4
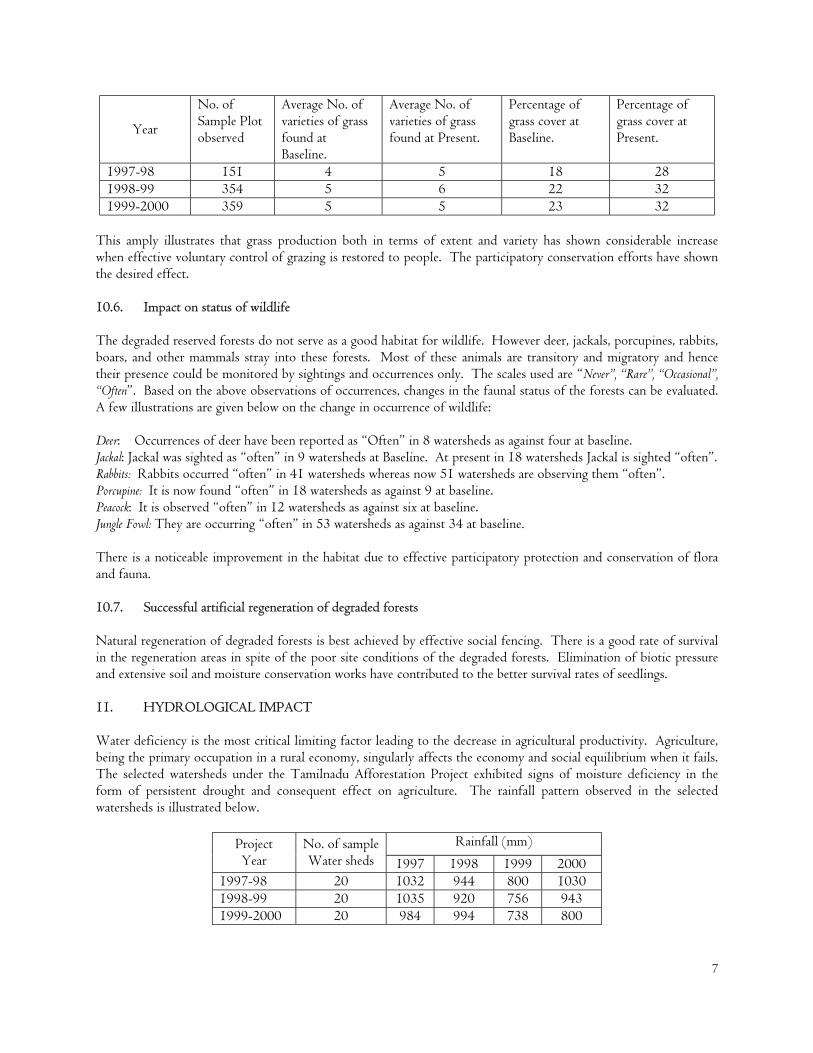
The above table shows an increase in the population of herbs by 91%, 16% and 20% respectively in 1997-98, 1998-99 and 1999-2000 regeneration areas. The species diversity increased by 15%, 10% and 4% respectively for the same period. 10.5. Grass cover Grass cover is another important indicator for improvement in ground vegetation. The presence of grass helps considerably in binding the soil besides being a rich source of fodder and value added uses. The study on grass cover gives the following observations:
6
Year
No. of Sample Plot observed
Average No. of varieties of grass found at Baseline.
Average No. of varieties of grass found at Present.
Percentage of grass cover at Baseline.
Percentage of grass cover at Present.
1997-98 151 4 5 18 28 1998-99 354 5 6 22 32 1999-2000 359 5 5 23 32
This amply illustrates that grass production both in terms of extent and variety has shown considerable increase when effective voluntary control of grazing is restored to people. The participatory conservation efforts have shown the desired effect. 10.6. Impact on status of wildlife The degraded reserved forests do not serve as a good habitat for wildlife. However deer, jackals, porcupines, rabbits, boars, and other mammals stray into these forests. Most of these animals are transitory and migratory and hence their presence could be monitored by sightings and occurrences only. The scales used are “Never”, “Rare”, “Occasional”, “Often”. Based on the above observations of occurrences, changes in the faunal status of the forests can be evaluated. A few illustrations are given below on the change in occurrence of wildlife: Deer: Occurrences of deer have been reported as “Often” in 8 watersheds as against four at baseline. Jackal: Jackal was sighted as “often” in 9 watersheds at Baseline. At present in 18 watersheds Jackal is sighted “often”. Rabbits: Rabbits occurred “often” in 41 watersheds whereas now 51 watersheds are observing them “often”. Porcupine: It is now found “often” in 18 watersheds as against 9 at baseline. Peacock: It is observed “often” in 12 watersheds as against six at baseline. Jungle Fowl: They are occurring “often” in 53 watersheds as against 34 at baseline. There is a noticeable improvement in the habitat due to effective participatory protection and conservation of flora and fauna. 10.7. Successful artificial regeneration of degraded forests Natural regeneration of degraded forests is best achieved by effective social fencing. There is a good rate of survival in the regeneration areas in spite of the poor site conditions of the degraded forests. Elimination of biotic pressure and extensive soil and moisture conservation works have contributed to the better survival rates of seedlings. 11. HYDROLOGICAL IMPACT Water deficiency is the most critical limiting factor leading to the decrease in agricultural productivity. Agriculture, being the primary occupation in a rural economy, singularly affects the economy and social equilibrium when it fails. The selected watersheds under the Tamilnadu Afforestation Project exhibited signs of moisture deficiency in the form of persistent drought and consequent effect on agriculture. The rainfall pattern observed in the selected watersheds is illustrated below.
Rainfall (mm) Project Year
No. of sample Water sheds 1997 1998 1999 2000
1997-98 20 1032 944 800 1030 1998-99 20 1035 920 756 943 1999-2000 20 984 994 738 800
7
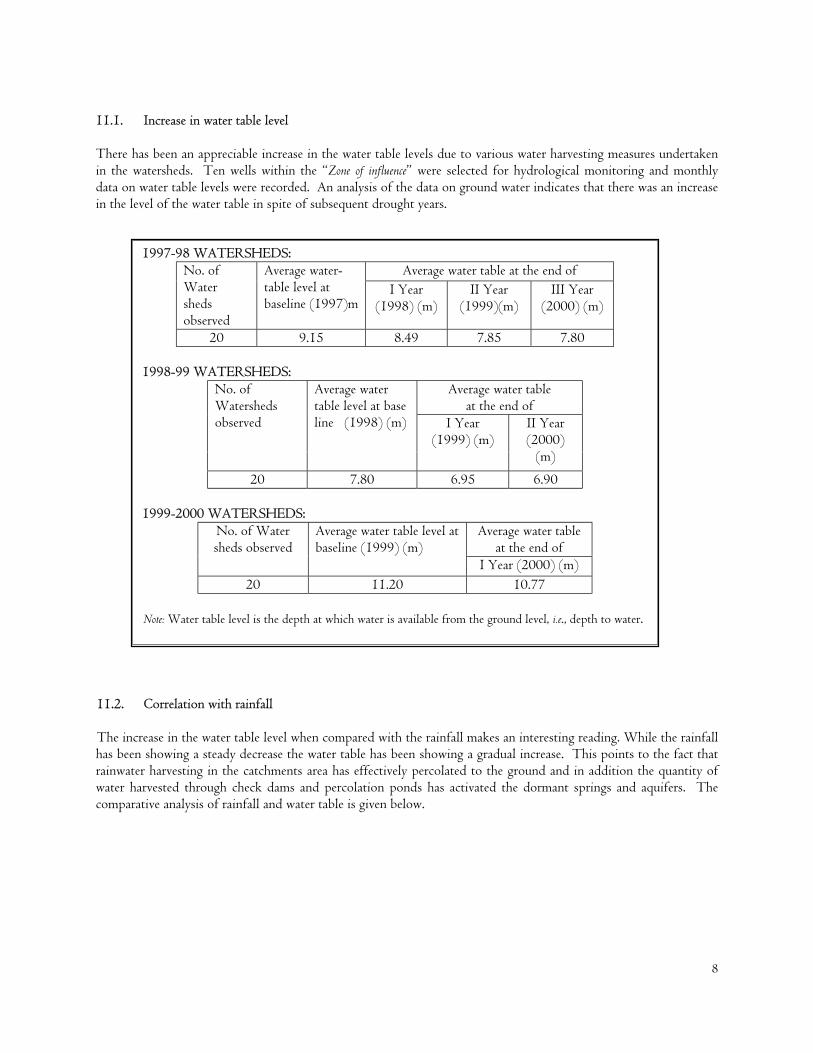
11.1. Increase in water table level There has been an appreciable increase in the water table levels due to various water harvesting measures undertaken in the watersheds. Ten wells within the “Zone of influence” were selected for hydrological monitoring and monthly data on water table levels were recorded. An analysis of the data on ground water indicates that there was an increase in the level of the water table in spite of subsequent drought years.
ater.
11.2. The inchas beerainwatwater hcompar
1997-98 WATERSHEDS: Average water table at the end of No. of
Water sheds observed
Average water-table level at baseline (1997)m
I Year (1998) (m)
II Year (1999)(m)
III Year (2000) (m)
20 9.15 8.49 7.85 7.80 1998-99 WATERSHEDS:
Average water table at the end of
No. of Watersheds observed
Average water table level at base line (1998) (m) I Year
(1999) (m) II Year (2000)
(m)
20 7.80 6.95 6.90 1999-2000 WATERSHEDS:
Average water table at the end of
No. of Water sheds observed
Average water table level at baseline (1999) (m)
I Year (2000) (m) 20 11.20 10.77
Note: Water table level is the depth at which water is available from the ground level, i.e., depth to w
Correlation with rainfall
rease in the water table level when compared with the rainfall makes an interesting reading. While the rainfall n showing a steady decrease the water table has been showing a gradual increase. This points to the fact that er harvesting in the catchments area has effectively percolated to the ground and in addition the quantity of arvested through check dams and percolation ponds has activated the dormant springs and aquifers. The ative analysis of rainfall and water table is given below.
8
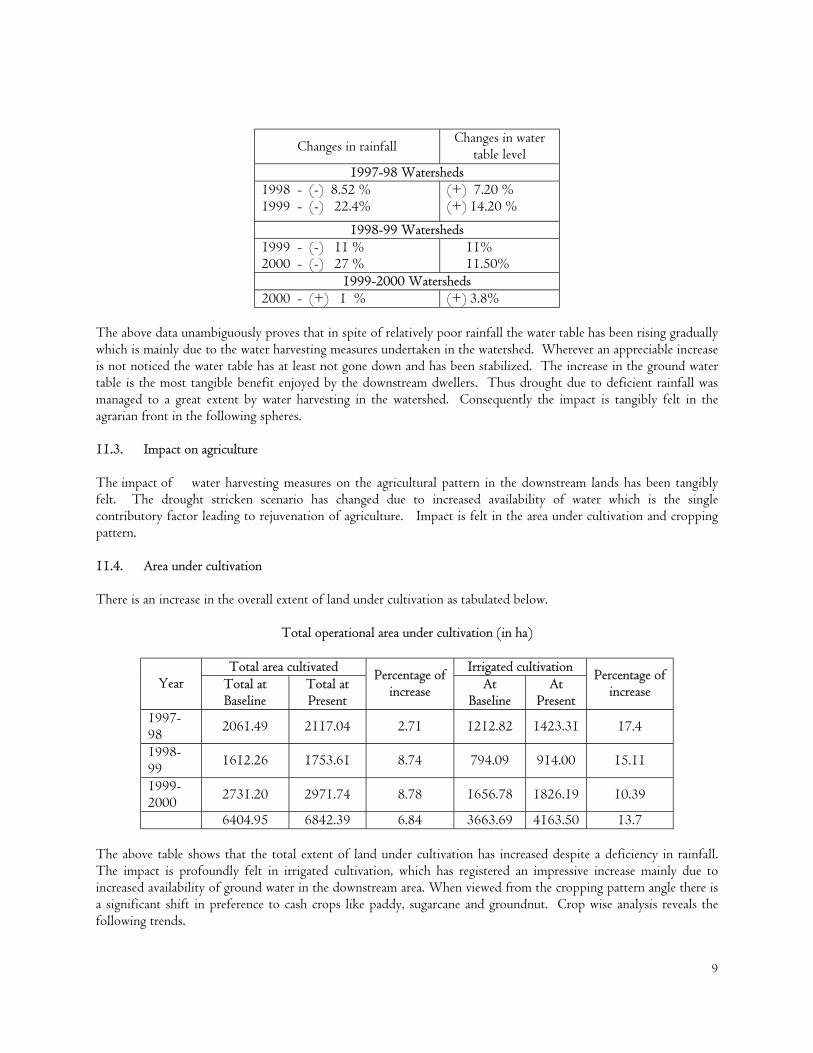
Changes in rainfall Changes in water table level
1997-98 Watersheds 1998 - (-) 8.52 % 1999 - (-) 22.4%
(+) 7.20 % (+) 14.20 %
1998-99 Watersheds 1999 - (-) 11 % 2000 - (-) 27 %
11% 11.50%
1999-2000 Watersheds 2000 - (+) 1 % (+) 3.8%
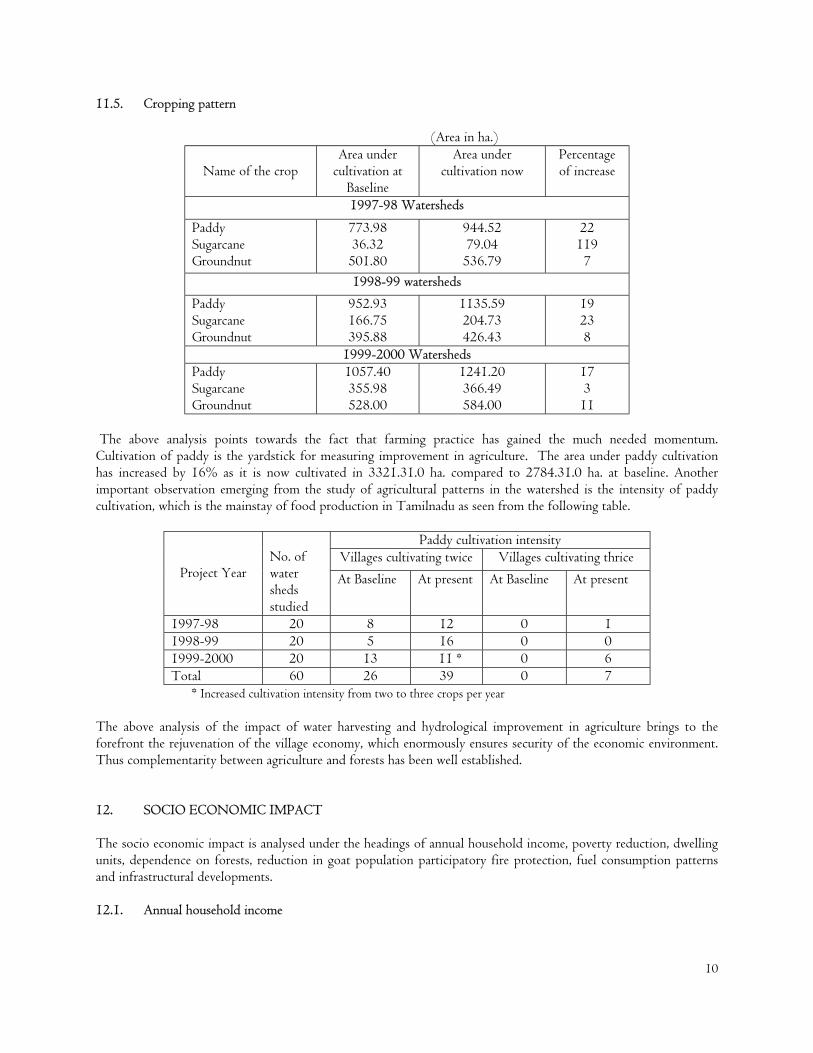
The above data unambiguously proves that in spite of relatively poor rainfall the water table has been rising gradually which is mainly due to the water harvesting measures undertaken in the watershed. Wherever an appreciable increase is not noticed the water table has at least not gone down and has been stabilized. The increase in the ground water table is the most tangible benefit enjoyed by the downstream dwellers. Thus drought due to deficient rainfall was managed to a great extent by water harvesting in the watershed. Consequently the impact is tangibly felt in the agrarian front in the following spheres. 11.3. Impact on agriculture The impact of water harvesting measures on the agricultural pattern in the downstream lands has been tangibly felt. The drought stricken scenario has changed due to increased availability of water which is the single contributory factor leading to rejuvenation of agriculture. Impact is felt in the area under cultivation and cropping pattern. 11.4. Area under cultivation There is an increase in the overall extent of land under cultivation as tabulated below.
Total operational area under cultivation (in ha)
Total area cultivated Irrigated cultivation Year Total at
Baseline Total at Present
Percentage of increase At
Baseline At
Present
Percentage of increase
1997-98 2061.49 2117.04 2.71 1212.82 1423.31 17.4
1998-99 1612.26 1753.61 8.74 794.09 914.00 15.11
1999-2000 2731.20 2971.74 8.78 1656.78 1826.19 10.39
6404.95 6842.39 6.84 3663.69 4163.50 13.7 The above table shows that the total extent of land under cultivation has increased despite a deficiency in rainfall. The impact is profoundly felt in irrigated cultivation, which has registered an impressive increase mainly due to increased availability of ground water in the downstream area. When viewed from the cropping pattern angle there is a significant shift in preference to cash crops like paddy, sugarcane and groundnut. Crop wise analysis reveals the following trends.
9
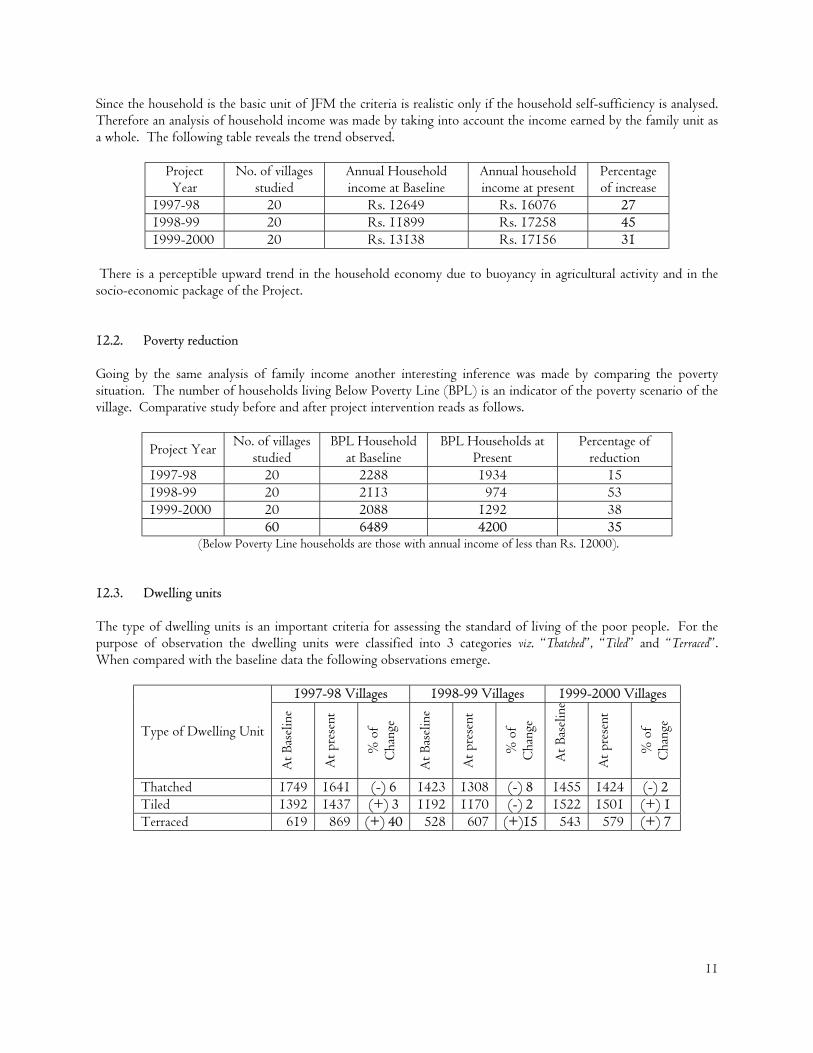
11.5. Cropping pattern (Area in ha.)
Name of the crop Area under
cultivation at Baseline
Area under cultivation now
Percentage of increase
1997-98 Watersheds
Paddy Sugarcane Groundnut
773.98 36.32
501.80
944.52 79.04
536.79
22 119
7 1998-99 watersheds
Paddy Sugarcane Groundnut
952.93 166.75 395.88
1135.59 204.73 426.43
19 23 8
1999-2000 Watersheds Paddy Sugarcane Groundnut
1057.40 355.98 528.00
1241.20 366.49 584.00
17 3
11 The above analysis points towards the fact that farming practice has gained the much needed momentum. Cultivation of paddy is the yardstick for measuring improvement in agriculture. The area under paddy cultivation has increased by 16% as it is now cultivated in 3321.31.0 ha. compared to 2784.31.0 ha. at baseline. Another important observation emerging from the study of agricultural patterns in the watershed is the intensity of paddy cultivation, which is the mainstay of food production in Tamilnadu as seen from the following table.
Paddy cultivation intensity Villages cultivating twice Villages cultivating thrice
Project Year
No. of water sheds studied
At Baseline At present At Baseline At present
1997-98 20 8 12 0 1 1998-99 20 5 16 0 0 1999-2000 20 13 11 * 0 6 Total 60 26 39 0 7
* Increased cultivation intensity from two to three crops per year The above analysis of the impact of water harvesting and hydrological improvement in agriculture brings to the forefront the rejuvenation of the village economy, which enormously ensures security of the economic environment. Thus complementarity between agriculture and forests has been well established. 12. SOCIO ECONOMIC IMPACT The socio economic impact is analysed under the headings of annual household income, poverty reduction, dwelling units, dependence on forests, reduction in goat population participatory fire protection, fuel consumption patterns and infrastructural developments. 12.1. Annual household income
10
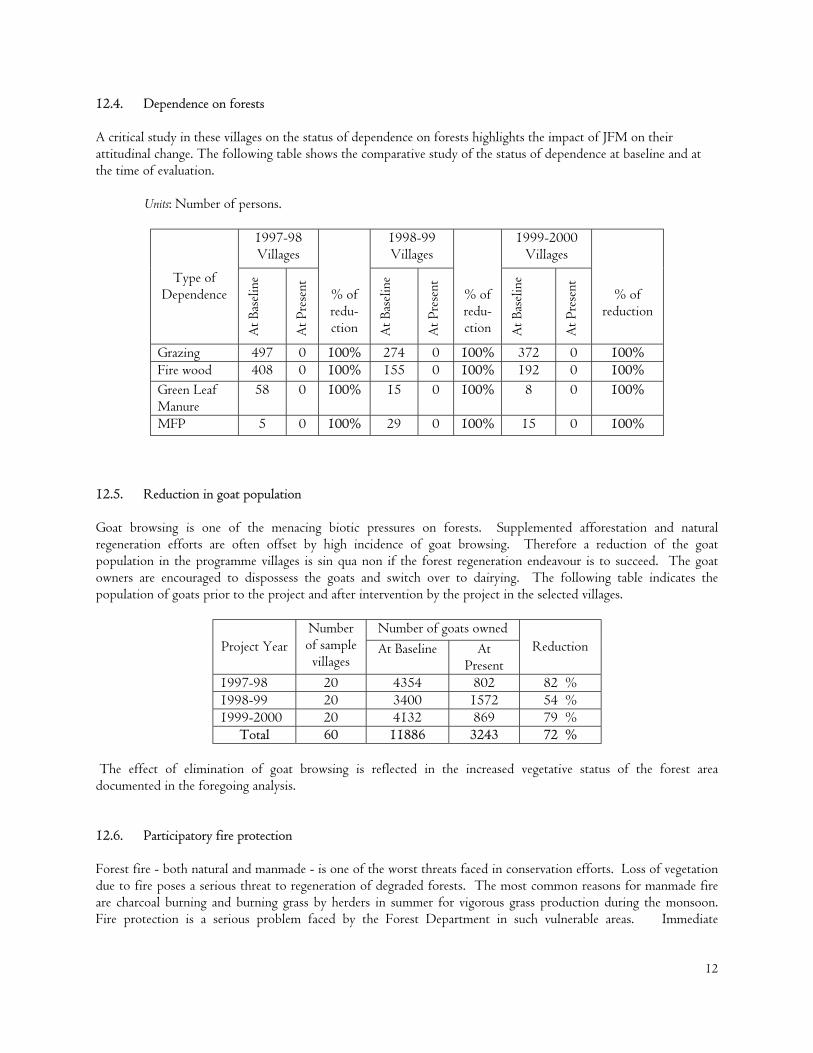
Since the household is the basic unit of JFM the criteria is realistic only if the household self-sufficiency is analysed. Therefore an analysis of household income was made by taking into account the income earned by the family unit as a whole. The following table reveals the trend observed.
Project Year
No. of villages studied
Annual Household income at Baseline
Annual household income at present
Percentage of increase
1997-98 20 Rs. 12649 Rs. 16076 27 1998-99 20 Rs. 11899 Rs. 17258 45 1999-2000 20 Rs. 13138 Rs. 17156 31
There is a perceptible upward trend in the household economy due to buoyancy in agricultural activity and in the socio-economic package of the Project. 12.2. Poverty reduction Going by the same analysis of family income another interesting inference was made by comparing the poverty situation. The number of households living Below Poverty Line (BPL) is an indicator of the poverty scenario of the village. Comparative study before and after project intervention reads as follows.
Project Year No. of villages studied
BPL Household at Baseline
BPL Households at Present
Percentage of reduction
1997-98 20 2288 1934 15 1998-99 20 2113 974 53 1999-2000 20 2088 1292 38 60 6489 4200 35
(Below Poverty Line households are those with annual income of less than Rs. 12000). 12.3. Dwelling units The type of dwelling units is an important criteria for assessing the standard of living of the poor people. For the purpose of observation the dwelling units were classified into 3 categories viz. “Thatched”, “Tiled” and “Terraced”. When compared with the baseline data the following observations emerge.
1997-98 Villages 1998-99 Villages 1999-2000 Villages
Type of Dwelling Unit
At B
asel
ine
At p
rese
nt
% o
f C
hang
e
At B
asel
ine
At p
rese
nt
% o
f C
hang
e
At B
asel
ine
At p
rese
nt
% o
f C
hang
e
Thatched 1749 1641 (-) 6 1423 1308 (-) 8 1455 1424 (-) 2 Tiled 1392 1437 (+) 3 1192 1170 (-) 2 1522 1501 (+) 1 Terraced 619 869 (+) 40 528 607 (+)15 543 579 (+) 7
11
12.4. Dependence on forests A critical study in these villages on the status of dependence on forests highlights the impact of JFM on their attitudinal change. The following table shows the comparative study of the status of dependence at baseline and at the time of evaluation.
Units: Number of persons.
1997-98 Villages
1998-99 Villages
1999-2000 Villages
Type of Dependence
At B
asel
ine
At P
rese
nt
% of redu-ction A
t Bas
elin
e
At P
rese
nt
% of redu-ction
At B
asel
ine
At P
rese
nt
% of reduction
Grazing 497 0 100% 274 0 100% 372 0 100% Fire wood 408 0 100% 155 0 100% 192 0 100% Green Leaf Manure
58 0 100% 15 0 100% 8 0 100%
MFP 5 0 100% 29 0 100% 15 0 100% 12.5. Reduction in goat population Goat browsing is one of the menacing biotic pressures on forests. Supplemented afforestation and natural regeneration efforts are often offset by high incidence of goat browsing. Therefore a reduction of the goat population in the programme villages is sin qua non if the forest regeneration endeavour is to succeed. The goat owners are encouraged to dispossess the goats and switch over to dairying. The following table indicates the population of goats prior to the project and after intervention by the project in the selected villages.
Number of goats owned Project Year
Number of sample villages
At Baseline At Present
Reduction
1997-98 20 4354 802 82 % 1998-99 20 3400 1572 54 % 1999-2000 20 4132 869 79 %
Total 60 11886 3243 72 % The effect of elimination of goat browsing is reflected in the increased vegetative status of the forest area documented in the foregoing analysis. 12.6. Participatory fire protection Forest fire - both natural and manmade - is one of the worst threats faced in conservation efforts. Loss of vegetation due to fire poses a serious threat to regeneration of degraded forests. The most common reasons for manmade fire are charcoal burning and burning grass by herders in summer for vigorous grass production during the monsoon. Fire protection is a serious problem faced by the Forest Department in such vulnerable areas. Immediate
12
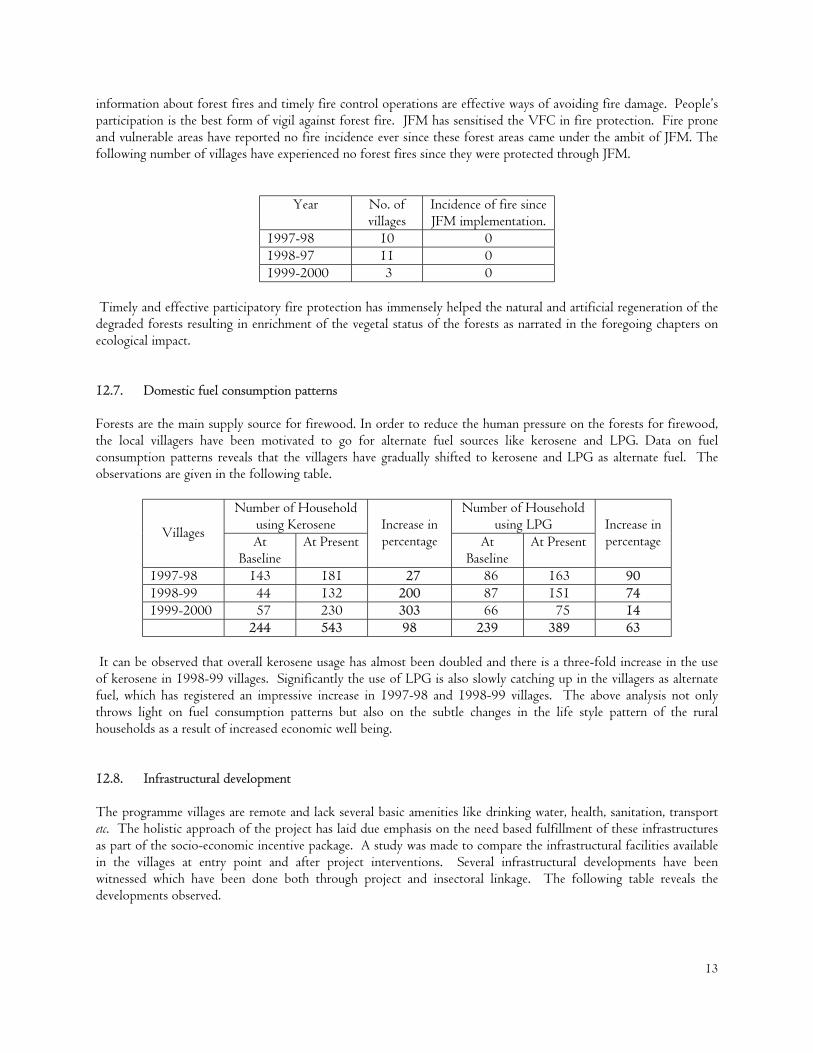
information about forest fires and timely fire control operations are effective ways of avoiding fire damage. People’s participation is the best form of vigil against forest fire. JFM has sensitised the VFC in fire protection. Fire prone and vulnerable areas have reported no fire incidence ever since these forest areas came under the ambit of JFM. The following number of villages have experienced no forest fires since they were protected through JFM.
Year No. of villages
Incidence of fire since JFM implementation.
1997-98 10 0 1998-97 11 0 1999-2000 3 0
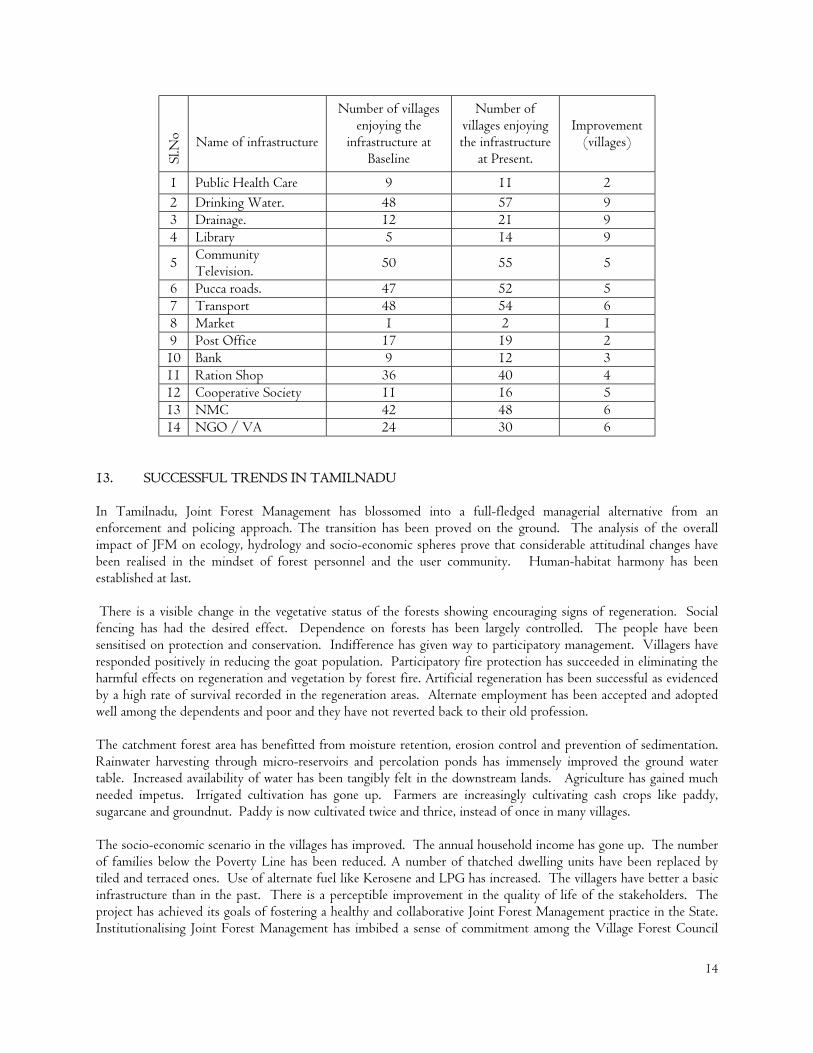
Timely and effective participatory fire protection has immensely helped the natural and artificial regeneration of the degraded forests resulting in enrichment of the vegetal status of the forests as narrated in the foregoing chapters on ecological impact. 12.7. Domestic fuel consumption patterns Forests are the main supply source for firewood. In order to reduce the human pressure on the forests for firewood, the local villagers have been motivated to go for alternate fuel sources like kerosene and LPG. Data on fuel consumption patterns reveals that the villagers have gradually shifted to kerosene and LPG as alternate fuel. The observations are given in the following table.
Number of Household using Kerosene
Number of Household using LPG Villages
At Baseline
At Present Increase in percentage At
Baseline At Present
Increase in percentage
1997-98 143 181 27 86 163 90 1998-99 44 132 200 87 151 74 1999-2000 57 230 303 66 75 14 244 543 98 239 389 63
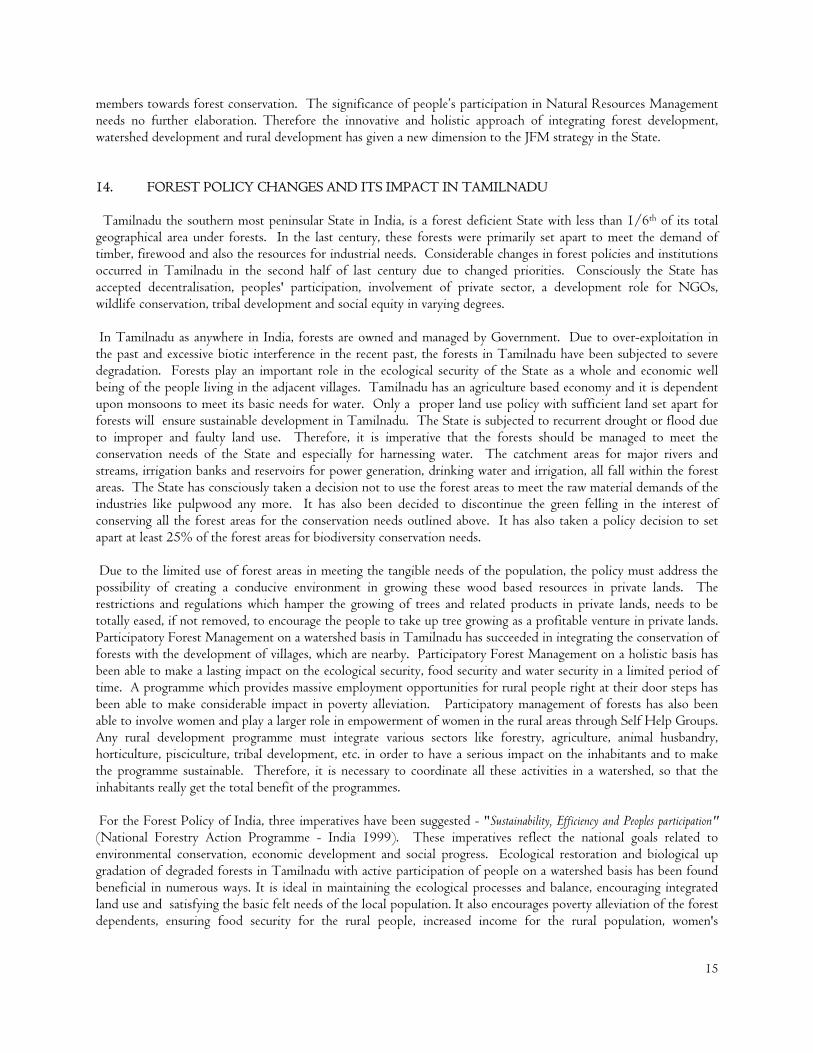
It can be observed that overall kerosene usage has almost been doubled and there is a three-fold increase in the use of kerosene in 1998-99 villages. Significantly the use of LPG is also slowly catching up in the villagers as alternate fuel, which has registered an impressive increase in 1997-98 and 1998-99 villages. The above analysis not only throws light on fuel consumption patterns but also on the subtle changes in the life style pattern of the rural households as a result of increased economic well being. 12.8. Infrastructural development The programme villages are remote and lack several basic amenities like drinking water, health, sanitation, transport etc. The holistic approach of the project has laid due emphasis on the need based fulfillment of these infrastructures as part of the socio-economic incentive package. A study was made to compare the infrastructural facilities available in the villages at entry point and after project interventions. Several infrastructural developments have been witnessed which have been done both through project and insectoral linkage. The following table reveals the developments observed.
13
Sl.N
o
Name of infrastructure
Number of villages enjoying the
infrastructure at Baseline
Number of villages enjoying the infrastructure
at Present.
Improvement (villages)
1 Public Health Care 9 11 2 2 Drinking Water. 48 57 9 3 Drainage. 12 21 9 4 Library 5 14 9
5 Community Television. 50 55 5
6 Pucca roads. 47 52 5 7 Transport 48 54 6 8 Market 1 2 1 9 Post Office 17 19 2
10 Bank 9 12 3 11 Ration Shop 36 40 4 12 Cooperative Society 11 16 5 13 NMC 42 48 6 14 NGO / VA 24 30 6
13. SUCCESSFUL TRENDS IN TAMILNADU In Tamilnadu, Joint Forest Management has blossomed into a full-fledged managerial alternative from an enforcement and policing approach. The transition has been proved on the ground. The analysis of the overall impact of JFM on ecology, hydrology and socio-economic spheres prove that considerable attitudinal changes have been realised in the mindset of forest personnel and the user community. Human-habitat harmony has been established at last. There is a visible change in the vegetative status of the forests showing encouraging signs of regeneration. Social fencing has had the desired effect. Dependence on forests has been largely controlled. The people have been sensitised on protection and conservation. Indifference has given way to participatory management. Villagers have responded positively in reducing the goat population. Participatory fire protection has succeeded in eliminating the harmful effects on regeneration and vegetation by forest fire. Artificial regeneration has been successful as evidenced by a high rate of survival recorded in the regeneration areas. Alternate employment has been accepted and adopted well among the dependents and poor and they have not reverted back to their old profession. The catchment forest area has benefitted from moisture retention, erosion control and prevention of sedimentation. Rainwater harvesting through micro-reservoirs and percolation ponds has immensely improved the ground water table. Increased availability of water has been tangibly felt in the downstream lands. Agriculture has gained much needed impetus. Irrigated cultivation has gone up. Farmers are increasingly cultivating cash crops like paddy, sugarcane and groundnut. Paddy is now cultivated twice and thrice, instead of once in many villages. The socio-economic scenario in the villages has improved. The annual household income has gone up. The number of families below the Poverty Line has been reduced. A number of thatched dwelling units have been replaced by tiled and terraced ones. Use of alternate fuel like Kerosene and LPG has increased. The villagers have better a basic infrastructure than in the past. There is a perceptible improvement in the quality of life of the stakeholders. The project has achieved its goals of fostering a healthy and collaborative Joint Forest Management practice in the State. Institutionalising Joint Forest Management has imbibed a sense of commitment among the Village Forest Council
14
members towards forest conservation. The significance of people’s participation in Natural Resources Management needs no further elaboration. Therefore the innovative and holistic approach of integrating forest development, watershed development and rural development has given a new dimension to the JFM strategy in the State. 14. FOREST POLICY CHANGES AND ITS IMPACT IN TAMILNADU Tamilnadu the southern most peninsular State in India, is a forest deficient State with less than 1/6th of its total geographical area under forests. In the last century, these forests were primarily set apart to meet the demand of timber, firewood and also the resources for industrial needs. Considerable changes in forest policies and institutions occurred in Tamilnadu in the second half of last century due to changed priorities. Consciously the State has accepted decentralisation, peoples' participation, involvement of private sector, a development role for NGOs, wildlife conservation, tribal development and social equity in varying degrees. In Tamilnadu as anywhere in India, forests are owned and managed by Government. Due to over-exploitation in the past and excessive biotic interference in the recent past, the forests in Tamilnadu have been subjected to severe degradation. Forests play an important role in the ecological security of the State as a whole and economic well being of the people living in the adjacent villages. Tamilnadu has an agriculture based economy and it is dependent upon monsoons to meet its basic needs for water. Only a proper land use policy with sufficient land set apart for forests will ensure sustainable development in Tamilnadu. The State is subjected to recurrent drought or flood due to improper and faulty land use. Therefore, it is imperative that the forests should be managed to meet the conservation needs of the State and especially for harnessing water. The catchment areas for major rivers and streams, irrigation banks and reservoirs for power generation, drinking water and irrigation, all fall within the forest areas. The State has consciously taken a decision not to use the forest areas to meet the raw material demands of the industries like pulpwood any more. It has also been decided to discontinue the green felling in the interest of conserving all the forest areas for the conservation needs outlined above. It has also taken a policy decision to set apart at least 25% of the forest areas for biodiversity conservation needs. Due to the limited use of forest areas in meeting the tangible needs of the population, the policy must address the possibility of creating a conducive environment in growing these wood based resources in private lands. The restrictions and regulations which hamper the growing of trees and related products in private lands, needs to be totally eased, if not removed, to encourage the people to take up tree growing as a profitable venture in private lands. Participatory Forest Management on a watershed basis in Tamilnadu has succeeded in integrating the conservation of forests with the development of villages, which are nearby. Participatory Forest Management on a holistic basis has been able to make a lasting impact on the ecological security, food security and water security in a limited period of time. A programme which provides massive employment opportunities for rural people right at their door steps has been able to make considerable impact in poverty alleviation. Participatory management of forests has also been able to involve women and play a larger role in empowerment of women in the rural areas through Self Help Groups. Any rural development programme must integrate various sectors like forestry, agriculture, animal husbandry, horticulture, pisciculture, tribal development, etc. in order to have a serious impact on the inhabitants and to make the programme sustainable. Therefore, it is necessary to coordinate all these activities in a watershed, so that the inhabitants really get the total benefit of the programmes. For the Forest Policy of India, three imperatives have been suggested - "Sustainability, Efficiency and Peoples participation" (National Forestry Action Programme - India 1999). These imperatives reflect the national goals related to environmental conservation, economic development and social progress. Ecological restoration and biological up gradation of degraded forests in Tamilnadu with active participation of people on a watershed basis has been found beneficial in numerous ways. It is ideal in maintaining the ecological processes and balance, encouraging integrated land use and satisfying the basic felt needs of the local population. It also encourages poverty alleviation of the forest dependents, ensuring food security for the rural people, increased income for the rural population, women's
15
participation and emancipation in the villages nearby, meeting the most basic infrastructural necessities of the villagers, social equity and above all total changes in the attitudes of forest personnel and the community towards each other. Neither development, nor conservation could be achieved in isolation and forestry as a form of land use in this forest deficient state has proved that participatory natural resource management with conservation as the primary objective can achieve development and conservation if both are integrated at the basic level. 15. CONCLUSION The successful implementation of JFM as a new managerial alternative in Tamilnadu should give no scope for complacency. There are still vast challenges to be addressed. It is hoped all the experiences gathered in the process will ultimately benefit the management of complexities involved in Natural Resources and help mankind to live in harmony with Nature and sustain the human race on Earth forever. Coming together is beginning. Keeping together is progress. Working together is success. REFERENCES Anon. (1996) Tamilnadu Afforestation Project – Project document – Tamilnadu Forest Department, Chennai Anon. (1998) Summary report for Inter-Governmental Forum on Forests, August 1998.
Anon. (1999) National Forestry Action Programme – India – Ministry of Environment & Forests, Government of India . (PP.59 – 63)
Anon. (2000) Imprints of JFM in Tamilnadu – An impact study – Tamilnadu Forest Department.
Anon. (2001) A handbook on rainwater harvesting technique - State ground and Surface Water Resource Data Centre. Chennai, Tamilnadu.
Anon. (2002) Proceedings of the Workshop on Joint Forest Management and Watershed Development held on 21st and 22nd January 2002 at Chennai – Tamilnadu Forest Department.
Pachauri, R.K. (1997) Population, Environment and Development – (Tata Energy Research Institute, New Delhi - 3)
Singh, T.P.et al. (1998) The decade and beyond - Evolving Community – State partnership - TERI, New Delhi.
Sreedharan, C.K.(2002) Workshop on Joint Forest Management and Watershed Development held on 21st and 22nd January 2002 at Chennai. (PP.1-25)
Suhas parangpe, et al. (1998) Watershed based development - A source book Bharath Gyan Vigyan Samithi, New Delhi - 66.
16