an integrated ergonomics framework for evaluation and
TRANSCRIPT
1
An Integrated Ergonomics Framework for Evaluation and Design of 1
Construction Operations 2
3
Alireza Golabchi1, Xingzhou Guo2, Meiyin Liu3, SangUk Han4, SangHyun Lee5, and Simaan 4
AbouRizk6 5
1 Ph.D. Candidate, Dept. of Civil and Environmental Engineering, Univ. of Alberta, 9211 116th 6
St., Edmonton, AB, Canada T6G 1H9. E-mail: [email protected] 7
2 Ph.D. Student, Dept. of Civil and Environmental Engineering, Univ. of Alberta, 9211 116th St., 8 Edmonton, AB, Canada T6G 1H9. E-mail: [email protected] 9
3 Ph.D. Student, Dept. of Civil and Environmental Engineering, Univ. of Michigan, 2350 Hayward 10
St., Suite 2340 G.G. Brown Building, Ann Arbor, MI, USA 48109. E-mail: [email protected] 11
4 Assistant Professor, Dept. of Civil and Environmental Engineering, Hanyang Univ., 222 12
Wangsimni-ro, Seongdong-gu, Seoul, Korea, 133-791. E-mail: [email protected] 13
5 Associate Professor, Dept. of Civil and Environmental Engineering, Univ. of Michigan, 2350 14 Hayward St., Suite 2340 G.G. Brown Building, Ann Arbor, MI, USA 48109. E-mail: 15
5 Professor, Dept. of Civil and Environmental Engineering, Univ. of Alberta, 5-080 Markin 17
CNRL Natural Resources Engineering Facility, Edmonton, Alberta, Canada T6G 2W2. E-mail: 18 [email protected] 19
20
Abstract 21
Labor is one of the most critical resources in the construction industry due to its impact on the 22
productivity, safety, quality, and cost of a construction project. Ergonomic assessment, as a tool 23
and method for analyzing human activities and their interactions with the surrounding 24
environment, is thus crucial for designing operations and workplaces that achieve both high 25
productivity and safety. In construction, however, the constantly changing work environments and 26
laborious tasks cause traditional approaches to ergonomic analysis, such as manual observations 27
and measurements, to require substantial time and effort to yield reliable results. Therefore, to 28
simplify and automate the assessment processes, this study explores the adaptation and integration 29
of various existing methods for data collection, analysis, and output representation potentially 30
available for comprehensive ergonomic analysis. The proposed framework integrates sensing for 31
data collection, action recognition and simulation modeling for productivity and ergonomic 32
analysis, and point cloud model generation and human motion animation for output visualization. 33
The proposed framework is demonstrated through a case study using data from an off-site 34
construction job site. The results indicate that integrating the various techniques can facilitate the 35
assessment of manual operations and thereby enhance the implementation of ergonomic practices 36

2
during a construction project by reducing the time, effort, and complexity required to apply the 37
techniques. 38
Keywords 39
Ergonomics, sensing, simulation, visualization, action recognition, point cloud generation. 40
1 INTRODUCTION 41
Since the construction industry is labor-intensive, worker activities can significantly affect the 42
success of construction operations. Labor is one of the most crucial resources (Jarkas and Bitar 43
2011; Muqeem et al. 2012) and has the highest direct impact on the outcomes of a project, 44
including time, cost, and quality (Leung et al. 2012). Labor can account for nearly half the overall 45
costs of a project (El-Gohary and Aziz 2013) and is highly associated with construction 46
productivity, which is one of the most important and frequently used performance indicators in the 47
industry (CII 2006). Furthermore, labor operations in construction involve physically demanding 48
motions and tasks that frequently expose workers to risk in their working environments, leading 49
to a rate of injuries and fatalities that are among the highest of any industry (Behm 2005; OHS 50
2017; Zhou et al. 2015). 51
As an approach to human-oriented work design, ergonomics is the study of human interactions 52
with the surrounding environment with the intent to improve human safety and well-being, as well 53
as productivity (IEA 2017; Dul and Neumann 2009; van Deursen et al. 2005; Hedge and Sakr 54
2005). An effective and comprehensive ergonomic analysis involves evaluating ongoing 55
operations and proposing modifications and new designs that fit jobs and work environments to 56
worker capabilities and limitations. Accordingly, the implementation of ergonomic principles can 57
contribute to the success of a construction project by providing workers with comfortable working 58
environments in which work procedures and tools are designed for safe and productive use. 59
However, conducting an ergonomic analysis often requires extensive time and effort to yield 60
reliable results as the data collection and evaluation involve human observations and 61
measurements. This is particularly true in the dynamic environment of construction job sites, 62
which involve many physically demanding manual tasks that create vast amounts of data to collect, 63
analyse, and represent (Tak et al. 2011; Golabchi et al. 2016a). Furthermore, the variety of tasks 64
and postures required of workers necessitates methods for collecting and analyzing data that can 65
address human error; the resulting low reliability of the analysis inputs and outputs make 66
completing a meaningful ergonomic evaluation difficult (Kadefors and Forsman 2000; David 67
2005; Golabchi et al. 2017c). Reliable and detailed visual representations of the analysis outputs 68
can greatly improve the implementation of interventions or new workplace designs. Accordingly, 69
the development and use of methods to automate, simplify, and increase the accuracy of data 70
collection, analysis, and output representation could enable effective and comprehensive 71
ergonomic evaluations. Furthermore, integrating such methods into an overall framework would 72
potentially enhance the implementation of ergonomic practices at actual construction job sites by 73
3
minimizing the need for experts, decreasing the time and effort required for analysis, and reducing 74
the complexity of applying the various methods. 75
Therefore, this study proposes a framework to integrate different methods for evaluating and 76
designing manual construction operations to achieve a more unified and reliable ergonomic 77
analysis. The framework and its modules are presented with a focus on linking the different 78
components together. A manual operation at an actual job site is then used to implement the 79
proposed approach and evaluate its effectiveness. 80
2 BACKGROUND 81
2.1 Limitations of Manual Observation–based Ergonomic Analyses 82
A complete ergonomic analysis involves evaluating the motions and postures of workers and the 83
physical attributes of a job site to assess current work conditions and propose new designs for 84
manual operations (e.g., safe motions) and workplaces (e.g., workstation dimensions). To carry 85
out such an assessment, an ergonomist generally needs to complete three stages: (i) data collection, 86
(ii) data analysis, and (iii) interpretation and representation of results. 87
Prior to data collection, the ergonomist has to design the experiments and define the strategy based 88
on the particular conditions of the work being analyzed. After planning the procedure, which 89
enables identifying the methods to be implemented and the required inputs for each, relevant data 90
is gathered, traditionally, through observing the subjects (e.g., anthropometry, posture), their 91
motions while working (e.g., leaning, bending), and the attributes of the work environment (e.g., 92
workbench, tools, equipment). The inputs of an ergonomic assessment thus include various types 93
of data, such as the distance between a worker and a necessary tool or material, or the joint angles 94
between different body parts, which are often challenging to observe simultaneously. Typically, 95
an ergonomist either visits a job site to collect the required data in real-time or uses video 96
recordings to extract the inputs later (David 2005). In both cases, such a procedure results in 97
subjectivity in the collected inputs introduced by the ergonomist’s personal judgement (Golabchi 98
et al. 2017c). Although this traditional approach can work effectively in static workplaces, such as 99
offices and manufacturing assembly lines, it can produce unreliable data at construction job sites 100
because of the variety of manual tasks performed, complexity of exposures, and constantly 101
changing work environment (Kadefors and Forsman 2000; Golabchi et al. 2016c). 102
After data collection is complete, the ergonomist uses the gathered data to conduct an ergonomic 103
evaluation using tools such as ergonomic assessment checklists (e.g., RULA (McAtamney and 104
Corlett 1993), ROSA (Sonne et al. 2012)) and time and motion studies (e.g., MTM (Maynard et 105
al. 1948), MOST (Zandin 2002)). To complete this step, the ergonomist inputs the data into the 106
tools, which use a set of predefined rules to produce the output of the analysis. For example, 107
inputting a worker’s posture (i.e., joint angles) along with the frequency and duration of exposure 108
allows posture-based tools to report on the level of ergonomic risk associated with a task. Also, 109
using inputs that describe working conditions (e.g., walking distance, motions involved), time and 110
4
motion systems (e.g., predetermined motion time systems) provide the standard duration for a task 111
(Golabchi et al. 2016b). However, similar to the challenges presented to data collection, manual 112
analysis of construction tasks can be inefficient since job sites and the motions required change 113
every day. 114
Following data analysis, the ergonomist interprets and represents the gathered data and analysis 115
results to illustrate how any modifications should be implemented and address any discovered 116
risks. Traditionally, this involves reports that reflect the ergonomist’s conclusions from the 117
analysis and state any modifications suggested by the outputs from the checklists and tools used. 118
Typically, those reports include only whether the level of ergonomic risk associated with a task is 119
acceptable, moderate, or unacceptable based on the inputs provided. Such reports are thus limited 120
data representations that do not allow re-evaluation of the proposed changes and designs because 121
of the difficulty of assessing a non-observable task on a job site that does not yet exist (Laring et 122
al. 2002). Furthermore, the traditional report-based approach does not offer managers a tool for 123
practical decision-making, nor does it provide an effective means to accurately implement the 124
proposed modifications or train the personnel involved. This approach also makes it difficult to 125
effectively assess other ergonomic variables (e.g., clearance, vision) when modifying the design 126
of a workplace. 127
Thus, the three stages of a thorough ergonomic analysis could be improved by adapting and 128
integrating existing methods through automation to both enhance different aspects of the analysis 129
and connect them to provide a more reliable and simplified assessment. The different stages of an 130
evaluation, including data acquisition through sensing, productivity and safety analysis of the 131
obtained data, and representation of the results through visualization, are shown in Table 1. For 132
each stage, the research areas that could be beneficial for evaluation of manual operations and 133
workplace design are identified as components of the framework, and both the input used for each 134
component and its output are shown. The inputs and outputs show the connections among the 135
different elements and indicate how data can be transitioned through the different components for 136
an accurate and automated analysis. 137
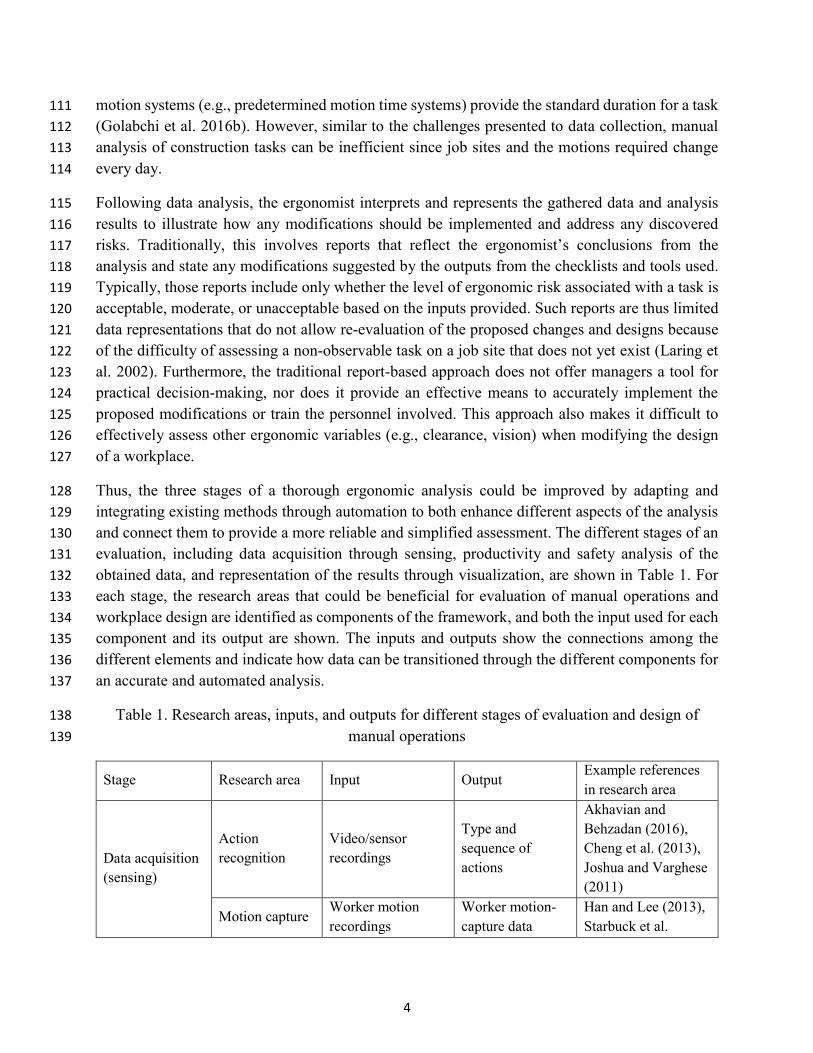
Table 1. Research areas, inputs, and outputs for different stages of evaluation and design of 138
manual operations 139
Stage Research area Input Output Example references
in research area
Data acquisition
(sensing)
Action
recognition
Video/sensor
recordings
Type and
sequence of
actions
Akhavian and
Behzadan (2016),
Cheng et al. (2013),
Joshua and Varghese
(2011)
Motion capture Worker motion
recordings
Worker motion-
capture data
Han and Lee (2013),
Starbuck et al.
5
(2014), Ray and
Teizer (2012)
3D
reconstruction
Photo/video of job
site
As-is point cloud
model
Rashidi et al. (2015),
Fathi and Brilakis
(2011), Guo et al.
(2016)
Analysis
Simulation
modeling Action recognition
Operation
efficiency
Seo et al. (2016),
Golabchi et al.
(2016b)
Motion
generation
Golabchi et al.
(2016a), Golabchi et
al. (2015a)
Biomechanical
analysis Motion capture Level of safety
Seo et al. (2014),
Mehta and Agnew
(2010), Golabchi et
al. (2015b)
Representation
(visualization)
Motion
generation
Simulation
modeling Worker motions
Wei et al. (2011),
Taylor et al. (2007),
Golabchi et al.
(2017b)
Path planning Start and end
location of motion
Animation of
worker motions
Yao et al. (2010),
Wu et al. (2007),
Pettré et al. (2002)
Visualization
3D reconstruction
Complete virtual
model
Al-Hussein et al.
(2006),
Budziszewski et al.
(2011), Golabchi et
al. (2015b)
Motion generation
140
As shown in Table 1, many researchers have worked on different elements that can contribute to 141
an ergonomic evaluation of labor operations and workplace design. However, many of the previous 142
studies have focused on methods developed for a different purpose (e.g., 3D reconstruction for 143
progress monitoring, action recognition for productivity measurements). As a result, different 144
methods require different types of inputs which can hinder efficient data sharing between the 145
methods. Thus, further investigation is required to understand the inputs and outputs of the existing 146
methods and the potential transition of data among them to enable their integration and achieve a 147
comprehensive ergonomic analysis framework. 148
2.2 Integrated Ergonomic Analysis 149
To carry out a thorough ergonomic analysis, information about the effects of physical activities on 150
a worker’s body needs to be available. Main contributors to those effects are the type, duration, 151
and sequence of manual tasks. Although this information can be collected through time studies, 152

6
they are time-consuming and challenging to conduct for many manual construction operations. 153
Furthermore, those data are difficult to gather when designing new operations for new or 154
prospective workplaces. As a result, ergonomists rely on human judgment and estimates in 155
acquiring data, which can lead to unreliable information. This issue can be addressed through 156
linking simulation modeling with action recognition. The use of video cameras for action 157
recognition can automatically identify the type, duration, and sequence of activities. The results 158
can then be used to create a simulation model for the operation that can be used to test any required 159
modifications to the operation design. Furthermore, integrating Predetermined Motion Time 160
Systems (PMTSs), which enable calculating the standard duration of a manual task based on the 161
movements involved, into the simulation environment allows not-yet-existing scenarios to be 162
conveniently modeled and explored. Previous research has used sensing devices to identify 163
different types of activities and tasks for applications such as operation analysis, work rate 164
measurement, and productivity monitoring (Gong et al. 2011; Kim and Caldas 2013; Escorcia et 165
al. 2012). Furthermore, simulation modeling has been used extensively in different phases of 166
construction for planning, budgeting, design, maintenance, etc. (Ozcan-Deniz and Zhu 2015; 167
Corona-Suárez et al. 2014; Yang et al. 2012). Despite the effectiveness of these methods, linking 168
video-based action recognition to PMTS-based simulation modeling to enable reliable and 169
automated creation of simulation models for ergonomic analysis has not yet been fully explored. 170
Another main contributor to an operation’s level of safety is the posture and motions of the 171
workers. While ergonomic and biomechanical tools rely on such information for their evaluations, 172
watching a worker carrying out the tasks to obtain the required inputs (e.g., body joint angles) is 173
time-consuming and can produce low-reliability results. On the other hand, Digital Human 174
Modeling (DHM) technologies are developed and used in manufacturing industries with the 175
intention to generate virtual representations of human models to design and evaluate equipment 176
and work environments without requiring physical mock-ups (Zhang and Chaffin 2005; Duffy 177
2008; Sundin and Örtengren 2006; Chaffin 2008). DHM tools are effectively used in these 178
industries for modeling of stationary work stations and repetitive tasks as well as evaluation of 179
visual ergonomic risk factors. However, the dynamic nature of construction job sites and the 180
diversity of its laborious tasks still calls for the adoption of tools and methods tailored to the needs 181
of the industry, that can address challenges such as the time and effort required for data acquisition 182
and analysis, as well as the reliability of the results. Accordingly, the use of motion-capture data, 183
recorded using sensing devices (e.g., depth sensors, stereo cameras), can greatly simplify data 184
capture and improve data accuracy (Seo et al. 2014; Han and Lee 2013; Ray and Teizer 2012). 185
Furthermore, motion data can be used in conjunction with 3D models of the work environment to 186
visualize an operation and provide a virtual platform for managerial decision-making, 187
implementation of designs, training, etc., as well as assessment of ergonomic variables such as 188
clearance, visibility, fit, and reach. Connecting motion data with simulation models of operations 189
can also be used to generate the motions of proposed operations for a more effective visualization. 190

7
Creating an effective and complete virtual model to represent the results of an analysis requires 191
3D models of the different components of the current conditions on a job site. However, given the 192
dynamic nature of construction sites, creating and updating as-is models using only 3D modeling 193
tools and software is unfeasible. Therefore, previous work has focused on generating point-cloud 194
models of work environments (Golparvar-Fard et al. 2011; Fathi and Brilakis 2011; El-Omari and 195
Moselhi 2008; Pučko and Rebolj 2017). Cameras can be simply and inexpensively used to create 196
as-is point cloud models of the work environment, replacing the need to manually create 197
complicated models. Integrating such a model into a visualization environment that includes other 198
components, such as building information modeling (BIM) elements and worker motions, can 199
provide a robust, reliable, and complete virtual model, which has not yet been examined to its full 200
potential. Furthermore, worker models need to be connected to the other 3D elements in the virtual 201
model to enable animating the worker motions along a path that does not collide with other objects 202
and is also a realistic representation of worker motions and paths on an actual job site. Thus, there 203
is a need to implement an automated path-planning algorithm inside the visualization to enable 204
accurate animation of worker models and motions. 205
As there is a high correlation between safety and productivity (Hallowell 2011) and an ergonomic 206
analysis works to improve both health and productivity, the effects of safety interventions on 207
productivity and vice versa have to be considered for an analysis and design to be effective. 208
Integrating methods that can measure productivity (e.g., PMTS-based simulation modeling) with 209
methods that evaluate safety (e.g., motion capture-based ergonomic and biomechanical 210
assessments) and representing them using inclusive virtual models (i.e. point cloud models in 211
conjunction with worker motions) will thus enable the analysis of different scenarios in terms of 212
both productivity and safety to select the best option. 213
3 METHODS 214
This study proposes and tests an integrated framework that couples data acquisition and 215
visualization with analysis of manual operations to enable an effective evaluation of those manual 216
operations for a comprehensive ergonomic analysis. Specifically, the objectives are: (1) exploring 217
the data associated with the various sensing, analysis, and visualization methods, (2) examining 218
the possibility and applicability of sharing data among those different methods, and (3) testing the 219
feasibility and effectiveness of integrating the various methods. 220
The proposed framework and its components are shown in Figure 1. As shown in the figure, the 221
framework is composed of three main modules: simulation, as-is modeling, and safety assessment. 222
The analysis starts by gathering information about conditions in the work environment through 223
sensing. Videos of worker activities are recorded, and then an action recognition process extracts 224
the type, sequence, and duration of tasks used to build a simulation model of the operation. The 225
simulation model serves to evaluate the productivity of the operation, as well as to generate worker 226
motions for animation in the final virtual model. On the other hand, photos or videos of the job 227
site are also used to create an as-is point cloud model of the work environment. Other 3D modeling 228
8
elements (e.g., worker models, material, equipment, and tools not existing in the as-is 229
representation)—created using other 3D modeling platforms or inherited from previous designs—230
can be added to the model and be used to run a path planning algorithm that enables a realistic 231
representation of worker motions in the virtual environment. Worker motion data are also captured 232
and used for a precise, automated, biomechanical assessment, and worker motions and workplace 233
design are updated based on the results. The outputs of the modules are used to create a complete 234
virtual model of the manual operations, which can be used for various visualization applications 235
(e.g., communication and implementation of design, decision making, and training). 236

9
237
Figure 1. Framework for integrated analysis of manual operations 238
RGB camera
Laser scanner
Sensing
Motion capture system Stereo vision camera
Depth sensor Wearable sensor
Video of worker
activities
Video file
Job site photos/videos
/laser scans
Photo, video, XYZ
file
Worker motion
recordings
Motion capture
data
Virtual model of job site, worker, and safe motions
Visualization
As-is
Modeling
Worker model and path planning in virtual model
Point cloud, BIM, 3D model of workplace
Simulation
Module
Activity type, sequence,
and duration
Simulation model of operation
Generated motions of labor operations
Trace message
Motion origin and
destination
3D modeling software
Unsafe motions
and tasks
Motion capture
data
Safety
Assessment
Biomechanical analysis of motions
Improved design of labor tasks
3D model of
workplace and worker
3D modeling software
Worker motion
animation
Motion capture
data
Safe labor operations
Motion capture
data
Input/ output
Data format
Legend

10
3.1 Simulation Module 239
To create a simulation model of a manual operation and analyze its operational efficiency, either 240
human observation or sensing methods have to be used to gather the required inputs (e.g., types of 241
tasks, activity durations). Human observation typically not only requires time, effort, and expertise 242
but also can be subjective. To address this issue, among various sensing methods including high-243
end sensors, the action recognition approach in this study uses video recordings from ordinary 244
cameras to identify the type, sequence, and duration of different manual tasks. The action 245
recognition method, adapted with modifications from the authors’ previous work (Liu et al. 2016), 246
recognizes the activity type for each frame and estimates the activity duration (Figure 2). Every 247
frame is described using a feature vector and classified to specific activity types based on its 248
similarity to samples in a training dataset. Here, the feature vector including a histogram of the 249
silhouette and of the optical flow, is primarily derived from the extracted human silhouette and the 250
pixel-wise direction and magnitude of its movements (Tran and Sorokin 2008). The similarity 251
between feature vectors is then obtained by calculating the Euclidean distance between feature 252
vectors of two action samples. The frame-wise action is initially recognized by a classification 253
method, namely the K-nearest neighbor (Peterson 2009). Given training frames as action 254
templates, the unknown action in the testing frame is identified as the one with the greatest 255
similarity to the template. With an initial estimate for every frame, the activity sequence is 256
optimized by an enforced temporal constraint, based on the shortest duration possible for an 257
activity. The temporal optimization module enables assessing the initial estimate from the result 258
of frame-by-frame action classification (i.e. classifying the feature vector to a specific action) and 259
correcting the detected noise frames to optimized ones. Consecutive frames are detected as noises 260
if the duration (i.e. number of consecutive frames) exceeds the minimally feasible duration of a 261
specific action (e.g., three seconds). With the optimized action recognition result, the duration of 262
each task is calculated by counting the number of frames given the video frame rate (e.g., 30 fps). 263
264
Figure 2. Action recognition from video recordings 265
The result of the action recognition process, aiming to estimate the duration of the different actions, 266
is linked to a discrete-event simulation modeling environment called Symphony (Hajjar and 267
11
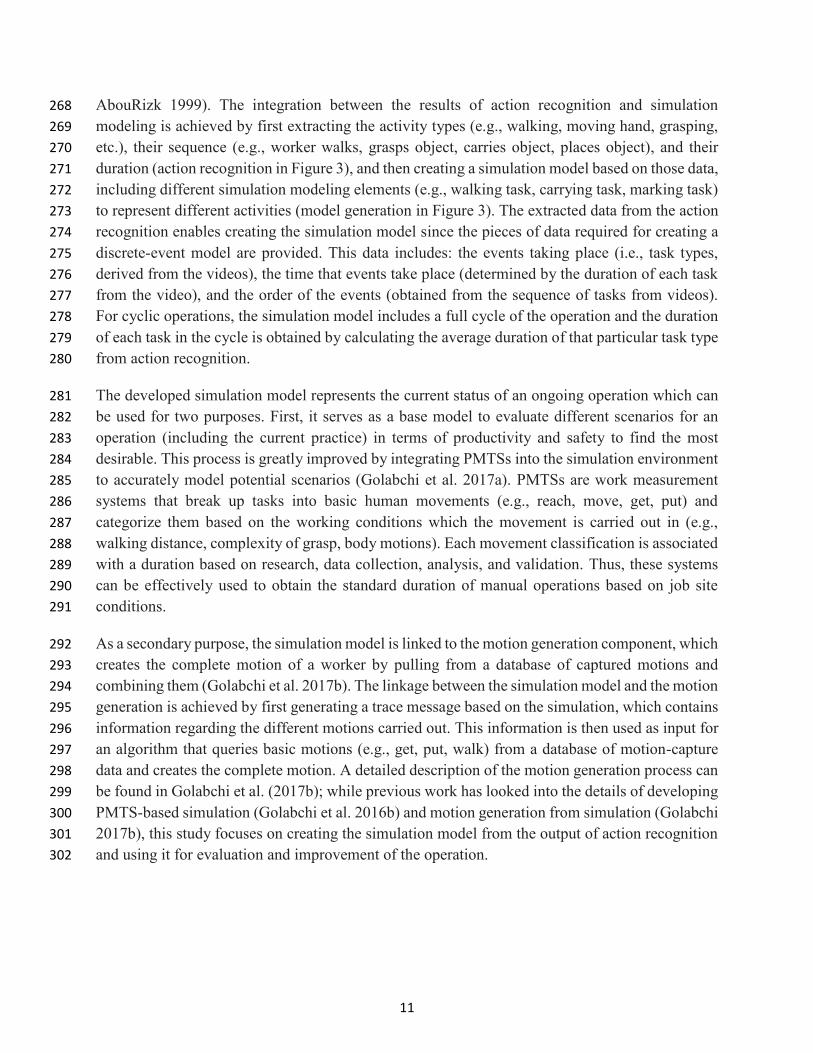
AbouRizk 1999). The integration between the results of action recognition and simulation 268
modeling is achieved by first extracting the activity types (e.g., walking, moving hand, grasping, 269
etc.), their sequence (e.g., worker walks, grasps object, carries object, places object), and their 270
duration (action recognition in Figure 3), and then creating a simulation model based on those data, 271
including different simulation modeling elements (e.g., walking task, carrying task, marking task) 272
to represent different activities (model generation in Figure 3). The extracted data from the action 273
recognition enables creating the simulation model since the pieces of data required for creating a 274
discrete-event model are provided. This data includes: the events taking place (i.e., task types, 275
derived from the videos), the time that events take place (determined by the duration of each task 276
from the video), and the order of the events (obtained from the sequence of tasks from videos). 277
For cyclic operations, the simulation model includes a full cycle of the operation and the duration 278
of each task in the cycle is obtained by calculating the average duration of that particular task type 279
from action recognition. 280
The developed simulation model represents the current status of an ongoing operation which can 281
be used for two purposes. First, it serves as a base model to evaluate different scenarios for an 282
operation (including the current practice) in terms of productivity and safety to find the most 283
desirable. This process is greatly improved by integrating PMTSs into the simulation environment 284
to accurately model potential scenarios (Golabchi et al. 2017a). PMTSs are work measurement 285
systems that break up tasks into basic human movements (e.g., reach, move, get, put) and 286
categorize them based on the working conditions which the movement is carried out in (e.g., 287
walking distance, complexity of grasp, body motions). Each movement classification is associated 288
with a duration based on research, data collection, analysis, and validation. Thus, these systems 289
can be effectively used to obtain the standard duration of manual operations based on job site 290
conditions. 291
As a secondary purpose, the simulation model is linked to the motion generation component, which 292
creates the complete motion of a worker by pulling from a database of captured motions and 293
combining them (Golabchi et al. 2017b). The linkage between the simulation model and the motion 294
generation is achieved by first generating a trace message based on the simulation, which contains 295
information regarding the different motions carried out. This information is then used as input for 296
an algorithm that queries basic motions (e.g., get, put, walk) from a database of motion-capture 297
data and creates the complete motion. A detailed description of the motion generation process can 298
be found in Golabchi et al. (2017b); while previous work has looked into the details of developing 299
PMTS-based simulation (Golabchi et al. 2016b) and motion generation from simulation (Golabchi 300
2017b), this study focuses on creating the simulation model from the output of action recognition 301
and using it for evaluation and improvement of the operation. 302
12
303
Figure 3. Simulation model generation from action recognition results 304
3.2 As-is Modeling Module 305
The as-is modeling module includes two main components. First, the current conditions of the 306
existing workplace (structure and objects) have to be modeled. Second, the path that each worker’s 307
3D animation will use in the virtual representation is identified through path planning. The two 308
components are further described below. 309
3.2.1 Point cloud generation 310
The virtual representation of a job site needs to reflect current conditions, including the shape, size, 311
and location of building components, equipment, and materials. Since as-designed CAD and BIM 312
models might not accurately reflect the current, ongoing status of the surrounding work 313
environment or temporary structures and objects, point cloud data models have emerged as a 314
solution. These models can later be converted into 3D models, similar to the ones in a BIM (Hichri 315
et al. 2013). Specifically, different tools and approaches can be used for point cloud model 316
creation, including image-based approaches, video-based approaches, and laser scanners. The use 317
of laser scanners has been thoroughly studied in construction (Akinci et al. 2006; Tang et al. 2010; 318
El-Omari and Moselhi 2008). Despite the high accuracy of models created using laser scanners 319
and their scaling capabilities, the cost of the scanners and the need for experts to implement them 320
can limit their use in practice. Image-based approaches, in which a structure from motion algorithm 321
is used to generate a point cloud from ordinary photographs (Golparvar-Fard et al. 2011; Fathi and 322
Brilakis 2011), can be used as an alternative approach since compared to using laser scanners, an 323
acceptable model can typically be created without substantial need for special equipment or high 324
levels of expertise (Guo et al. 2016). However, such approaches involve high processing times and 325
require images with high overlap to ensure the reliability of the output. Therefore, this study uses 326
a video-based approach, which can potentially address the issues with both prior methods. 327
@ 00:00:17 Walk
@ 00:00:31 Pick up
@ 00:00: 36 Carry
@ 00:00:47 Walk
@ 00:01:04 Measure
Videotape
Simulation model Activities, sequence
and duration
Action Recognition Model Generation

13
To create a point cloud model using the video-based approach, a stereo vision camera is used to 328
generate depth data for objects. This approach simplifies the data recording process since there is 329
little concern regarding the overlap of the images, as experienced with single image-based 330
approaches. Using the stereo vision approach, every point of an object is recorded through the left 331
and right lenses at the same time, and then the videos are rectified (Fusiello et al. 2000). 332
Rectification is a transformation process in which two or more images are projected onto the same 333
image plane to find the matching points between them. After this process, the images from every 334
frame of the recorded videos will be appropriately aligned. 335
To implement the point cloud generation process, a video of the job site is required as input, and 336
the point cloud model is generated as output. Through this simple process, the generated point 337
cloud model reflects the existing conditions at a job site. When evaluating different scenarios and 338
representing new designs, 3D models of other elements, including building components, 339
equipment, material, tools, etc., are added by importing the point cloud model, 3D model or BIM 340
elements, and other 3D objects into the final visualization platform and positioning them in the 341
correct locations. Human models and motions are added to the virtual model at a later stage. 342
3.2.2 Worker path planning for virtual modeling 343
To realistically represent a human model in a virtual environment, the anthropometric properties 344
of the model, an animation of the motions the human carries out, and the path that they take inside 345
the 3D model all need to be reflected reliably. The anthropometric attributes are considered while 346
creating the skeleton of the 3D model of the human by choosing appropriate values for the joint 347
lengths and body-part ratios (Meredith and Maddock 2001; Golabchi et al. 2015b). The motion is 348
created from the sequence of activities and durations in the simulation model and by querying a 349
database of motions, as explained above. The path that each worker will take to complete a motion 350
also needs to be acquired to provide a reliable representation of activities. Thus, path planning 351
needs to be used to predict the paths that workers will take on an actual job site and animate them 352
in the virtual model. 353
For this purpose, the A* path planning algorithm (Yao et al. 2010; Hart et al. 1968) is adapted for 354
its speed and reliability, where the start and end nodes of the path and the locations of obstacles 355
are the inputs and the shortest path is the output. After the 3D model is created, it is analyzed to 356
extract the coordinates of all objects in the model by recording their X and Y coordinates for all 357
points on the Z axis, as shown in Figure 4. The size of the matrices with the X and Y coordinates 358
is determined by finding the largest distance in each of the X and Y directions among all the Z 359
planes and using those values for the corresponding axis. 360

14
361
Figure 4. Registering the coordinates of all objects of the 3D model in different planes 362
Next, the start and end locations in the virtual model are selected to extract the coordinates. Also, 363
based on the Z coordinate of the start and end nodes, the object coordinates need to be filtered to 364
find any obstacles in the worker’s path. Thus, the coordinates of obstacles that could block the 365
worker’s path, defined by having a Z value between the worker’s foot and head, are extracted. 366
Then, the X and Y values of all nodes that represent an obstacle that the worker cannot pass (i.e., 367
for the same X and Y, a Z range larger than the height of a step) are registered as obstacles. The 368
start, end, and obstacle nodes are then fed into the A* algorithm, and the coordinates of the path 369
are extracted. This path is then used to animate a human animation in the virtual model by feeding 370
the coordinates into the visualization environment, along with the basic motions already attached 371
to the animation. 372
3.3 Safety Assessment Module 373
The biomechanical analysis component of the framework enables the evaluation of an operation 374
by examining the loads exerted on the human joints and comparing them to safe limits. The results 375
can be used along with the productivity analysis output to improve the operation and select an 376
optimal design (Golabchi et al. 2017a). To carry out an automated ergonomic analysis, worker 377
motions need to be extracted from either video recordings (Han and Lee 2013), vision-based 378
sensing devices (e.g., Microsoft Kinect) (Han et al. 2013), or wearable sensors (Yan et al. 2017), 379
and then the motion data can be used to automatically identify unsafe actions through ergonomic 380
and biomechanical assessments (Golabchi et al. 2015b). Those results are used to modify the 381
design elements that cause the unsafe conditions and ensure representations of safe motions. The 382
captured motions are also used to animate the worker model in the final virtual environment to 383
accurately represent current conditions. When improving prospective operational scenarios, the 384
motion generation element uses pre-recorded motions of ergonomically safe actions to visualize 385
z
y
x
z=3 z=2 z=1
z=n
.
.
. For each z
x1 x2 x3 . xn
y1 y2 y3 . yn . . . . . . . . . . . . . . . . . . . . . . . . . . . . . . . .
15
worker activities, enabling the use of the virtual representation for safety training applications. The 386
safety analysis component and detailed descriptions pertaining to it can be found in Golabchi et 387
al. (2015b), Golabchi et al. (2015a), and Golabchi et al. (2016a). This study adapts biomechanical 388
analysis in conjunction with the virtual visualization of the workstation as part of the analysis. 389
4 CASE STUDY: ILLUSTRATION OF FRAMEWORK IMPLEMENTATION 390
The application of the proposed framework and its components is demonstrated by implementing 391
it using data from an off-site construction job site. A steel fabrication shop is selected as the work 392
environment due to the existence of many manual operations and their importance in ensuring safe 393
and productive processes. In particular, the task of handling steel plates is observed, recorded, 394
modeled, and analyzed using the proposed integrated approach since its productivity is critical in 395
the whole operation and it also involves physically demanding activities (e.g., carrying steel 396
plates). The main activities carried out to complete the task include picking up steel plates from a 397
cutting machine, carrying them to a worktable, measuring and sorting them, and carrying them to 398
storage bins. As the first step, the workstation is recorded using a video camera to extract time 399
stamps and activity types using the action recognition component. This data is used to create a 400
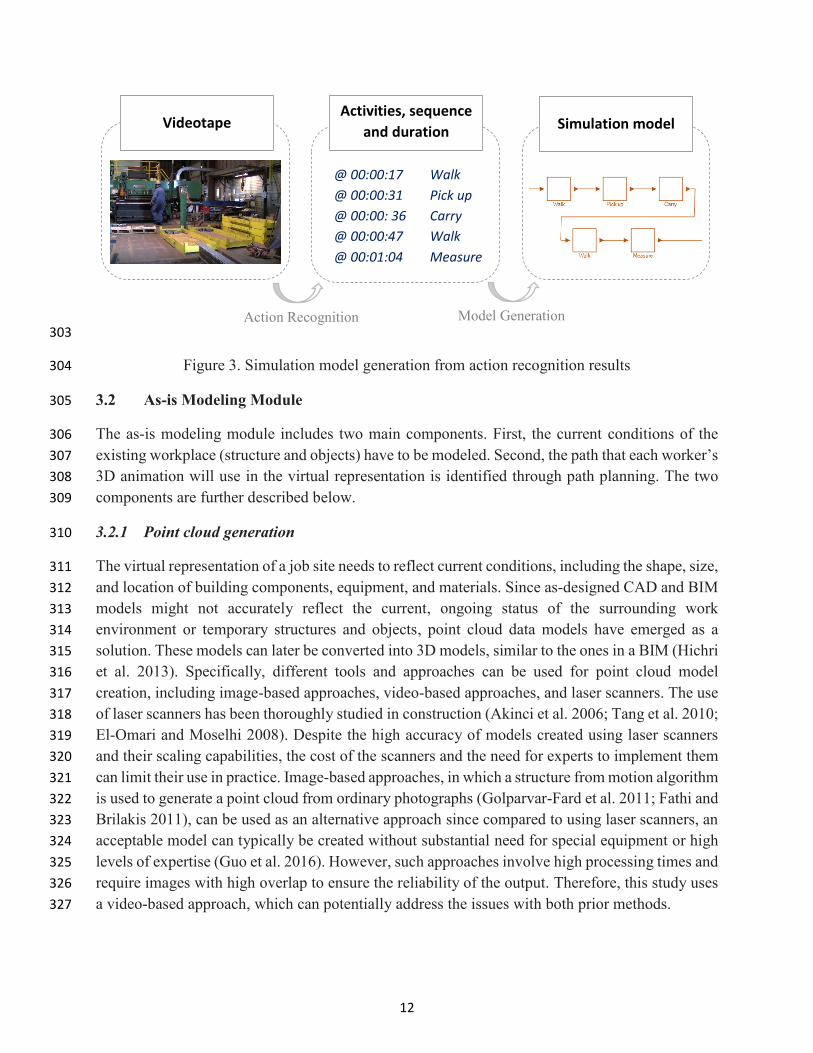
simulation model representing the existing, ongoing operation. Figure 5 shows the work setup and 401
samples of the identified worker tasks. 402
403 Figure 5. Sample actions identified through action recognition 404
By using the proposed action recognition algorithm on the video recording of the operation, 32 405
actions are identified in the four categories of walking, picking up, carrying, and measuring. Since 406
the operation is cyclic, after running the action recognition, the most repeated cycle is found and 407
used as the correct sequence of activities for the simulation modeling. Activities not following the 408
correct identified sequence are distinguished as outliers and removed. The simulation model of the 409
cycle is then built using the average durations for each task, as derived from the action recognition 410
results. Based on the 32 actions identified from the video recording, which includes 4010 data 411
points (i.e., video frames of the recording), the error in finding the correct sequence is 7.14%, and 412
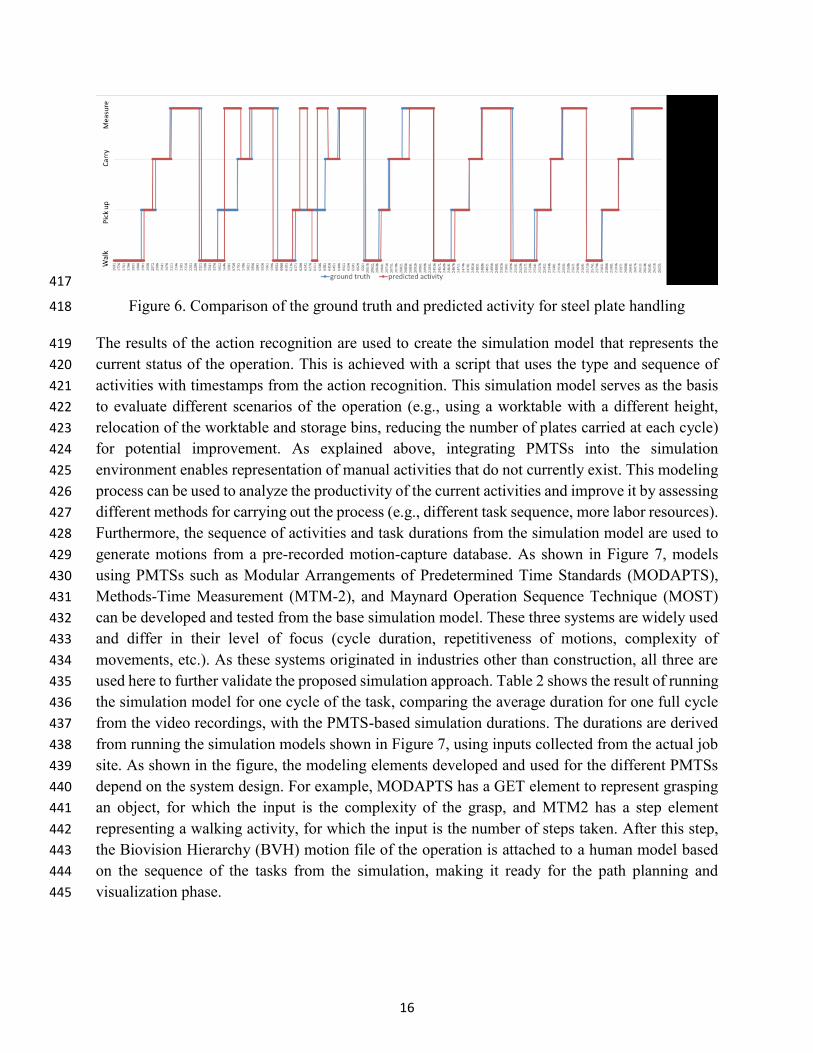
the error in calculating the correct durations is 8.48%. Figure 6 shows the ground truth and 413
predicted activities of the steel plate handling task. The horizontal axis represents the video frame 414
data points. The video is recorded with 30 frames per second. 415
416
Measure Walk Pick up Carry
16
417
Figure 6. Comparison of the ground truth and predicted activity for steel plate handling 418
The results of the action recognition are used to create the simulation model that represents the 419
current status of the operation. This is achieved with a script that uses the type and sequence of 420
activities with timestamps from the action recognition. This simulation model serves as the basis 421
to evaluate different scenarios of the operation (e.g., using a worktable with a different height, 422
relocation of the worktable and storage bins, reducing the number of plates carried at each cycle) 423
for potential improvement. As explained above, integrating PMTSs into the simulation 424
environment enables representation of manual activities that do not currently exist. This modeling 425
process can be used to analyze the productivity of the current activities and improve it by assessing 426
different methods for carrying out the process (e.g., different task sequence, more labor resources). 427
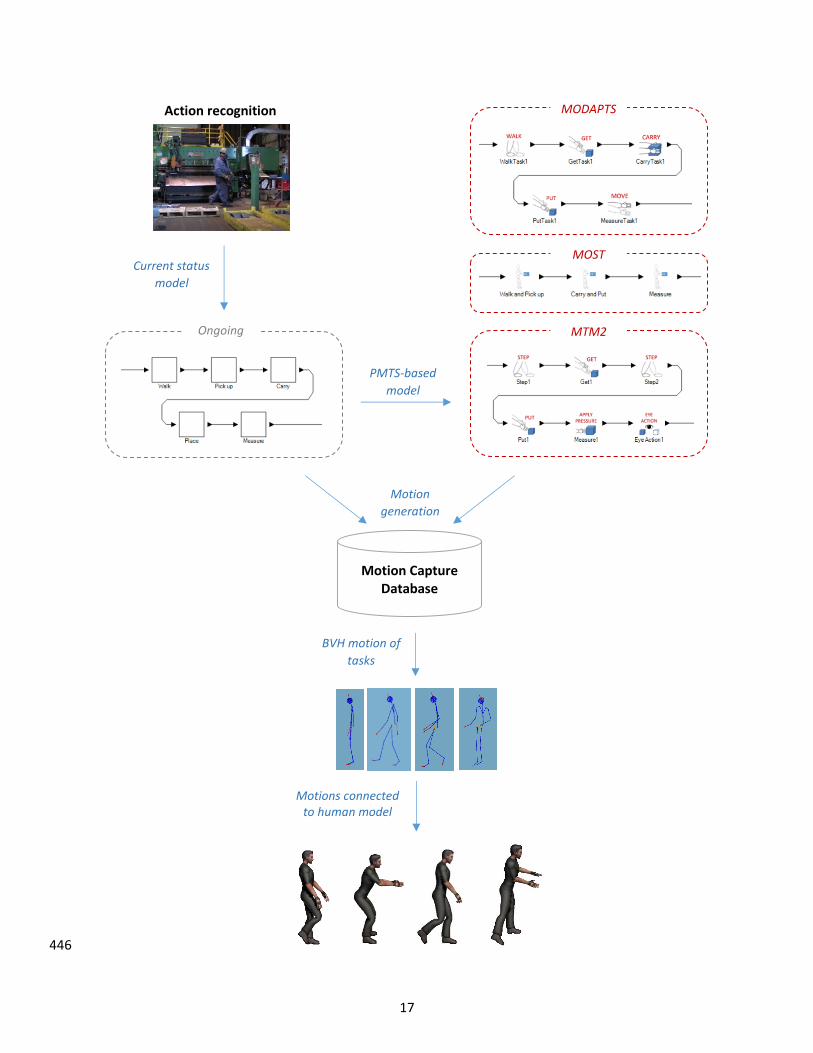
Furthermore, the sequence of activities and task durations from the simulation model are used to 428
generate motions from a pre-recorded motion-capture database. As shown in Figure 7, models 429
using PMTSs such as Modular Arrangements of Predetermined Time Standards (MODAPTS), 430
Methods-Time Measurement (MTM-2), and Maynard Operation Sequence Technique (MOST) 431
can be developed and tested from the base simulation model. These three systems are widely used 432
and differ in their level of focus (cycle duration, repetitiveness of motions, complexity of 433
movements, etc.). As these systems originated in industries other than construction, all three are 434
used here to further validate the proposed simulation approach. Table 2 shows the result of running 435
the simulation model for one cycle of the task, comparing the average duration for one full cycle 436
from the video recordings, with the PMTS-based simulation durations. The durations are derived 437
from running the simulation models shown in Figure 7, using inputs collected from the actual job 438
site. As shown in the figure, the modeling elements developed and used for the different PMTSs 439
depend on the system design. For example, MODAPTS has a GET element to represent grasping 440
an object, for which the input is the complexity of the grasp, and MTM2 has a step element 441
representing a walking activity, for which the input is the number of steps taken. After this step, 442
the Biovision Hierarchy (BVH) motion file of the operation is attached to a human model based 443
on the sequence of the tasks from the simulation, making it ready for the path planning and 444
visualization phase. 445
17
446
PMTS-based
model
Motion Capture Database
Action recognition
Current status
model
MODAPTS
MOST
MTM2
Motion
generation
BVH motion of
tasks
Motions connected to human model
Ongoing

18
Figure 7. Simulation model and motion generation using action recognition 447
Table 2. Actual vs simulation durations for one cycle of the steel plate handling task 448
Average duration
from job site
(seconds)
PMTS-based simulation Average
difference
between actual
and PMTS-based
MODAPS
duration (seconds)
MTM2 duration
(seconds)
MOST duration
(seconds)
8.66 8.06 8.42 8.28 4.70%
To create the 3D representation of the workstation, a 34-second video (1020 frames) of the job site 449
is recorded. A stereo vision camera is used with a stereo baseline of 120 millimeters, a depth range 450
of 0.5 to 20 meters, 8.5 millimeters backside illumination sensors with high low-light sensitivity 451
and resolution of 4M pixels per sensor, and the capability of recording videos with 15 to 100 452
frames per second. Using the process described before, the point cloud model representing the as-453
is conditions is generated. Running the data to generate the point cloud model for the steel plate 454
handling workstation takes approximately 10 minutes. A snapshot of the point cloud model of the 455
steel plate handling workstation is shown in Figure 8. 456
457
Figure 8. Point cloud model of the steel plate handling workstation 458
As an example of the ergonomic and biomechanical analysis for safety evaluation, the process of 459
picking up the plates from the machine is demonstrated. As shown in Figure 9, this analysis begins 460
by modeling the worker’s posture at any given point during the operation and using biomechanical 461
models (Chaffin et al. 2006) to calculate the forces on different body joints and compare them to 462
allowable limits (Golabchi et al. 2015b). Any ergonomic concerns can be addressed during this 463

19
modeling, and the worker’s posture and workplace design can be changed, if required, to ensure 464
the tasks are acceptably safe. This process can be carried out using any of several available 465
biomechanical analysis tools and software, such as 3DSSPP, openSim, SIMM, or Visual 3D. The 466
3DSSPP software (2018) is used in this study as it can examine variables such as back compression 467
(i.e., load on lower back shown in Figure 9) and the strength-percent capability of different body 468
joints (i.e., load on body joint percentages shown in Figure 9) that are useful for assessing the steel 469
plate handling task. Furthermore, it can effectively visualize and export posture modifications and 470
their effects on biomechanical loads. 471
472
Figure 9. Biomechanical analysis of plate grasping task, (a) current conditions, (b) modified 473
posture, added to the point cloud model after improvements 474
After creating the point cloud model of the steel plate handling workstation (Figure 9.b), the model 475
is inserted into the platform for the final virtual representation. Autodesk 3ds Max is used as the 476
final platform in this study. The point cloud can be used in conjunction with any 3D model (such 477
Load on lower back = 2336 N Acceptable
Load on body joints > 85% Moderate
Posture concern: twisting Risk 10 lb
Load on lower back = 2265 N Acceptable
Load on body joints > 90% Acceptable
Posture concern: no twisting Acceptable
(a)
(b)

20
as BIM) to evaluate ongoing operations and alternative scenarios. The human model and the 478
motions attached to it from previous steps are also inserted into the visualization and manually 479
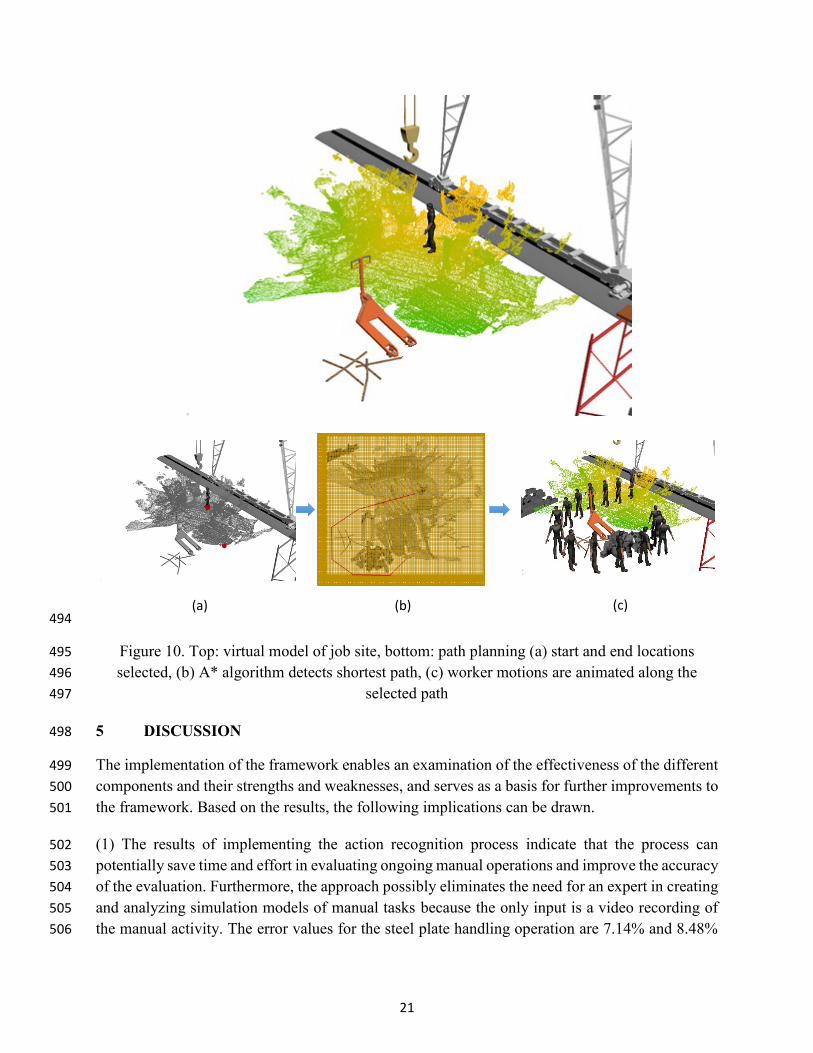
aligned at the correct locations, along with other 3D models. The path planning algorithm is then 480
used to find the best walking path for the worker model. Figure 10 shows a snapshot of part of the 481
virtual model with the point cloud, the human model, and other 3D models of equipment and 482
materials. The figure also shows the sequence for the path planning: by selecting the start and end 483
locations, the obstacles are detected as described previously, and the shortest path is chosen and 484
used to animate the human model. Examples of different scenarios for the steel plate handling 485
operation can include using a different cutting machine, adjusting the height of the worktable, 486
relocating the worktable or the storage bins closer to the cutting machine, and changing the number 487
of plates carried to the bins at a time. The final output of the visualization is a complete virtual 488
model representing the physical layout of the job site, building elements (e.g., walls, doors), 3D 489
models of equipment, material, tools, and human models animating the motions of workers. This 490
virtual model can be used in practice to further evaluate the design (e.g., assessing clearance and 491
reach), improve the communication and implementation of new designs, train personnel, and more 492
effectively manage decision-making. 493
21
494
Figure 10. Top: virtual model of job site, bottom: path planning (a) start and end locations 495
selected, (b) A* algorithm detects shortest path, (c) worker motions are animated along the 496
selected path 497
5 DISCUSSION 498
The implementation of the framework enables an examination of the effectiveness of the different 499
components and their strengths and weaknesses, and serves as a basis for further improvements to 500
the framework. Based on the results, the following implications can be drawn. 501
(1) The results of implementing the action recognition process indicate that the process can 502
potentially save time and effort in evaluating ongoing manual operations and improve the accuracy 503
of the evaluation. Furthermore, the approach possibly eliminates the need for an expert in creating 504
and analyzing simulation models of manual tasks because the only input is a video recording of 505
the manual activity. The error values for the steel plate handling operation are 7.14% and 8.48% 506
(a) (b) (c)

22
for finding the correct sequence and calculating the correct durations, respectively. The accuracy 507
of the action recognition component could potentially be improved by extracting refined motion 508
features (e.g., human silhouette with a more accurate contour) and training a more robust action 509
classifier (e.g., fed data with a wider distribution over motions). The action recognition process is 510
probably most practical when modeling cyclic operations, first because a short video of the process 511
can be used to identify the correct sequence of activities and average durations (minimizing 512
processing time). Second, as noncyclic operations do not contain a fixed sequence, outliers cannot 513
be identified, which reduces the reliability of the system. This is particularly important when 514
modeling motions in on-site construction, as opposed to off-site and modular construction and 515
fabrication, since motions, tasks, and job site conditions change more frequently. 516
In the proposed framework, the action recognition component serves as the basis for the simulation 517
model used for productivity analysis and motion generation. However, the information derived 518
from action recognition could also be used to integrate many other applications into the framework, 519
such as safety evaluations and worker training. For example, time-related information obtained 520
from action recognition, such as working vs idle durations and frequency of motions, can be used 521
to evaluate level of safety of the operation (Nath and Behzadan 2017). Also, the methods of 522
carrying out an operation by workers can be compared to that of a skilled worker (or any preset 523
benchmark) for worker training. 524
Kinematic data can be collected using different types of sensors, such as wearable IMU-based 525
motion capture systems (Yan et al. 2017). Different sensing methods encompass various 526
advantages and disadvantages. A vision-based approach using video cameras is examined in this 527
study due to advantages such as convenient access to ordinary cameras in job sites and the 528
simplicity of implementation of the approach. However, it should be noted that this approach has 529
limitations such as requiring the worker to stay in the camera’s field of view, prevention of 530
occlusions from machinery or other workers, existence of sufficient lighting without high 531
reflections, selection of appropriate location for the camera, etc. 532
(2) The case study shows that the simulation model of the existing operation, created from video 533
recordings using action recognition and used alongside a PMTS-based modeling platform, enables 534
simple, accurate, and quick evaluation of ongoing activities. The action recognition–based 535
simulation model represents the current operations, and the PMTS-based model represents the 536
standard time for the operation. As shown in Table 2, the actual average duration for a cycle of the 537
steel plate handling task is 8.66 seconds, and the simulation duration using MODAPTS, MTM2, 538
and MOST is 8.06, 8.42, and 8.28 seconds respectively. The difference between the two durations 539
can be used to represent the efficiency of the ongoing operation. Furthermore, the PMTS-based 540
simulation enables convenient and accurate modeling of alternative scenarios for the operation to 541
find the optimal process. Experiments with PMTSs in representing manual tasks, the simplicity of 542
adopting them, and the amount of error associated with them (Golabchi et al. 2016b) indicate the 543
importance of such systems in modeling construction operations. However, as these tools are 544

23
mainly originated in manufacturing industries, more studies focused on customizing them for non-545
cyclic on-site construction tasks are required. 546
(3) The generation of point cloud models from a video recording of a job site is a quick and simple 547
method for obtaining a reliable 3D representation of current conditions. Since construction sites 548
are dynamic and the status of the work environment changes frequently, this method ensures that 549
the 3D virtual model accurately represents the as-is state of the job site. Obtaining the 3D as-is 550
representation is critical in case of evaluating and redesigning ongoing operations or designing 551
new operations in existing workplaces, as it provides a manageable but detailed view of the current 552
status of the workplace and its different components and enables modification of the different 553
design elements to evaluate its impact on performance and safety. In case of non-existing job sites, 554
the effectiveness of the virtual visualization depends on existence of reliable and inclusive 3D 555
representations (e.g., as-designed BIM). It should be noted that the stereo vison approach adapted 556
in this study is limited to only a certain size of workstation since the distance between the two 557
lenses is fixed and relatively short. With a longer distance between the lenses, the perception level 558
increases, and thus the depth perception ability will be higher. One potential solution to the 559
boundedness limitation would be building a stereo vision camera with adjustable lenses. 560
Considering the conversion and import/export capabilities of existing software, the point cloud 561
model connects smoothly to the final visualization model. However, manual manipulation is still 562
required, along with scaling in some cases, to align the model in its correct position. The accuracy 563
and labor-intensity of this process could be improved in further studies by using universal 564
coordinate and unit systems and creating a method to automatically register different models in 565
the final platform. Using predefined targets can also facilitate the registration and scaling of the 566
point cloud data. Furthermore, due to the dynamic nature of construction job sites, the process of 567
updating the as-is representation is of great importance and requires development of approaches 568
that enable smooth, efficient, and reliable update of the models. Overall, the integration of point 569
cloud data, human model and motions, and 3D models of equipment, tools, material, etc., results 570
in a data-rich virtual model that can be effectively used for various potential visualization 571
applications in construction job sites. 572
(4) The path planning component, in conjunction with motion generation, enables an automated 573
animation of worker motions, which are an important element in the visualization of manual 574
operations. The path planning algorithm eliminated the time and effort required to manually set 575
the animation of the human models and represented the motions in an acceptable and realistic 576
scenario of worker activities in prospective work environments. This can be particularly useful 577
when considering the existence of more than one worker in a single workstation, for which 578
collision avoidance algorithms should also be incorporated. It should be noted that this process 579
uses the shortest path between two points, and although it is generally safe to assume that workers 580
will usually take the shortest path, this approach can be most useful for modeling prospective 581
operations. If an exact representation of worker paths is required for an existing operation, it must 582

24
be observed and recorded at the actual job site. Although this information might not be required 583
for most applications, it is possible to automate this process using location-aware sensors and 584
devices. This study used the A* path planning algorithm due to its popularity and accuracy. 585
However, implementing other algorithms and evaluating their effectiveness could be carried out 586
in future studies. 587
Overall, the results indicate that integrating visual sensing methods, along with analysis of 588
operations and workplace visualization, can facilitate the data linking required for an inclusive 589
ergonomic analysis, streamlining the evaluation and design of safe and productive workplaces. 590
The first benefit is the automation and simplicity of the analysis process, which can result in higher 591
adoption of ergonomic methods in practice. Second, as the same data are used by several 592
components and the initial inputs are gathered using sensing approaches, the results provide high 593
reliability and minimal subjectivity. Integrating sensing with action recognition and simulation 594
modeling requires less time and effort for evaluation of labor operations compared to traditional 595
ergonomic analysis methods. Furthermore, incorporating productivity analysis through PMTSs 596
into ergonomic analysis enables evaluating and improving both performance and safety 597
simultaneously. 598
6 CONCLUSION 599
This study explores the adaptation and integration of methods to improve different stages of 600
ergonomic analyses, including data collection, analysis, and representation of results. 601
Improvements were achieved by proposing an overall framework to provide an automated, simple, 602
and reliable analysis of manual operations. Specifically, the following framework components 603
were investigated: (1) sensing to collect information about job site conditions, worker tasks and 604
activities, and human motions; (2) action recognition from video recordings for simulation model 605
creation; (3) predetermined motion time systems for efficiency evaluation; (4) biomechanical 606
analysis for safety analysis; (4) motion generation and worker path planning for realistic animation 607
of worker actions; (5) comprehensive virtual visualization for effective representation and 608
implementation of the analysis and results. Overall, the results of implementing the framework 609
indicate that integrating available methods of data collection, analysis, and visualization for labor 610
operations can facilitate an inclusive ergonomic analysis. Such integration addresses challenges in 611
traditional approaches to ergonomic evaluation, including labor-intensity, unreliable results, and 612
time-intensity. Considering the physically demanding nature of manual tasks in the construction 613
industry, this integration could result in a higher adoption of ergonomic methods in practice, as 614
well as better reliability and reduced subjectivity in analysis results, which can lead to safer and 615
more productive construction job sites. 616
The main limitations of the integration and potential directions for future research include: (1) 617
recording worker motions using vision-based approaches requires proper lighting, inclusion of 618
worker’s body in camera’s line of sight, avoiding occlusions, and setup of camera at proper 619
locations; (2) vision-based action recognition works reliably for cyclic tasks but more testing and 620

25
development is required for non-cyclic construction tasks; (3) currently available PMTSs need to 621
be effectively customized for construction labor tasks for a more reliable evaluation; (4) use of 622
point cloud as-is model, human model, and other 3D objects in the virtual visualization requires 623
some manual registration and scaling; (5) considering the diversity of tasks in construction, robust 624
methods for automated visualization of different type of worker motions in a virtual model can be 625
highly effective; (6) with the use of the virtual representation of the workplace and worker motions, 626
some level of expertise is still required for redesigning the workplace in case of unsafe tasks as 627
well as evaluating risk factors such as clearance, vision, reach, and fit; automation of the redesign 628
process can further improve the adaptation and reliability of the analysis. 629
7 ACKNOWLEDGEMENTS 630
This research was supported by the Natural Sciences and Engineering Research Council of Canada 631 (NSERC CRDPJ 470598-14), a National Science Foundation Award (IIP-1640633), and Basic 632
Science Research Program through the National Research Foundation of Korea funded by the 633 Ministry of Science, ICT and Future Planning (NRF 2018R1C1B6005108). Any opinions, 634
findings, and conclusions or recommendations expressed in this paper are those of the authors and 635 do not necessarily reflect the views of the Natural Sciences and Engineering Research Council of 636 Canada, the National Science Foundation, or the National Research Foundation of Korea. 637
References 638
3DSSPP (3D Static Strength Prediction Program) [computer program]. Version 6.0.6. Ann 639
Arbor, MI: The University of Michigan, Center for Ergonomics; 2018. Copyright 1990 The 640
Regents of the University of Michigan. <http://umich.edu/~ioe/3DSSPP/index.html>. 641
Akhavian, R., and Behzadan, A. H. (2016). Smartphone-based construction workers' 642
activity recognition and classification. Automation in Construction, 71, 198-209. 643
https://doi.org/10.1016/j.autcon.2016.08.015. 644
Akinci, B., Boukamp, F., Gordon, C., Huber, D., Lyons, C., and Park, K. (2006). A 645
formalism for utilization of sensor systems and integrated project models for active construction 646
quality control. Automation in construction, 15(2), 124-138. 647
https://doi.org/10.1016/j.autcon.2005.01.008. 648
Al-Hussein, M., Niaz, M. A., Yu, H., and Kim, H. (2006). Integrating 3D visualization and 649
simulation for tower crane operations on construction sites. Automation in Construction, 15(5), 650
554-562. https://doi.org/10.1016/j.autcon.2005.07.007. 651
Behm, M. (2005). Linking construction fatalities to the design for construction safety 652
concept. Safety science, 43(8), 589-611. https://doi.org/10.1016/j.ssci.2005.04.002. 653
Budziszewski, P., Grabowski, A., Milanowicz, M., Jankowski, J., and Dzwiarek, M. 654
(2011). Designing a workplace for workers with motion disability with computer simulation and 655
virtual reality techniques. International Journal on Disability and Human Development, 10(4), 656
355-358. https://doi.org/10.1515/IJDHD.2011.054. 657

26
Chaffin, D. B. (2008). Digital human modeling for workspace design. Reviews of Human 658
Factors and Ergonomics, 4(1), 41-74. https://doi.org/10.1518/155723408X342844. 659
Chaffin, D. B., Andersson, G. B., and Martin, B. J. (2006). Occupational biomechanics, 660
4th Ed., Wiley, Hoboken, NJ. ISBN-13: 978-0471723431. 661
Cheng, T., Teizer, J., Migliaccio, G. C., and Gatti, U. C. (2013). Automated task-level 662
activity analysis through fusion of real time location sensors and worker's thoracic posture data. 663
Automation in Construction, 29, 24-39. https://doi.org/10.1016/j.autcon.2012.08.003. 664
Construction Industry Institute (CII). (2006). Work force view of construction labor 665
productivity. RR215-11, Austin, TX. Online <https://www.construction-666
institute.org/resources/knowledgebase/knowledge-areas/general-cii-information/topics/rt-667
215/pubs/rs215-1> (accessed: April 2018) 668
Corona-Suárez, G., AbouRizk, S., and Karapetrovic, S. (2014). Simulation-based Fuzzy 669
Logic Approach to Assessing the Effect of Project Quality Management on Construction 670
Performance. Journal of Quality and Reliability Engineering, vol. 2014, Article ID 203427, 18 671
pages, 2014. doi:10.1155/2014/203427. 672
David, G. C. (2005). Ergonomic methods for assessing exposure to risk factors for work-673
related musculoskeletal disorders. Occupational medicine, 55(3), 190-199. 674
https://doi.org/10.1093/occmed/kqi082. 675
Duffy, V. G. (2008). Handbook of Digital Human Modeling: Research for Applied 676
Ergonomics and Human Factors Engineering. CRC Press. ISBN 9780805856460. 677
Dul, J., and Neumann, W. P. (2009). Ergonomics contributions to company strategies. 678
Applied ergonomics, 40(4), 745-752. https://doi.org/10.1016/j.apergo.2008.07.001. 679
El-Gohary, K. M., and Aziz, R. F. (2013). Factors influencing construction labor 680
productivity in Egypt. Journal of Management in Engineering, 30(1), 1-9. 681
https://doi.org/10.1061/(ASCE)ME.1943-5479.0000168. 682
El-Omari, S., and Moselhi, O. (2008). Integrating 3D laser scanning and photogrammetry 683
for progress measurement of construction work. Automation in construction, 18(1), 1-9. 684
https://doi.org/10.1016/j.autcon.2008.05.006. 685
Escorcia, V., Dávila, M. A., Golparvar-Fard, M., and Niebles, J. C. (2012). Automated 686
vision-based recognition of construction worker actions for building interior construction 687
operations using RGBD cameras. Proceedings of the Construction Research Congress: 688
Construction Challenges in a Flat World, pp. 879-888. ASCE. 689
https://doi.org/10.1061/9780784412329.089. 690
Fathi, H., and Brilakis, I. (2011). Automated sparse 3D point cloud generation of 691
infrastructure using its distinctive visual features. Advanced Engineering Informatics, 25(4), 760-692
770. https://doi.org/10.1016/j.aei.2011.06.001. 693
Fusiello, A., Trucco, E., and Verri, A. (2000). A compact algorithm for rectification of 694
stereo pairs. Machine Vision and Applications, 12(1), 16-22. 695
https://doi.org/10.1007/s001380050120. 696
27
Golabchi, A., Han, S., and AbouRizk, S. (2017a). A Simulation and Visualization-based 697
Framework of Labor Efficiency and Safety Analysis for Prevention through Design and Planning. 698
Automation in Construction. (Submitted: February 2017) 699
Golabchi, A., Han, S., and AbouRizk, S. (2017b). Post-simulation Visualization of 700
Construction Manual Operations Using Motion Capture Data. International Workshop on 701
Computing in Civil Engineering (IWCCE), Seattle, WA, USA, June 25-27. ASCE. 702
https://doi.org/10.1061/9780784480847.001 703
Golabchi, A., Han, S., Fayek, A. R., and AbouRizk, S. M. (2017c). Stochastic Modeling 704
for Assessment of Human Perception and Motion Sensing Errors in Ergonomic Analysis. Journal 705
of Computing in Civil Engineering, 31(4). https://doi.org/10.1061/(ASCE)CP.1943-706
5487.0000655. 707
Golabchi, A., Han, S., AbouRizk, S., and Kanerva, J. (2016a). Simulation-based analysis 708
of operational efficiency and safety in a virtual environment. Proceedings of the 2016 Winter 709
Simulation Conference, pp. 3325-3336, IEEE Press. ISBN: 978-1-5090-4484-9. 710
Golabchi, A., Han, S., and AbouRizk, S. M. (2016b). Micro-Motion Level Simulation for 711
Efficiency Analysis and Duration Estimation of Manual Operations. Automation in Construction 712
71: 443–452. https://doi.org/10.1016/j.autcon.2016.08.028. 713
Golabchi, A., Han, S., and Fayek, A. R. (2016c). A fuzzy logic approach to posture-based 714
ergonomic analysis for field observation and assessment of construction manual operations. 715
Canadian Journal of Civil Engineering, 43(4), 294-303. https://doi.org/10.1139/cjce-2015-0143. 716
Golabchi, A., Han, S., and AbouRizk, S. M. (2015a). Integration of Ergonomic Analysis 717
into Simulation Modeling of Manual Operations. Proceedings of the 16th ASIM Dedicated 718
Conference on Simulation in Production and Logistics, pp. 491-501. 719
Golabchi, A., Han, S., Seo, J., Han, S., Lee, S., and Al-Hussein, M. (2015b). An automated 720
biomechanical simulation approach to ergonomic job analysis for workplace design. Journal of 721
Construction Engineering and Management, 141(8), https://doi.org/10.1061/(ASCE)CO.1943-722
7862.0000998. 723
Golparvar-Fard, M., Bohn, J., Teizer, J., Savarese, S., and Peña-Mora, F. (2011). 724
Evaluation of image-based modeling and laser scanning accuracy for emerging automated 725
performance monitoring techniques. Automation in Construction, 20(8), 1143-1155. 726
https://doi.org/10.1016/j.autcon.2011.04.016. 727
Gong, J., Caldas, C. H., and Gordon, C. (2011). Learning and classifying actions of 728
construction workers and equipment using Bag-of-Video-Feature-Words and Bayesian network 729
models. Advanced Engineering Informatics, 25(4), 771-782. 730
https://doi.org/10.1016/j.aei.2011.06.002. 731
Guo, X., Golabchi, A., Han, S., and Kanerva, J. (2016). 3D Modeling of Workplaces for 732
Time and Motion Study of Construction Labor. Proceedings of the 16th International Conference 733
on Computing in Civil and Building Engineering (ICCCBE), July 6-8, Osaka, Japan, pp. 1516-734
1523. 735
28
Hajjar, D., and AbouRizk, S. (1999). Simphony: an environment for building special 736
purpose construction simulation tools. Proceedings of the Winter Simulation Conference, Phoenix, 737
AZ, USA, December 5-8, pp. 998–1006. ACM Publications. DOI: 10.1145/324898.324981. 738
Hallowell, M. (2011). Understanding the link between construction safety & productivity: 739
An active learning simulation exercise. Journal of Safety, Health & Environmental Research, 7 740
(1), 1-9. ASSE. 741
Han, S., Achar, M., Lee, S., and Peña-Mora, F. (2013). Empirical assessment of a RGB-D 742
sensor on motion capture and action recognition for construction worker monitoring. Visualization 743
in Engineering, 1: 6. DOI:10.1186/2213-7459-1-6. 744
Han, S., and Lee, S. (2013). A vision-based motion capture and recognition framework for 745
behavior-based safety management. Automation in Construction, 35, 131-141. 746
https://doi.org/10.1016/j.autcon.2013.05.001. 747
Hart, P. E., Nilsson, N. J., Raphael, B. (1968). A Formal Basis for the Heuristic 748
Determination of Minimum Cost Paths. IEEE Transactions on Systems Science and Cybernetics 749
(SSC) 4(2): 100–107. DOI:10.1109/TSSC.1968.300136. 750
Hedge, A., and Sakr, W. (2005). Workplace effects on office productivity: A 751
macroergonomic framework, in: Carayon, P., Robertson, M., Kleiner, B., Hoonakker, P.L.T., 752
Human factors in Organizational Design and Management – VIII, IEA Press, Santa Monica, pp. 753
75-80. 754
Hichri, N., Stefani, C., De Luca, L., Veron, P., and Hamon, G. (2013). From point cloud to 755
BIM: a survey of existing approaches. Proceedings of the XXIV International CIPA Symposium, 756
September 2-6, Strasbourg, France. <hal-01178692> 757
IEA (2017). Definition and Domains of Ergonomics, International Ergonomics 758
Association (IEA). Online < http://www.iea.cc/whats/index.html> (accessed: May 2017) 759
Jarkas, A. M., and Bitar, C. G. (2011). Factors affecting construction labor productivity in 760
Kuwait. Journal of Construction Engineering and Management, 138(7), 811-820. 761
https://doi.org/10.1061/(ASCE)CO.1943-7862.0000501. 762
Joshua, L., and Varghese, K. (2011). Accelerometer-based activity recognition in 763
construction. Journal of computing in civil engineering, 25(5), 370-379. 764
https://doi.org/10.1061/(ASCE)CP.1943-5487.0000097. 765
Kadefors, R., and Forsman, M. (2000). Ergonomic evaluation of complex work: a 766
participative approach employing video–computer interaction, exemplified in a study of order 767
picking. International Journal of Industrial Ergonomics, 25(4), 435-445. 768
https://doi.org/10.1016/S0169-8141(99)00042-6. 769
Kim, J. Y., and Caldas, C. H. (2013). Vision-based action recognition in the internal 770
construction site using interactions between worker actions and construction objects. Proceedings 771
of the International Symposium on Automation and Robotics in Construction and Mining, pp. 661-772
668. 773
29
Laring, J., Forsman, M., Kadefors, R., and Örtengren, R. (2002). MTM-based ergonomic 774
workload analysis. International Journal of Industrial Ergonomics, 30(3), 135-148. 775
https://doi.org/10.1016/S0169-8141(02)00091-4. 776
Leung, M. Y., Chan, I. Y. S., and Yu, J. (2012). Preventing construction worker injury 777
incidents through the management of personal stress and organizational stressors. Accident 778
Analysis & Prevention, 48, 156-166. https://doi.org/10.1016/j.aap.2011.03.017. 779
Liu, M., Han, S., and Lee, S. (2016). Silhouette-Based On-Site Human Action Recognition 780
in Single-View Video. Proceedings of the Construction Research Congress. May 31–June 2, San 781
Juan, Puerto Rico. https://doi.org/10.1061/9780784479827.096. 782
Maynard, H. B., Stegemerten, G. J., and Schwab, J. L. (1948). Methods-time measurement. 783
New York, NY, US: McGraw-Hill. 784
McAtamney, L., and Corlett, E. N. (1993). RULA: a survey method for the investigation 785
of work-related upper limb disorders. Applied ergonomics, 24(2), 91-99. 786
https://doi.org/10.1016/0003-6870(93)90080-S. 787
Mehta, R. K., and Agnew, M. J. (2010). Analysis of individual and occupational risk 788
factors on task performance and biomechanical demands for a simulated drilling task. International 789
Journal of Industrial Ergonomics, 40(5), 584-591. https://doi.org/10.1016/j.ergon.2010.06.003. 790
Meredith, M. and Maddock, S. (2001). Motion capture file formats explained. Technical 791
report CS-01-11, Department of Computer Science, University of Sheffield. 792
Muqeem, S., Idrus, A., Khamidi, M. F., Ahmad, J. B., and Zakaria, S. B. (2012). 793
Construction labor production rates modeling using artificial neural network. Journal of 794
Information Technology in Construction (ITcon), 16(42), 713-726. 795
Nath, N. D., and Behzadan, A. H. (2017). Construction Productivity and Ergonomic 796
Assessment Using Mobile Sensors and Machine Learning. Proceedings of the ASCE International 797
Workshop on Computing in Civil Engineering, pp. 434-441. 798
https://doi.org/10.1061/9780784480847.054. 799
OHS. (2017). 2016 Workplace Injury, Disease and Fatality Statistics Provincial Summary. 800
Occupational Health and Safety (OHS), Ministry of Labour, Government of Alberta. Online 801
<https://work.alberta.ca/documents/2016-ohs-data.pdf> (accessed: April 2018) 802
Ozcan-Deniz, G., and Y. Zhu. (2015). A Multi-objective Decision-support Model for 803
Selecting Environmentally Conscious Highway Construction Methods. Journal of Civil 804
Engineering and Management 21(6):733-747. https://doi.org/10.3846/13923730.2014.893915. 805
Peterson, L. E.(2009). K-nearest neighbor, Scholarpedia 4(2): 1883. 806
doi:10.4249/scholarpedia.1883. 807
Pettré, J., Siméon, T., and Laumond, J. P. (2002). Planning human walk in virtual 808
environments. Proceedings of the IEEE/RSJ International Conference on Intelligent Robots and 809
Systems, Vol. 3, pp. 3048-3053. IEEE. DOI: 10.1109/IRDS.2002.1041736. 810
Pučko, Z., and Rebolj, D. (2017). Automated Construction Progress Monitoring Using 811
Continuous Multipoint Indoor and Outdoor 3D Scanning. Proceedings of the Lean & Computing 812
30
in Construction Congress (LC3), Heraklion, Crete, Greece, 4-12 July. 813
https://doi.org/10.24928/JC3-2017/0021. 814
Rashidi, A., Brilakis, I., and Vela, P. (2015). Generating absolute-scale point cloud data of 815
built infrastructure scenes using a monocular camera setting. Journal of Computing in Civil 816
Engineering, 29(6), 04014089. https://doi.org/10.1061/(ASCE)CP.1943-5487.0000414. 817
Ray, S. J., and Teizer, J. (2012). Real-time construction worker posture analysis for 818
ergonomics training. Advanced Engineering Informatics, 26(2), 439-455. 819
https://doi.org/10.1016/j.aei.2012.02.011. 820
Seo, J., Lee, S., and Seo, J. (2016). Simulation-based Assessment of Workers’ Muscle 821
Fatigue and Its Impact on Construction Operations. Journal of Construction Engineering and 822
Management, Vol. 142, No. 11, 04016063. https://doi.org/10.1061/(ASCE)CO.1943-823
7862.0001182. 824
Seo, J., Starbuck, R., Han, S., Lee, S., and Armstrong, T. J. (2014). Motion data-driven 825
biomechanical analysis during construction tasks on sites. Journal of Computing in Civil 826
Engineering, 29(4), https://doi.org/10.1061/(ASCE)CP.1943-5487.0000400. 827
Sonne, M., Villalta, D. L., and Andrews, D. M. (2012). Development and evaluation of an 828
office ergonomic risk checklist: ROSA–Rapid office strain assessment. Applied ergonomics, 829
43(1), 98-108. https://doi.org/10.1016/j.apergo.2011.03.008. 830
Starbuck, R., Seo, J., Han, S., and Lee, S. (2014). A stereo vision-based approach to 831
marker-less motion capture for on-site kinematic modeling of construction worker tasks. 832
Proceedings of the International Conference on Computing in Civil and Building Engineering, pp. 833
1094-1101. https://doi.org/10.1061/9780784413616.136. 834
Sundin, A., and Örtengren, R. (2006). Digital human modeling for CAE applications. 835
Handbook of Human Factors and Ergonomics, Third Edition, pp.1053-1078. 836
https://doi.org/10.1002/0470048204.ch39. 837
Tak, S., Buchholz, B., Punnett, L., Moir, S., Paquet, V., Fulmer, S., Marucci-Wellman, H. 838
and Wegman, D. (2011). Physical ergonomic hazards in highway tunnel construction: overview 839
from the Construction Occupational Health Program. Applied ergonomics, 42(5), 665-671. 840
https://doi.org/10.1016/j.apergo.2010.10.001. 841
Tang, P., Huber, D., Akinci, B., Lipman, R., and Lytle, A. (2010). Automatic 842
reconstruction of as-built building information models from laser-scanned point clouds: A review 843
of related techniques. Automation in construction, 19(7), 829-843. 844
https://doi.org/10.1016/j.autcon.2010.06.007. 845
Taylor, G. W., Hinton, G. E., and Roweis, S. T. (2007). Modeling human motion using 846
binary latent variables. Advances in neural information processing systems, 19, 1345. 847
Tran D., and Sorokin, A. (2008). Human Activity Recognition with Metric Learning. 848
Computer Vision–ECCV 2008, 548-561. https://doi.org/10.1007/978-3-540-88682-2_42. 849
van Deursen, J., de Looze, M. P., van Rhijn, J. W., van der Grinten, M. P., and 850
Schoenmaker, N. (2005). Productivity and discomfort in assembly work: the effect of an 851

31
ergonomic workplace adjustment at Philips DAP. Comfort and design: principles and good 852
practice, 129-136, CRC Press. eBook ISBN: 9781420038132. 853
Wei, X., Min, J., and Chai, J. (2011). Physically valid statistical models for human motion 854
generation. ACM Transactions on Graphics (TOG), 30(3), Article No. 19. ACM Publications. 855
DOI: 10.1145/1966394.1966398. 856
Wu, H., Marshall, A., and Yu, W. (2007). Path planning and following algorithms in an 857
indoor navigation model for visually impaired. Proceedings of the Seconds International 858
Conference on Internet Monitoring and Protection (ICIMP), pp. 38-38, IEEE. DOI: 859
10.1109/ICIMP.2007.31. 860
Yan, X., Li, H., Li, A. R., and Zhang, H. (2017). Wearable IMU-based real-time motion 861
warning system for construction workers' musculoskeletal disorders prevention. Automation in 862
Construction, 74, 2-11. https://doi.org/10.1016/j.autcon.2016.11.007. 863
Yang, I., Hsieh, Y., and Kung, L. (2012). Parallel Computing Platform for Multiobjective 864
Simulation Optimization of Bridge Maintenance Planning. Journal of Construction Engineering 865
and Management 138(2), 215-226. https://doi.org/10.1061/(ASCE)CO.1943-7862.0000421. 866
Yao, J., Lin, C., Xie, X., Wang, A. J., and Hung, C. C. (2010). Path planning for virtual 867
human motion using improved A* star algorithm. Proceedings of the Seventh International 868
Conference on Information Technology: New Generations (ITNG), April 12-14, Las Vegas, 869
Nevada, USA, pp. 1154-1158. IEEE. DOI: 10.1109/ITNG.2010.53. 870
Zandin, K. B. (2002). MOST work measurement systems. CRC press. 871
Zhang, X., and Chaffin, D. B. (2005). Digital human modeling for computer-aided 872
ergonomics. Handbook of Occupational Ergonomics. W. Karwowski and W. S. Marras, Eds. New 873
York: Taylor & Francis. 874
Zhou, Z., Goh, Y. M., and Li, Q. (2015). Overview and analysis of safety management 875
studies in the construction industry. Safety science, 72, 337-350. 876
https://doi.org/10.1016/j.ssci.2014.10.006. 877