an integrated lot-sizing model with supplier and carrier selection...
TRANSCRIPT

1
An integrated lot-sizing model with supplier and carrier selection and
quantity discounts considering multiple products
S. J. Abrishamia, H. Vahdani
a,* and B. Rezaee
b
a. Department of Industrial Engineering, Faculty of Engineering, University of Bojnord, Bojnord, P. O. Box 94531-
55111, Iran
b. Industrial Engineering Department, Faculty of Engineering, Ferdowsi University of Mashhad, Mashhad, P.O. Box
91775-1111, Iran
ABSTRACT
Because of growing competition in the global markets and the vital role of suppliers in business success,
the subject of supplier selection has attracted many researchers and practitioners during the recent years.
In addition to the supplier selection, the order quantity discount provided by the suppliers, is considered
through a new mixed-integer linear programming (MILP) model involving a manufacturer with multiple
products and multiple purchasing items over multiple periods. According to the proposed model, the
manufacturer purchases different amount of raw materials from selected suppliers in order to produce
different products. Customers’ demands are fulfilled by minimizing the total purchase, inventory,
production, and transportation costs over a multi-period planning horizon. Since the problem is NP-hard,
an efficient genetic algorithm (GA) is used to solve the large-scale real-world instances. The results are
compared with results from the exact approach wherever possible in order to investigate the efficiency of
the algorithm.
Keywords: Supplier selection, Inventory management, Quantity discounts, Carrier selection, Genetic
algorithm.
1. INTRODUCTION
Selecting the best supplier among a large number of suppliers sits on the top of virtually all
companies’ agendas. In practice, in the increasingly competitive market, indicators such as the
offered prices and quality significantly affect the selection of suppliers. The costs of raw
materials which were supplied and purchased, comprises more than 50% of all costs [1].
Indeed, there is a strong correlation between the supplier selection problem and other subjects
such as inventory management as well as transportation strategies. Regarding the inventory
management issues, the decision-making process becomes more complicated when suppliers
offer their discount conditions in order to obtain a larger market share which in turn, leads
customers to have the benefit of purchasing materials at reduced costs. The subject of quantity
discounts has attracted significant attention in the literature over several decades. In the field of
supplier selection and order allocation within the supply chain context, some researchers have
accounted for the benefits of quantity discounts in their presented models [2-9].
Paying special attention to the logistics and transportation costs by selecting the shipping system
properly, play a considerable role in the mentioned area of the study, although considering carrier
selection in the supplier selection literature is rare [10-12].
In this study we examine a supply chain seeking to select appropriate suppliers in order to reduce
the costs associated with inventory management, production management, and transportation, in
a dynamic planning environment. The multi-product MILP model which is developed in this
paper, considers the decision variables related to the selection of suppliers, the amount of raw

2
material purchased from each supplier per period, carrier selection and inventory management
policy for each period. Accordingly, the presented model minimizes the total cost of supply chain
which includes raw materials, contracts, purchases from the supplier(s), production, storage and
carrier selection costs. To the best of our knowledge, considering all these factors simultaneously
has not received any attention in the literature. Specifically, we believe our main contribution is
to include the procurement of raw materials for present and upcoming production periods based
on the discount patterns and converting them to final products while dealing with a variety of raw
materials and products with different production plans, within an integrated supplier selection
model while the carier selection is taken into account, as well.
Since the modeling of the lot-sizing problems with above-mentioned assumptions belongs to the
family of NP-hard problems [13, 14], an efficient GA is provided. In order to validate the
proposed algorithm, it is implemented and analyzed on two data sets incorporating 20 samples,
one consisting of small-scale sample problems with obtainable optimal solutions, and the other
large-scale ones which their optimal solutions can not be reached through the exact method. A
direct comparison is made based on the value of objective function and elapsed runtime.
The remainder of this paper is organized as follows. Section 2 presents a brief review of the
existing relevant quantitative approaches related to the supplier selection and order allocation
problems along with the solution methods. Section 3 determines the mathematical model and
examines its validation on the small-scale examples based on several scenarios. In section 4, the
proposed GA is presented and applied on twenty small/large-scale samples and the results are
compared with the exact approach. Finally, conclusions and suggestions for the future research
are presented in section 5.
2. LITERATURE REVIEW
The supply of inexpensive materials from high-quality sources has great impact on developing
successful business strategies. For extensive literature reviews on “supplier selection and
decision making”, we can refer to De Boer et al. [15], Ho et al. [16] and Chai et al. [17]
consisting of different decision-making techniques such as Multi-Criteria Decision Making
(MCDM), Mathematical Programming (MP), and Artificial Intelligence(AI) along with
integrated approaches (AHP, ANP, DEA etc.).
Ghodsypour and O’Brien [18] proposed a mixed integer non-linear programming (MINLP)
model with multiple sources which consider the net inventory holding price as well as the
transportation and ordering costs. Basnet and Leung [19] proposed a supplier selection and an
inventory lot-sizing model including multiple products in a multi-period horizon to minimize the
purchasing, ordering and inventory holding costs. Liao and Rittscher [10] investigated a
nonlinear multi-objective model that includes minimizing the cost of logistics and transportation,
defective items and delivery time objectives along with the selected carrier. Rezaei and Davoodi
[13] presented two multi-objective mixed integer non-linear programming (MOMINLP) models
for multi-period lot-sizing supplier selection problems consisting of multiple products with
shortage and non-shortage assumptions. Their objectives were to optimize the cost (purchasing,
ordering, holding and transportation), quality, and service level. In another study, they proposed a
MINLP model with three objectives of total profit, inconsistency and deficiency [20]. They used
NSGA-II to solve their model. Mendoza and Ventura [21] proposed two mixed integer nonlinear
programming models to select the best set of suppliers and to determine the proper allocation of
order quantities. Their aim was to minimize the annual ordering, inventory holding, and
purchasing costs under suppliers’ capacity and quality constraints. Senyigit [22] presented a
MILP lot-sizing supplier selection model. His model incorporated a multi-product, multi-echelon
defective supply chain network seeking to minimize the total relevant costs. Aliabadi et al. [23]
provided an integrated non-linear binary model with multiple items for the supplier selection

3
problem. In their study, inventory costs for both suppliers and buyers, production costs for
suppliers and transportation costs are considered. Ventura et al. [24] provided a multi-period
inventory lot-sizing model for a single product in a serial supply chain. The objective of their
MINLP model was to minimize the total variable costs including purchasing, production,
inventory, and transportation costs. They also considered the all-unit quantity discounts approach
for the actual transportation costs.
A stochastic lot-sizing problem with multiple suppliers along with quantity discounts was
presented by Kang and Lee [25]. Their multi-objective programming model consisted of cost
minimization and service level maximization functions. They used an efficient heuristic dynamic
programming model to solve the MILP model. A MINLP model was presented for the order
allocation by Meena and Sarmah [8] which considered quantity discounts for potential suppliers
solved by a GA approach. In their research, the suppliers are exposed to the risk of failure due to
man-made or natural disruptions. Gorji et al. [26] presented a two-level supply chain with one
retailer and several suppliers involving multiple periods to determine both supplier selection and
inventory allocation policies. Total profit was the objective function of their MINLP model
which was solved by GA. Lee et al. [14] provided a MIP model for the lot-sizing supplier
selection problem encompassing multiple periods along with all-unit and incremental discounts.
They sought to minimize the costs including ordering, holding, purchasing, and transportation via
an efficient GA. Choudhary and Shankar [11] represented a single-objective MIP model that
considered supplier selection along with carrier selection. They allowed shortage on a single
product and used the exact method to solve the model. In their latest research, Choudhary and
Shankar [12] presented a goal programming model for inventory lot-sizing with the supplier
selection and carrier selection decision process. Their single-product multi-objective integer
linear programming (MOILP) approach incorporated the all-unit quantity discounts which were
offered by potential suppliers. Cardenas-Barron et al. [27] presented a new reduce and optimize
approach to solve the MILP for the multi-product multi-period inventory lot sizing with supplier
selection problem solved by a heuristic algorithm. Zaheri et al. [28] proposed two models to
formulate a Supplier selection in a single-buyer, multi-supplier two-echelon supply chain
network under all-unit quantity discount policy that both buyer and vendor play the leadership
role in a bi-level programming model structure. Ghaniabadi and Mazinani [29] presented the
single product dynamic lot sizing problem with supplier selection and backlogging in the
presence of incremental and all-units quantity discounts. Alfaresa and Turnadi [30] provided a
MIP model for a realistic multi-item lot-sizing problem with multiple suppliers, multiple time
periods, quantity discounts, and backordering of shortages. In order to tackle larger problem
sizes, two heuristic solution methods are proposed including a Silver-Meal heuristic and a
problem-specific GA. Suriyan and Rungreunganun [31] present mathematical developments
minimizing the total costs of inventory management MILP and supplier selection for inventory
lot-sizing problem with quantity discounts with multi-products through multi-periods with the
consideration of supplier lead-times and under the conditions of purchasing budgets.
Kanchanaruangrong and Woarawichai [32] proposed a multi-product and multi-period inventory
lot-sizing problem with supplier selection under vehicle capacity and both all-units and
incremental quantity discounts. The buyer’s objective of their MILP model was to minimize
costs including purchase cost of the products, ordering cost for the suppliers, transportation cost
for the suppliers and holding cost of the remaining inventory in each period. Zaheri et. Al [33]
aimed to formulate a supply chain with a buyer and multiple suppliers using bi-level
programming approach with a hierarchical structure and PSO and Differential Evolution (DE)
algorithms were developed to solve their nonlinear bi-level programming problem (NBLP).
Table 1 illustrates a comparison between the present research and other existing studies in this
area.
4
(Table 1 should be inserted here)
In the supplier selection domain, there are a few studies that have simultaneously considered
quantity discounts while shipping through the selected carriers. Most of these studies focus on
single product mode and do not account for the production constraints. As a result, raw materials
and time constraints, which are the most important components in a production process, have not
been examined in the literature. The purpose of this study is to support decision makers by
providing a MILP model looking to establish a trade-off among inventory holding, production,
transportation and procurement process costs, within an all-unit quantity discounts environment.
3. PROBLEM DEFINITION AND MODEL DEVELOPMENT
With the expansion of the competitive atmosphere, it is remarkable that in the real world each
manufacturer can satisfy their demands through different suppliers providing different quantity
discounts and then carry them using various carriers. According to this, we consider a supply
chain containing several suppliers which supply different raw materials and a manufacturer that
produces different types of products to fulfill the customers’ demands, so that raw materials are
transported to manufacturer by different transportation carriers. The total cost is the sum of the
purchasing, ordering, production, inventory holding and transportation costs. The solution to the
problem determines which raw materials should be ordered, in what quantities, from which
supplier(s), by which transportation carrier(s), and during which time periods, so that the
customers’ demand is satisfied whereas the product shortage is not allowed. There is also the
possibility for the manufacturer to take advantage of discounts to purchase raw materials at large
volumes and store them to fulfill the customers’demands in the future. Due to the production
costs and time constraints in each period, the manufacturer should adopt an efficient policy on
purchase quantities in order to reach a cost balance. In the meantime, the costs of shipment
between the manufacturer and customers are undertaken by customers; thus, it is not considered
in the model. Fig.1 shows the assumed supply chain network.
(Figure 1 should be inserted here)
Other assumptions considered in this study are as follows:
The demand quantities for multiple products are known but inconstant over the multiple
planning periods.
The price of unit raw material received from suppliers depends on the order quantity in
each period. With this in mind all-unit quantity discount is applied.
Inventory holding costs are known for raw material and product and vary in each period.
The planning horizon is finite and known. The length of each period is fixed as well.
Transportation costs depend on the selected carrier(s), which in turn depend on the
selected supplier and period.
The supply capacity of suppliers is finite and different in each period.
The storage capacity of raw materials and products is finite and different in each period.
Each carrier has a distinct capacity which is limited.
The number of available carriers is finite and different in each period.
The notations of the model are presented as follows:

5
Set indices:
i the index of the raw materials purchased from the suppliers (i = 1, 2, …, I)
j the index of the suppliers (j = 1, 2, …, J)
k the index of the all-unit price break levels (k = 1, 2, …, K)
t the index of the discrete planning periods (t = 1, 2, …, T)
l the index of the transportation carriers (l = 1, 2, …, L)
p the index of the products (p = 1, 2, …, P)
Parameters:
Dpt the total demand of the p-th product in period t
Ojt the cost of placing order to supplier j in period t
PRpt the production cost per unit of product p in period t
CPt the storage capacity of the products of the manufacturer in period t
tp the time needed to produce one unit of product p
Tt total time available for production in period t
αip the units of raw material i required to produce one unit of product p
CRt the storage capacity of the raw materials of the manufacturer in period t
CSijt the supply capacity of raw material i by supplier j in period t
Wi the cubic volume of raw material i
UVl the maximum volume capacity of carrier l
UNVlt the maximum available number of carrier l in period t
Bijkt the quantity at which all-unit price break k occurs at supplier j in period t for raw material
i
Pijkt the cost of procuring one unit of raw material i from supplier j at price break level k in
period t
hit the inventory holding cost per unit raw material i during period t
Hpt the inventory holding cost per unit product p during period t
CVjlt the transportation cost from supplier j by carrier l in period t
M a sufficiently large number.
Decision variables:
Xijktl the quantity of raw material i purchased from supplier j at price break level k in period t
transported by carrier l
Ypt the quantity of product type p manufactured in period t
NVjlt the quantity of carrier l used in period t for supplier j
zjt a binary variable: 1if supplier j is chosen in period t, 0 otherwise
vjlt a binary variable: 1 if carrier l is used in period t for supplier j, 0 otherwise
Iit the inventory level of raw material i at the end of period t
I'pt the inventory level of product p at the end of period t
bijkt a binary variable: 1 if the lot-size of raw material i purchased from supplier j placed in
price break level k in period t, 0 otherwise.
3.1. Problem formulation
According to the above parameters, decision variables, and model assumptions, the mathematical
model can be formulated as follows:
𝑀𝑖𝑛 𝑍 = 𝑍1 + 𝑍2 + 𝑍3 + 𝑍4 + 𝑍5 (1)
𝑍1 = ∑ ∑ ∑ ∑ ∑ Xijktlltkji Pijkt (1a)
𝑍2 = ∑ ∑ zjt Ojt𝑗𝑡 (1b)

6
𝑍3 = ∑ ∑ 𝑌pt𝑃𝑅pt𝑝𝑡 (1c)
𝑍4 = ∑ ∑ Iitit hit + ∑ ∑ I'ptpt 𝐻pt (1d)
𝑍5 = ∑ ∑ ∑ CVjltljt NVjlt (1e)
Subject to:
𝐼′pt = 𝐼′
p(t-1) + 𝑌pt − 𝐷pt ∀ 𝑝 , 𝑡 > 1 (2)
∑ 𝐼′pt ≤ 𝑝 𝐶𝑃t ∀ 𝑡 (3)
∑ 𝑌pt 𝑡p𝑝 ≤ 𝑇t ∀ 𝑡 (4)
𝐼it = 𝐼i(t-1) + ∑ ∑ ∑ 𝑋ijktl𝑙 − ∑ 𝑌pt𝑝𝑘𝑗 𝛼it ∀ 𝑖 , 𝑡 > 1 (5)
∑ 𝐼it𝑖 ≤ 𝐶Rt ∀ 𝑡 (6)
∑ ∑ Xijktllk ≤ CSijt Zjt ∀ 𝑖 , j , t (7)
∑ 𝑣jlt𝑙 = zjt ∀ j , t (8)
∑ ∑ 𝑋ijktl𝑘𝑖 ≤ 𝑀 𝑣jlt ∀ i , j , k , t , l (9)
∑ ∑ 𝑋ijktl 𝑊i𝑖𝑘 ≤ 𝑁𝑉jlt 𝑈𝑉l + 𝑀 (1 − 𝑣jlt) ∀ 𝑗 , l , t (10)
∑ 𝑁𝑉jlt𝑗 ≤ 𝑈𝑁𝑉lt ∀ l , t (11)
Bij(k-1)t bijkt ≤ ∑ Xijktll ≤ Bijkt bijkt ∀ i , j , t , k >1 (12)
∑ 𝑏ijkt𝑘 = 𝑧jt ∀ i , j , t (13)
Iit . I'pt ≥ 0 ∀ i , t , p (14)
𝑋ijktl , 𝑌pt , 𝑁𝑉jlt ≥0 𝑎𝑛𝑑 𝑖𝑛𝑡𝑒𝑔𝑒𝑟 ∀ i , j , k , t , l , p (15)
𝑧jt , 𝑣jlt ,bijkt 𝜖 {0 , 1} ∀ 𝑖 , j , k , l , t (16)
The objective function (1) is to minimize the total cost over the planning horizon. It consists of
five terms: (1a) the costs of the purchase, (1b) the ordering costs, (1c) the production costs, (1d)
the inventory holding costs for the remaining inventory at the end of each period, which includes
raw materials and products holding costs respectively, and (1e) the transportation costs.
Constraint (2) represents the inventory balance of products in different periods. Constraint (3)
enforces the products’ storage capacity per period. Constraint (4) controls the capability of
production in each period by time limit production.Constraint (5) computes the amount of raw
materials that remain at the end of each period. Constraint (6) determines the raw materials’
storage capacity per period. Constraint (7) ensures that raw materials will be provided through
suppliers’ contracts with the manufacturer. The purchase quantity must not exceed the maximum
supplier capacity. Constraint (8) indicates that if the contract is performed by a supplier, a
transportation system must also be considered. Constraint (9) assures that if the carrier is not
assigned to a supplier, the supplier will not be able to ship the raw materials. Constraint (10)
determines the number of carriers used for shipping with respect to its volume. Constraint (11)
guarantees that the total number of carriers deployed for transportation will not surpass the
maximum number of carriers. Constraints (12-13) are related to the all-unit quantity discount
plan. According to these constraints, each lot is purchased from suppliers at a specified price
break in the discount interval. Only one price break level which is applied to the lot-size in each
period and supplier is considered. Finally, Constraints (14-16) identify the type of different
variables.

7
3.2. Numerical example
To explain the performance of the proposed mathematical model, a numerical example is
provided in which the manufacturer wants to purchase three types of raw materials to produce
two types of products over a planning horizon of five periods through three potential suppliers.
Customers’ demands are 20 and 30 for the product number one and two in each period,
respectively. The coefficient of raw materials usage for production, the volume of raw materials
as well as the capacity of suppliers- which have been considered to be constant through different
periods- are given in Table 2. The ordering costs are assumed to be constant in each period,
which are 120, 100 and 110 in a monetary unit, respectively. Inventory holding costs for each
raw material unit are 2, 3, and 2 in a monetary unit, respectively. Inventory holding costs of
products, the time needed to produce one unit of each product and production costs are shown in
Table 3. The total production time available in each period is 500 time units. The Storage
capacities for the raw materials and products in manufacturer area are 1000 and 100 per period,
respectively.
The suppliers’ proposed prices for the raw materials considering the price break levels are
presented in Table 4. In this example, the discount levels for different periods and raw materials
are assumed to be identical.
(Table 2, 3 and 4 should be inserted around here)
Table 5 shows the transportation costs proposed by the suppliers considering the carriers and
their maximum capacity volume. Moreover, it displays the maximum number of available
carriers, which varies by the period.
(Table 5 should be inserted here)
Table 6 shows the solution obtained from solving the model. As the results show, the optimal
solution is to purchase the first raw material (400 units), the second raw material (450 units), and a
fraction of the third one (200 units) from the first supplier. The second supplier is selected to
supply 300 units of the third raw material, because of the better discount and closer distance of
supplier 1, which is obvious in table 6.
(Table 6 should be inserted here)
3.3. Scenarios
For a more comprehensive assessment of the problem parameters, different scenarios have been
examined. In this section, we assess two important scenarios to delve into the impact of different
quantity discounts and inventory costs on the objective function, while keeping the rest of the
parameters at their base value. Three additional scenarios assess the effects of quantity discounts
and five further scenarios investigate the inventory costs for the raw materials and products.
3.3.1. The analysis of quantity discounts
As mentioned before, to analyze the effects of quantity discounts, three sub-scenarios are defined
and provided in Table 7. In sub-scenario 1, the first supplier does not offer any discounts,

8
whereas suppliers 2 and 3 offer their previous discounts. As expected, we observe that most of
the materials (over 82% of all purchases) are now sourced from suppliers 2 and 3. Thus,
manufacturer’s purchase from supplier 1 is decreased by about 60%.
In the second sub-scenario, only supplier 3 offers quantity discounts and as a result, a significant
percent of the purchases (59%) is made from supplier 3. In addition, because of the proximity of
supplier 1, the remaining purchases are sourced from supplier 1.
In sub-scenario 3, suppliers do not offer any discounts, and the selection is made based on other
problem criteria. Due to more appropriate conditions offered by the first supplier, all purchases
are allocated to it.
(Table 7 should be inserted here)
Fig. 2 illustrates the effects of these variations on the costs. As expected, by eliminating the
quantity discount advantage, the total costs as well as the purchasing costs increase, but the costs
of ordering and transportation do not show any significant difference. The model strives to find
the best trade-off among these cost categories to compensate the increase in the purchasing costs.
(Figure 2 should be inserted here)
3.3.2. The analysis of inventory holding costs
Table 8 illustrates how the amount of purchases is affected by the inventory holding costs. There
are five scenarios in which the effects of changes on inventory holding cost for the products and
the raw materials are examined. In scenarios 1 and 2 the inventory holding cost for the products
is decreased and increased, respectively.
In scenario 1, the reduction in the holding costs of products drives the manufacturer to supply the
raw materials and produce the final products less frequently and in larger sizes in order to take
advantage of the offered discounts. From Table 8, this practice reduces the total ordering cost,
whereas the total inventory of the products at the end of each period will significantly increase.
In scenario 2, as expected, the significant increase in the products’ inventory holding costs leads
to zero inventory level for the products at the end of each period and an increase in the number of
orders.
In scenario 3, as the inventory holding costs of the raw materials decreases, the manufacturer
supplies the raw materials in larger quantities, which in turn decreases the inventory level of the
final products at the end of each time period. This policy will also provide the manufacturer with
more opportunities to take advantage of the offered discount privileges. In Scenario 4, as the
inventory holding costs of raw materials increases, the objective function increases, whereas the
decision variables remain unchanged compared to that of the basic example. The latter is a direct
effect of the existing trade-off between the potential discount benefits of ordering in larger
quantities versus the rise in the holding costs, which prompts the manufacturer to follow its
existing course of ordering and production policies. In Scenario 5, the raw materials undergo a
substantial increase in the holding costs to the extent which cannot be offset by the suggested
discount benefits. Table 8 shows the change in the order and production policies, so that the
inventory only comprises the final products, i.e., no raw material inventory is held at the end of
any time period.

9
In a nutshell, our analyses show that the costs related to raw materials and the final products have
consequential influences on supply chain policies, performance, and costs. Therefore, we
recommend that supply chain players should acquire more accurate business cost estimations.
(Table 8 should be inserted here)
4. SOLUTION METHOD
In the literature, because of the NP-hardness of lot-sizing in this area, different methods have
been used to solve the supplier selection problem. The results of applying GA to a wide variety
of supplier selection problems have been very promising among other evolutionary algorithms in
both single and multi-objective problems (Liao and Rittscher [10]; Rezaei and Davoodi [13, 20];
Lee et al. [14]; Aliabadi et al. [23]; Gorji et al. [26]). Therefore, encouraged by its noticeable
positive features, a GA is proposed in this study to handle large scale problem instances.
4.1. Chromosome representation
In order to solve the problem, a chromosome is designed with four parts. The first part of the
chromosome is a P×(T-1) matrix which is used to calculate the quantity of the leftover products
after consumption in each period. The elements of this matrix belong to the standard normal
distribution function. Since the premise of the problem is to fulfil customer demand in each
period, the available inventory level of the products at every period is determined in this part of
the chromosome. The second part of the chromosome is an I×(T-1) matrix representing the
amount of the raw materials left after consumption in each period. The elements of this matrix
also have a standard normal distribution. The amount of the raw materials needed in each period
is calculated by the following equation:
𝑇ℎ𝑒 𝐷𝑒𝑚𝑎𝑛𝑑 𝑜𝑓 𝑟𝑎𝑤 𝑚𝑎𝑡𝑒𝑟𝑖𝑎𝑙 𝑖 𝑛𝑒𝑒𝑑𝑒𝑑 𝑖𝑛 𝑝𝑒𝑟𝑖𝑜𝑑 𝑡 = ∑ 𝑌pt𝑝 𝛼it ∀ 𝑝 , 𝑡 > 1 (17)
With regard to the values of the second part of the chromosome, the purchasing amount of the
raw materials can be calculated by the following equations in each period:
𝑇ℎ𝑒 𝑃𝑢𝑟𝑐ℎ𝑎𝑠𝑖𝑛𝑔 𝑎𝑚𝑜𝑢𝑛𝑡 𝑜𝑓𝑟𝑎𝑤 𝑚𝑎𝑡𝑒𝑟𝑖𝑎𝑙 𝑖 𝑖𝑛 𝑝𝑒𝑟𝑖𝑜𝑑 𝑡= 𝑇ℎ𝑒 𝑑𝑒𝑚𝑎𝑛𝑑 𝑜𝑓 𝑟𝑎𝑤 𝑚𝑎𝑡𝑒𝑟𝑖𝑎𝑙 𝑖 𝑖𝑛 𝑝𝑒𝑟𝑖𝑜𝑑 𝑡× [1 + 𝑇ℎ𝑒 𝑒𝑙𝑒𝑚𝑒𝑛𝑡𝑠 𝑜𝑓 𝑚𝑎𝑡𝑟𝑖𝑥 (𝑖,𝑡)]− 𝑇ℎ𝑒 𝑖𝑛𝑣𝑒𝑛𝑡𝑜𝑟𝑦 𝑎𝑚𝑜𝑢𝑛𝑡 𝑜𝑓 𝑡ℎ𝑒 𝑝𝑟𝑒𝑣𝑖𝑜𝑢𝑠 𝑝𝑒𝑟𝑖𝑜𝑑 (𝑓𝑜𝑟 𝑡 < 𝑇)
(18)
and,
𝑇ℎ𝑒 𝑝𝑢𝑟𝑐ℎ𝑎𝑠𝑖𝑛𝑔 𝑎𝑚𝑜𝑢𝑛𝑡𝑠 𝑜𝑓 𝑟𝑎𝑤 𝑚𝑎𝑡𝑒𝑟𝑖𝑎𝑙 𝑖 𝑖𝑛 𝑝𝑒𝑟𝑖𝑜𝑑 𝑇= 𝑇ℎ𝑒 𝑑𝑒𝑚𝑎𝑛𝑑 𝑜𝑓 𝑟𝑎𝑤 𝑚𝑎𝑡𝑒𝑟𝑖𝑎𝑙 𝑖 𝑖𝑛 𝑝𝑒𝑟𝑖𝑜𝑑 𝑇− 𝑇ℎ𝑒 𝑖𝑛𝑣𝑒𝑛𝑡𝑜𝑟𝑦 𝑎𝑚𝑜𝑢𝑛𝑡 𝑜𝑓 𝑝𝑟𝑒𝑣𝑖𝑜𝑢𝑠 𝑝𝑒𝑟𝑖𝑜𝑑
(19)
After determining the required purchasing amount of raw materials by the first two parts of the
chromosome, the third part determines how to provide the purchase quantities belonging to each
supplier by an i×j×t matrix with elements taking values from [0,1] and each corresponding to a
supplier and a raw material in a period. The elements of this matrix show the supply priority of
the specific raw material by the specific supplier in each period. The chromosome numbers are
used in compliance with the supplier capacity constraints in a way that the supplier with the
highest priority is selected to provide the maximum amount of raw materials. The other suppliers

10
will be selected in the order of precedence to meet the total demand. In the fourth part of the
chromosome, carriers are allocated to each selected supplier. This part is a j×l×t matrix with
[0,1] element values and is used to cover the carriers’ capacity constraints.
4.2. Initialization of the population
There are different approaches to produce the initial population which is the starting point of the
algorithm. In this study, we have adopted the random generation of solutions approach to create
the initial population. In this way, for each population, a chromosome with the specifications
described in the previous subsection is randomly generated. The feasibility conditions that must
be assessed after generating each chromosome are:
Limitation of time availability for production
Product storage capacity constraints
Storage capacity constraints for the raw materials.
4.3. Fitness function
Each chromosome is a plausible solution of the problem which is used to calculate the fitness
value of the objective function. Since the objective function is based on costs, smaller objective
function values generate higher fitness values.
4.4. Selection strategy
The solutions of GA evolve from each generation to the next. Evolution of the population is
realized through GA operators such as crossover, mutation and elitism. The hatching process in
which we need to select the solutions (chromosomes) from the population, is accomplished
through a crossover operation. Different methods have been proposed to select the parents
(boltzmann selection, tournament, rank, steady state etc.). The selection method by the Roulette
wheel which has been used in this study is among the most popular ones. Moreover, the elitism
idea has been implemented on the GA and a percentage of the best chromosomes in the current
population will be kept for the next generation.
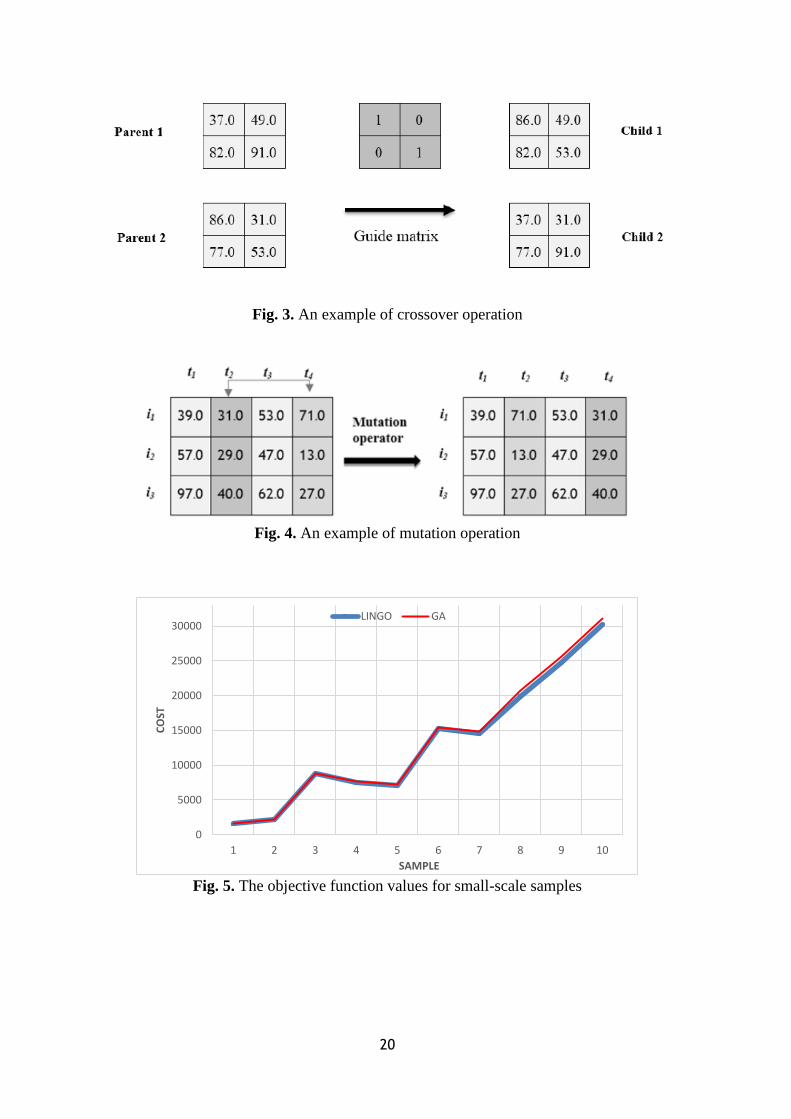
4.5. Crossover operation
The crossover operator is implemented based on a guide matrix with binary elements. For each
chromosome, there is a guide matrix with equal dimensions. To generate new offsprings, the
crossover operator is applied to the parents selected by the Roulette wheel approach. If the value
of the corresponding element in the guide matrix equals 1, the corresponding values of the parent
element would be replaced, otherwise the element is left unchanged. Fig. 3 represents an example
of a crossover operation.
(Figure 3 should be inserted here)
4.6. Elitism operation
According to this operator, the chromosomes having the best fitness value in the active
generation are automatically carried over to the next. This operator causes further improvement
in the efficiency of GA by preventing the loss of good solutions. In other words, the solution
quality obtained by the GA will not decrease from one generation to the next.
11
4.7. Local search
In each iteration of the provided GA, we search to find better neighbourhoods around better
solutions in the population. A certain percentage of the best solutions for each generation of the
algorithm will be examined in order to find better neighbourhoods. To create a neighbourhood
for the algorithm in every part of the chromosome, new elements are calculated through the
following equation:
New element = (1 + R) * Old element
In this equation, “R” is a random number with the standard normal distribution. If the new
element takes a value more than 1, it will set to 1 and if it takes a value less than zero, it will be
considered equal to zero. Searching to find a better neighbourhood stops after finding a better
solution. Otherwise, after certain steps and finding no better solution, it stops.
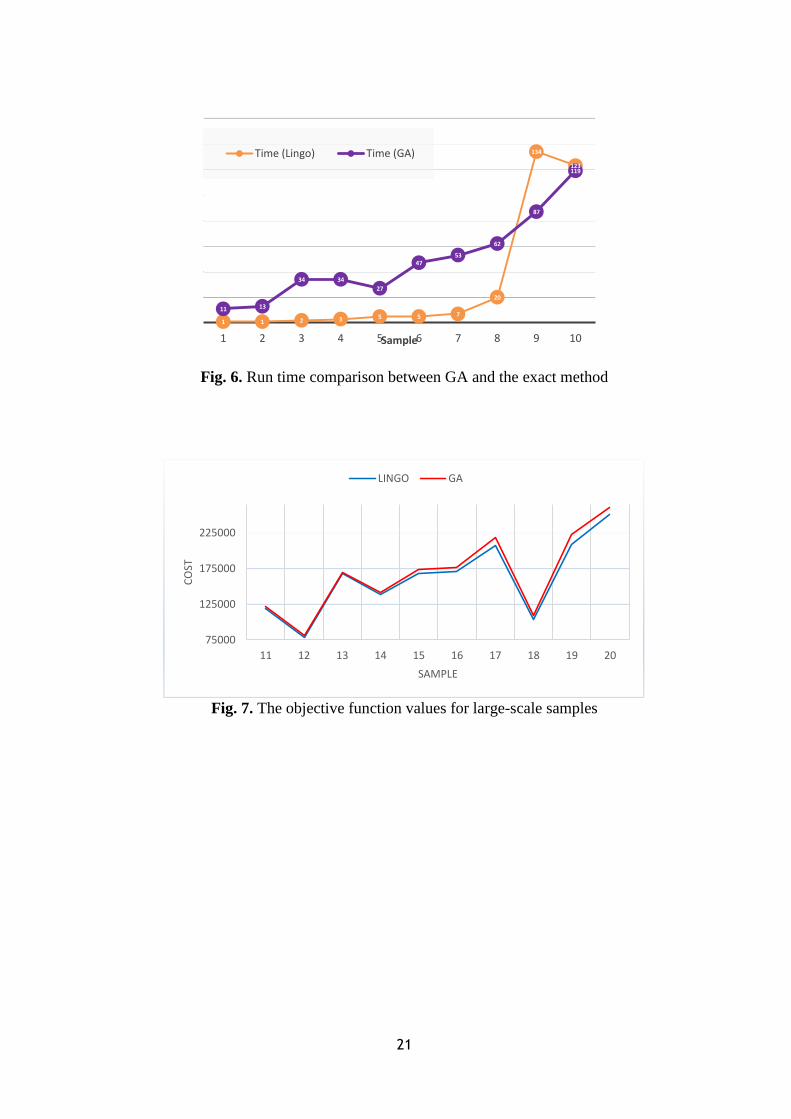
4.8. Mutation operation
In the mutation operation, we randomly switch rows or columns of the chromosome. For the
parts of the chromosome that has more than one dimension, this action is applied to each and
every dimension. Fig. 4 shows an example of a mutation operation.
(Figure 4 should be inserted here)
4.9. Termination criterion
The most common termination criteria in GA include the fixed number of iterations (or a fixed
length of computational time), an arbitrary number of iterations where no further improvement is
realized in the objective function, and when the predefined threshold in the objective function
value is reached. As for the proposed design, we let the iterations proceed to a specified number;
however, the algorithm terminates if no improvement is achieved during 50 consecutive
iterations.
4.10. Parameter setting of the proposed GA
We have borrowed the same parameters setting method form Gorji et al [26] and Dai and Zheng
[34], based on performing considerable amount of experimental analyses. To find the optimal
solution efficiently, some parameters of the GA require to be set appropriately, including the
population size, maximum generation number, crossover rate, mutation rate, elitism rate as well
as the local search rate. According to this statement, these parameters will be set to achieve the
best optimal minimum cost possible in a short time.
Population size. It is noteworthy that if the population size is huge, it would probably lead to
very slow rate of convergence and elude sub-optimal solutions. On the other hand, a small
population probably results in a premature convergence and quick rate of convergence. Thus,
in the presented article, two choices are available for the population size: 250 and 350 which
have moderately resulted in better solutions through extensive experiments having been done
on different values for this parameter.
The maximum generation number. Two options have been applied here: 150 and 200.
Crossover and mutation rate. Crossover and mutation are the ways to generate new
individuals which are mostly used to provide exploitation and exploration, respectively. In
this paper, each of them has two choices: 0.85 and 0.93 for crossover, 0.1 and 0.18 for
mutation.

12
The elitism rate. Elitism guarantees that the solution quality obtained from the GA will not
decrease from one generation to the next. In this paper, two choices have been considered
which are 0.1 and 0.25.
The local search rate. Two options have been applied here: 0.1 and 0.2.
As can be seen in Table 9, based on our computational experiments the following combination
obtains the best value for the objective function with the shortest time: the population size,
maximum generation, crossover rate, mutation rate, elitism rate and the rate of the local search
are set at “350”, “150”, “0.93”, “0.1”, “0.25”, and “0.2”, respectively. Of course, these
parameters can not guarantee a global optimal solution.
(Table 9 should be inserted here)
5. THE RESULTS OF THE NUMERICAL EXAMPLES
In this section, 10 small and 10 large sample problems are presented to examine the problem in
different scales. The experiments were performed on a PC with an Intel dual core i5 CPU at 2.5
GHz and 4 GB of RAM. The results obtained from the GA (coded in MATLAB software) are
compared with those of the exact method using LINGO 12. Twenty samples with different
dimensions illustrated in Table 10 are considered and the values of the common parameters
which are used in these samples are shown in Table 11.
(Table 10 and 11 should be inserted here)
The results which are obtained on small-scale and large-scale problems are presented in Table 12
and 13, respectively. The average run-time is derived from the average of five-time
implementations of the algorithm. The gap is obtained through comparing the averages of the
best solution values among those five-time implementations with that of the exact method. Fig. 5.
demonstrates the values of the objective function over small-scale samples.
(Table 12 and 13 should be inserted here)
As the dimension of the problem increases (samples 11 to 20), the exact method fails to reach the
optimal solution in a reasonable time while the proposed GA achieves near-optimal solutions at a
fairly short run and with a little variation. It is noteworthy that for samples 19 and 20, the exact
method fails to find a feasible solution even in 2,000 seconds and hence, we have terminated it in
4,000 seconds of run time.
(Figure 5 should be inserted here)
Considering Fig. 6, it can be observed that the run times for the GA are more than the exact
method for samples 1 to 8, while in the rest of the samples, this trend has changed showing the
effectiveness of the presented GA. Fig. 7 shows the rate of change in the objective function value
in samples 11 to 20, so that the gap of the solutions is very close which is a persuasive reason to
provide proof of the effectiveness of the presented GA.

13
(Figure 6 and 7 should be inserted here)
6. CONCLUSION
Today, due to the increasing demands and intense competition among product manufacturers, the
need for multi-product productions along with an efficient inventory management is felt more
than ever. This paper presents a multi-product MILP model for the supplier selection over a
multi-period planning horizon. The objectives include the purchase cost of the raw materials
from the suppliers, ordering costs, production costs, inventory holding costs of the raw materials
and products, as well as the transportation costs. In the problem setting, the manufacturer is
allowed to purchase the required raw material through the all-unit quantity discount plan offered
by the suppliers which are required to completely satisfy customers’ demands. Different raw
materials could be shipped by different carriers. The Proposed model seeks to determine which
raw materials should be ordered, in what quantities, from which suppliers, by which
transportation carriers, and in which periods. To solve the proposed model, an efficient GA has
been proposed and twenty small-scale and large-scale samples are presented to show the
applicability of the approach. The results are compared with those of the exact method to show
the performance of the proposed algorithm.
For the future research, the present model can be further developed by taking into account other
assumptions such as the backlog or loss in demand fulfilment, introducing probabilistic and fuzzy
parameters. In addition, other meta-heuristics can be employed to improve the quality of
solutions and reduce the run time needed to solve the problem. Introducing multiple competing
objectives to the problem setting can also serve as an interesting direction for the future research.
There are some other related areas that can be inspiring to develop this work such as: sustainable
supplier selection, green supplier selection and implementing the MADM approach to cope with
new problems regarding various optimization criteria [35-36].
REFERENCES
1. Aissaoui, N., Haouari, M. and Hassini, E. “Supplier selection and order lot
sizing modeling: A review”, Computers & Operations Research, 34, pp. 3516–
3540 (2007).
2. Mendoza, A. and Ventura, J. A. “Incorporating quantity discounts to the EOQ
model with transportation costs”, International Journal of Production
Economics, 113, pp. 754–765 (2008).
3. Manerba, D. and Mansini, R. “An exact algorithm for the Capacitated Total
Quantity Discount Problem”, European Journal of Operational Research, 222,
pp. 287–300 (2012).
4. Mansini, R., Tocchella, B. and Savelsbergh, M. “The supplier selection
problem with quantity discounts and truck load shipping”, Omega, 40, pp.
445–455 (2012).
5. Zhang, J. L. and Chen, J. “Supplier selection and procurement decisions with
uncertain demand, fixed selection costs and quantity discounts’, Computers
and Operations Research, 40, pp. 2703–2710 (2013).

14
6. Nazari-Shirkouhi, S., Shakouri, H., Javadi, B. et al., “Supplier selection and
order allocation problem using a two-phase fuzzy multi-objective linear
programming”, Applied Mathematical Modelling, 37, pp. 9308–9323 (2013).
7. Jolai, F., Neyestani, M. S., and Golmakani, H. “Multi-objective model for
multi-period, multi-products, supplier order allocation under linear discount”,
International Journal of Management Science and Engineering Management, 8,
pp. 24–31 (2013).
8. Meena, P.L. and Sarmah, S.P. “Multiple sourcing under supplier failure risk
and quantity discount: A genetic algorithm approach”, Transportation Research
Part E, 50, pp. 84–97 (2013).
9. Babić, Z. and Perić, T. “Multiproduct vendor selection with volume discounts
as the fuzzy multi-objective programming problem”, International Journal of
Production Research, 52, pp. 4315–4331 (2014).
10. Liao, Z. and Rittscher, J. “A multi-objective supplier selection model under
stochastic demand conditions”, International Journal of Production Economics,
105 (1), pp. 150–159 (2007).
11. Choudhary, D. and Shankar, R. “Joint decision of procurement lot-size,
supplier selection, and carrier selection”, Journal of Purchasing and Supply
Management, 19, pp. 16–26 (2013).
12. Choudhary, D. and Shankar, R. “A goal programming model for joint decision
making of inventory lot- size, supplier selection and carrier selection”,
Computers and Industrial Engineering, 71, pp. 1–9 (2014).
13. Rezaei, J. and Davoodi, M. “Multi objective models for lot-sizing with supplier
selection”, International Journal of Production Economics, 130 (1), pp. 77–86
(2011).
14. Lee, A.H.I., Kang, H.Y., Lai, Ch.M. et al. “An integrated model for lot sizing
with supplier selection and quantity discounts”, Applied Mathematical
Modelling, 37, pp. 4733–4746 (2013).
15. De Boer, L., Labro, E. and Morlacchi, P. “A review of methods supporting
supplier selection”, European Journal of Purchasing and Supply Management,
7, p. 75–89 (2001).
16. Ho, W., Xu, X. and Dey, P. K. “Multi-criteria decision making approaches for
supplier evaluation and selection: A literature review”, European Journal of
Operational Research, 202, pp. 16–24 (2010).
17. Chai, J., Liu, J.N.K. and Ngai, E.W.T. “Application of decision-making
techniques in supplier selection: A systematic review of literature”, Expert
Systems with Applications. 40, pp. 3872–3885 (2013).
18. Ghodsypour, S.H. and O’Brien, C. “The total cost of logistics in supplier
selection, under conditions of multiple sourcing, multiple criteria and capacity
constraint”, International Journal of Production Economics, 73 (1), pp. 15–27
(2001).
19. Basnet, C. and Leung, J.M.Y. “Inventory lot-sizing with supplier selection”,
Computers and Operations Research, 32, pp. 1–14 (2005).
20. Rezaei, J. and Davoodi, M. “A joint pricing, lot-sizing, and supplier selection
15
model”, International Journal of Production Research, 50 (16), pp. 4524–4542
(2012).
21. Mendoza, A. and Ventura, J. A. “Analytical models for supplier selection and
order quantity allocation”, Applied Mathematical Modelling, 36, pp. 3826–
3835 (2012).
22. Senyigit, E. “The optimization of lot sizing with supplier selection problem in
multi-echelon defective supply chain network”, Mathematical and Computer
Modelling of Dynamical Systems, 18, pp. 273–286 (2012).
23. Aliabadi, D. E., Kaazemi, A. and Pourghannad, B. “A two-level GA to solve
an integrated multi-item supplier selection model”, Applied Mathematics and
Computation, 219, pp. 7600–7615 (2013).
24. Ventura, J. A., Valdebenito, V. A. and Golany, B. “A dynamic inventory
model with supplier selection in a serial supply chain structure”, European
Journal of Operational Research, 230, pp. 258–271 (2013).
25. Kang, H. Y. and Lee, A. H. I. “A stochastic lot-sizing model with multi-
supplier and quantity discounts”, International Journal of Production Research,
51, pp. 245–263 (2013).
26. Gorji, M. H., Setak, M., and Karimi, H. “Optimizing inventory decisions in a
two-level supply chain with order quantity constraints”, Applied Mathematical
Modelling, 38, pp. 814–827 (2014).
27. Cardenas-Barron, L. E., Gonzalez-Velarde, J. L. and Trevino-Garza, G. “A
new approach to solve the multi-product multi-period inventory lot sizing with
supplier selection problem”, Computers and Operations Research, 64, pp. 225-
232 (2015).
28. Zaheri, F., Zandieh, M. and Taghavifard, M. T. “Bi-level programming for
supplier selection under quantity discount policy”, Scientia Iranica E, 24(4),
pp. 2095-2104 (2017).
29. Ghaniabadi, M., Mazinani, A. “Dynamic lot sizing with multiple suppliers,
backlogging and quantity discounts”, Computers and Industrial Engineering,
110, pp. 67-74 (2017).
30. Alfares, H. K. and Turnadi, R. “Lot sizing and supplier selection with multiple
items, multiple periods, quantity discounts, and backordering”, 116, pp. 59-71
(2018).
31. Suriyan, S. and Rungreunganun, V. “Multi product dynamic lot-sizing with
supplier selection under quantity discount and budget constraints”,
International Journal of Applied Engineering Research, 13(2), pp. 1373-1380
(2018).
32. Kanchanaruangrong, N. and Woarawichai, C. “Modeling and solving of multi-
product inventory lot-sizing with supplier selection under quantity discounts”,
International Journal of Applied Engineering Research, 13(10), pp. 8708-8713
(2018).
33. Zaheri, F., Zandieh, M., Taghavifard, M. T. et al., E. “A bi-level programming
model to solve supplier selection and lot-sizing problem addressing quantity
discounts and transportation cost”, Industrial Engineering and Management

16
Systems, 17(2), pp. 267-280 (2018).
34. Dail, Z. and Zheng, X. “Design of close-loop supply chain network under
uncertainty using hybrid genetic algorithm: a fuzzy and chance-constrained
programming model”, Computers and Industrial Engineering, 88, pp. 444-457
(2015).
35. Hajikhani, A., Khalilzadeh, M. and Sadjadi, .S. J. “A fuzzy multi-objective
multi-product supplier selection and order-allocation problem in supply chain
under coverage and price considerations: An urban agricultural case study”,
Scientia Iranica E, 25(1), pp. 431-439 (2018).
36. Rabieh, M., Rafsanjani, A. F., Babaei, L. et al.. M. “Sustainable Supplier
Selection and Order Allocation: An Integrated Delphi Method, Fuzzy TOPSIS
and Multi-Objective Programming Model”, Scientia Iranica E, Doi:
10.24200/SCI.2018.5254.1176 (Article in Press).
Salman Jameh Abrishami (S. J. Abrishami):
E-mail: [email protected], Tel.: +98 915 244 8682
Department of Industrial Engineering, Faculty of Engineering, University of Bojnord, Bojnord,
P. O. Box 94531-55111, Iran
Biography:
Salman Jameh Abrishami received his B.S. and M.S. degrees in Industrial Engineering from
“Sadjad University of technology” and “University of Bojnord”, Iran, 2012 and 2015,
respectively. Currently, he is a Ph.D. candidate of industrial engineering at Imam Hossein
Comprehensive University, Tehran, Iran in the direction of Mega Systems Analysis.
Dr. Hashem Vahdani (H. Vahdani): Corresponding author
.
E-mail: [email protected], Tel.: +98 912 276 8426; Fax:+98 58 324 10700;
Department of Industrial Engineering, Faculty of Engineering, University of Bojnord, Bojnord, P. O. Box
94531-55111, Iran
Biography:

17
Hashem Vahdani is an Assistant Professor at University of Bojnord, Bojnord, Iran. He holds
B.S., M.S., and Ph.D. in Industrial Engineering from Sharif University of Technology, University
of Tehran, and Sharif University of Technology in Iran, respectively. His research interests cover
applied operations research, production management, supply chain management with special
focus on sustainable development and green chains and warranty analysis.
Dr. Babak Rezaee (B. Rezaee):
[email protected], Tel.: +98 912 643 8902
Industrial Engineering Department, Faculty of Engineering, Ferdowsi University of Mashhad,
P.O. Box 91775-1111, Mashhad, Iran
Biography:
Babak Rezaee is an Assistant Professor in the Industrial Engineering department at Ferdowsi
University of Mashhad (FUM). His research interests lie in utilizing Artificial Intelligence and
Operations Research to tackle decision-making problems area. Some of the applications he has
worked on are Supply Chain Risk Management, Energy Policy and Modeling, Modeling
Uncertainty in Operations and Services and Designing Fuzzy Rule-Based Systems.
18
List of Captions:
a- Figure captions:
- Fig. 1. Supply chain network.
- Fig. 2. Effects of quantity discounts on the costs
- Fig. 3. An example of crossover operation
- Fig. 4. An example of mutation operation
- Fig. 5. The objective function values for small-scale samples
- Fig. 6. Run time comparison between GA and the exact method
- Fig. 7. The objective function values for large-scale samples
b- Table Captions:
- Table 1. Literature review summary on inventory lot-sizing with supplier selection
- Table 2. Data of the raw materials and suppliers’ capacities
- Table 3. Manufacturer’s data
- Table 4. Suppliers’ dataset for the numerical example
- Table 5. Transportation data
- Table 6. Results for base example
- Table 7. The impact of quantity discount
- Table 8. The impact of inventory holding costs
- Table 9. Best value and time for different parameters
- Table 10. Samples’ dimensions
- Table 11. The values of the parameters used in the samples
- Table 12. The computational results of small-scale samples
- Table 13. The computational results of the large-scale samples

19
Figures:
Fig.1. Supply chain network
Fig. 2. Effects of quantity discounts on the costs
25,055 26,575 27,353 27,465
17,050 17,735 18,755 20,750
460 650 470 600
3,825 4,550 4,630 3,450
0
5,000
10,000
15,000
20,000
25,000
30,000
B A S E E X A M P L E S U B - S C E N A R I O 1 S U B - S C E N A R I O 2 S U B - S C E N A R I O 3
CO
STS
Objective value
Purchasing cost
Ordering cost
Transportationcost
20
Fig. 3. An example of crossover operation
Fig. 4. An example of mutation operation
Fig. 5. The objective function values for small-scale samples
0
5000
10000
15000
20000
25000
30000
1 2 3 4 5 6 7 8 9 10
CO
ST
SAMPLE
LINGO GA
21
Fig. 6. Run time comparison between GA and the exact method
Fig. 7. The objective function values for large-scale samples
1 1 2 3 5 5 7
20
134
123
11 13
34 34
27
47 53
62
87
119
1 2 3 4 5 6 7 8 9 10 Sample
Time (Lingo) Time (GA)
75000
125000
175000
225000
11 12 13 14 15 16 17 18 19 20
CO
ST
SAMPLE
LINGO GA

22
Tables:
Table 1. Literature review summary on inventory lot-sizing with supplier selection
Study Formulation Objective Constraints Quantity
discounts
Transportation
cost
Carrier
selection
Multi-
product Remarks
Mendoza
& Ventura
[21]
MINLP
Two model for minimizing
annual ordering, inventory
holding and purchasing
costs
Suppliers’ capacity and
quality constraints
Determine appropriate
level of inventory, number
of orders allocated, size
&frequency of orders
Rezaei &
Davoodi
[20]
MOMINLP
Three objectives of total
profit, inconsistency and
deficiency
Suppliers’ capacity,
budget and storage
capacity constraints
Applying GA (NSGA-II)
to solve model &produce
Pareto-optimal solutions
Senyigit
[22] MILP
Minimizing total cost of
purchasing–production&
distribution strategy
Suppliers’ capacity,
production and storage
capacity constraints
Considering defect rates,
a case study problem
Aliabadi et
al. [23] MINLP
Maximum annual income
(total cost is sum of
suppliers’ and retailer’s
cost)
Suppliers’ capacity and
storage capacity
constraints.
Inventory shortage and
surplus unacceptable
A new two-level GA
Ventura et
al. [24] MINLP
Minimizes total variable
cost including purchasing,
production, inventory and
transportation
Suppliers’ capacity,
production and
distribution capacity, and
inventory capacity
constraints
All-unit discount for
transportation costs
structure
Gorji et al.
[26] MINLP
Maximize total profit
(purchasing, ordering,
inspection, holding,
penalty and transportation)
Suppliers’ capacity and
total capital constraints,
Inventory balance
equations
GA is presented to solve
model
Kang &
Lee [25] MOILP
Minimize total ordering,
holding, purchase and
shortage costs. Maximize
system service level
Inventory balance
equations and shortage
constraints
An efficient heuristic
dynamic programming
(HDP) is
constructed for solving
large-scale stochastic lot-
sizing problems
Meena &
Sarmah [8] MINLP
Minimizing purchasing,
supplier management and
total loss cost
Suppliers’ capacity
constraint
A GA to solve model
considering risk of supply
disruption
lee et al.
[14] MIP
Minimize total ordering,
holding, purchasing,
&transportation cost
Inventory balance
equations
An efficient GA is
proposed to solve model
Choudhary
& Shankar
[11]
MIP
Minimize buyer’s total
cost including purchasing,
transaction, &inventory
cost
Inventory balance
equations ordering cost,
storage and suppliers’
capacity constraint,
Service level requirement
Choudhary
& Shankar
[12]
MOILP
Minimizing net rejected
items, net costs and net
late delivered items
Inventory balance
equations ordering cost,
storage and suppliers’
capacity constraints,
service level requirement
Three variants of goal
programming used to solve
problem
Zaheri et
al. [28]
Mixed binary
NLBLP
First model: Total annual
cost of purchasing, order,
and holding for the leader,
Second model represents
the total annual cost of
production, setup, and
holding for the suppliers.
Production capacity,
Supplier capacity
Using PSO algorithm to
solve their model.
Ghaniabad
i and
Mazinani
[29]
MILP Two models minimizing
the total cost
of ordering costs, the unit
purchase costs, holding
costs and backlogging
costs
Inventory balance
equations,
Using a
commercial optimization
software to solve the
model.
Alfaresa
and
Turnadi
[30]
MIP Minimizes the total cost,
the sum of the
ordering costs, purchasing
cost, transportation cost,
inventory holding cost, and
shortage cost
Inventory balance
constraint,
Transportation capacity
constraints, Budget
limits, Capacity
constraints on storage
volume
Using two heuristic
solution methods: the
Silver-Meal heuristic and
GA
Cardenas-
Barron et
al. [27]
MILP Minimizes
the total purchase cost of
the products, the total
ordering cost, and the total
holding cost for carrying
inventory,
Avoid shortages Heuristic algorithm based
on reduce and optimize
approach (ROA) using
CPLEX to solve the model
Suriyan
and
Rungreung
MILP Minimize total inventory
costs, which consist of
product costs, ordering
Inventory constraints,
Limitation of product
order, Budget limits
Using LINGO to solve
23
anun [31] costs, inventory holding
costs, and transportation
costs
Kanchanar
uangrong
and
Woarawic
hai
[32]
MILP Minimize total costs,
where the costs include
purchase cost of the
products, ordering cost,
transportation cost and
holding cost
Inventory balance
equations, buyer storage
capacity
Using LINGO to solve
This paper MILP
Minimize buyer’s total
cost including purchasing,
ordering, transportation,
inventory and production
costs
Inventory balance
equations,
suppliers’ capacity
constraint, storage
capacity of raw materials
and production constraint
Production costs and
purchase of various raw
materials to produce
products in multi- periods.
GA is used to solve the
model.
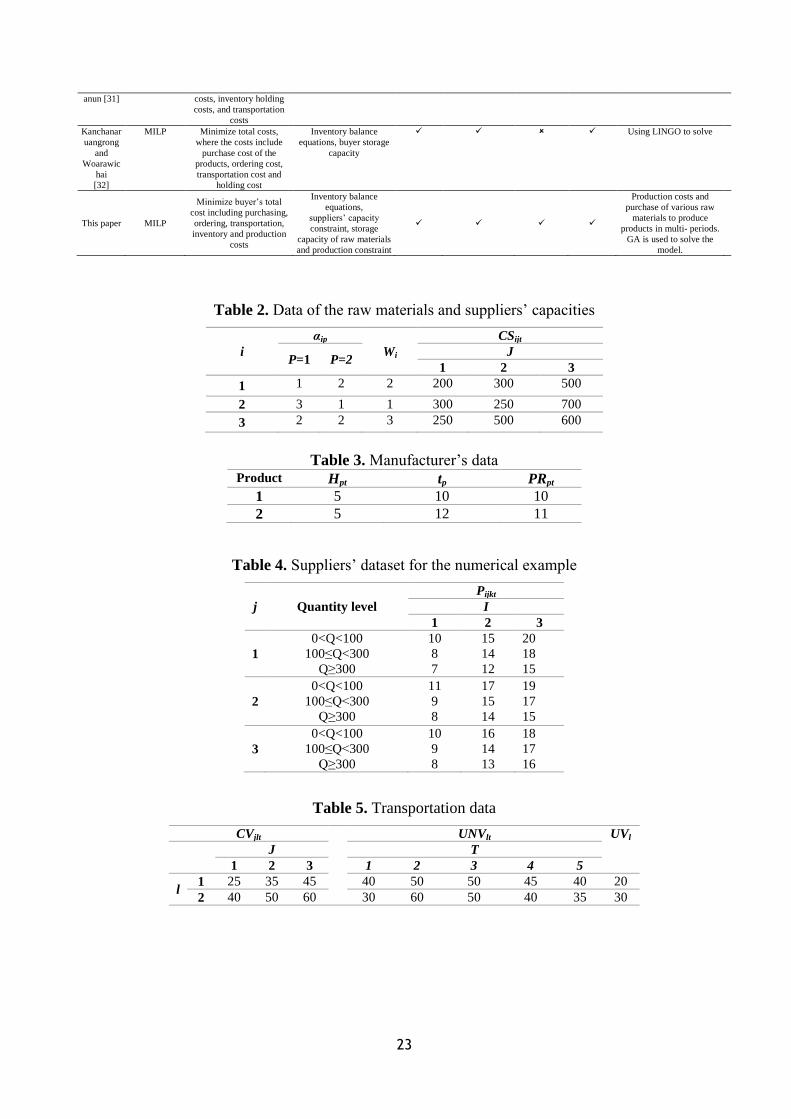
Table 2. Data of the raw materials and suppliers’ capacities
i
αip
Wi
CSijt
P=1 P=2 J
1 2 3
1 1 2 2 200 300 500
2 3 1 1 300 250 700
3 2 2 3 250 500 600
Table 3. Manufacturer’s data Product Hpt tp PRpt
1 5 10 10
2 5 12 11
Table 4. Suppliers’ dataset for the numerical example
j Quantity level
Pijkt
I
1 2 3
1
0<Q<100
100≤Q<300
Q≥300
10
8
7
15
14
12
20
18
15
2
0<Q<100
100≤Q<300
Q≥300
11
9
8
17
15
14
19
17
15
3
0<Q<100
100≤Q<300
Q≥300
10
9
8
16
14
13
18
17
16
Table 5. Transportation data
CVjlt UNVlt UVl
J T
1 2 3 1 2 3 4 5
l 1 25 35 45 40 50 50 45 40 20
2 40 50 60 30 60 50 40 35 30

24
Table 6. Results for base example
Objectives Value
Purchasing cost (Z1)
Ordering cost (Z2)
Production cost (Z3)
Inventory holding cost (Z4)
Transportation cost (Z5)
17,050
460
2,650
1,070
3,825
Total Objective 25,055
The amount of raw
materials purchased
Inventory quantities for
raw materials and
products
Quantity of
manufactured
products
The number of
used carriers
X11211=100
X11221=200
X11241=100
X21141=50
X21211=100
X21321=300
X31211=100
X31241=100
X32322=300
I11=20
I21=10
I'12=60
I'13=40
I'14=20
I'22=40
I'23=10
I'24=30
Y11=20
Y12=80
Y21=30
Y22=70
Y24=50
NV111=30
NV112=35
NV114=28
NV222=30
Table 7. The impact of quantity discount
Sub-scenarios
1 2 3
X11111= 85
X21111= 90
X12222= 195
X12242= 120
X32212= 100
X32242= 100
X32322= 300
X23322= 300
X11111=85
X11141=62
X11151=58
X21111=90
X21141=30
X21151=30
X31141=42
X31151=58
X31211=100
X13222= 195
X23322=300
X33322=300
X11111=81
X11121=80
X11131=79
X11141=82
X11151=78
X21111=90
X21121=93
X21131=87
X21141=90
X21151=90
X31131=98
X31151=98
X31211= 100
X31221= 102
X31241= 102
Total cost 26575 27353 27465
Supplier 1
Supplier 2
Supplier 3
~ 18 %
~ 60 %
~ 22 %
~ 41 %
~ 0 %
~ 59 %
100 %
0 %
0 %

25
Table 8. The impact of inventory holding costs
Inventory holding cost for products
(H1t, H2t)
Inventory holding cost for raw materials
(h1t, h2t, h3t)
Scenario 1
(0.5, 0.5) Scenario 2
(10, 10) Scenario 3
(1, 1, 1) Scenario 4
(5, 5, 5) Scenario 5
(13, 13, 13)
X11211= 200
X11233= 200
X21232= 150
X21311= 300
X31232=200
X32312= 300
X11121= 60
X11151=40
X11211=100
X11231=100
X11241=100
X21131=70
X21151= 80
X21211=100
X21221=100,
X21241= 100
X31211= 100,
X31221= 100
X31231= 100,
X31241= 100
X31251= 100
X11211= 200
X11231= 100
X11241= 100
X21131= 50
X21241= 100
X21311= 300
X31231= 100
X31241= 100
X32312= 300
X11211=100
X11221=200
X11241=100
X21141=50
X21211=100
X21321=300
X31211=100
X31241=100
X32322=300
X11111= 80
X11221= 200
X11241= 100
X12122= 20
X21111= 90
X21141= 50
X21321= 300
X22122= 10
X31211= 100
X31241= 100
X32322= 300
I31=20I32=20
I'11=60
I'12=40
I'13=40
I'14=20
I'21=30
I'23=60
I'24=30
I11=20
I13=20
I14=40
I21=10
I22=20
I24=10
I11=20
I12=80
I21=210
I22=120
I23=30
I33=200
I'14=20
I'24=30
I11=20
I21=10
I'12=60
I'13=40
I'14=20
I'22=40
I'23=10
I'24=30
I'12=60
I'13=40
I'14=20
I'22=40
I'23=10
I'24=30
Total Z
Z1
Z2
Z3
Z4
Z5
24,155
17,000
340
2,650
240
3,935
25,830
18,850
600
2,650
280
3,450
24,845
17,000
460
2,650
910
3,825
25,135
17,050
460
2,650
1150
3,825
25,375
17,390
460
2,650
1,000
3,875

26
Table 9. Best value and time for different parameters
Population
size
Maximum
generation
Crossover
rate
Mutation
rate
Elitism
rate
Local
search’s rate
Best Objective
function
Time
(sec.)
250 200 0.93 0.18 0.25 0.2 31167 130
250 200 0.93 0.18 0.1 0.2 31079 135
250 200 0.93 0.1 0.25 0.2 31027 118
250 200 0.85 0.18 0.25 0.2 31007 104
250 200 0.93 0.1 0.1 0.2 30996 81
250 200 0.85 0.18 0.1 0.2 31200 116
250 200 0.85 0.1 0.25 0.2 31072 75
250 200 0.85 0.1 0.1 0.2 31066 85
250 200 0.93 0.18 0.25 0.1 31270 66
250 200 0.93 0.18 0.1 0.1 31210 144
250 200 0.93 0.1 0.25 0.1 31020 112
250 200 0.85 0.18 0.25 0.1 31200 72
250 200 0.93 0.1 0.1 0.1 31039 92
250 200 0.85 0.18 0.1 0.1 31131 95
250 200 0.85 0.1 0.25 0.1 31138 99
250 200 0.85 0.1 0.1 0.1 31162 122
350 150 0.93 0.18 0.25 0.2 30957 119
350 150 0.93 0.18 0.1 0.2 30962 152
350 150 0.93 0.1 0.25 0.2 30930 103
350 150 0.85 0.18 0.25 0.2 31098 113
350 150 0.93 0.1 0.1 0.2 31040 202
350 150 0.85 0.18 0.1 0.2 31070 130
350 150 0.85 0.1 0.25 0.2 31132 104
350 150 0.85 0.1 0.1 0.2 31158 149
350 150 0.93 0.18 0.25 0.1 31017 108
350 150 0.93 0.18 0.1 0.1 31054 118
350 150 0.93 0.1 0.25 0.1 30969 107
350 150 0.85 0.18 0.25 0.1 30988 73
350 150 0.93 0.1 0.1 0.1 31008 134
350 150 0.85 0.18 0.1 0.1 31146 93
350 150 0.85 0.1 0.25 0.1 31186 99
350 150 0.85 0.1 0.1 0.1 31037 105
Table 10. Samples’ dimensions Sample
Raw
material
(i)
Supplier
(j)
Break
levels
(k)
Product
(p)
Period
(t)
Carrier
(l)
Considerations
Small-
scale
1 1 2 3 1 2 2 j1, j2
2 1 2 3 1 3 2 j1, j2
3 2 2 3 2 3 2 j1, j2
4 3 2 3 1 3 2 j2, j3
5 3 3 3 1 3 2 ---
6 3 3 3 2 3 2 ---
7 2 2 3 2 5 2 j1, j2
8 3 3 3 2 4 2 ---
9 3 3 3 2 5 2 ---
10 3 3 3 2 6 2 ---
Large-
scale
11 3 3 3 2 10 2 ---
12 3 5 3 2 9 2 ---
13 4 3 3 3 10 2 ---
14 3 5 3 3 10 3 ---
15 4 10 3 3 13 3 ---
16 3 12 3 3 15 3 ---
17 3 10 3 3 15 3 ---
18 3 15 3 3 10 3 ---
19 3 15 3 3 15 3 ---
20 3 15 3 3 20 3 ---

27
Table 11. The values of the parameters used in the samples Notes Values Dpt ~ uni [20, 50] Ojt ~ uni [80, 150] Pijkt ~ uni [10, 30] hit ~ uni [2, 5] Hpt ~ uni [4, 9] PRpt ~ uni [10, 20] CVjlt ~ uni [50 , 90] Bijkt 100, 300, 1000 CRt ~ uni [800, 1500] CPt ~ uni [100, 200] CSijt ~ uni [300, 900] tp ~ uni [2, 5] Tt ~ uni [400, 800] αip ~ uni [1, 5] Wi ~ uni [1, 7] UVl ~ uni [50, 100] UNVlt ~ uni [30, 60]
Table 12. The computational results of small-scale samples
Sample
LINGO Genetic Algorithm (GA)
Gap
(%) Run
time(sec.)
Optimal
solution
Run time
(average of 5 runs)
Solution value
(average of 5 runs)
Best solution
value
1 1 1,600 11 1,600 1,600 0.00
2 1 2,220 13 2,230 2,230 0.45
3 2 8,780 34 8,828.4 8,806 0.29
4 3 7,470 34 7,623 7,616 1.95
5 5 7,125 27 7,239 7,235 1.54
6 5 15,240 47 15,393 15,347 0.70
7 7 14,515 53 14,862.4 14,763 1.70
8 20 19,925 62 20,663.3 20,613 3.45
9 134 24,731 87 25,684 25,561 3.35
10 85 30,230 119 30,997 30,930 2.3
Table 13. The computational results of the large-scale samples
Sample LINGO Genetic Algorithm (GA)
Gap
% Run time
(sec.)
Best
solution
Run time
(average of 5 runs)
Solution value
(average of 5 runs)
Best solution
value
11 2,000 119,123 284 122,886 122440 2.78
12 2,000 78,885.4 224 82,118.4 81384 3.16
13 2,000 168,052 283 170,238 169740 1.00
14 2,000 138,988 231 143,006 141980 2.15
15 2,000 167,819 541 174,824 173940 3.64
16 2,000 171,049 448 179,408 177200 3.59
17 2,000 207,025 427 220,880 218030 5.31
18 2,000 104,101 277 112,112 109710 5.38
19 4,000 208,993 437 225,602 223220 6.80
20 4,000 250,818 390 262,856 260390 3.81