an integration of balanced scorecards and data envelopment ... · an integration of balanced...
TRANSCRIPT
An integration of balanced scorecards and data envelopmentanalysis for firm’s benchmarking management
Chwan-Yi Chianga and Binshan Linb�
aDepartment of International Trade, Kun Shan University, 949 Dawan Road, Yongkang City,Tainan County 71003, Taiwan; bCollege of Business Administration, BE321, Louisiana StateUniversity in Shreveport, Shreveport, LA 71115, USA
Management performance measurement is a complex task since multiple inputs andmultiple outputs are involved in the process. This study attempted to develop anintegrated framework to encompass the basic concepts of balance scorecards (BSC)and data envelope analysis (DEA) for measuring management performance. BSCand DEA are complementary to each other. On the one hand, BSC can provideappropriate outputs of performance for DEA. On the other hand, DEA can setbenchmarking for companies based on their inputs and outputs, as well as transformperformance measures into managerial information. Accordingly, the synergy ofBSC and DEA can translate the appropriate performance indices into managerialimplications. This study selected auto and commercial bank industries as the targetsfor empirical investigation. The results indicated that the interrelationships amongfour perspectives of BSC were empirically valid. However, the most crucialindicators in each perspective were distinct in different industries. About 46% ofauto companies and 57% of commercial banks are located at efficiency frontiers.Managerial implications and research limitations are addressed as well.
Keywords: balanced scorecard; data envelopment approach; benchmarkingmanagement; quality management; performance management
Introduction
The increasing use of organisational measurement systems is changing the way managers
run their companies (Bojnec & Latruffe, 2008; Prajogo, 2007; Soltani et al., 2007). The
balanced scorecards (BSCs) are a formal management system that provides a realistic fra-
mework linking performance measurements to strategic objectives (Hasan & Tibbits,
2000). The BSC integrates the interests of the key stakeholders including owners, custo-
mers and employees (Bach et al., 2001; Kaplan & Norton, 1996). The term ‘balance’
reflects the attempt to capture both financial and non-financial measurements with empha-
sis on lagging and leading indicators, long-term strategic objectives and short-term
actions, external and internal performance perspectives, as well as quantitative-objective
and qualitative-subjective measures (Ahn, 2001; Bach et al., 2001; Denton & White, 2000;
Gautreau & Kleiner, 2001; Green et al., 2007; Kaplan & Norton, 1996; Papalexandris
et al., 2005; Phusavat, 2007; Phusavat & Kanchana, 2008).
Although BSC has received wide acceptance from academics and practitioners (Butler
et al., 1997), there are several major limitations of the BSC approach discussed in the lit-
erature (Othman et al., 2006). First, it is a top-down approach only (Kanji & Moura, 2001;
ISSN 1478-3363 print/ISSN 1478-3371 online
# 2009 Taylor & Francis
DOI: 10.1080/14783360903248286
http://www.informaworld.com
�Corresponding author. Email: [email protected]
Total Quality Management
Vol. 20, No. 11, November 2009, 1153–1172

Malina & Selto, 2001). Therefore, the interactions between top management team and
working level employees are limited. Lohman et al. (2004) found that the BSC did not
provide an opportunity to develop, communicate and implement strategy in a corporate
setting. Although BSC has been adopted widely by different industries, there is no
formal implementation methodology. This lack of formal implemented methodology
and subjective measures often leads to focusing on short-term financial measures.
Finally, according to Fletcher and Smith (2004), the BSC lacks a single focus for account-
ability. What the BSC does not do but what managers need is one comprehensive index to
summarise the interaction between these leading and lagging measures of performance.
While the BSC may tell us what measures to look at, it does not tell us how to look at
them or their relative importance.
Although BSC has some limitations, it serves as a basis for resource deployment and
improving internal process (Pock et al., 2004). A BSC enhances the quality of a firm’s con-
trolling system in various ways. The purpose of this study is to integrate data envelope
analysis (DEA) with output factors based on the BSC approach and expand the concept
of benchmarking to solve those problems. DEA is a tool to calculate efficiencies with
non-parametric approach based on a set of inputs and outputs (Narasimhan & Graham,
2005; Serrano-Cinca et al., 2005; Wang, 2006). BSC and DEA are different concepts
but complementary to each other. On the one hand, DEA is capable of improving the limit-
ations of BSC and providing more useful information for managers. The performance
measurement system is wasted unless the data can offer managerial implications and
inform management’s actions (Franco & Bourne, 2003; Lin et al., 2008; Wu et al.,
2008). While BSC can measure an organisation’s performance from brief but comprehen-
sive perspectives (Braam & Nijssen, 2004), DEA can evaluate overall management
performance based on inputs and outputs, and set appropriate benchmarks for each
company (Rickards, 2003). Benchmarking is a management technique used broadly by
an organisation or a department to improve performance. Many companies have
engaged in benchmarking practice and made great progress.
In addition to benchmarking, DEA can provide information related to either the most
efficient or the most inefficient companies (Mostafa, 2007). Furthermore, it can analyse
multiple inputs and outputs simultaneously, as well as show by what percentage the
inputs should decrease in order to achieve a given output level and by what percentage
the outputs should increase given original levels of inputs in order to reach efficiency
(Rickards, 2003). Hence, DEA can transform performance measures into managerial
information. On the other hand, BSC can provide appropriate outputs for DEA.
Serrano-Cinca et al. (2005) argued that different combinations of inputs and outputs
would produce different efficiency. Hence, the results of DEA depend on the selection
of inputs and outputs. Serrano-Cinca et al. (2005) also stated that the DEA model could
not involve redundant information. BSC is able to resolve these two concerns in that it
not only minimises information overload by limiting the number of measures used
(Kaplan & Norton, 1992) but also develops the scorecard by linking to key success
factors (Frigo & Krumwiede, 2000). Accordingly, BSC and DEA complement each other.
In short, management performance measurement is a complex task since multiple
inputs and multiple outputs are involved in the process. The balanced scorecard is one
approach to measuring management performance. When the efficiencies of multiple per-
formance organisations are to be compared quantitatively, however, DEA will be appro-
priate because DEA enables management to integrate dissimilar multiple inputs and
outputs to make simultaneous comparisons (Avkiran, 2002). DEA rests on the economic
notion of the production technology transforming inputs to outputs. It is a non-parametric
1154 C.-Y. Chiang and B. Lin

approach for estimating maximum output level for given inputs or minimum input levels
for given output levels (Thanassoulis, 1996). Its advantage is the ability to deal with aggre-
gate information rather than detailed information (Chang & Lo, 2005). Therefore, DEA is
viewed as a methodology that provides a valid starting point for specifying balanced per-
formance. The main purpose of this study is to fill the research gap and develop a compre-
hensive framework to encompass the basic concepts of BSC and DEA to measure
management performance. On the one hand, BSC is a widely acceptable performance
measurement system. As Kaplan and Norton (1992) stated, ‘what you measure is what
you get’ (p. 71), BSC can provide appropriate outputs of performance for DEA. BSC is
able not only to minimise information overload by limiting the number of measures
used (Kaplan & Norton, 1992) but also to develop the scorecard by linking to key
success factors (Frigo & Krumwiede, 2000). On the other hand, DEA can set benchmark-
ing for companies based on their inputs and outputs, as well as transform performance
measures into managerial information. Thus, BSC and DEA are complementary to each
other. As BSC is commonly used in traditional industries and creates too many
numbers to deal with easily, this study seeks to combine BSC with DEA to evaluate man-
agement performance in the manufacturing sector (i.e. the auto industry) and the service
sector (i.e. the national commercial bank industry). The results of this study could also
assist governmental administrators and business managers to make decisions on invest-
ment and management.
Literature review
Balanced scorecard (BSC) approach
The BSC approach offered by Kaplan and Norton (1992) addresses the issues of divergent
stakeholder goals and gauging managers’ effectiveness. Kaplan and Norton (1992) pro-
posed four balanced perspectives to measure performance comprehensively including
financial, customer, internal business processes, and learning and growth perspective.
These perspectives reflect the interests of the key stakeholders of companies involving
shareholders, customers and employees (Gautreau & Kleiner, 2001; Mooraj et al., 1999).
The performance measurements from the financial perspective indicate ‘whether the
company’s strategy, implementation, and execution are contribution to bottom-line
improvement’ (Kaplan & Norton, 1992, 77). The performance measurements from the
customer perspective indicate the company’s sources of demand (Denton & White,
2000). This perspective can force the company to view its performance through customers’
eyes (Kaplan & Norton, 1992). The emphasis on customers should take care of
satisfaction, loyalty, retention and acquisition of customers (Kaplan & Norton, 1996).
Moreover, Mooraj et al. (1999) argued that the internal business process perspective of
BSC focused on the internal processes required for excelling in efficiently providing the
value expected by customers. To satisfy customer needs and to achieve better competitive
advantage, many firms have concentrated their efforts on the improvement of internal
business processes. In terms of the learning and growth perspective, Kaplan and Norton
(1992) stated that the firm’s ability to innovate, improve and learn could tie in to the
firm’s value.
Interrelationships among four perspectives of the BSC
Kaplan and Norton (1996) proposed the cause-and-effect relationships among the four per-
spectives of BSC by measuring the strength of the linkages among measures in different
Total Quality Management 1155
perspectives. Additionally, the cause-and-effect relationships among measurement in
different perspectives of BSC are essential in that the performance measurement system
can act as a feed-forward control system because of the non-financial indicators (Nørreklit,
2003). Accordingly, the interrelationships among different perspectives of BSC favour
selection of appropriate measurements for the company and enhancement of advantage
of the performance measurement system (Mooraj et al., 1999).
Fletcher and Smith (2004) suggested that the learning and growth perspective was the
leading indicator of internal business process, which was in turn the leading indicator of
customer satisfaction. A degree of improvement of internal business process and level
of customer satisfaction will in turn affect the financial perspective. The BSC takes a
balanced look at the firm because it focuses on leading and lagging indicators of perform-
ance measurement, financial management, and quantitative and qualitative measures of
performance.
Based on the above literature review, it seems that the interrelationship among four
perspectives of the BSC have attracted management attention. However, researchers
seem not to reach a consistent agreement on the interrelationship between the four
perspectives of the BSC. Rusjan (2005) pointed out that the relationships between the
difference performance areas were not clear. This study would like to go further by inte-
grating the opinions of previous studies to evaluate more specifically the interrelationship
between the four perspectives of the BSC and between the individual indicators of each
BSC perspective, especially in the auto and national commercial bank industries.
Research hypotheses
Based on the previous studies described above of Denton and White (2000), Fletcher and
Smith (2004) and Kaplan and Norton (1996), hypotheses on the interrelationships between
the four perspectives of the BSC are developed as follows:
Hypothesis 1: The factors of the learning and growth perspective of the balanced scorecardwill significantly impact on the factors of the internal business process perspective of thebalanced scorecard.
Hypothesis 2: The factors of the internal business process perspective of the balancedscorecard will significantly impact on the factors of the customer perspective of the balancedscoreboard.
Hypothesis 3: The factors of the customer perspective of the balanced scorecard will signifi-cantly impact on the factors of the financial perspective of the balanced scorecard.
The objects of DEA are decision-making units (DMUs). In practice, there are branch
stores, business offices, company divisions, diverse sites manufacturing a particular
product, product groups, subsidiary corporations, work teams, and so forth. One can inves-
tigate various kinds of efficiency on the basis of a DEA.
Based on the previous studies on DEA of Banker et al. (1984), Banker and Thrall
(1992), Charnes et al. (1978), and Sueyoshi (1997), hypotheses of efficiency frontier are
developed as follows:
Hypothesis 4: The most efficient DMUs are ones that allocate on the efficiency frontier. TheDMUs that allocate below the regression line are less efficient and in reverse, the DMUs thatallocate above the regression line are more efficient.
Hypothesis 5: The differences between the two industries (i.e. auto and national commercialbank) tend to perform differently on all research variables, including input variables andoutput variables such as financial, customer, internal business process, learning and growthperspectives of the balanced scorecard.
1156 C.-Y. Chiang and B. Lin

Methodology
Research model
The purpose of this study is to evaluate the performance in two distinct industries (i.e. auto
and national commercial bank) by means of BSC and DEA. According to the purpose and
hypotheses of this study, a research framework is developed as shown in Figure 1.
Managers must adopt the BSC to evaluate their management performances from four per-
spectives including the financial perspective, customer perspective, internal business
process perspective, as well as learning and growth perspective. In addition, in order to
evaluate the competitive position of the firm, managers need to apply DEA to identify
the efficiency frontier, benchmarking partners and inefficient slacks for the firms. DEA
is a non-parametric approach for estimating maximum output level for given inputs or
minimum input levels for given output levels (Thanassoulis, 1996), which has been
applied to evaluate benchmarking and identify best practice frontiers (Chang & Lo,
2005). DEA can indicate and compare relatively inefficient and efficient units and
suggest how to reduce the inefficiencies (Wang, 2006). Therefore, by using DEA, the
results of this study intend to provide competitive information and benchmarking
partner, which are essential for firms to design long-term strategies and objectives.
Construct measurement
DEA methodology is a non-parametric approach to performance measurement on the basis
of a set of inputs and outputs. For the input measurement, this study adopted four factors as
input variables comprising employees, costs, materials and assets. However, there was no
‘materials’ item for the national commercial bank industry. Thus, ‘materials’ was replaced
with operating expenses as to national commercial banks. For the output measurement,
four major sections are operationalised including financial perspective, customer perspec-
tive, internal business process perspective, and learning and growth perspective.
Figure 1. The research conceptual framework.
Total Quality Management 1157

Several scholars have suggested various sets of indicators with respect to the perspec-
tives of BSC. Based on the past literature, this study selected measurements for the sake
of parsimony and accessibility of indicators. In terms of the financial perspective, there
were four indicators involving total revenue, operating income, cash flow and accounts
receivable. In terms of the customer perspective, there were two indicators involving relative
market share and market share growth. The relative market share was the percentage of sales
for the company relative to total sales for the industry, whereas the market share growth was
calculated on the basis of relative market share of current year and previous year. In terms of
the internal business process perspective, there were three indicators including total assets
turnover, inventory turnover, and property plant and equipment turnover. Turnover rate is
the objective indicator to measure the efficiency with respect to internal process. The high
turnover rate represents high efficiency. However, the inventory turnover was deleted for
the national commercial banks, because there was no inventory for banks.
In terms of the learning and growth perspective, there were three indicators: the
research and development expenses per employee, administrative expenses per employee
and intangible assets. However, most national commercial banks did not disclose the
research and development expenses and intangible assets. In this regard, the research
and development expenses per employee indicator was replaced with average salary per
employee, and intangible assets were deleted as to the national commercial bank industry.
This study further used principal component factor analysis, item to total correlation
analysis, and Cronbach’s alpha to evaluate the dimensionality and reliability of outputs,
that is, four perspectives of BSC. Factor analysis examined the basic structure of the data,
and item to total correlation analysis assessed the degree of multicollinearity among variables.
Cronbach’s alpha measured the internal consistency of each identified dimension. The results
of these analyses are shown in Table 1. Following the suggestions of Hair et al. (2006), with
the criteria of factor loadings greater than 0.6, item to total correlation coefficients greater than
0.5, and Cronbach’s alpha greater than 0.6, it is shown that the dimensionality and reliability
of all research constructs are quite reliable and acceptable. Therefore, each dimension of BSC
could be calculated by the average of its indicators.
Sampling plan and data collection
This study chose two distinct industries for the purpose of comparison, comprising of the
auto and national commercial bank industries. The Mergent database is the primary source
of samples and data. Specifically, we picked the sample companies as well as their finan-
cial statements and annual reports from the Mergent database. One of the conditions
imposed by DEA is the requirement of homogeneity of the data (Serrano-Cinca et al.,
2005). In order to ensure the homogeneity of samples with respect to these two types of
industries, this study employed SIC as the criteria to select companies in each industry
(i.e. SIC is 3711 for auto industry; SIC is 6021 for national commercial banks).
For the purpose of parsimony, this study only picked the top 50 companies for each
industry category according to the total revenue in the latest annual reports. However, we
deleted several sample companies which were merged or acquired, or did not provide the
recent financial reports in the Mergent database. The final valid sample contains 39 com-
panies for the auto industry and 30 companies for the national commercial bank industry.
According to Golany and Roll (1989), the number of DMUs required for DEA should be
double or more the total research variables. Since this study contained eight factors (four
input variables and four output variables), 30 or 39 samples in each industry would be
appropriate. All of the research variables were offered in the companies’ financial
1158 C.-Y. Chiang and B. Lin

statements and annual reports. Since the scale of variables was based on national mon-
etary units, this study adjusted each variable of all samples to US$ scale (million). The
characteristics of variables and samples are shown in Table 2.
The national origins of the majority of our sample were Japan for the auto industry and
the United States for commercial banks. In terms of the input variables, the auto industry
had the most number of employees and highest direct costs, whereas the commercial banks
had the most total assets. Nevertheless, the commercial bank industry had the least total
assets turnover.
Results of analysis
Interrelationships between research variables
In order to achieve the purpose of this research and test the hypotheses, SPSS 10.5 and
DEA 2.1 software were employed to analyse the data. In order to examine the inter-
relationships between four perspectives of BSC, this study used canonical correlation
analysis to test Hypotheses 1, 2 and 3. The detailed information of canonical results is
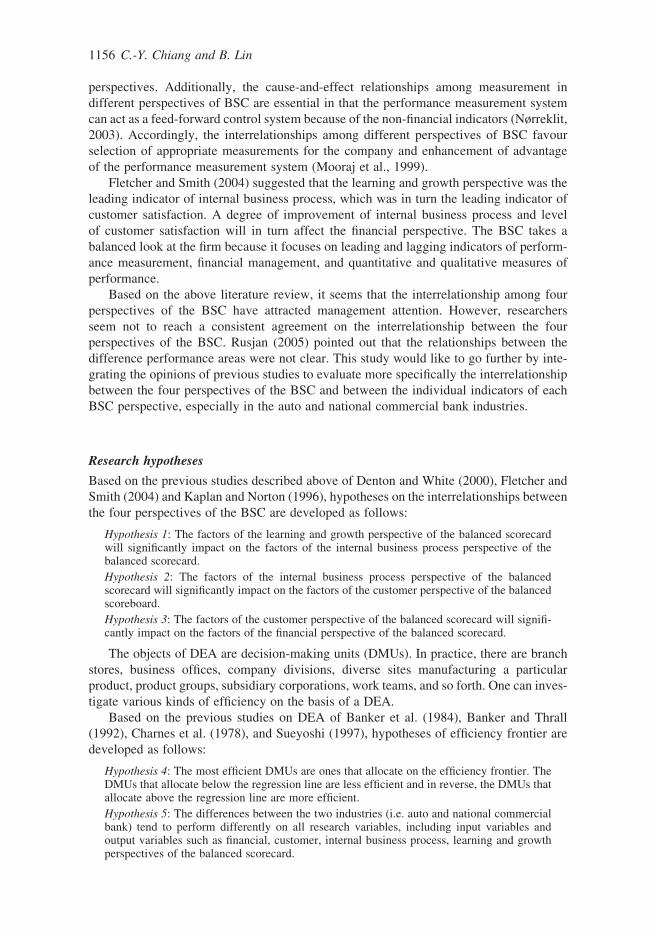
shown in Figures 2 to 4. For relationships between the learning and growth perspective
and the internal business process perspective of BSC, Figure 2 demonstrates that levels
of indicators of the learning and growth perspective tended to significantly influence
Table 1. The measurements of constructs of BSC.
Construct IndicatorFactorloading
Item-to-totalcorrelation
Cronbach’salpha
Auto industryFinancial perspective Total revenue 0.968 0.902 0.835
Operating income 0.724 0.590Cash flow 0.782 0.791Accounts receivable 0.796 0.647
Customer perspective Relative market share 0.808 0.505 0.877Growth of market share 0.808 0.505
Internal businessperspective
Total assets turnover 0.902 0.691 0.713Inventory turnover 0.830 0.598Property plant and equipment
turnover0.653 0.567
Learning and growthperspective
Intangible assets 0.696 0.501 0.618R&D expenses per employee 0.908 0.518Administrative expenses per
employee0.650 0.573
Commercial bank industryFinancial perspective Total revenue 0.944 0.891 0.771
Operating income 0.698 0.589Cash flow 0.923 0.794Accounts receivable 0.591 0.560
Customer perspective Relative market share 0.714 0.620 0.740Growth of market share 0.714 0.620
Internal businessperspective
Total assets turnover 0.810 0.611 0.774Property plant and equipment
turnover0.810 0.611
Learning and growthperspective
Administrative expenses peremployee
0.975 0.900 0.947
Salary and wages per employee 0.975 0.900
Total Quality Management 1159

total assets turnover, inventory turnover, and property plant and equipment turnover for
the auto industry (Can R2 ¼ 0.388; F ¼ 80.46; p , 0.05). Additionally, levels of indi-
cators of the learning and growth perspective tended to significantly influence total
assets turnover and property plant and equipment turnover for the commercial bank indus-
try (Can R2 ¼ 0.382; F ¼ 52.00; p , 0.05). Therefore, the results were consistent with
Hypothesis 1 that the factors of the learning and growth perspective of the BSC had sig-
nificant influence on the factors of the internal business process perspective of the BSC.
Table 2. The characteristics of samples.
Auto industry (n ¼ 39)Commercial bank industry
(n ¼ 30)
Nationality China: n ¼ 2 Brazil: n ¼ 1Europe: n ¼ 9 Canada: n ¼ 1Indian: n ¼ 3 China: n ¼ 5Indonesian: n ¼ 1 England: n ¼ 1Japan: n ¼ 16 Europe: n ¼ 4Korea: n ¼ 3 Hong Kong: n ¼ 1Swedish: n ¼ 1 Indian: n ¼ 1Taiwan: n ¼ 1 Japan: n ¼ 1United States: n ¼ 3 Taiwan: n ¼ 4
Thailand: n ¼ 2United States: n ¼ 7Venezuela: n ¼ 2
Number of employees 86490.51 73539.20(110261.39) (107320.94)
Direct costs 33632.43 9531.97(46659.54) (12921.01)
Raw material/operating income 2205.56 8076.73(5621.14) (12180.51)
Total assets 57898.17 319520.06(99358.47) (435755.23)
Total revenue 41649.78 20004.11(56341.48) (30155.05)
Operating income 1133.022 4300.41(2053.86) (7960.10)
Cash flow 5974.18 79055.79(10936.61) (150677.82)
Accounts receivable 9115.84 18646.96(18550.77) (27749.79)
Total assets turnover 1.31 0.06(0.78) (0.03)
Inventory turnover 18.78 –(23.67)
Property plant and equipment turnover 4.68 5.58(2.50) (4.55)
Intangible assets 1522.13 –(2480.35)
R&D expenses per employee 0.011 –(0.012)
Administrative expenses per employee 0.068 0.037(0.095) (0.039)
Salary and wages per employee – 0.064(0.059)
Note: Numbers in parentheses are means, numbers without parentheses are standard deviations.
1160 C.-Y. Chiang and B. Lin
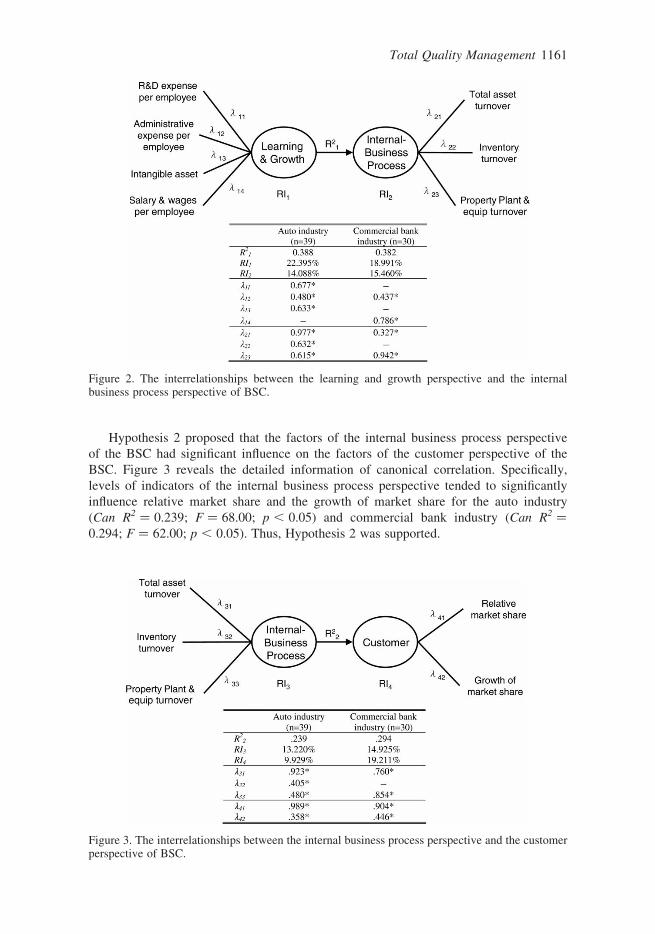
Hypothesis 2 proposed that the factors of the internal business process perspective
of the BSC had significant influence on the factors of the customer perspective of the
BSC. Figure 3 reveals the detailed information of canonical correlation. Specifically,
levels of indicators of the internal business process perspective tended to significantly
influence relative market share and the growth of market share for the auto industry
(Can R2 ¼ 0.239; F ¼ 68.00; p , 0.05) and commercial bank industry (Can R2 ¼
0.294; F ¼ 62.00; p , 0.05). Thus, Hypothesis 2 was supported.
Figure 2. The interrelationships between the learning and growth perspective and the internalbusiness process perspective of BSC.
Figure 3. The interrelationships between the internal business process perspective and the customerperspective of BSC.
Total Quality Management 1161

For relationships between the customer perspective and the financial perspective of
BSC, Figure 4 demonstrates that levels of indicators of customer perspective tended to
significantly influence total revenue, operating income, cash flow and accounts receivable
for the auto industry (Can R2 ¼ 0.997; F ¼ 66.00; p , 0.000) and the commercial bank
industry (Can R2 ¼ 0.990; F ¼ 48.00; p , 0.000). Therefore, the results were consistent
with Hypothesis 3 that the factors of the customer perspective of the BSC had significant
influence on the factors of the financial perspective of the BSC.
According to the variables with higher levels of canonical loading, R&D expenses per
employee and intangible assets are two of the most promising factors that would be posi-
tively related to total assets turnover which in turn are positively related to relative market
share for the auto industry. And the relative market share would be positively related to
total revenue. In terms of the commercial bank industry, the salary and wages per
employee are the most promising factors that would be positively related to property
plant and equipment turnover which in turn positively relates to relative market share.
And the relative market share would be positively related to total revenue. As a result,
the cause-and-effect relationships among BSC perspectives (Fletcher & Smith, 2004;
Kaplan & Norton, 1996) were supported for the auto and commercial bank industries.
Measuring the efficiency of each industry
This study used DEA with output orientation to calculate the relative efficiency for the
auto and commercial bank industries. Through the application of DEA, the results
would show the peer partners and the slacks of inputs for each company, as well as the
efficiency frontiers of companies in each industry. The detailed results with respect to
the auto industry are shown in Tables 3 and 4. The production efficiency (Constant
returns to scale, CRS) was calculated based on CCR model developed by Charnes,
Cooper, and Rhodes 1978. The production efficiency which equalled to one represented
that the DMU was efficient relative to other DMUs, whereas the production efficiency
which was smaller than one represented that the DMU was inefficient relative to other
DMUs. Table 3 reveals that the majority of DMUs in the auto industry had good
Figure 4. The interrelationships between the customer perspective and the financial perspective ofBSC.
1162 C.-Y. Chiang and B. Lin

Table 3. The efficiency and the benchmark peers of each DMU for auto the industry.
DMU CRS VRS Scalea PeersPeercount DMU CRS VRS Scalea Peers
Peercount
1 0.867 0.944 0.918 drs 27 4 18 28 0 21 0.798 0.932 0.856 drs 9 4 15 27 0
2 1.000 1.000 1.000 – 2 0 22 0.731 0.816 0.895 drs 20 24 9 27 0
3 1.000 1.000 1.000 – 3 2 23 0.729 1.000 0.729 irs 23 0
4 1.000 1.000 1.000 – 4 6 24 0.821 1.000 0.821 drs 24 4
5 0.441 0.509 0.866 drs 27 3 4 32 0 25 1.000 1.000 1.000 – 25 3
6 1.000 1.000 1.000 – 6 0 26 1.000 1.000 1.000 – 26 0
7 0.828 1.000 0.828 irs 7 0 27 1.000 1.000 1.000 – 27 11
8 0.896 0.913 0.981 drs 32 18 35 34 9 20 0 28 1.000 1.000 1.000 – 28 6
9 1.000 1.000 1.000 – 9 8 29 1.000 1.000 1.000 – 29 2
10 0.841 0.871 0.965 drs 29 24 28 27 9 0 30 0.775 0.827 0.937 irs 39 3 28 18 4 27 0
11 0.769 0.983 0.783 drs 16 25 18 9 15 0 31 0.828 0.944 0.877 drs 20 24 28 27 0
12 0.799 0.800 0.999 – 28 9 4 39 20 27 0 32 1.000 1.000 1.000 – 32 2
13 0.715 0.958 0.747 drs 18 25 35 9 15 0 33 0.891 0.985 0.905 drs 18 27 28 25 0
14 0.911 0.991 0.919 drs 24 29 27 9 20 0 34 1.000 1.000 1.000 – 34 1
15 1.000 1.000 1.000 – 15 4 35 1.000 1.000 1.000 – 35 2
16 1.000 1.000 1.000 – 16 2 36 0.753 1.000 0.753 drs 36 0
17 1.000 1.000 1.000 – 17 0 37 1.000 1.000 1.000 – 37 0
18 1.000 1.000 1.000 – 18 6 38 0.926 1.000 0.926 drs 38 0
19 0.806 0.853 0.945 drs 20 4 16 27 15 0 39 1.000 1.000 1.000 – 39 2
20 1.000 1.000 1.000 – 20 6
Note: a Scale of efficiency. The scale equal to one represented that the DMU was in the condition of optimal return scale, otherwise, the scale unequal to one represented that the DMUwas inefficient in the condition of decreasing or increasing return scale (i.e., drs or irs). When the DMU was in the condition of decreasing return scale (drs), the DMU should decreaseits inputs accordingly in order to enhance performance or efficiency. On the other hand, when the DMU was in the condition of increasing return scale (irs), the DMU should increase itsinputs accordingly to expand its operating scope.
To
tal
Qu
ality
Ma
na
gem
ent
11
63

Table 4. The slack of inputs of each DMU.
Auto industry Commercial bank industry
DMUNumber ofemployees
Directcosts US$(million)
Material US$(million)
Totalassets US$(million) DMU
Number ofemployees
Directcosts US$(million)
Operatingexpenses US$
(million)
Totalassets US$(million)
1 688.927 0.000 0.000 0.000 1 463.899 0.000 26677832.429 0.0002 0.000 0.000 0.000 0.000 2 0.000 0.000 0.000 0.0003 0.000 0.000 0.000 0.000 3 0.000 0.000 0.000 0.0004 0.000 0.000 0.000 0.000 4 0.000 0.000 0.000 0.0005 14642.577 0.000 81710.307 0.000 5 0.000 0.000 0.000 0.0006 0.000 0.000 0.000 0.000 6 0.000 0.000 0.000 0.0007 0.000 0.000 0.000 0.000 7 64.943 89.873 6316457.284 255868.8448 0.000 0.000 0.000 0.000 8 124.808 447.812 9384214.706 0.0009 0.000 0.000 0.000 0.000 9 40.130 0.000 7696067.860 0.000
10 0.000 0.000 0.000 0.000 10 0.000 0.000 0.000 0.00011 0.000 30759056.565 2046868.193 84120987.708 11 0.000 96.252 0.000 0.00012 0.000 0.000 0.000 0.000 12 0.000 0.000 0.000 0.00013 0.000 31596971.136 3374501.672 0.000 13 0.000 0.000 0.000 0.00014 0.000 0.000 0.000 0.000 14 0.000 0.000 0.000 0.00015 0.000 0.000 0.000 0.000 15 2.969 392.977 0.000 0.00016 0.000 0.000 0.000 0.000 16 0.000 0.000 0.000 0.00017 0.000 0.000 0.000 0.000 17 0.000 0.000 0.000 0.00018 0.000 0.000 0.000 0.000 18 0.000 0.000 0.000 0.00019 0.000 0.000 1567409.292 0.000 19 0.000 0.000 0.000 0.00020 0.000 0.000 0.000 0.000 20 0.000 340.895 0.000 324152.84921 0.000 0.000 7039490.662 0.000 21 0.000 0.000 0.000 0.00022 0.000 0.000 2072262.617 0.000 22 0.000 0.000 0.000 0.000
11
64
C.-Y
.C
hia
ng
an
dB
.L
in

23 0.000 0.000 0.000 0.000 23 10.022 53.092 193833.472 0.00024 0.000 0.000 0.000 0.000 24 0.000 0.000 0.000 0.00025 0.000 0.000 0.000 0.000 25 0.000 0.000 0.000 0.00026 0.000 0.000 0.000 0.000 26 101.868 0.000 0.000 9193318.28927 0.000 0.000 0.000 0.000 27 0.000 0.000 0.000 244721.75128 0.000 0.000 0.000 0.000 28 0.000 0.000 0.000 0.00029 0.000 0.000 0.000 0.000 29 0.000 471.331 0.000 6542514.93630 0.000 0.000 0.000 0.000 30 67.725 0.000 0.000 12156886.58031 0.000 0.000 2648853.363 0.00032 0.000 0.000 0.000 0.00033 135.503 984200.690 0.000 0.00034 0.000 0.000 0.000 0.00035 0.000 0.000 0.000 0.00036 0.000 0.000 0.000 0.00037 0.000 0.000 0.000 0.00038 0.000 0.000 0.000 0.00039 0.000 0.000 0.000 0.000
To
tal
Qu
ality
Ma
na
gem
ent
11
65

performance, such as Nos. 2, 3, 4, 6 DMU. For these efficient DMUs, they were located at
the efficiency frontier. In addition, there were 19 inefficient DMUs which were necessary
to refer to other efficient benchmarks. Table 3 also reveals each inefficient DMU’s bench-
marks in the column of peers.
Table 3 also shows that there were three DMUs in the condition of increasing return
scale (irs), and there were 15 DMUs in the condition of decreasing return scale (drs).
The results of DEA also provided information indicating how to improve DMU’s effi-
ciency by adjusting inputs. Table 4 displays the slacks of inputs that represented the redun-
dant amounts of inputs. Most of these DMUs in the condition of increasing return scale
(irs) or decreasing return scale (drs) should adjust their quantities of materials. Only
No. 11 DMU had excessive levels of total assets. Nos. 1, 5 and 33 DMU had too many
employees.
In terms of the commercial banks, Table 5 reveals that 12 DMUs in the commercial
bank industry had good performance and are located at the efficiency frontier, such as
Nos. 2, 3, 4, 5 DMU. In addition, there were 18 inefficient DMUs which needed to
refer to other efficient benchmarks to improve their performance. For example, No. 1
DMU should learn from Nos. 13, 25, 24 and 21 DMU. Table 5 also showed that there
were no DMUs in the condition of increasing return scale (irs), and there were 18
DMUs in the condition of decreasing return scale (drs) in these inefficient DMUs.
Table 4 displays that most of these DMUs in the condition of irs or drs should adjust
their amounts of employees, direct costs, operating expenses and total assets.
Norman and Barry (1991) proposed that the DMUs could be classified according to the
levels of efficiency. The first category was the robustly efficient unit. The DMU in this
category was not only efficient but also other DMUs’ benchmark. The second category
was the marginal efficient unit, in which the DMU was efficient in that the value of
CRS was equal to one, but it was not other DMUs’ benchmark in that the DMU may
have distinct characteristics from others in the same industry. The third category was
the marginal inefficient units whose value of efficiency lay in between 0.8 to 1. If the
DMUs in this category would adjust their inputs or outputs, they were more likely to
achieve the status of efficiency. The fourth category was the distinctly inefficient units
whose value of efficiency was lower than 0.8.
In addition, some DMUs belonging to the inefficient unit category did not have to refer
to other DMUs, even they could be other DMUs’ benchmarks due to the value ‘one’ of
variable returns to scale (VRS). In this case, these DMUs also were located in the effi-
ciency frontiers (Banker et al., 1984). Nos. 7, 23, 24, 36, and 38 for the auto industry,
Nos. 2, 5, 13, 15, as well as Nos. 6, 10, 12, 16, 19, and 24 DMUs for the commercial
bank industry were the cases in point. Thus, the DMUs located in the efficiency frontiers
included the robustly efficient units and the inefficient units whose VRS equalled to one.
Table 6 displays the summary of the preceding discussion for each industry. The auto
industry had the highest percentages of marginal inefficient units, and the lowest percen-
tages of robustly efficient units and DMUs located in the efficiency frontiers. Although the
commercial bank industry had the highest percentages of distinct inefficient units, it also
had the highest percentages of DMUs located in the efficiency frontiers. According to
Tables 3 to 6, Hypothesis 4 was supported.
The comparisons of inputs and outputs among industries
In order to examine Hypothesis 5, this study further employed t-test to compare the differ-
ences with respect to research constructs. Among other matters, the number of employees,
1166 C.-Y. Chiang and B. Lin

Table 5. The efficiency and the benchmark peers of each DMU for the commercial bank industry.
DMU CRS VRS Scalea PeersPeercount DMU CRS VRS Scalea Peers
Peercount
1 0.181 0.482 0.376 drs 13, 25, 24, 21 0 16 0.709 1.000 0.709 drs 16 0
2 1.000 1.000 1.000 – 2 3 17 1.000 1.000 1.000 – 17 0
3 1.000 1.000 1.000 – 3 4 18 1.000 1.000 1.000 – 18 1
4 1.000 1.000 1.000 – 4 1 19 0.747 1.000 0.747 drs 19 3
5 1.000 1.000 1.000 – 5 1 20 0.292 0.535 0.546 drs 2, 22, 21, 12 0
6 0.339 1.000 0.339 drs 6 1 21 1.000 1.000 1.000 – 21 6
7 0.683 0.870 0.785 drs 25, 13, 22 0 22 1.000 1.000 1.000 – 22 4
8 0.188 0.340 0.554 drs 25, 22, 24 0 23 0.913 0.930 0.982 drs 14, 21 0
9 0.498 0.780 0.638 drs 25, 13, 24, 22 0 24 0.802 1.000 0.802 drs 24 4
10 0.298 1.000 0.298 drs 10 2 25 1.000 1.000 1.000 – 25 8
11 0.266 0.961 0.277 drs 25, 3, 19, 10 0 26 0.283 0.452 0.627 drs 28, 25, 13, 21 0
12 0.927 1.000 0.927 drs 12 2 27 0.585 0.588 0.994 drs 5, 21, 3, 18, 4 0
13 1.000 1.000 1.000 – 13 6 28 1.000 1.000 1.000 – 28 2
14 1.000 1.000 1.000 – 14 1 29 0.311 0.706 0.441 drs 12, 28, 3, 13, 25, 2 0
15 0.398 0.826 0.481 drs 6, 13, 19, 24, 21 0 30 0.282 0.842 0.335 drs 25, 19, 2, 10, 3 0
To
tal
Qu
ality
Ma
na
gem
ent
11
67

direct costs, materials or operating income, total assets, financial perspective, and learning
and growth perspective of BSC were divided by sales of each company. Table 7 indicates
that the number of employees dividing by sales, which refers to the necessary number of
employees to gain one million of sales, were not significantly different for the auto and
commercial bank industries (t ¼ –0.361, p ¼ 0.719). In terms of direct costs divided
by sales which means the necessary direct costs to gain one million of sales, the commer-
cial bank industry had lower scores than the auto industry, but the difference was not
significant (t ¼ 1.857, p ¼ 0.072). In terms of the total assets divided by sales, which
means the necessary total assets to gain one million of sales, the commercial banks had
significantly higher scores than the auto industry (t ¼ –11.865, p ¼ 0.000).
In terms of BSC dimensions, the commercial bank industry had significantly higher
levels of financial dimension (t ¼ –4.921, p ¼ 0.000), but had lower levels of internal
business process (t ¼ 3.892, p ¼ 0.000), as well as learning and growth dimension (t ¼
5.322, p ¼ 0.000) than auto industry. The results support Hypothesis 5 that the differences
Table 6. The summary of efficiency of DMU for each industry.
Category DMU Number Percentage
Robustly efficient unitAuto (n ¼ 39) 3, 4, 9, 15, 16, 18, 25, 27, 28, 29, 32, 34, 35 13 33.33%Commercial bank (n ¼ 30) 2, 3, 4, 5, 13, 14, 18, 21, 22, 25, 28 11 36.67%
Marginal efficient unitAuto (n ¼ 39) 2, 6, 17, 26, 37 5 12.82%Commercial bank (n ¼ 30) 17 1 03.33%
Marginal inefficient unitAuto (n ¼ 39) 1, 7, 8, 10, 14, 19, 24, 31, 33, 38 10 25.64%Commercial bank (n ¼ 30) 12, 23, 24 3 10.00%
Distinctly inefficient unitAuto (n ¼ 39) 5, 11, 12, 13, 21, 22, 23, 30, 36 9 23.08%Commercial bank (n ¼ 30) 1, 6, 7, 8, 9, 10, 11, 15, 16, 19, 20, 26, 27, 29,
3015 50.00%
Efficiency frontiersAuto (n ¼ 39) 3, 4, 7, 9, 15, 16, 18, 23, 24, 25, 27, 28, 29,
32, 34, 35, 36, 3818 46.15%
Commercial bank (n ¼ 30) 2, 3, 4, 5, 6, 10, 12, 13, 14, 16, 18, 19, 21, 22,24, 25, 28
17 56.67%
Table 7. Comparisons of constructs by industries.
1. Auto industry(n ¼ 39)
2. Commercial bank industry(n ¼ 30) t-value p-value
Number of employee/sales 71.577 116.076 20.361 0.719Direct cost/sales 772.762 574.291 1.857 0.072Material/operating income/sales 116.347 398.274 25.313 0.000Total assets/sales 1039.895 19772.140 211.865 0.000Financial/Sales 0.335 3.294 24.921 0.000Customer 3.990 4.370 20.298 0.767Internal business process 8.260 2.820 3.892 0.000Learning & growth/sales 0.009 0.001 5.322 0.000
Note: The unit of measurements, such as sales, direct cost, income, etc. are calculated in US$ (million).
1168 C.-Y. Chiang and B. Lin

between the auto and commercial bank industries tend to perform differently on most
research variables, including inputs and outputs.
Conclusions and discussions
The primary objective of this study was to develop an integrated research framework for
measuring the firms’ management performance with the applications of balanced score-
card and data envelope analysis. The function of DEA was to identify efficiency frontiers,
benchmarking partners, and inefficient slacks in term of the four inputs and four perspec-
tives of BSC for the auto and national commercial bank industries. Although some past
research employed DEA to measure the bank industry’s performance and efficiency
(e.g. Liu & Tripe, 2002; Sufian & Majid, 2006), the inputs and outputs for measuring
the performance were narrowly defined. In this regard, BSC provides an appropriate
tool to define performance index by providing appropriate outputs of performance for
DEA. BSC is able not only to minimise information overload by limiting the number of
measures used (Kaplan & Norton, 1992) but also to develop the scorecard by linking to
key success factors (Frigo & Krumwiede, 2000). On the other hand, DEA can set bench-
marking for companies based on their inputs and outputs, as well as transform perform-
ance measures into managerial information. Accordingly, the synergy of BSC and DEA
can translate the appropriate performance indices into managerial implications.
This is the first study to develop a research framework based on an integration of DEA
and BSC to identify the competitive position of a firm and its learning objectives to
become a member of the efficiency frontier. Previous studies related to the evaluation
of BSC using DEA, tended to take a piecemeal approach, and did not integrate different
constructs into a more concrete concept. This study tried to integrate different perspectives
into a comprehensive framework and verify the comprehensive framework through stat-
istical analysis, rather than case studies that are proposed in most of the previous literature.
Since previous studies lack empirical content, the results of this study could provide a solid
empirical foundation to support the inductive hypotheses for the integration of BSC and
DEA.
There were several conclusions drawn from our results. First of all, the interrelation-
ships between the four perspectives of BSC proposed by Kaplan and Norton (1996) were
further empirically shown to be valid in the auto and commercial bank industries. Specifi-
cally, the learning and growth perspective was significantly related to the internal business
process perspective, which in turn was positively related to the customer perspective. And
the customer perspective was positively related to the financial perspective. In addition,
the relationship between customer perspective and financial perspective was the most
significant among the interrelationships of BSC.
Although all the dimensions of BSC linked to each other in each industry, the crucial
elements in each dimension varied for each industry. In terms of the auto industry, R&D
expenses per employee and intangible assets were the most crucial indicators in the learn-
ing and growth perspective, which was positively related to total assets turnover in the
internal business process perspective. The total assets turnover was positively related to
relative market share in customer perspective, which in turn was positively related to
total revenue in the financial perspective.
The auto industry had the highest levels of the learning and growth perspective relative
to the commercial bank industry, but had lower levels of customer perspective. In order to
augment the levels of customer perspective, the auto companies can focus on the levels of
R&D expenses per employee and intangible assets. In terms of the commercial bank
Total Quality Management 1169

industry, the salary and wages per employee was most crucial indicator in the learning and
growth perspective, which was positively related to property plant and equipment turnover
in the internal business process perspective. The property plant and equipment turnover
was positively related to relative market share in the customer perspective, which in
turn was positively related to total revenue in the financial perspective. The commercial
bank industry had lower levels of learning and growth perspective and thus lower levels
of internal business process perspective. Although the commercial bank industry had
the highest levels of financial perspective, it had the highest percentages of distinct ineffi-
cient units. This seems to reveal the importance of cause-and-effect relationships between
indicators of the four perspectives of BSC.
Moreover, Norman and Barry’s (1991) classification could provide information about
the conditions of compositions with respect to each industry. The auto industry had the
highest percentages of marginal inefficient units, and the lowest percentages of robustly
efficient units and DMUs located in the efficiency frontiers. The commercial bank industry
had the highest percentages of distinct inefficient units, and the highest percentages of
DMUs located in the efficiency frontiers. The related information implies that the compa-
nies of the auto industry should improve their performance to achieve efficiency, and a
higher percentage of companies in the commercial banks sector should inspect themselves
because they are located in the efficiency frontier but are inefficient.
Several limitations of this study must be highlighted. First of all, this study employed
the cross-sectional research design to analyse the sample. The cross-sectional design
leaves open the possibility for lagged effects between integration and performance
measurements. Second, the long-term trends of the four perspectives of BSC cannot be
obtained from our data. Future research can address this limitation by examining a longi-
tudinal study with the integration framework of BSC and DEA. Third, other limitations
concern possible biases in the data. Companies in the dataset are large and medium-
sized, and the results may only be valid for other companies of similar size. Fourth, the
analysis was performed on mainly auto firms and banking firms. Last, the sample size
was small for each industry due to the accessibility of data. Although the sample size
was enough to conduct DEA, the further multivariate analysis cannot be used to
examine the data due to small sample size. For example, the comparisons of four cat-
egories based on Norman and Barry (1991) for each industry cannot be conducted
where the sample size is smaller than 30 in each category. However, unless there are sys-
tematic differences in the excluded firms, this may not be a major concern.
References
Ahn, H. (2001). Applying the balanced scorecard concept: An experience report. Long RangePlanning, 34(4), 441–461.
Avkiran, N.K. (2002). Monitoring hotel performance. Journal of Asia-Pacific Business, 4(1), 51–66.Bach, N., Calais, P., & Calais, M. (2001). Marketing residential grid-connected PV systems using a
balanced scorecard as a marketing tool. Renewable Energy, 22(1–3), 211–216.Banker, R.D., & Thrall, R.M. (1992). Estimation of returns to scale using data envelopment analysis.
European Journal of Operational Research, 62, 74–84.Banker, R.D., Charnes, A., & Cooper, W.W. (1984). Some models for estimating technical and scale
inefficiencies in data envelopment analysis. Management Science, 30, 1079–1092.Bojnec, S., & Latruffe, L. (2008). Measures of farm business efficiency. Industrial Management &
Data Systems, 108(2), 258–270.Braam, G.J.M., & Nijssen, E.J. (2004). Performance effects of using the balanced scorecard: A note
on the Dutch experience. Long Range Planning, 37(4), 335–349.Butler, A., Letza, S.R., & Neale, B. (1997). Linking the balanced scorecard to strategy. Long Range
Planning, 30(2), 242–253.
1170 C.-Y. Chiang and B. Lin

Chang, D.S., & Lo, L.K. (2005). Measuring the relative efficiency of a firm’s ability to achieveorganizational benefits after ISO certification. Total Quality Management & BusinessExcellence, 16(1), 57–69.
Charnes, A., Cooper, W.W., & Rhodes, E. (1978). Measuring the efficiency of decision makingunits. European Journal of Operational Research, 2, 429–444.
Denton, G.A., & White, B. (2000). Implementing a balanced-scorecard approach to managing hoteloperations. Cornell Hotel and Restaurant Administration Quarterly, 41(1), 94–108.
Fletcher, H.D., & Smith, D.B. (2004). Managing for value: Developing a performance measurementsystem integrating economic value added and the balanced scorecard in strategic planning.Journal of Business Strategies, 24(1), 1–18.
Franco, M., & Bourne, M. (2003). Factors that play a role in managing through measures.Management Decision, 41(8), 698–710.
Frigo, M.L., & Krumwiede, K.R. (2000). The balanced scorecard. Strategic Finance, 81(7), 50–54.Gautreau, A., & Kleiner, B.H. (2001). Recent trends in performance measurement systems: The
balanced scorecard approach. Management Research News, 24(3), 153–156.Golany, B., & Roll, Y. (1989). An application procedure for data envelopment analysis. Omega
International Journal of Management Science, 17(3), 237–250.Green, K.W., Chakrabarty, S., & Whitten, D. (2007). Organisational culture of customer care:
Market orientation and service quality. International Journal of Services and Standards,3(2), 137–153.
Hair, J.F., Black, B., Babin, B., Anderson, R.E., & Tatham, R.L. (2006). Multivariate data analysis(6th ed.). Upper Saddle River, NJ: Pearson Prentice Hall.
Hasan, H., & Tibbits, H. (2000). Strategic management of electronic commerce: An adaptation of thebalanced scorecard. Internet Research, 10(5), 439–450.
Kanji, G., & Moura, P. (2001). Kanji’s business scorecard. Total Quality Management, 7(8),898–905.
Kaplan, R.S., & Norton, D.P. (1992). The balanced scorecard – measures that drive performance.Harvard Business Review, 70(1), 71–79.
Kaplan, R.S., & Norton, D.P. (1996). Using the balanced scorecard as a strategic managementsystem. Harvard Business Review, 74(1), 75–85.
Lin, L.Y., Wu, S.H., & Lin, B. (2008). An empirical study of dynamic capabilities measurement onR&D department. International Journal of Innovation and Learning, 5(3), 217–240.
Liu, B., & Tripe, D. (2002). New Zealand bank mergers and efficiency gains. Journal of Asia-PacificBusiness, 4(4), 61–81.
Lohman, C., Fortui, L., & Wouters, M. (2004). Designing a performance measurement system: Acase study. European Journal of Operational Research, 156(2), 267–286.
Malina, M.A., & Selto, F.H. (2001). Communication and controlling strategy: An empirical study ofeffectiveness of the balanced scorecard. Journal of Management Accounting Research, 13(1),47–90.
Mooraj, S., Oyon, D., & Hostettler, D. (1999). The balanced scorecard: A necessary good or anunnecessary evil? European Management Journal, 17(5), 481–491.
Mostafa, M. (2007). Benchmarking top Arab banks’ efficiency through efficient frontier analysis.Industrial Management & Data Systems, 107(5), 802–823.
Narasimhan, S.L., & Graham, A.W. (2005). Relative efficiency of computer and computer servicescompanies. Business Review, 3(2), 47–50.
Norman, M., & Barry, S. (1991). Data envelopment analysis: The assessment of performance.New York: John Wiley.
Nørreklit, H. (2003). The balanced scorecard: What is the score? A rhetorical analysis of thebalanced scorecard. Accounting, Organizations and Society, 28(6), 591–619.
Othman, R., Domil, A.K.A., Senik, Z.C., Abdullah, N.L., & Hamzah, N. (2006). A case study ofbalanced scorecard implementation in a Malaysian company. Journal of Asia-PacificBusiness, 7(2), 55–72.
Papalexandris, A., Ioannou, G., Prastacos, G., & Soderquist, E.K. (2005). An integrated method-ology for putting the balanced scorecard into action. European Management Journal,23(2), 214–227.
Phusavat, K. (2007). Roles of performance measurement in SMEs’ management processes.International Journal of Management and Enterprise Development, 4(4), 441–458.
Total Quality Management 1171

Phusavat, K., & Kanchana, R. (2008). Competitive priorities for service providers: Perspectives fromThailand. Industrial Management & Data Systems, 108(1), 5–21.
Pock, T., Westlund, A., & Fahmi, F. (2004). Gaining bilateral benefit through holistic performancemanagement and reporting. Total Quality Management & Business Excellence, 15(5),557–567.
Prajogo, D.I. (2007). The relationship between competitive strategies and product quality. IndustrialManagement & Data Systems, 107(1), 69–83.
Rickards, R.C. (2003). Setting benchmarks and evaluating balanced scorecards with data envelop-ment analysis. Benchmarking, 10(3), 226–245.
Rusjan, B. (2005). Usefulness of the EFQM excellence model: Theoretical explanation of some con-ceptual and methodological issues. Total Quality Management & Business Excellence, 16(3),363–380.
Serrano-Cinca, C., Fuertes-Callen, Y., & Mar-Molinero, C. (2005). Measuring DEA efficiency ininternet companies. Decision Support Systems, 38(4), 557–573.
Soltani, E., Lai, P.C., & Mahmoudi, V. (2007). Managing change initiatives: Fantasy or reality? Thecase of public sector organizations. Total Quality Management & Business Excellence, 18(1),153–179.
Sueyoshi, T. (1997). Measuring efficiencies and returns to scale of Nippon telegraph and telephonein production and cost analyses. Management Science, 43(6), 779–796.
Sufian, F., & Majid, M.Z.A. (2006). Banks’ efficiency and stock prices in emerging market:Evidence from Malaysia. Journal of Asia-Pacific Business, 7(4), 35–53.
Thanassoulis, E. (1996). A data envelopment analysis approach to clustering operating units forresource allocation purposes. Omega International Journal of Management Science, 24(4),463–476.
Wang, F.K. (2006). Evaluating the efficiency of implementing total productive maintenance. TotalQuality Management & Business Excellence, 17(5), 655–667.
Wu, M.C., W, C.T., Wu, S.H., & Lin, B. (2008). The social context of creativity at third places: Anexploratory study. International Journal of Management & Enterprise Development, 5(1),30–48.
1172 C.-Y. Chiang and B. Lin

Copyright of Total Quality Management & Business Excellence is the property of Routledge and its content
may not be copied or emailed to multiple sites or posted to a listserv without the copyright holder's express
written permission. However, users may print, download, or email articles for individual use.