an integrative approach for biological data mining and
TRANSCRIPT

Article II
An integrative approach for biological data mining
and visualisation
In: Int. J. Data Mining and Bioinformatics. Vol. 2 (1), 2008, pp. 54–77.
Reprinted with permission from the publisher.


54 Int. J. Data Mining and Bioinformatics, Vol. 2, No. 1, 2008
Copyright © 2008 Inderscience Enterprises Ltd.
An integrative approach for biological data mining and visualisation
Peddinti V. Gopalacharyulu, Erno Lindfors, Jarkko Miettinen, Catherine K. Bounsaythip and Matej Orešič* VTT Technical Research Centre of Finland, P.O. Box 1500, Espoo, FIN-02044 VTT, Finland E-mail: [email protected] E-mail: [email protected] E-mail: [email protected] E-mail: [email protected] E-mail: [email protected] *Corresponding author
Abstract: The emergence of systems biology necessitates development of platforms to organise and interpret plentitude of biological data. We present a system to integrate data across multiple bioinformatics databases and enable mining across various conceptual levels of biological information. The results are represented as complex networks. Context dependent mining of these networks is achieved by use of distances. Our approach is demonstrated with three applications: full metabolic network retrieval with network topology study, exploration of properties and relationships of a set of selected proteins, and combined visualisation and exploration of gene expression data with related pathways and ontologies.
Keywords: data mining; bioinformatics; complex networks; heterogeneous database integration; systems biology.
Reference to this paper should be made as follows: Gopalacharyulu, P.V., Lindfors, E., Miettinen, J., Bounsaythip, C.K. and Orešič, M. (2008) ‘An integrative approach for biological data mining and visualisation’, Int. J. Data Mining and Bioinformatics, Vol. 2, No. 1, pp.54–77.
Biographical notes: Peddinti V. Gopalacharyulu is a PhD student at the Helsinki University of Technology. He is pursuing his thesis work at VTT under the supervision of Matej Orešič. His research focuses on integration of heterogeneous biological data.
Erno Lindfors is embarking on his PhD studies at the Helsinki University of Technology. He is pursuing his thesis work at VTT under the supervision of Matej Orešič. His research focuses on visualisation of heterogeneous biological data.
Jarkko Miettinen is pursuing his Masters in a Bioinformatics Degree program at the Helsinki University of Technology.
Catherine K. Bounsaythip received her PhD in Automation and Computer Engineering from the University of Sciences and Technologies of Lille (France) for her work related to genetic algorithms. Her current research focuses on knowledge representation in biology.
II/1

An integrative approach for biological data mining and visualisation 55
Matej Orešič received his PhD in Biophysics from Cornell University, USA. His research interests include systems biology and metabolomics. He is a Group Leader of ‘Quantitative Biology and Bioinformatics’ at VTT.
1 Introduction
The omics revolution has empowered us with technologies to study the biological systems by measuring a large number of molecular components in parallel, therefore enabling the systems approach (Ideker et al., 2001; Kitano, 2002). The wealth of new information, combined with existing repositories of knowledge dispersed across numerous databases and literature, demand new solutions for management and integration of life science data. This has already been recognised in a variety of application domains relying on life science research. Knowledge management and data integration are recognised bottlenecks in drug discovery domain and current solutions are not yet capable of taking the full advantage of the information delivered by the modern omics technologies (Searls, 2005). More fundamentally, the ability to collect molecular information from biological systems in parallel is also challenging the ways we represent the biological systems and related knowledge, as well as the ways we design experiments to address specific biological questions.
Several approaches for biological data integration have been developed. Well-known examples include rule-based links such as SRS (Etzold and Argos, 1993; Etzold et al., 1996), federated middleware frameworks such as Kleisli system (Davidson et al., 1997; Chung and Wong, 1999), as well as wrapper-based solution using query optimisation such as IBM Discovery Link (Hass et al., 2001). In parallel, progress has been made to organise biological knowledge in a conceptual way by developing ontologies and domain-specific vocabularies (Ashburner et al., 2000; Bard and Rhee, 2004; Bodenreider, 2004). The emergence of XML and Semantic Web technologies has fostered the ontology-based approach to life science data integration. In this context, data integration comprises problems like homogenising the data model with schema integration, combining multiple database queries and answers, transforming and integrating the latter to construct knowledge based on underlying knowledge representation. However, the ontology-based approach alone cannot resolve the practical problem of evolving concepts in biology, and its best promise lies in specialised domains and environments where concepts and vocabularies can be well controlled. Neither can the ontologies alone resolve the problem of context, i.e., what may appear closely related in one context, may be further apart or unrelated in another (Gärdenfors, 2000).
Biological systems are characterised by the complexity of interactions of their internal parts and also with the external environment; integrating such information may result in a huge and heterogeneous network of biological entities. The visualisation of these networks poses many challenges (Herman et al., 2000). The problem is not only to display them, but also to represent them in a way that would enable easy interpretation of these huge networks. Our goal is to alleviate this problem by using context-based mining.
Biological network visualisation tools abound in many flavours, but few of them have met important requirements that enable real biological interpretation (Saraiya et al., 2005). Contextuality is one of those requirements. There are some tools
II/2

56 P.V. Gopalacharyulu et al.
that provide contextuality by attaching notes to visualised entities (Shannon et al., 2003; Dahlquist et al., 2002). However, this approach does not resolve the interpretation problem especially when the networks become complex. Therefore, the context-based mining is needed to eliminate some dimensions that are not contextually relevant.
Our approach to enable context-based mining is based on non-linear projection methods. Heterogeneous high-dimensional data are projected to a lower-dimensional space (two or three dimensions) in such a way that all similarity relationships are preserved as much as possible. This is quite challenging to implement in practice due to the heterogeneity of the entities and relationship types. The best compromise is to choose which kinds of relationships to visualise and what type of metrics to use in order to ensure the reliability and biological interpretability of the visualised data. Therefore, special attention should be put also on the data representation when integrating different types of information.
In this paper, we present a data integration and mining approach based on network representation models, which support an advanced visualisation system. As reported in our initial studies, the system has the capability to enable bioinformatics studies in a context dependent way (Gopalacharyulu et al., 2004, 2005). Section 2 introduces the general architecture of our database system, its implementation and methods. Section 3 describes our methods for network data representation and mining. Section 4 illustrates our approach on three different applications: metabolic network topology study, context-dependent protein annotation, and visualisation of Type 1 Diabetes gene expression dataset in the context of known pathways and ontologies. In the last section we discuss the current status of our research, persistent challenges, and future goals.
2 Integrated database system
2.1 Architectural design
The core architecture of our data integration and visualisation system, called megNet, is composed of three layers; back-end, middle tier and front-end (Figure 1). The data, schema maps, ontology definitions constitute the back-end layer. Most of our local data are represented in XML or RDF formats. The data is stored using XML data management system Tamino XML server (Software AG) in a Redhat Linux Advanced Server v3.0 environment. The databases are queried using Tamino X-Query which is based on XPath 1.0 specification. The queries are enabled through the Tamino Java API. For storing more voluminous data such as gene expression data and in house produced mass spectrometry data, we use Oracle 10g database server (Oracle, Inc.). The Oracle queries are performed using Oracle JDBC Thin drivers. The results obtained from queries to Tamino and Oracle are combined at the Java programming level in the middle tier.
The middle tier comprises the business logic of our system. Business logic events, such as graph constructions, distance data projections, topology calculations are implemented as stateless session beans. They are processed as web services. The session beans are the end points of the web services. They receive their request messages from the client for performing a business logic event. In the end of their life cycle they send the response to the client.
II/3

An integrative approach for biological data mining and visualisation 57
Figure 1 Three-tier architecture of the bioinformatics data integration and visualisation system. Back end tier consists of source biological data, schema mappings and ontologies. Middle tier is a suite of algorithms for business logic events (e.g., network constructions, data projections). Front end is a Java based user interface for visualisation the biological data and interacting with the user
The middle tier resides physically in a JBoss 4.04 Application Server (JBoss, Inc.). The business logic events are processed in the EJB Container of JBoss. The client and server communicate through SOAP messages. The SOAP messages are converted to Java objects by the middle tier after it has received a request message from the front-end client and Java objects are converted to SOAP messages before they are sent back as a response message. These conversions are implemented by using Apache Axis 1.4 (Apache Software Foundation). They are processed in Apache Tomcat 5.5 Servlet Container.
The front-end comprises the user interface for visualising and interacting with the end user. It is implemented in the Java environment.
2.2 Database curation
A system-wide life science data mining requires concurrent use of several databases, each of them likely having their own data schema, interface, address, and software tools. A database access tool is therefore needed that affords mining of several databases within one single interface. A fundamental step towards the integration of biological databases is to identify the ‘atoms of information’ and to develop solutions that resolve the naming conflicts as well as data structures. This is the task of a database ‘curator’. For every database (either containing annotations or information about entity relationships) the database curator develops a data schema that enables mapping to other databases.
Data from various public and commercial data sources were set up in our database system. Table 1 lists those data sources which were utilised in the examples of this paper. A typical data curation flow is explained below in the form of a pseudo-algorithm:
1 Decide on a data source to be set up and download the data typically using ftp. If the downloaded data is already XML format go to step (3) otherwise go to (2).
2 Study the structure of the non-XML data and define XML schemas to capture the logical structure of the data. Go to step (4). I
II/4

58 P.V. Gopalacharyulu et al.
3 If the document structures have been defined using DTD, then convert the DTD to W3C Schema. If the XML schema is available from the source itself, if necessary, make changes to it to fit the requirements of the implementation (e.g., change the target name space to Tamino name-space and define a prefix for the original target namespace).
4 Define physical properties such as indices, doc-type etc. for the logical schema to construct a Tamino Schema Definition document, i.e., TSD schema. If the previous step was (2) go to (5) else go to (6).
5 Develop parsers to convert the non-XML data into an XML format. A typical development phase is always followed by several test and feed-back loops that involve an extensive use of XML data validation as well as human eye reading. Go to step (7).
6 Develop parsers to convert the distributed XML format to the required XML format.
7 Load the resulting XML documents using mass-loading tool of the Tamino Server.
Table 1 Databases incorporated into the system
Database Version or release date No. of entries UniProt/Swiss-Prot (Bairoch et al., 2005) 44.0 153871 NCBI PubChem (http://pubchem.ncbi.nlm.nih.gov/) – Substance
January 4, 2005 788730
KEGG (Kanehisa et al., 2004) – Pathways 11380 LIGAND (Goto et al., 2002) – Genes 705802 Enzymes 4327 Compounds 11116 Glycans
August, 2004
10302 TRANSFAC (Matys et al., 2003) – Gene 7796 Factor 5919 Site
June, 2005
14782 TRANSPATH (Krull et al., 2003) – Pathway 333 Gene 4989 Molecule 20164 Reaction 23065 Annotation
June, 2005
24218 BIND (Bader et al., 2003) August, 2004 90580 MINT (Zanzoni et al., 2002) 2.1 18951 IntAct (Hermjakob et al., 2004) September, 2004 37 Gene Ontology (Gene Ontology Consortium, 2000) assocdb XML version
May, 2005 18078
As not every field in the original databases is integrated, it is the task of the curator to capture the relevant subparts of it as well as to define appropriate semantics for the
II/5

An integrative approach for biological data mining and visualisation 59
integrated database. In the course of implementing the above steps we make use of XMLSPY software (Altova, Inc.) and Tamino Schema Editor software (Software AG) for the construction and validation of logical and physical schemas, respectively. The development of parsers is usually implemented in the Perl programming language and in some cases using Java.
2.3 Database traversals with schema maps
Even resolving simple biological relationships containing only a few biomolecular components often requires traversing multiple databases. In order to enable such traversals within our system, we developed a database of schema maps (henceforth called maps database), which maps across different names used for the same entities across multiple databases (Gopalacharyulu et al., 2005). For example, the maps database for protein entities is indexed by UniProt identifiers. For creating such a map, we developed a Perl program to extract data from the UniProt XML documents.
The database traversals can be achieved by applying simple join operations involving the maps database. Since the maps database records contain identifiers and names of an entity from all databases, it is ensured that the join operation between appropriate databases and rightly chosen entities would always return a non-empty result. The querying of a database independent of the names used in it can be achieved by writing queries to first search the maps database to find out the name/Id number of the entity in the original database and then search the original database with the correct name/Id number. Considerable challenge for any biological data integration is the often-changing structures of the data in the public databanks (Critchlow et al., 2000). We address this problem at the “Logical schema construction level” of our data curation cycle by keeping our logical schemas to be as minimal as possible, yet useful enough to be able to observe the associations between all the data sources.
3 Data visualisation and mining methods
3.1 Network visualisation
In life sciences, everything is connected; even entities believed to be unrelated in some context might associate with each other in some other contexts. Thus, an integrated network of interacting entities of a biological system will necessarily contain many different types of entities and attributes arising from a number of disparate data sources, including literature databases.
The user interface of our system is capable of visualising these integrated networks in interactive manner (Figure 2). It constitutes the following sections:
• query parameters section
• network visualisation section
• display information section
• menu bar
• Non-Linear Mapping (NLM) window.
II/6

60 P.V. Gopalacharyulu et al.
Figure 2 User interface of megNet, developed in Java
The ‘query parameters’ section consists of database, species, and query parameter menus. The database menu enables multiple selections from a list of all databases and the species menu enables multiple selections from a list of all species available in the system. The query parameter menu provides a collection of input boxes for entering a variety of parameters such as, protein names/ids, concept ids, metabolic pathway names, gene expression data set ids, initial depth of search etc. In addition, there is a button for launching the query.
The ‘network visualisation’ section is the place where the resulting network of a graph construction request is displayed. This interface provides options for interactively visualising or modifying the network. Typical examples of user interaction in this section include zooming in and out of the network, moving the network using pan tool, selecting a node to display its annotations in the display information section, selecting some parts of the network either to delete that part or to modify weights of the edges under selection etc.
The ‘display information’ section displays annotations of the selected node or edge. The information displayed reflects the annotations that exist in the databases. This section also provides hyperlinks to the source database of the entity under selection so as to enable the user to get more information on this entity.
The ‘menu bar’ enables interaction within our system in many ways. Typical example features enabled through its items include saving the network result or loading the network (in XML format), modifying weights of various types of interactions i.e., edge, projecting network into lower dimensional space and performing topological calculations on the networks.
The ‘NLM window’ displays the lower dimensional projection space. This interface also allows interactive features such as zooming in and out. Additionally, selecting a point in the projection space highlights the corresponding network node in the
II/7

An integrative approach for biological data mining and visualisation 61
‘network visualisation’ section. This enables viewing annotations of this entity in the ‘display information’ section.
When the user starts using the user interface, he can either load a previously saved network from XML document or he can construct a new network. In the former case he can open a file chooser from the upper menu for selecting the XML document. In the latter case he can assign query parameters to the network construction in the query parameter section that constitutes different menus on the bottom. In the database menu he can select from which databases he wants to retrieve entities and relationships. In the species menu, he selects in which species he wants to construct the network. In the query parameter menu, he can assign more parameters for the query. For example, he can type a protein name (e.g., PMI40) or identifier to visualise the neighbourhood of a certain protein. Or he can type a metabolic pathway name (e.g., Pentose phosphate pathway) to visualise all entities and interactions involved in a certain pathway or to investigate its neighbourhood of various types of interactions. When the user has assigned all query parameters, he can click on the ‘Query’ button to launch the query.
Once the network is constructed upon assigned query parameters or loaded from XML document, it is visualised on the middle part of the user interface (i.e., in Network visualisation section). The network is portrayed by using Tom Sawyer Visualisation 6.0 (Tom Sawyer Software, Oakland, CA, USA) symmetric layout algorithm. In the displayed network, shape conventions are used to distinguish the type of entity underlying a node. Similarly, colour codes are used to distinguish the type of the relationship underlying an edge. The user can make inferences from the network by zooming in and out. The user can save this network in XML format by opening a file chooser from the upper menu. A mouse left click on a node displays the biological information in the text area located on the right hand side. The information displayed in this text area contains the data retrieved from locally installed databases and links to external databases.
There are many ways to represent the data structure of a network (Bollobás, 1998). In our approach, a biological network is represented as a directed weighted graph where biological entities are nodes that are connected to each other through edges which are interactions or relationships between the entities. The shape of the nodes is coded differently depending on the type of an entity (e.g., squares stand for proteins, circles stand for compounds). The edges can be bidirectional or unidirectional, depending on the nature of the relationships. For example, in the case of protein-protein interaction network, we would relate the neighbouring proteins by searching all possible pathways among them, including their regulating genes. The generated nodes and edges then show the proteins and their interactions, respectively. In the case of metabolic network, we need to relate entities that are involved in each reaction. The substrates, products and enzymes are represented as nodes. As reactions can be either reversible or irreversible, unidirectional edges are used to distinguish the direction of an irreversible reaction and bidirectional edges are used to represent reversible reaction.
If the user wants to project the internal distances of the network into 2-dimensional space, she can assign appropriate bias by modifying the edge weights. After that she selects one of the available projection methods (Sammon’s NLM, Curvilinear Component Analysis (CCA), Curvilinear Distance Analysis (CDA)) from the upper menu (Each of these methods is described in detail in Section 3.2). After that the selected projection method is performed. As a result we obtain coordinates of the network nodes in the 2-dimensional projection space. These coordinates are displayed on a separate
II/8

62 P.V. Gopalacharyulu et al.
window that is opened after the projection method is finished. When the user clicks on a node on the two-dimensional projection window, the corresponding node on the network is highlighted and vice versa.
While distances within the molecular networks can be intuitively set to the length of the shortest path between the molecules, distance measure is less obvious for conceptual relationships such as in ontologies. One way to approach this is to consider an ontology as a graph and the distance measure is based on the shortest path to a common ancestor (Lee et al., 2004b). In the case of gene expression network which consists only of genes, the similarity measure is based on the gene expression profile distance between the genes (e.g., Euclidean or related).
The user can also perform topology calculations on the network and modify the network (e.g., removing some nodes according to their presence in an experimental condition). Our system uses a variety of methods for such studies. Below, we describe few that have been utilised in the examples of the paper.
3.2 Topology of a network
The molecular entities of the cell form a very complicated and dynamic interacting system. One of the major challenges of contemporary biology is to understand the structure of this complex web of interactions. The network structure and their dynamics is believed to have a significant effect on the structure and function of the cell (Barabasi and Oltvai, 2004).
The biological networks at the molecular level can be divided into different types of networks such as metabolic pathways, protein-protein interaction and regulatory networks. These networks are mutually interdependent and it has been demonstrated that they share some common network properties, e.g., the presence of single modularity networks (Barabasi and Oltvai, 2004; Han et al., 2004; Guimera and Amaral, 2005). However, the presence of the modularity in highly integrated biological networks is not self-evident as it lacks quantitative support (Ravasz and Barabási, 2003). There is thus a need for tools that afford the parallel study of multiple biological networks.
In order to study these topological properties we can formalise the network representation as a graph. Therefore, we apply mathematical methods used in graph theory.
Let us denote by G = (X, U) a graph containing two sets where X = {x1, x2, …, xn, … xN}|X|=N, the set of nodes and U = {u1, u2, …, um, … UM}|U|=M the set of edges, where u = [xi, xi+1]i=1…N. A weighted graph is denoted by G = (X, U, W) where W: U → ℜ.
The distances between the biological entities can be derived from the path lengths within a graph. A path µ of length q is a sequence of edges U(µ) = {u1, u2, …, uq}. In a weighted graph the length of the path µ is obtained by summing up all weights of the edges of U(µ). In graphs, there are often many alternative paths between two nodes. Therefore, in practice one is mainly interested in the shortest path length between the selected nodes. We can obtain an average path length by calculating the shortest path between every pair of nodes of a graph and dividing the result by total number of nodes. This average value quantitatively characterises a graph by describing how close to each other its nodes are.
II/9

An integrative approach for biological data mining and visualisation 63
A graph can be characterised by its degree distribution Px(k) defining the probability that an arbitrary node x is connected to k neighbours. For metabolic networks, it was demonstrated that Px(k) decays as a power law Px(k) ≈ k–γ with γ ≅ 2.2 in all organism (Jeong et al., 2000). This type of decay function characterises a scale-free network topology. This type of distribution is applicable only to a graph where all edges are bidirectional. For the case of networks containing some unidirectional edges, we would be interested in an in-degree distribution and out-degree distribution, which define the number of in-coming and out-going edges a node x has, respectively.
Another way to characterise a graph is to calculate its clustering coefficient Cx(k) which is the density of connections in the neighbourhood of a node x (Dorogovtsev and Mendes, 2003). It is defined as the ratio between the total number n of the edges connected to its k nearest neighbours and the total number of all possible edges between all these nearest neighbours Cx(k) = 2n/k(k – 1). A high clustering coefficient Cx(k) would suggest a modular organisation.
It has been shown that most of complex networks (e.g., biological networks, world wide web, actor networks) are scale free networks with high clustering coefficient (Ravasz and Barabási, 2003). This means that there are few dominating hubs which lead to properties such as high tolerance to random failures. On the other hand, the network can collapse if one eliminates as few as 5–15% of its highly connected hubs. Recent studies showed that metabolic networks contain a hierarchical modularity (Kanehisa et al., 2004). This modularity combines two features into one network type. According to this modularity study, graph’s in- and out-degree distributions follow power law Px(k) ≈ k–γ, with a constant γ ∈ ℜ, and the dependence of the clustering coefficient follows the power law Cx(k) ≈ k–γ as well.
3.3 Network projections
The main purpose of data projection is to map a high dimensional data to a lower dimensional space in order to be able to visualise them in a context-based manner. The methods implemented in our system so far are the Sammon’s NLM (Sammon, 1969), CCA (Demartines and Hérault, 1997) and CDA (Lee et al., 2004a).
All projection methods we used share common features: Let *
ijd denote distance, by some metric, between two points i and j in the original K-dimensional input space A and let dij denote the distance between points i and j in the L-dimensional (where L < K) output space B. In addition, every projection method we have used has an error function Err(.) which includes these two distances and some weight function which decides on how much smaller or larger distances we try to preserve.
All methods try to minimise an error function iteratively, either by steepest gradient descent (NLM) or stochastic gradient descent (CCA and CDA).
3.3.1 Sammon’s Non-Linear Mapping (NLM) Sammon’s NLM (Sammon, 1969) error function is the following:
2*( )1Err .**
Kij ij
Ki j ijiji j
d ddd <
<
−= ∑∑
II/10

64 P.V. Gopalacharyulu et al.
NLM algorithm tries to minimise Err by always descending towards the steepest gradient. It may thus end up in a local minimum and the convergence may be slow. Its time-complexity is of O(n²). Therefore it may be too slow for data with tens of thousands of points, especially when the original dimensionality K is large, and is not appropriate for interactive work.
3.3.2 Curvilinear Component Analysis (CCA) CCA attempts to preserve local topology by favouring first short distances, and long distances afterwards. The error function is formalised as follows:
21 *Err ( ) ( , ( ))2 ij ij ij
i i jd d F d kλ
≠
= −∑∑
where F(dij, λ(k)) is the weighting neighbourhood function that decreases with its arguments, thus favours local topology preservation. Computationally CCA is lighter than NLM because CCA reduces the computational cost of finding minima by using stochastic gradient descent and by optionally using vector quantisation to create centroids that approximate some groups of points in K-space. Without quantisation CCA’s time-complexity is of O(n²) and with vector quantisation O(n*n′) where n′ is the number of centroids created in vector quantisation. Therefore, the time-complexity becomes O(n²) with inefficient vector quantisation.
3.3.3 Curvilinear Distance Analysis (CDA) Instead of calculating Euclidean distances between points of an object, CDA calculates curvilinear distances, denoted by δij, between points of a structure by creating a graph out of centroids. After that it calculates the shortest path between two prototypes of the codebook after quantisation and linking of the prototypes. The curvilinear distances are used instead of Euclidean distances. The error function becomes then:
21 *Err ( ) ( , ( )).2 ij ij ij
i i jF d kδ δ λ
≠
= −∑∑
CDA’s time-complexity is of O(n′e + n′2ln(n′)), where e is number of edges created between centroids, n′ number of centroids and n number of data-points. This follows from the complexity of Dijkstra’s (1959) shortest path algorithm that is used for every centroid. That becomes O(n.e + n2ln(n)) with inefficient vector quantisation.
In the worst case the runtimes of CDA may seem to be very long compared to that of CCA or NLM. However, in practice its runtime is near that of CCA which is much shorter than that of NLM. The use of curvilinear distance measure provides much better results than CCA when K-space has complex features. In the following section, we will apply CDA projection method to visualise the metabolic network in a context-based manner.
II/11

An integrative approach for biological data mining and visualisation 65
4 Applications
4.1 Network retrieval and topology study
The topological properties of biological networks have been an intense topic of computational biology research (Jeong et al., 2000, 2001; Arita, 2004; Barabasi and Oltvai, 2004). A practical step necessary to retrieve specific networks involved in such studies requires development of parsers to retrieve those networks from appropriate databases. Since it is becoming clear the topology of biological network may also need to be viewed in the context of systems dynamics (Luscombe et al., 2004), the future research in this domain would benefit from ability to retrieve biological networks corresponding to different biological states easily from the life science databases and experimental data.
A simple example of a network retrieved from our database is presented in Figure 3, showing a result from a query for the complete metabolic network from KEGG (Kanehisa et al., 2004) for S. cerevisiae species. This network can then be investigated for local structures, links to other networks and biological entities, as well as for the global studies such as analyses of network scaling properties. Figure 4 shows the calculated degree distribution of the yeast metabolic network retrieved from KEGG, with the nodes being the enzymes and the edges connections between the enzymes via metabolites as substrates or products. Figure 5 shows the calculated degree distribution as a function of node degree for the same network. It appears that neither of these distributions follows the power law ideally, which is in contrast with previous findings stating that the hierarchical modularity is present in metabolic networks (Jeong et al., 2000). We can see from Figure 3 that there is one large metabolic island which contains most nodes of the graph. The presence of several small islands may be explained by the lack of the connectivity data in KEGG. These islands affect the total distributions.
Figure 3 Result of a retrieval of complete yeast metabolic network from megNet using a simple query for KEGG and S. cerevisiae
II/12

66 P.V. Gopalacharyulu et al.
Figure 4 Degree distribution of the yeast metabolic network shown in Figure 3. It appears that the degree distribution does not follow the power law which means that there is no hierarchical modularity in this metabolic network
Figure 5 Clustering coefficient as a function of node degree for the yeast metabolic network. Here the clustering coefficient does not seem to follow the power law either, which suggests that there is no hierarchical modularity in our network
In order to demonstrate the use of context for visualisation with CDA projection algorithm, we retrieved a KEGG metabolic pathway with Gene Ontology (Ashburner et al., 2000) annotations for S. cerevisiae species. Figure 6 shows zoomed in result of that retrieval in the neighbourhood of the tricarboxylic acid cycle biological process, while the CDA projection of that graph is shown in Figure 7. In this projection the tricarboxylic acid cycle biological process is biased so that its incident edges have lower weights than the other edges of the graph. We can see that in this projection there are two main clusters. In one cluster there are the tricarboxylic acid cycle Gene Ontology term (Number 1) and its neighbour nodes. Therefore, we may conclude that in this metabolic pathway there is a group of enzymes and compounds that are strongly involved in the tricarboxylic acid cycle biological process and there is another group that is weakly involved in this process.
II/13

An integrative approach for biological data mining and visualisation 67
Figure 6 A zoom of a yeast metabolic pathway in the neighbourhood of tricarboxylic acid (TCA) cycle (GO:0006099). Proteins involved in the TCA cycle biological process are clustered near the TCA cycle Gene Ontology term
Figure 7 A Curvilinear Distance Analysis projection biasing tricarboxylci acid cycle. The projection was obtained by lowering the distance of all connected edges to TCA node (number 1) in the above graph
4.2 Protein neighbourhood search as a context dependent annotation
Assignment of protein function is a nontrivial task due to the fact that the same proteins may be involved in different biological processes, depending on the state of the biological system and protein localisation. Therefore, protein function is context dependent. Protein databases such as UniProt (Bairoch et al., 2005) contain information on protein function in text format. For example, PPAR gamma (UniProt id: P37231) is annotated as
II/14

68 P.V. Gopalacharyulu et al.
“Receptor that binds peroxisome proliferators such as hypolipidemic drugs and fatty acids. Once activated by a ligand, the receptor binds to a promoter element in the gene for acyl-CoA oxidase and activates its transcription. It therefore controls the peroxisomal beta-oxidation pathway of fatty acids. Key regulator of adipocyte differentiation and glucose homeostasis.” (http://www.expasy.org/cgi-bin/niceprot.pl?P37231)
Such information may not be satisfactory if interested in the role of this protein in context of specific disease (PPARγ is known to be involved in a variety of diseases, such as diabetes, osteoporosis, and cancer), tissue localisation (PPAR gamma actually has two main isoforms, 1 and 2, of which PPAR gamma 1 is expressed in all tissues, while PPAR gamma 2 is mainly expressed in adipose tissue; we have been recently involved in the characterisation of the latter (Medina-Gomez et al., 2005), or relationship with a specific group of proteins. We have previously proposed the network based approach to annotate proteins in context dependent manner by using the ‘protein neighbourhood search’ (Gopalacharyulu et al., 2005), i.e., exploring the local relationships of proteins with other biological entities such as proteins, genes, biological processes etc.
As an illustration of the utility of the approach, we queried a select set of proteins related to regulation of energy homeostasis and to insulin signalling. The following human proteins have been queried:
• Peroxisome proliferator activated receptor gamma (PPARγ; UniProt id: P37231)
• Peroxisome proliferator activated receptor alpha (PPARα; UniProt id: Q07869)
• Peroxisome proliferator activated receptor gamma coactivator 1 alpha (PGC1α; UniProt id: Q9UBK2)
• Sterol regulatory element binding protein 2 (SREBP – 2; UniProt id: Q12772)
• Putative G protein-coupled receptor GPR40 (GPR40; O14842)
• Putative G protein-coupled receptor GPR41 (GPR41; O14843)
• Probable G protein-coupled receptor GPR43 (GPR43; O15552).
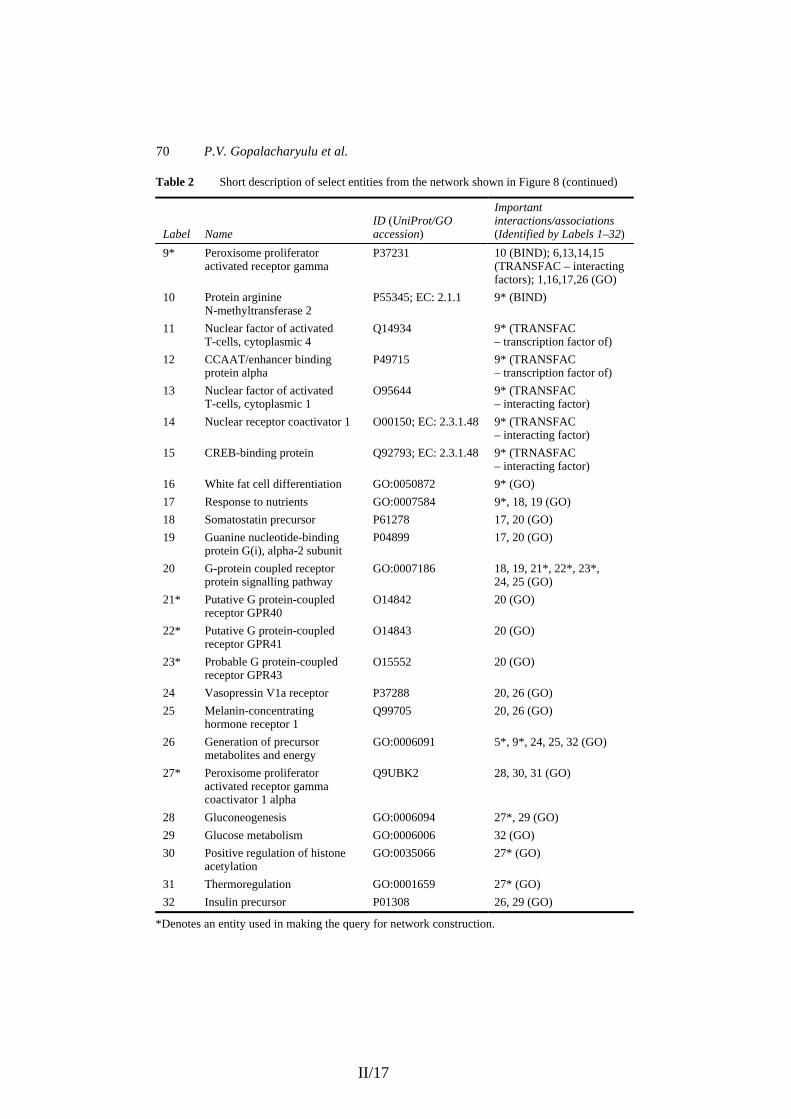
The resulting network is shown in Figure 8. Short descriptions of select entities in the network are presented in Table 2. While detailed study of the retrieved protein neighbourhood lies beyond the scope of this paper, we will show its use on one example. The entity numbered 10 (Protein arginine N-methyltransferase 2) does not have well assigned function. The UniProt resource lists the protein function as
“Probably methylates the guanidino nitrogens of arginyl residues in some proteins. May play a role in transcriptional coactivation.” (http://www. expasy.org/cgi-bin/niceprot.pl?P55345)
Our data suggests the protein is binding with PPARγ, and so may be related to regulation of energy homeostasis. This provides a hypothesis for designing new experiments to address the function of a protein that would have more likely escaped attention otherwise. The topic of transcriptional co-regulators involved in energy homeostasis is a topic of intense research in domains of diabetes and metabolic syndrome (Lin et al., 2005).
II/15

An integrative approach for biological data mining and visualisation 69
Figure 8 Query for proteins PPAR gamma, PPAR alpha, PGC1, SREBP 2, GPR40, GPR41, GPR43 in HUMANS. The numbered nodes are listed in Table 3. Grey lines are Gene Ontology relations, dark grey the regulatory networks, light grey the protein-protein interactions
Table 2 Short description of select entities from the network shown in Figure 8
Label Name ID (UniProt/GO accession)
Important interactions/associations (Identified by Labels 1–32)
1 Lipid metabolism GO:0006629 – 2* Sterol regulatory element
binding protein-2 (SREBP-2) Q12772 3, 4 (MINT); 1 (GO)
3 Transcription factor SP1 P08047 2* (MINT) 4 Hepatocyte nuclear factor 4
aplha P41235 2*(MINT); 1 (GO)
5* Peroxisome proliferator activated receptor alpha
Q07869 5* (BIND); 6, 7 (MINT); 1, 8, 26 (GO)
6 Retinoic acid receptor RXR – alpha
P19793 5 *(MINT); 9* (TRANSFAC – interacting factor)
7 Nuclear receptor corepressor 2 Q9Y618 5* (MINT) 8 Fatty acid metabolism GO:0006631 5* (GO)
II/16
70 P.V. Gopalacharyulu et al.
Table 2 Short description of select entities from the network shown in Figure 8 (continued)
Label Name ID (UniProt/GO accession)
Important interactions/associations (Identified by Labels 1–32)
9* Peroxisome proliferator activated receptor gamma
P37231 10 (BIND); 6,13,14,15 (TRANSFAC – interacting factors); 1,16,17,26 (GO)
10 Protein arginine N-methyltransferase 2
P55345; EC: 2.1.1 9* (BIND)
11 Nuclear factor of activated T-cells, cytoplasmic 4
Q14934 9* (TRANSFAC – transcription factor of)
12 CCAAT/enhancer binding protein alpha
P49715 9* (TRANSFAC – transcription factor of)
13 Nuclear factor of activated T-cells, cytoplasmic 1
O95644 9* (TRANSFAC – interacting factor)
14 Nuclear receptor coactivator 1 O00150; EC: 2.3.1.48 9* (TRANSFAC – interacting factor)
15 CREB-binding protein Q92793; EC: 2.3.1.48 9* (TRNASFAC – interacting factor)
16 White fat cell differentiation GO:0050872 9* (GO) 17 Response to nutrients GO:0007584 9*, 18, 19 (GO) 18 Somatostatin precursor P61278 17, 20 (GO) 19 Guanine nucleotide-binding
protein G(i), alpha-2 subunit P04899 17, 20 (GO)
20 G-protein coupled receptor protein signalling pathway
GO:0007186 18, 19, 21*, 22*, 23*, 24, 25 (GO)
21* Putative G protein-coupled receptor GPR40
O14842 20 (GO)
22* Putative G protein-coupled receptor GPR41
O14843 20 (GO)
23* Probable G protein-coupled receptor GPR43
O15552 20 (GO)
24 Vasopressin V1a receptor P37288 20, 26 (GO) 25 Melanin-concentrating
hormone receptor 1 Q99705 20, 26 (GO)
26 Generation of precursor metabolites and energy
GO:0006091 5*, 9*, 24, 25, 32 (GO)
27* Peroxisome proliferator activated receptor gamma coactivator 1 alpha
Q9UBK2 28, 30, 31 (GO)
28 Gluconeogenesis GO:0006094 27*, 29 (GO) 29 Glucose metabolism GO:0006006 32 (GO) 30 Positive regulation of histone
acetylation GO:0035066 27* (GO)
31 Thermoregulation GO:0001659 27* (GO) 32 Insulin precursor P01308 26, 29 (GO)
*Denotes an entity used in making the query for network construction.
II/17

An integrative approach for biological data mining and visualisation 71
Table 3 Short description of a few select entities from the network presented in Figure 6
Label Name/description ID (UniProt/GO accession/EC number)
1 tricarboxylic acid cycle GO:0006099 2 alpha-4-beta-4 subunit of mitochondrial isocitrate
dehydrogenase 1 P28834, 1.1.1.41
3 alpha-ketoglutarate dehydrogenase P20967, 1.2.4.2 4, 5 Aconitase, mitochondrial P19414, 4.2.1.3 6 NAD+-dependent isocitrate dehydrogenase P28241, 1.1.1.41 7 Mitochondrial isoform of citrate synthase P43635, 2.3.3.1 8 Fumarase; converts fumaric acid to L-malic acid in the TCA
cycle. The GI molecule identifier below refers to the protein encoded by this gene
P08417, 4.2.1.2
9 alpha subunit of succinyl-CoA ligase (synthetase; ATP-forming), a mitochondrial enzyme of the TCA cycle
P53598, 6.2.1.4
10 citrate synthase. Nuclear encoded mitochondrial protein P00890, 2.3.3.1 11 alpha-ketoglutarate dehydrogenase P20967, 1.2.4.2 12 dihydrolipoyl transsuccinylase component of
alpha-ketoglutarate dehydrogenase complex in mitochondria P19262, 2.3.1.61
4.3 Type 1 Diabetes gene expression data
The network edges drawn in previous examples were based on existing knowledge resources such as pathways and ontologies. However, the network representation affords extension to other relationships, such as gene sequence similarity or co-regulation of molecules based on profiling experiments (or collection of multiple experiments). The former may be particularly useful when building metabolic models of species with unannotated genomes based on the existing metabolic models from well annotated species. The latter may be utilised to interpret the data obtained from molecular profiling experiments. For example, applications have been reported linking the gene co-expression obtained from micro-array experiments to functional modules in cancer cells (Segal et al., 2004). We have previously utilised the correlation network approach to integrate across metabolite, protein, and gene level experimental profile data (Oresic et al., 2004).
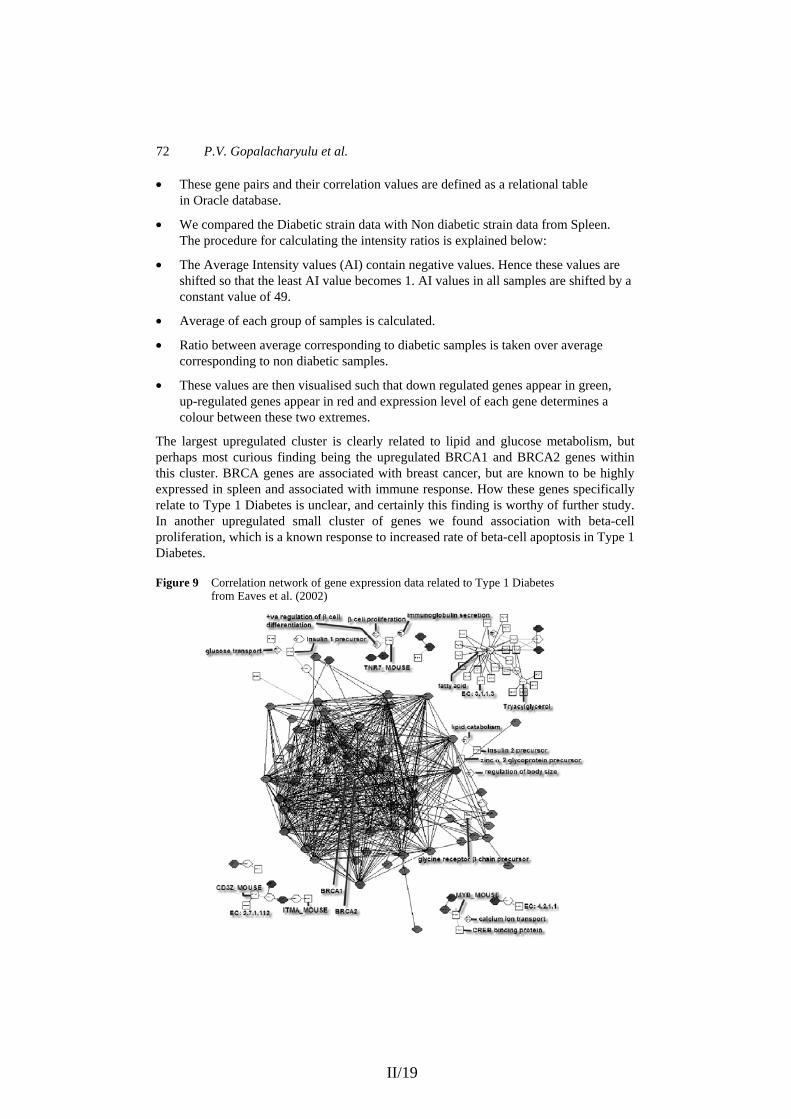
As an illustration of combining gene expression data with the existing pathways and ontologies, we utilised gene expression data from mouse congenic strains in a study related to Type 1 Diabetes (Eaves et al., 2002). We processed this data as explained below in order to construct the query. The resulting network is shown in Figure 9. Some relevant entities in network are indicated with their names. The gene expression data is incorporated as follows:
• Normalised dataset is downloaded from the NCI GEO database (www.ncbi.nlm.gov/geo). GEO accession number of the data is GDS10.
• Pearson correlation coefficients are calculated for every pair of genes.
• Based on distribution of correlation coefficients a cut-off correlation of 0.997 is set to select only highly correlated pairs (the cut-off can be varied as part of the exploratory analysis). One hundred and sixty six gene pairs pass this cut off.
II/18
72 P.V. Gopalacharyulu et al.
• These gene pairs and their correlation values are defined as a relational table in Oracle database.
• We compared the Diabetic strain data with Non diabetic strain data from Spleen. The procedure for calculating the intensity ratios is explained below:
• The Average Intensity values (AI) contain negative values. Hence these values are shifted so that the least AI value becomes 1. AI values in all samples are shifted by a constant value of 49.
• Average of each group of samples is calculated.
• Ratio between average corresponding to diabetic samples is taken over average corresponding to non diabetic samples.
• These values are then visualised such that down regulated genes appear in green, up-regulated genes appear in red and expression level of each gene determines a colour between these two extremes.
The largest upregulated cluster is clearly related to lipid and glucose metabolism, but perhaps most curious finding being the upregulated BRCA1 and BRCA2 genes within this cluster. BRCA genes are associated with breast cancer, but are known to be highly expressed in spleen and associated with immune response. How these genes specifically relate to Type 1 Diabetes is unclear, and certainly this finding is worthy of further study. In another upregulated small cluster of genes we found association with beta-cell proliferation, which is a known response to increased rate of beta-cell apoptosis in Type 1 Diabetes.
Figure 9 Correlation network of gene expression data related to Type 1 Diabetes from Eaves et al. (2002)
II/19

An integrative approach for biological data mining and visualisation 73
5 Discussion
In this paper we introduced an approach and a system which affords integration, mining, and visualisation of systems biology data. Three examples were given in domains of network topology studies, context-dependent protein annotation, and integration of gene co-expression data with available pathway knowledge. It is evident that the studies of complex organisms such as mammals, for example in the context of drug discovery, generate datasets representing physiological processes at multiple spatial and temporal levels. This necessitates the data integration solutions that facilitate mining of such diverse data (Gopalacharyulu et al., 2005; Oresic et al., 2004; van der Greef and McBurney, 2005; Searls, 2005). Depending on availability of data, this may include building associations and dependencies across biological entities, either based on available knowledge such as ontologies or on mathematical models. As we have shown in this paper, these two approaches are not mutually exclusive.
Our integration approach is based on the premise that relationships between biological entities can be represented as a complex network. The information in such networks forms a basis for exploratory mining, as well as for development of predictive models. Distances between different nodes in an integrated network play a central role. In order to calculate distances, one first needs to define distance measures across heterogeneous types of information. We are taking a pragmatic approach by letting the user define the distances as a part of the query. This is reasonable since the distance basically defines the context of the questions posed by the user and allows biasing the similarity toward particular types of relationships, or towards a relationship in a specific context. Once the distance measure is specified, we can map the nodes of the graph into a lower dimensional space. We introduced and implemented three methods to perform such mappings: Sammon’s mapping, CCA and CDA. As these mappings are approximate, there will be some distortion while doing the mapping. Therefore, in our opinion the exact form of distance measure is not a critical issue, as far as it underlines the relationships in the concept graph. In fact, selection of distance measure may reflect a subjective choice and as such will be subject to debate. It is ultimately the end result of mining that determines the utility of specific distance measure.
The three examples described in this paper demonstrate the utility of our approach. We show how the study of global network properties is facilitated using our approach. Similarly, the local properties of networks can be studied, as well as the properties of integrated networks (i.e., cross-talk between metabolism and cell signalling). Related to the second example, current annotation of proteins using e.g., Gene Ontology or UniProt do not take into account the complexity and context-dependency of protein function and interactions. We introduced a visual approach which enables context dependent interpretation. For example, in a query of six proteins related to energy homeostasis and insulin signalling we found a potential function for currently poorly annotated protein. We also extended the data integration framework to include experimental data. As a third example, we performed exploratory data analysis that linked clusters of gene expression profiles from spleen of NOD mouse model of Type 1 Diabetes to known interactions, regulatory pathways and ontologies related to the gene products within the clusters. While the ‘pathway analysis’ (Curtis et al., 2005) has already been widely utilised for analyses of gene expression data, our approach affords analysis across both physical interaction information (i.e., regulatory networks, protein-protein interactions, metabolic networks) as well as across known pathway annotations. As such it enables visual
II/20

74 P.V. Gopalacharyulu et al.
exploration of patterns found in data, facilitating to answer the first question any biologist is after when attempting to interpret high-dimensional micro-array data, i.e., what appears to be going on in the system based on the experimental evidence.
The pathway integration framework described in this paper is not limited only to the static biological pathways. Other models can be incorporated as well, as long as they are represented in the exchangeable schemas such as SBML or CellML. Our framework then affords further model refinement using interaction and ontology information from diverse sources. In addition, the metabolic models from well characterised species such as yeast (Förster et al., 2003) can be extended to less characterised related species. The data mining methods described in the paper are largely focused on integration across heterogeneous sources and mapping of complex networks into lower-dimensional space for the purpose of visualisation. What is needed is incorporation of more advanced data mining methods for statistical analysis and modelling of data. We believe the network framework opens new possibilities for analyses of complex heterogeneous life science data.
Currently our system is able to visualise data at molecular level. One of the remaining challenges would be to visualise multiple levels (Saraiya et al., 2005). This kind of approach would enable us to investigate how a small change at the molecular level affects the higher abstract level (e.g., tissue or organ level). Another appealing challenge would be to visualise biological networks in three dimensions (Changsu Lee and Park, 2002; Férey et al., 2005).
6 Conclusions
We presented an integrated database software system that enables retrieval and visualisation of biological relationships across heterogeneous data sources. We demonstrate the utility of our approach in three applications: full metabolic network retrieval with network topology study, exploration of properties and relationships of a specific set of proteins, and combined visualisation and exploration of gene expression data with related pathways and ontologies. We believe our approach facilitates discovery of novel or unexpected relationships, formulation of new hypotheses, design of experiments, data annotation, interpretation of new experimental data, and construction and validation of new network-based models of biological systems.
Acknowledgements
Matej Orešič was in part funded by Marie Curie International Reintegration Grant. The authors are thankful towards Teemu Kivioja, Laxman Yetukuri, and Jaakko Hollmén for helpful discussions during this work.
The authors Peddinti V. Gopalacharyulu and Erno Lindfors contributed equally to this work.
II/21

An integrative approach for biological data mining and visualisation 75
References Arita, M. (2004) ‘The metabolic world of Escherichia coli is not small’, Proc. Natl. Acad. Sci. USA,
Vol. 101, pp.1543–1547. Ashburner, M., Ball, C., Blake, J., Botstein, D., Butler, H., Cherry, J., Davis, A., Dolinski, K.,
Dwight, S. and Eppig, J. (2000) ‘Gene ontology: tool for the unification of biology’, Nat. Genet., Vol. 25, pp.25–29.
Bader, G.D., Betel, D. and Hogue, C.W.V. (2003) ‘BIND: the biomolecular interaction network database’, Nucl. Acids Res., Vol. 31, pp.248–250.
Bairoch, A., Apweiler, R., Wu, C.H., Barker, W.C., Boeckmann, B., Ferro, S., Gasteiger, E., Huang, H., Lopez, R., Magrane, M., Martin, M.J., Natale, D.A., O’Donovan, C., Redaschi, N. and Yeh, L-S.L. (2005) ‘The universal protein resource (UniProt)’, Nucl. Acids Res., Vol. 33, pp.D154–159.
Barabasi, A-L. and Oltvai, Z.N. (2004) ‘Network biology: understanding the cell’s functional organization’, Nat. Rev. Genet., Vol. 5, pp.101–113.
Bard, J.B.L. and Rhee, S.Y. (2004) ‘Ontologies in biology: design, applications and future challenges’, Nat. Rev. Genet., Vol. 5, pp.213–222.
Bodenreider, O. (2004) ‘The unified medical language system (UMLS): integrating biomedical terminology’, Nucl. Acids Res., Vol. 32, pp.D267–270.
Bollobás, B. (1998) Modern Graph Theory, Springer-Verlag, New York. Changsu Lee, J.P. and Park, J.C. (2002) ‘BiopathwayBuilder: nested 3D visualization system for
complex molecular interactions’, Genome Informatics, Vol. 13, pp.447, 448. Chung, S.Y. and Wong, L. (1999) ‘Kleisli: a new tool for data integration in biology’,
Trends Biotechnol., Vol. 17, pp.351–355. Critchlow, T., Fidelis, K., Ganesh, M., Musick, R. and Slezak, T. (2000) ‘DataFoundry:
information management for scientific data’, IEEE Trans. Inf. Technol. Biomed., Vol. 4, pp.52–57.
Curtis, K., Oresic, M. and Vidal-Puig, A. (2005) ‘Pathways to analysis of microarray data’, Trends Biotechnol, Vol. 8, pp.429–435.
Dahlquist, K.D., Karen Vranizan, N.S., Lawlor, S.C. and Conklin, B.R. (2002) ‘GenMAPP, a new tool for viewing and analyzing microarray data on biological pathways’, Nature Genetics, Vol. 31, pp.19, 20.
Davidson, S.B., Overton, C.G., Tannen, V. and Wong, L. (1997) ‘BioKleisli: a digital library for biomedical researchers’, Int. J. on Digital Libraries, Vol. 1, pp.36–53.
Demartines, P. and Hérault, J. (1997) ‘Curvilinear component analysis: a self-organizing neural network for nonlinear mapping of data sets’, IEEE Trans. Neur. Netw., Vol. 8, pp.148–154.
Dijkstra, E. (1959) Numerische Mathematik, Vol. 1, pp.269–271. Dorogovtsev, S.N. and Mendes, J.F.F. (2003) Evolution of Networks from Biological Nets to the
Internet and WWW, Oxford University Press, Oxford, UK. Eaves, I.A., Wicker, L.S., Ghandour, G., Lyons, P.A., Peterson, L.B., Todd, J.A. and Glynne, R.J.
(2002) ‘Combining mouse congenic strains and microarray gene expression analyses to study a complex trait: the NOD model of Type 1 diabetes’, Genome Research, pp.232–243.
Etzold, T. and Argos, P. (1993) ‘SRS – an indexing and retrieval tool for flat file data libraries’, CABIOS, Vol. 9, pp.49–57.
Etzold, T., Ulyanov, A. and Argos, P. (1996) ‘SRS: information retrieval system for molecular biology data banks’, Meth. Enzymology, pp.114–128.
Férey, N., Hérisson, P.E.G.J. and Gherbi, R. (2005) ‘Visual data mining of genomic databases by immersive graph-based exploration’, 3rd International Conference on Computer Graphics and Interactive Techniques in Australasia and South East Asia (Dunedin, New Zealand, November 29–December 02, 2005), GRAPHITE ‘05, ACM Press, New York, NY, pp.143–146.
II/22

76 P.V. Gopalacharyulu et al.
Förster, J., Famili, I., Fu, P., Palsson, B.O. and Nielsen, J. (2003) ‘Genome-scale reconstruction of the Saccharomyces cerevisiae metabolic network’, Genome Res., Vol. 13, pp.244–253.
Gärdenfors, P. (2000) Conceptual Spaces: The Geometry of Thought, MIT Press, Cambridge, MA. Gene Ontology Consortium (2000) ‘Gene ontology: tool for the unification of biology’, Nature
Genetics, Vol. 25, pp.25–29. Gopalacharyulu, P.V., Lindfors, E., Bounsaythip, C., Kivioja, T., Yetukuri, L., Hollmen, J. and
Oresic, M. (2005) ‘Data integration and visualization system for enabling conceptual biology’, Bioinformatics, Vol. 21, pp.i177–185.
Gopalacharyulu, P.V., Lindfors, E., Bounsaythip, C., Wefelmeyer, W. and Oresic, M. (2004) ‘Ontology based data integration and context-based mining for life sciences’, W3C Workshop on Semantic Web for Life Sciences, Cambridge, MA.
Goto, S., Okuno, Y., Hattori, M., Nishioka, T. and Kanehisa, M. (2002) ‘LIGAND: database of chemical compounds and reactions in biological pathways’, Nucl. Acids Res., Vol. 30, pp.402–404.
Guimera, R. and Amaral, L.A.N. (2005) ‘Functional cartography of complex metabolic networks’, Nature, Vol. 433, pp.895–900.
Han, J.D., Bertin, N., Hao, T., Goldberg, D.S., Berriz, G.F., Zhang, L.V., Dupuy, D., Walhout, A.J., Cusick, M.E., Roth, F.P. and Vidal, M. (2004) ‘Evidence for dynamically organized modularity in the yeast protein-protein interaction net-work’, Nature, Vol. 430, pp.88–93.
Hass, L.M., Schwartz, P.M. and Kodali, P. (2001) ‘DiscoveryLink: a system for integrated access to life science data sources’, IBM Systems Journal, Vol. 40, pp.489–511.
Herman, I., Melancon, G. and Marshall, M.S. (2000) ‘Graph visualization and navigation in information visualization: a survey’, IEEE CS Society, Vol. 6, pp.24–43.
Hermjakob, H., Montecchi-Palazzi, L., Lewington, C., Mudali, S., Kerrien, S., Orchard, S., Vingron, M., Roechert, B., Roepstorff, P., Valencia, A., Margalit, H., Armstrong, J., Bairoch, A., Cesareni, G., Sherman, D. and Apweiler, R. (2004) ‘IntAct: an open source molecular interaction database’, Nucl. Acids Res., Vol. 32, pp.D452–455.
Ideker, T., Galitski, T. and Hood, L. (2001) ‘A new approach to decoding life: systems biology’, Annu. Rev. Genomics Hum. Genet., Vol. 2, pp.343–372.
Jeong, H., Tombor, B., Albert, R., Oltvai, Z.N. and Barabási, A-L. (2000) ‘The large-scale organization of metabolic networks’, Nature, Vol. 407, pp.651–654.
Jeong, H., Mason, S.P., Barabási, A-L. and Oltvai, Z.N. (2001) ‘Lethality and centrality in protein networks’, Nature, Vol. 411, pp.41, 42.
Kanehisa, M., Goto, S., Kawashima, S., Okuno, Y. and Hattori, M. (2004) ‘The KEGG resource for deciphering the genome’, Nucl. Acids Res., Vol. 32, pp.D277–280.
Kitano, H. (2002) ‘Systems biology: a brief overview’, Science, Vol. 295, pp.1662–1664. Krull, M., Voss, N., Choi, C., Pistor, S., Potapov, A. and Wingender, E. (2003) ‘TRANSPATH: an
integrated database on signal transduction and a tool for array analysis’, Nucl. Acids Res., Vol. 31, pp.97–100.
Lee, J.A., Lendasse, A. and Verleysen, M. (2004a) ‘Nonlinear projection with curvilinear distances: isomap versus curvilinear distance analysis’, Neurocomputing, Vol. 57, pp.49–76.
Lee, S.G., Hur, J.U. and Kim, Y.S. (2004b) ‘A graph-theoretic modeling on GO space for biological interpretation of gene clusters’, Bioinformatics, Vol. 20, pp.381–388.
Lin, J., Handschin, C. and Spiegelman, B.M. (2005) ‘Metabolic control through the PGC-1 family of transcription coactivators’, Cell Metab., Vol. 1, pp.361–370.
Luscombe, N.M., Madan Babu, M., Yu, H., Snyder, M., Teichmann, S.A. and Gerstein, M. (2004) Genomic Analysis of Regulatory Network Dynamics Reveals Large Topological Changes, Vol. 431, pp.308–312.
II/23

An integrative approach for biological data mining and visualisation 77
Matys, V., Fricke, E., Geffers, R., Gossling, E., Haubrock, M., Hehl, R., Hornischer, K., Karas, D., Kel, A.E., Kel-Margoulis, O.V., Kloos, D-U., Land, S., Lewicki-Potapov, B., Michael, H., Munch, R., Reuter, I., Rotert, S., Saxel, H., Scheer, M., Thiele, S. and Wingender, E. (2003) ‘TRANSFAC: transcriptional regulation, from patterns to profiles’, Nucl. Acids Res., Vol. 31, pp.374–378.
Medina-Gomez, G., Virtue, S., Lelliott, C., Boiani, R., Campbell, M., Christodoulides, C., Perrin, C., Jimenez-Linan, M., Blount, M., Dixon, J., Zahn, D., Thresher, R.R., Aparicio, S., Carlton, M., Colledge, W.H., Kettunen, M.I., Seppanen-Laakso, T., Sethi, J.K., O’Rahilly, S., Brindle, K., Cinti, S., Oresic, M., Burcelin, R. and Vidal-Puig, A. (2005) ‘The link between nutritional status and insulin sensitivity is dependent on the adipocyte-specific Peroxisome Proliferator-Activated Receptor-{gamma}2 isoform’, Diabetes, Vol. 54, pp.1706–1716.
Oresic, M., Clish, C.B., Davidov, E.J., Verheij, E., Vogels, J.T.W.E., Havekes, L.M., Neumann, E., Adourian, A., Naylor, S., van der Greef, J. and Plasterer, T. (2004) ‘Phenotype characterization using integrated gene transcript, protein and metabolite profiling’, Appl. Bioinformatics, Vol. 3, pp.205–217.
Ravasz, E. and Barabási, A-L. (2003) ‘Hierarchical organization in complex networks’, Physical Review, Vol. 67, pp.1–7.
Sammon Jr., J.W. (1969) ‘A nonlinear mapping for data structure analysis’, IEEE Trans. Comp., Vol. C-18, pp.401–409.
Saraiya, P., North, C. and Duca, K. (2005) ‘Visualization for biological pathways: requirements analysis, systems evaluation and research agenda’, IEEE Trans. Vis. Comput. Graph., Vol. 11, pp.443–456.
Searls, D.B. (2005) ‘Data integration: challenges for drug discovery’, Nat. Rev. Drug Disc., Vol. 4, pp.45–48.
Segal, E., Friedman, N., Koller, D. and Regev, A. (2004) ‘A module map showing conditional activity of expression modules in cancer’, Nat. Genetics, Vol. 36, pp.1090–1098.
Shannon, P.M.A., Ozier, O., Baliga, N.S., Wang, J.T., Ramage, D., Amin, N., Schwikowski, B. and Ideker, T. (2003) ‘Cytoscape: a software environment for integrated models of biomolecular interaction networksar interactions’, Genome Research, Vol. 3, pp.2498–2504.
van der Greef, J. and McBurney, R. (2005) ‘Rescuing drug discovery: in vivo systems pathology and systems pharmacology’, Nat. Rev. Drug Disc., Vol. 4, pp.961–967.
Zanzoni, A., Montecchi-Palazzi, L., Quondam, M., Ausiello, G., Helmer-Citterich, M. and Cesareni, G. (2002) ‘MINT: a molecular INTeraction database’, FEBS Lett., Vol. 513, pp.135–140.
Website NCBI PubChem, http://pubchem.ncbi.nlm.nih.gov/.
II/24