an interactive large scale graphing environmenttpeterka/523/projectreport.pdfmany math students...
TRANSCRIPT

ClassCoords
ClassCoords
An Interactive Large Scale Graphing Environment
UIC CS523 Term Project
Author: Tom Peterka

ClassCoords
Project Contents
1. Final report
2. Teacher materials supplement
3. CD
4. Web site
http://www.cs.uic.edu/~tpeterka/523/index.htm

ClassCoords
Final Report
0. Introduction0.1 Abstract0.2 Background0.3 Goals0.4 Learning standards0.5 Student prerequisites
1. Brief system overview1.1 Introduction1.2 Usage1.3 Hardware
2. Instructional unit2.1 Teacher's and students' roles2.2 Classroom arrangement2.3 Brief description2.4 Opening Activity: Find the mall2.5 Timeline2.6 Presentation of introductory concepts2.7 Worksheet2.8 Maze game2.9 Quiz #12.10 Data collection2.11 Graphing data points2.12 Graph analysis2.13 Reflection2.14 Quiz #22.15 Where do we go from here?2.16 General assessment strategy
3. Detailed system description3.1 System description3.2 Block diagram3.3 Simulation3.4 Other suggested uses and instructional topics3.5 Estimated feasibility, cost and market demand
4. Conclusion4.1 Summary4.2 Suggestions and future work
5. Acknowledgements and references5.1 Acknowledgements5.2 References

ClassCoords
0. Introduction
0.1 Abstract
ClassCoords, an interactive multimedia learning environment to help middleschool mathematics students visualize and immerse themselves in a two-dimensional Cartesian coordinate system is proposed. Many math studentslearn the algorithms for graphing without a sound understanding and visualizationof coordinate systems; this often becomes evident only later when they move tohigher dimensional spaces. We propose a system to display a coordinate planeonto a fairly large area of the classroom floor, and allow students to walk in it andplot points via a hand-held tracked device. To demonstrate the effectiveness ofthe system, a sample instructional unit is included with the design, which focuseson introductory graphing concepts and graphing of measured experimental data.The learning activity is supported both by Illinois learning standards as well asthe standards of the National Council of Teachers of Mathematics (NCTM), andcomes complete with teacher materials, including assessments. The system willbe simulated through an application which will be projected via a common PCprojector, but without real-time tracking. Finally, feasibility, cost and marketanalysis is briefly discussed, as well as ideas for other instructional units thatcould be taught using the system.
0.2 Background
0.2.1 Cognitive theory
The following is a brief listing of some of the cognitive theory guiding principlesthat form a foundation for the design of the system and the accompanyinginstructional unit.
Learner centered design [Soloway, 1994]
What interactive learning environment would be complete without citing ElliotSoloway's landmark paper on learner centered design(LCD)? ClassCoordsapplies Soloway's four principles of LCD as follows:
• understandingClassCoords is an engaging large-scale system that promotes understanding byimmersing students in the problem space. The sample instructional unit hasactivities that specifically were designed to promote conceptual understanding ofimportant concepts through tangible problems, rather than "burying" studentswith abstractions, formulas, or "number-crunching".• motivationThe instructional unit's opening activities are designed with motivation in mind;the primary goals are to capture students' interest and demonstrate the need forcoordinate systems.• diversityDiversity is incorporated in the instructional unit rather than in the system itself.A variety of activities are designed: written, oral discussion, active participation,

ClassCoords
group and individual. The accompanying grading rubric also distributes thegrading among the various activities, accommodating a variety of learning styles.• growthThe simulated application provides only minimal non-fading scaffolds so far, andmuch more needs to be done in this area. However, in general the systemaffords room for growth by its applicability to a variety of lessons and units, bothin mathematics and science. Some of these are listed in the detailed systemdescription.
Inquiry based learning [Edelson, 1998]
The instructional unit was designed to approximately match Edelson's 3-stepmodel of inquiry based learning. However, like Edelson's "Create-A-World"activity, the correlation between steps and activities can sometimes be a bitblurred.
• motivateThe opening two activities are designed to match the first step of Edelson'sinquiry based learning model. The goal is to capture students' attention,demonstrate relevance, spark interest or curiosity, and create a place, or"handle" in their knowledge structure for the new unit.• acquireThe acquisition of knowledge roughly occurs during the middle portion of the unit,as students gather experimental data and plot it. Also, a good deal ofbackground information is taught conventionally by the teacher, which studentsacquire by listening and taking notes.• refineStudents refine their knowledge by exploring, applying, and reflecting accordingto Edelson. This roughly occurs in the middle and end of the unit as data isgraphed and linear relationships are explored. Opportunities for reflection existthroughout the unit.
How Students Learn [Pellegrino, 2002]
Several of Pellegrino's ideas are incorporated into the design of ClassCoords.
• facts within structured frameworkThe instructional unit is structured so that activities are performed within acontext. For example, background and relevancy are stressed before anygraphing is actually done. Graphing of linear data is done in the context ofexperimentation. At the end of the unit, other types of non-linear graphs arebriefly explored. In this way, "placeholders" are created within a framework, anddetails are stored in their "place".• teaching depth over breadthThe instructional unit originally included linear equations, their properties, and thecorrelation between geometric and algebraic representation. However, the studyof linear equations is quite involved, and would have required a more superficialcoverage of all the sub-topics. This was not desired, so linear equations were

ClassCoords
deferred and introductory concepts are covered in more depth instead. In thisway the focus remains on conceptual understanding and visualization.• variety of learning strategiesA variety of activities are included with the unit, utilizing a variety of learningstrategies. In this way we hope to reach the maximum number of learners andlearning styles.• assessment centeredAssessments are built into the sample unit throughout, rather than one large unittest at the end.• community centeredClassCoords affords collaboration because of its large scale. The entireclassroom becomes a community of learners, and can also be divided intosmaller groups.• reflectionThe system and accompanying instructional unit afford many opportunities forreflection through discussion, in-class demonstration of problem solutions, andworksheets.
0.2.2 Current tools for teaching graphing
• paper and pencil, chalkboard, overhead transparencies, etc.
These are the traditional lecture / presentation materials for the teacher astransmitter model. While appropriate for many situations, the problem is whentraditional technology is used exclusively and all other methods are ignored.
• graphing calculator
This is a handheld calculator with graphic ability and graphing softwareapplications. ClassCoords is essentially a large-scale introductory graphingcalculator, large enough for people to walk around in, with a direct tracked

ClassCoords
interface. Like ClassCoords, the graphing calculator is only a tool, and is only asuseful as the learning activity with which it is used. The graphing calculator is anon-collaborative tool, used from roughly 7th grade through high school, and ismost effective in high school levels where advanced features are maximized.Ideally, students should progress in graphing technology from ClassCoords tographing calculators.
• geoboardThis is a manipulative for graphing polygons, consisting of pegs for vertices andrubber bands for edges. It is useful for hands-on activities, not restricted tographing, but has limited resolution. Its use is predominantly in earlierelementary grades.
• masking tape or erasable marker on the floor, or seats used as coordinatelocations
These are also examples of tools which are similar to ClassCoords, where thegoal is large-scale immersion into the coordinate system. The coordinate systemcovers a sizeable portion of the classroom floor, and the differences lie in themethod of marking the grid. (In the case of students' seats as point locations,students would typically stand in order to represent a point which is to bemarked.)
0.3 Goals
Project assignment
To design a multimedia interactive learning environment for some problemdomain with K-12 education using non-traditional technology (ie, interface shouldnot be the typical desktop computer). The product should include both adescription of the proposed system along with a description of an instructionalunit using the system.
Problem statement
To design an interactive multimedia learning environment to help 6th and 7thgrade math students visualize a two-dimensional coordinate system and use thesystem to graph experimental data points.
0.4 Learning standards

ClassCoords
The following are standards that apply only to the instructional unit describedbelow. The system can be used with other instructional units to satisfy otherstandards.
0.4.1 Illinois Learning Standards
Principles
The Illinois Learning Standards list several principles that are common to allcurricula. ClassCoords along with the proposed learning activity satisfy thefollowing:
• Application of learning• Solving problems• Communicating• Using Technology• Working on Teams• Making connections
Standards
The following are the applicable individual Illinois math standards.
State goal 8: Use algebraic and analytical methods to identify and describepatterns and relationships in data, solve problems, and predict results.B. Interpret and describe numerical relationships using tables, graphs andsymbols8.B.3 Use graphing technology and algebraic methods to analyze and predictlinear relationships and make generalizations from linear patterns
State goal 10: Collect, organize, and analyze data using statistical methods;predict results; and interpret uncertainty using concepts of probability.A. Organize, describe and make predictions from existing data.10.A.3a Construct, read and interpret tables, graphs (including circle graphs) andcharts to organize and represent dataB. Formulate questions, design data collection methods, gather and analyze dataand communicate findings10.B.3 Formulate questions (e.g., relationships between car age and mileage,average incomes and years of schooling), devise and conduct experiments orsimulations, gather data, draw conclusions and communicate results to anaudience using traditional methods and contemporary technologies.
0.4.2 NCTM Standards
The National Council of Teachers of Mathematics (NCTM) also have a set ofprinciples which are common to all their standards. The following technologyprinciple is satisfied:
Technology Principle

ClassCoords
"Students can learn more mathematics more deeply with the appropriate andresponsible use of technology. They can make and test conjectures. They canwork at higher levels of generalization or abstraction... Technology cannotreplace the mathematics teacher, nor can it be used as a replacement for basicunderstandings and intuitions. The teacher must make prudent decisions aboutwhen and how to use technology and should ensure that the technology isenhancing students' mathematical thinking”
The following are the applicable NCTM math standards:
Standards for grades 6-8"...students will learn significant amounts of algebra and geometry throughoutgrades 6, 7, and 8. Moreover, they will see algebra and geometry asinterconnected with each other... They will have experience with both thegeometric representation of algebraic ideas, such as visual models of algebraicidentities, and the algebraic representation of geometric ideas, such as equationsfor lines represented on coordinate grids. ... They also will relate algebraic andgeometric ideas to other topics—for example, ...when they represent anapproximate line of fit for a scatterplot both geometrically and algebraically"
Algebra• identify functions as linear or nonlinear and contrast their properties from
tables, graphs, or equations.• use graphs to analyze the nature of changes in quantities in linear
relationships
Geometry• precisely describe, classify, and understand relationships among types of
two- and three-dimensional objects using their defining properties;• use coordinate geometry to represent and examine the properties of
geometric shapes;• use visual tools such as networks to represent and solve problems;• use geometric models to represent and explain numerical and algebraic
relationships;
Representation• create and use representations to organize, record, and communicate
mathematical ideas;• select, apply, and translate among mathematical representations to solve
problems;• use representations to model and interpret physical, social, and mathematical
phenomena.
0.5 Student prerequisites
Integer and fractional arithmetic, ie, familiarity with positive and negative wholenumbers and fractions and arithmetic operations on them is assumed. No priorexperience with graphs or graphing is assumed.

ClassCoords
1. Brief System Overview
1.1 Introduction
Students are immersed in a two-dimensional coordinate system that is displayedon a large portion of the classroom floor. Initial approximations indicate a 9' x 12'display. Practically any lesson in number sense, algebra, geometry, or dataanalysis that can profit from a visual representation would benefit this tool. Forexample, points can be located, distances measured, experimental data plotted,simple relations and functions investigated, geometric definitions can be studied,and linear transformations can be performed. Although the system is ideal for alarge number of math and science topics, one particular math instructionalactivity is included with the system to demonstrate its viability.
1.2 Usage
A bright neon-colored sphere ("the ball") resembling a billiard ball with controlbuttons, is the primary interface. The ball would be carried to the desiredlocation and an "enter" button would be pressed to enter the current point ontothe grid. The ball is tracked via an optical position tracking system, so that its 2dposition within the coordinate system is always known. The current position isdisplayed in real-time on the floor as the ball is being moved, so the user alwaysknows where the current position is and can make adjustments accordingly. Thesystem and ball are linked via a wireless connection. Certain control functionssuch as reading/writing graph files, system setup and initialization, etc. areperformed from a control "console", which is simply a typical desktop PCinterface (display, keyboard, mouse) running an application program with theusual GUI interface elements. Typically only the teacher would interact with the"console".
1.3 Hardware
The system is controlled by a Windows Pentium-class PC. A single projector isthe display medium, and the projector will be biased toward the front of thedisplay area, so that shadows are thrown behind a user, rather than directlyunder him. An overhead camera provides optical tracking of the ball, and awireless mouse inside the ball notifies the PC application that the user has"entered" a coordinate point. See section 3 for a complete description of thesystem.

ClassCoords
2. Instructional Unit
The following is a description of a sample instructional unit using ClassCoords.Complete materials for the unit can be found in the teacher materialssupplement.
2.1 Teacher's and students' roles
The ClassCoords system is a tool for teachers and students to visualizecoordinate systems, similar to the blackboard or overhead projector. The maindifference between the system and other more traditional tools is the ability forteacher and students to immerse themselves in the coordinate plane, due to thesize and location of the display and the real time tracking mechanism. Theteacher's role as instructor and facilitator has not changed with this system,however. Hopefully the teacher will be comfortable with the direct interface to thesystem, and will welcome the system as another tool to help make mathematicsless abstract and more tangible.
Students hopefully will also have a positive experience with the system. Itaffords a large-scale graphical aid, as well as the opportunity to get out of theirseats and walk around within the display. The direct interface should be easy forstudents to learn to operate. The instructional unit provides an opportunity forindividual, small group, and whole class work. There are also a variety ofopportunities for students and groups to demonstrate their solutions in classusing the system, as well as more traditional paper and pencil problem solving.Therefore, students will have the opportunity to use a variety of methods in avariety of settings to grasp coordinate system graphing concepts.
2.2 Classroom arrangement
Prior to beginning, the chairs in the classroom should be arranged around 3sides of the classroom periphery, leaving the center area open for the display ofthe coordinate system. The instructor should expect and encourage action withinthe classroom, ie, students getting up and walking around within the displayspace, discussing their observations, etc (in an orderly fashion of course). Thesystem and instructional unit afford an engaging and active classroom setting.There are also parts of the lesson which need to be taught more traditionally,with the instructor presenting necessary background information. At these times,the teacher will demonstrate concepts using the system and/or other tools in amore common "lecture" mode.
2.3 Brief description
The instructional unit consists of three main phases. First, two opening activitiesare performed design to "hook" students' curiosity and help them realize the needfor coordinate systems. Then a data collection activity follows, which includesgraphing of the resulting data points using the system. Finally, a data analysisphase follows, which focuses on high-level conceptual properties of linear

ClassCoords
relationships. Best-fit lines are constructed though the students' data points, andproperties such as linearity, increasing and decreasing (positive and negativeslope) are discussed at a conceptual graphical level. This conceptual"introduction" to linear relationships will serve as a precursor to the algebraicstudy of linear equations which students will encounter in the following years.Optionally, students will interpolate previously unmeasured data pointsgraphically and then experimentally verify their accuracy. To conclude, studentswill be introduced briefly to some non-linear relationships, in order to frame theirlearning in a larger context. Each of the three phases will take approximatelyone week, and the entire unit is estimated to take three weeks. It is geared for5th, 6th, or 7th grades, or roughly middle school (although the term "middleschool" is subject to debate), but the exact scheduling is up to local schooldiscretion.
2.4 Opening Activity: Find the mall
The class will be divided into 3 teams, and each team will be further divided intotwo halves, writers and readers. The readers of each team will be outside in thehall for a few minutes, while the writers remain in the room. For each of the 3teams, the location of a mall will be displayed on the floor using the classcoordinates system. The writers will have a few minutes to write downinstructions (form included) to explain to their readers the location of the point.Then the point will disappear, and the readers will rejoin the class, try to followtheir group's instructions, and locate the mystery point. Each team will have thesame problem to solve, but under different circumstances: the first will locate themall on the floor with no grid and no reference point. The second will locate thepoint with a reference point in the center (the location of the school) and a set ofaxes. The third will locate the mall with a reference point and a rectangular grid.
The entire class will regroup and discuss their findings, and a reflection sheet willbe filled out. The teacher will explain that the activity was not a contest, but wasmeant to demonstrate that a coordinate system is helpful for describing locations.In fact, this is the entire motivation for using a coordinate system; locations arevery difficult to describe without one. The mall metaphor will lead in to a briefdiscussion of Rene Descartes, who is said to have discovered the Cartesiancoordinate system while lying ill in his bed. As he lay, he watched a fly on theceiling and described its position by counting the lines formed by intersectingrectangular ceiling tiles.
The goals of the opening activity are:
ReneDescartes
ClassCoords
• create need for information
Students should want to learn about graphing in a Cartesian coordinate systembecause it can be used as a tool to solve problems such as the navigationexercises demonstrated above. However, they should realize that coordinatesystems have a structure, language, and rules that need to be mastered in orderto be able to use them.
• demonstrate relevance
Being able to give and follow navigational directions is something students canrelate to (especially to the mall). They should see that a frame of reference (eg acoordinate system) is useful for finding one's way around.
• generate curiosity
The opening activities should be fun and engaging in order to spark students'curiosity. Motivation is a major factor here, and can affect the outcome of thefollowing weeks of work.
2.5 Timeline
In order for students to use metacognitive thinking, ie, monitor and reflect on theirown learning, they need a bird's-eye-view of what they have done, are currentlydoing, and will be doing. The timeline (included) will be projected periodicallyshowing the entire graphing unit and the current status. The teacher shoulddisplay this at the start of each class or at the start or end of each activity, andindicate what the class has accomplished, the current status, and what is comingup.
2.6 Presentation of introductory concepts
The teacher will demonstrate the following concepts with the system bydisplaying a ready-made example coordinate system on the floor (included). Theteacher will point out the key elements below while walking around in thecoordinate system.
• x-y axes, Cartesian coordinates, rectangular coordinates• labeling• origin• positive and negative x,y directions• quadrants• coordinate naming, ordered pairs• domain and range, independent and dependent variable
2.7 Worksheet

ClassCoords
This is a homework assignment to review these key concepts (included); classwill be notified to be sure to complete it, not only for a grade but also for theopportunity to use ClassCoords system the next day (motivation). The class willreview the completed worksheets the following day; volunteers will be able todemonstrate their answers in ClassCoords. This will also serve as anintroduction to students' use of the system. Teacher will demonstrate key usageconcepts, and students will have the chance to plot points from their completedworksheets.
2.8 Maze game
For homework, students will be given a worksheet showing a maze on acoordinate system, and will be asked to generate a path of (x,y) points in order tosuccessfully complete the maze. The following day, several students candemonstrate their solutions using the ClassCoords.
2.9 Quiz #1
An in-class quiz will be performed to assess students grasp of concepts so far.Concepts may be reviewed and reinforced at the teacher's discretion based onresults.
2.10 Data collection
The second main phase of the graphing unit consists of gathering experimentaldata to be used in the last phase, data analysis. In order to make the lessonmore tangible for students, they will collect real data, as opposed to sample dataprovided from a textbook or worksheet. They will work collaboratively, and havea choice of simple experiments to perform. They will record their data in formsthat are provided in the teacher materials. All experiments are designed toproduce linear results, however actual results may vary due to inaccuracies.These will be discussed during the data analysis phase.
Teams of 3 students will be formed, either voluntarily, randomly, or assigned bythe teacher (one team may have 2 or 4 students). Each team will perform oneexperiment from the suggested list below. Experiments are to be done in class,and do not require a dedicated laboratory or any prerequisite science concepts.
Not all need to be performed; teachers may use their discretion based onavailability of materials, etc. More than one group can perform the sameexperiment, or alternatively the entire class can perform the same. Hopefullythere are enough ideas here for the teacher to exercise his/her own judgement.See the teacher materials for detailed descriptions of the following:
• #1: volume vs. height for water in a graduated cylinder• #2: diameter vs. perimeter for round objects• #3: Fahrenheit vs. Celsius temperature of various objects• #4: spring balance extension vs. number of marbles• #5: distance vs. time for battery operated toy

ClassCoords
• #6: distance traveled vs. starting height for a toy car released from an incline• #7: mass vs volume of water• #8: mass in ounces vs. mass in grams of various objects• #9: length vs. #pennies for small nails
A data entry form is included, which has room to describe the experimenttextually and graphically, and a table to enter data values.
2.11 Graphing data points
Data values will be graphed in ClassCoords by each group in turn, and stored bythe teacher as computer files for future reference.
2.12 Graph analysis
The following properties are discussed using the students' graphs as examples:• increasing / decreasing• linearity• steep / gradual slope• passing through origin (simplification of intercepts)
2.13 Reflection
The steps of the process which were performed in this part of the unit areabstracted as:• experiment• collect• analyzeAnalysis of other sample data sets is done with a worksheet.
2.14 Quiz #2
An in-class quiz covering new concepts is included.
2.15 Where do we go from here?
The following topics are optional, but recommended if time permits.
• Experimental validation of interpolation and extrapolation
Time permitting, students will re-group into their experiment groups, and taketurns finding interpolated / extrapolated points using ClassCoords. They then willre-construct their experiment and attempt to test the accuracy of these points.
• non-linear relationships

ClassCoords
Several examples of non-linear graphs are included to provide some context andhelp students build a larger conceptual framework for their graphing knowledge.Also, hopefully their interest to learn more will be stimulated.
2.16 General assessment strategy
Assessment was designed into the unit and runs throughout, as is evidenced bythe large number of worksheets, quizzes, etc. The assessment strategy is todevelop a portfolio for each student for this project, consisting of several smallsnapshots of their progress as opposed to one all-or-nothing grade. See thegrading rubric for an outline of the assessment items.

ClassCoords
3. Detailed System Description
3.1 System description
3.1.1 Computer
A Standard PC Pentium-class desktop computer running Windows 98 or later isutilized. Graphics acceleration is not mandatory because the 2d display graphicsare not hardware intensive. A small number of objects (less than 100 points,lines, and text labels) are produced per frame. Other more demanding graphicsfeatures such as polygons, shading, texturing, etc. are not used for this simpleapplication.
More demands are placed on the system by the tracking unit, which requiresCPU computational power and memory to be able to recognize the ball locationquickly enough to produce graphics frames at an acceptable rate during the timethat the ball is in motion. The goal is to reduce lag time between the user movingthe ball and the display being refreshed, and this will primarily depend on thecomputation of the ball coordinates from camera input. No prototype systemexists yet, so exact system requirements are not known, but an initial guess is touse the current state-of-the-art PC configuration, such as a 1.5 GHz Pentium IVwith 512 MB RAM.
The camera input for the tracking system will be a "FireWire" bus, so a Firewireadapter card will need to be included.
3.1.2 Tracking system
Optical tracking is used because of its low cost and the low-resolutionrequirements of the system. A camera is mounted directly over the center of thedisplay area, and is connected to the PC via a IEEE 1394 FireWire connection.The FireWire bandwidth is 400 Mbps, or nearly 20 frames per second at 800x600resolution. The camera is constantly photographing the display space, andsending .jpg images to the PC. A typical firewire camera with 1280x1024resolution and firewire PC adapter card costs approximately $1700.[www.edmundoptics.com]
ClassCoords
The "ball" is a bright neon color that hopefully does not appear anywhere else inthe display space. For example, no student should be wearing that color.Pattern recognition software is used to detect the pixels in the .jpg imagescorresponding to the ball color and to scale and translate those pixel coordinatesinto graphing space coordinates. The image analysis is a demanding process,and will likely be the determining factor in the amount of "lag" between themovement of the ball and the updating of the image. According to Greg Dawe ofEVL, a group of graduate students are currently working on this application, andhave just recently begun to get the efficiency close to a "usable" range. We areassuming that with continued increase in computing power and continuedprogress in software, this tracking method will work dependably in the near future(1 year). The advantage is the low cost, as opposed to wireless electromagnetictracking systems that can cost from $50,000 on up. [ascension-tech.com]
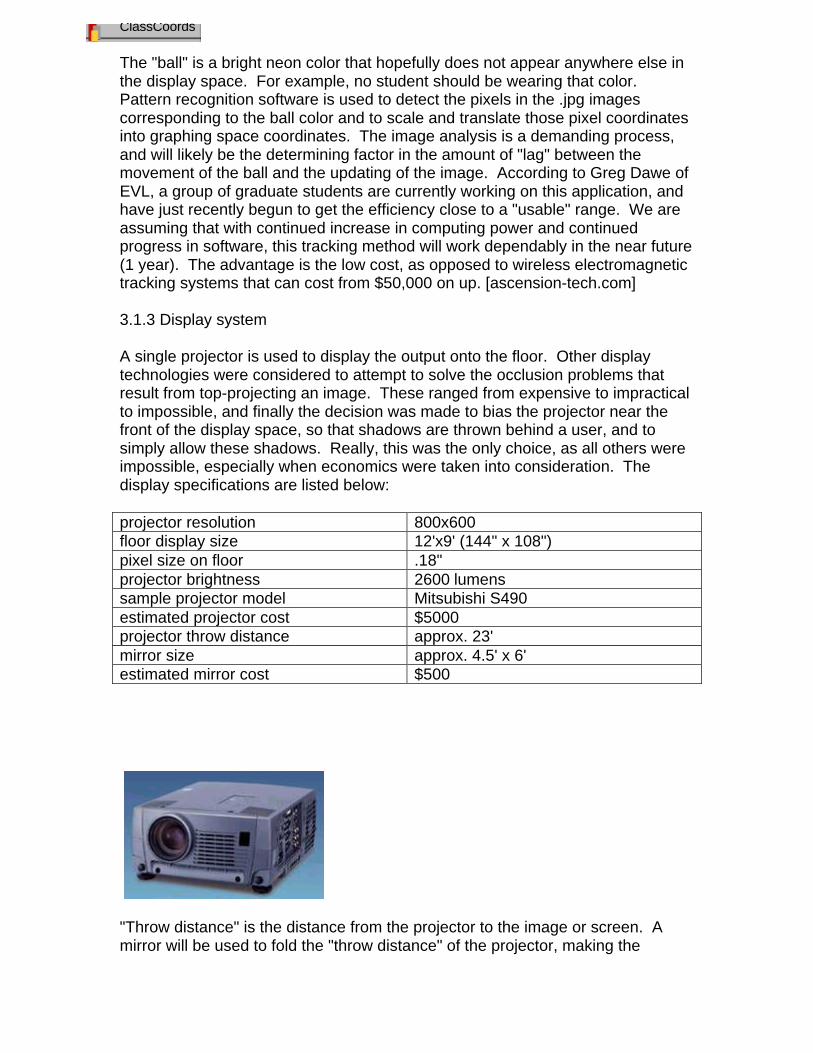
3.1.3 Display system
A single projector is used to display the output onto the floor. Other displaytechnologies were considered to attempt to solve the occlusion problems thatresult from top-projecting an image. These ranged from expensive to impracticalto impossible, and finally the decision was made to bias the projector near thefront of the display space, so that shadows are thrown behind a user, and tosimply allow these shadows. Really, this was the only choice, as all others wereimpossible, especially when economics were taken into consideration. Thedisplay specifications are listed below:
projector resolution 800x600floor display size 12'x9' (144" x 108")pixel size on floor .18"projector brightness 2600 lumenssample projector model Mitsubishi S490estimated projector cost $5000projector throw distance approx. 23'mirror size approx. 4.5' x 6'estimated mirror cost $500
"Throw distance" is the distance from the projector to the image or screen. Amirror will be used to fold the "throw distance" of the projector, making the

ClassCoords
required floor to ceiling height approx. 11', which can be accommodated in aclassroom with some modifications, which are discussed below. The requiredsize of the mirror is given in the table above.
3.1.4 Input system
The "ball" has a 3d radio wireless mouse inside of it, and the "enter" button onthe ball actuates the mouse button. In this way, a common stock component isused, and the ball is just a cover for the mouse. The reason why the ball isnecessary at all is to provide a brightly colored target for the tracking camera.Positional input from the mouse is ignored, as it is taken from the tracking systeminstead, and only the event of the mouse button being pressed is used. Thewireless mouse has a base station connected to the PC's mouse port. In a quickreview of available products, we have found mice with a range of 5 meters, orabout 15 feet, for about $50. This range is almost enough, as the PC is probablylocated off in the corner of the room, but let us assume other slightly longer rangeproducts are available. A range of 25-30 ft. would be ideal. Some modification tothe housing of the mouse will be necessary to fit into the ball. The total cost ofthe ball and mouse inside is estimated to be $200.
3.1.5 Room requirements
• room size and layout
Assuming a typical classroom size of approximately 20' x 30' and a ceiling heightof 10', the room could be arranged as follows:

ClassCoords
A side view using a typical ceiling height of 10 feet is shown below:
As seen above, modifications need to be made to the floor and ceiling to housethe projector and mirror. These are needed to achieve an approximate 11' throwdistance from the projector to the center of the mirror. Of course, a taller ceilingheight would help, but we used 10' as a typical ceiling. (Classrooms with lowerceilings would require even more modification.) The dimensions given above arevery rough, based on projector specifications, but without doing detailedcalculations. We are estimating carpentry to cost $10,000, but this may varydepending on the original construction and ease of creating the requiredrecessed areas.
• lighting
9x12 display area
student desks
teacher'sdesk
projector
30'
20'
projector
1-1/2' recess in floor
10' ceiling
mirror
2-1/2' recess in ceiling

ClassCoords
Ambient lighting needs to be dim to avoid "washing out" the projected image.Typically classrooms have florescent lighting which cannot be dimmed. Thesolution is to re-wire the room lights for several zones on several switches, sothat only a few lights in the student seating areas are on while ClassCoords is inuse. In this way, the projection area is dimly lit, while there is still some ambientlight for students to read or take notes.
• floor material
A white, flat (non-glossy) floor surface is ideal, but not usually found in aclassroom. Glossy tile or carpet is the norm. We did not spend much effortresearching floor finishes, but at least should point out that flooring needs to beconsidered. An example of a low-cost solution is a portable mat that can berolled up and stored when not needed, or even large white paper that can bedisposed of.
All together, we are budgeting $15,000 for the total cost of room modifications.(carpentry, electrical, floor covering)
3.2 Block diagram
The following is a diagram of the entire system:
Main
Imagedetection
OpenGLrendering
Applicationprogram
PC
FireWireadapter card
PS/2 mouseport
Video card
Mouse basestation
CameraProjector
Ball/ 3dmouse
imageprojectionimage
capture
mousebuttonpressed
radio signal

ClassCoords
3.3 Simulation
The enclosed CD contains an application to simulate ClassCoords. It can run onany PC (Win98 or newer). Tracking is not simulated; mouse input is usedinstead. Also included is complete source code in C++/OpenGL, a readme filewith installation and execution details, and sample graph files for the instructionalunit. See the CD for complete details.
3.4 Other suggested uses and instructional topics
The following is a brief list of other mathematics topics that would be enhancedthrough the use of ClassCoords.
statistics
• scatterplots• mean, median, mode, range• quartiles, inter-quartile range
geometry
• parallel, perpendicular, intersecting lines• angles, triangles, right triangles• circles and simple polygons• linear transformations - scaling, rotation, translation• other coordinate systems - polar coordinates
algebra
• relations and functions• higher degree functions (eg quadratic, conic sections)• systems of equations• inequalities
3.5 Estimated feasibility, cost and market demand
A formal market analysis is beyond the scope of this project, so the following isbased on only the feedback we received from the two math teachers and severalstudents we interviewed, and our own expectations. We believe ClassCoords isa viable project that will prove useful. Graphing is an abstract concept, andClassCoords makes it more tangible by providing a large-scale immersive model.The students and teachers we talked to were excited about the system. The nextmarketing step would be to secure the interest of school administrators andschool boards, ie., the decision-makers responsible for purchasing ClassCoords.
We believe there will be significant demand for the product, and have madedesign decisions to keep the cost within reach of a school's technology budget.The project is feasible and relies solely on technology that is currently available

ClassCoords
or very near-term, primarily using stock components which can be purchased"off-the-shelf" from any number of suppliers. Estimated costs are outlined below:
Item Cost $projector 5000mirror 500camera 1700ball / 3d mouse 200room renovation 15000PC 1500Miscellaneous 1100Grand total 25000
So, in our estimation, the system can be deployed in a typical classroom forapproximately $25,000. Of this total, the system cost is $10,000 and roomrenovations account for the remaining $15,000. These numbers are within therealm of many schools' annual technology budgets, especially considering thatrenovation dollars usually are drawn from a separate fund than technologydollars.

ClassCoords
4. Conclusion
4.1 Summary
We have presented a detailed design for ClassCoords, a large-scale floor-displayimmersive coordinate system. What started as a vague idea has evolved into acomplete design package including relevant background and learning standards,sample instructional unit, and system specifications. The instructional unit is anintroduction to graphing in a Cartesian coordinate system, containing engagingactivities based on modern cognitive theories. In fact, the entire premise of thesystem is to engage learners by immersing them in the coordinate space.
Another feature of the instructional unit is its high-level, introductory, conceptualnature. This is also intentional. Originally, we began designing a unit for 8thgraders, complete with algebraic linear equations, etc., but decided to move itahead one or two grade levels (6th or 7th grade) and make it more introductory innature. Too often students are overwhelmed by complex graphing tasks whenthey have not mastered graphing fundamentals. This was another main premiseof this project: The first step in learning graphing is to develop a visualization ofthe coordinate system. At the end we do introduce some more difficult graphanalysis concepts such as best-fit line, slope and intercept (at a conceptual levelonly). Not all students may grasp these immediately, but there will be ampleopportunities to study these in later grades. At least students are being exposedto these concepts at this early stage, so they will not be seeing them for the firsttime in later grade levels when they can be developed more analytically.
Finally, we provided a fairly detailed high-level system description andspecifications. This includes cost estimates, which are affordable for tworeasons. First, we use stock hardware components that are readily available andaffordable. Second, we made explicit decisions along the way to chooseaffordable solutions to problems, even if we had to trade-off some features. Forexample, it would have been ideal to have a display completely free fromocclusions. However, the costs would have been staggering, so we opted for asingle projector and a shadow cast behind the user where we deemed it wouldnot be objectionable. The choice of a low-cost camera-based tracking systemvs. a high-cost electromagnetic tracking system was made for similar reasons.Our thinking is that an affordable, if not perfect, system was still better than nosystem at all, because a high price tag has been the end of many a good idea.
4.2 Suggestions and future work
To date, most of the work on this project has been design, theory, andsimulation. The next logical steps are to build and test a prototype system.Hardware components need to be procured, telemetry calculations need to bedone more meticulously, and the components need to be installed in a realclassroom. The simulation, which will evolve into the actual application, needsimprovement in the user interface and in functionality. The tracking systemneeds to be developed, primarily the 2d image recognition software, and then it

ClassCoords
needs to be integrated into the application. Testing and evaluation will alsobecome a major part of the project. Classroom usage will be videotaped andevaluated, interviews conducted, and modifications made based on the results.Clearly, a lot of work remains.
A few practical suggestions have evolved during the course of the project, buthave not been implemented due to time constraints. The following is a "do-list"of those items.• The aspect ratio of the simulation was originally 1:1. However, since most
projectors have an aspect ratio of 4:3, the application should be re-sized tothese proportions.
• The present color scheme for the simulation is dark colors on a whitebackground. The reason for this is to be able to economically print the finalproject report and lesson plans on paper. However, for classroom projection,light colors on a black background are better to minimize reflection andprevent "washing out" of the image.
• More scaffolding and examples of a few difficult concepts in the lesson plans,especially domain, range, independent and dependent variables. Thesesuggestions were provided by Daniel Moll, an elementary mathematicsteacher who reviewed the lesson plans and provided comments (seeacknowledgements). I took some of these math concepts for granted andexpected one or two simple exercises to adequately cover them. Mr. Moll'scommentary is based on over 25 years of math teaching experience, and hemade many constructive suggestions for which I am grateful. Some of thesmaller ones were implemented in time, but some of these larger changes willrequire more re-organization of the lesson plans than time will allow. Weleave them as future work.

ClassCoords
5. Acknowledgements and References
5.1 Acknowledgements
I would like to thank the following individuals for their help and advice.
Daniel Moll (jr. high mathematics teacher, Hillside School District 93, Hillside IL)for his review of the project report and lesson plans and for his thoughtfulcomments and suggestions. Melinda Peterka (4th and 5th grade giftededucation mathematics and science teacher, Americana School, Queen BeeSchool District 16, Glendale Heights IL) for her input throughout the course of theproject. Prof. Tom Moher (University of Illinois at Chicago UIC) for his guidanceto help narrow the project down to a workable scope. Greg Dawe (ElectronicsVisualization Lab EVL at UIC) for taking time out of his busy schedule to discusshardware considerations of the project and for suggesting hardware solutionsthat are practical and affordable.
5.2 References
Learning standards
• Illinois learning standardshttp://www.isbe.state.il.us/ils/Default.htm
• NCTM standardshttp://www.nctm.org/standards
Teaching graphing
• Teaching graphing in middle school mathhttp://www.middleweb.com/Graphing.html
• Math Forum - Ask Dr. Mathhttp://mathforum.org/dr.math/problems/bridge3.29.96.html
• E-Example 6.2.1 Learning about Rate of Change in Linear Functionshttp://standards.nctm.org/document/eexamples/chap6/6.2/index.htm
• NCTM Illuminations Cartesian Graphinghttp://illuminations.nctm.org/lessonplans/6-8/cartesian/
• The Math Forum - Math Library - Graphing of Datahttp://mathforum.org/library/topics/graphing_data/
Cognitive theory
• James Pellegrino, Understanding How Students Learn and Inferring WhatThey Know: Implications for the Design of Curriculum, Instruction, andAssessment, Paper presented at NSF Instructional Materials DevelomentConference, February 2002.
• Elliot Soloway , Mark Guzdial , Kenneth E. Hay, Learner-centered design,interactions, v.1 n.2, p.36-48, April 1994.

ClassCoords
• Edelson, D. (1998). Matching the Design of Activities to the Affordances ofSoftware to Support Inquiry-Based Learning. Proceedings of ICLS 98:International Conference on the Learning Sciences, Atlanga, GA, December1998.
Math textbooks
• Collins, W. et. al. (1998). Mathematics: Applications and Connections, Course3. New York, NY: Glencoe / McGraw-Hill. (7th grade math textbook used atHillside School District 93)
• Collins, W. et. al. (1998). Algebra 1. New York, NY: Glencoe / McGraw-Hill.(8th grade math textbook used at Hillside School District 93)
Hardware
• http://www.usnews.com/usnews/nycu/tech/articles/011224/24display.htm• http://www.ascension-tech.com• http://www.edmundoptics.com• http://www.projectorcentral.com• http://www.gamenationtv.com/hardware/mouse.shtml