an intermodal network model of coal shipments in the u.s. · an intermodal network model of coal...
TRANSCRIPT

An Intermodal Network Model of Coal Shipments in the U.S.
Benjamin Blandford PhD Candidate
University of Kentucky Kentucky Transportation Center [email protected]
859-257-7504
Kentucky
Transportation
Center www.ktc.uky.edu

Kentucky
Transportation
Center www.ktc.uky.edu
Presentation Overview
• Integrated Freight Network Model
• Application of model for coal shipments
• Coal shipments at the national level
• Coal and the Ohio River Basin
How does the movement of coal to, from or within the Ohio River basin fit into the larger national picture of coal production
and consumption?
Kentucky
Transportation
Center www.ktc.uky.edu
Integrated Freight Network Model
• Incorporates three modes of travel • Roadways • Railways • Waterways
• Intermodal Points • Ports • Intermodal facilities • Rail switchyards
• Network attributes (impedances) enable model to optimize routing for shippers across all three modes

Kentucky
Transportation
Center www.ktc.uky.edu
What is not yet included?
• Capacity constraints on corridors and nodes
• Speed
• Travel time
• Weight or cargo restrictions
• Characteristics of haul • Railcar/barge/truck types
• Unit train? Backhaul possibilities?

Kentucky
Transportation
Center www.ktc.uky.edu
Shipping Rates
• Detailed shipping rates not available
• A number of possibilities to estimate or model shipping rates for different modes
• Order of magnitude used to supply generic rate information
• Barge = 1 x distance
• Rail = 3 x distance
• Truck = 6 x distance
Kentucky
Transportation
Center www.ktc.uky.edu
Modeling freight data: Coal
• Energy Information Administration (www.eia.gov) • Publishes annual data on movement of energy sources
domestically in the US (coal, petroleum, natural gas)
• For coal, data includes • Origin (mine) • Destination (power plant) • Mode (rail, water, road, conveyor) • Volume
• Network models optimal routing of coal from origin (generalized to county centroids) to destination (power plants), as described by the EIA data
• Coal volumes aggregated along network segments for analysis

Kentucky
Transportation
Center www.ktc.uky.edu
Coal, statistically
• In 2011, 1.1 billion tons of coal were produced in the U.S.
• 88,000 employees, 1,300 coal mines, 24 states • Total value of coal production at $45 billion • 90% of coal produced in the US is consumed
domestically (electricity, industry), 10% exported • 10 million tons of coal also imported (about 1% of
total US consumption) • Coal is the leading fuel source for generation of
electricity in the US, accounting for over 40% of total grid

Kentucky
Transportation
Center www.ktc.uky.edu
Coal production in the US, 2010
Powder River Basin
Uinta Basin
Illinois Basin
Southern Appalachian Basin
Central Appalachian Basin
Northern Appalachian Basin

Kentucky
Transportation
Center www.ktc.uky.edu
Coal consumption in the US, 2010
Kentucky
Transportation
Center www.ktc.uky.edu
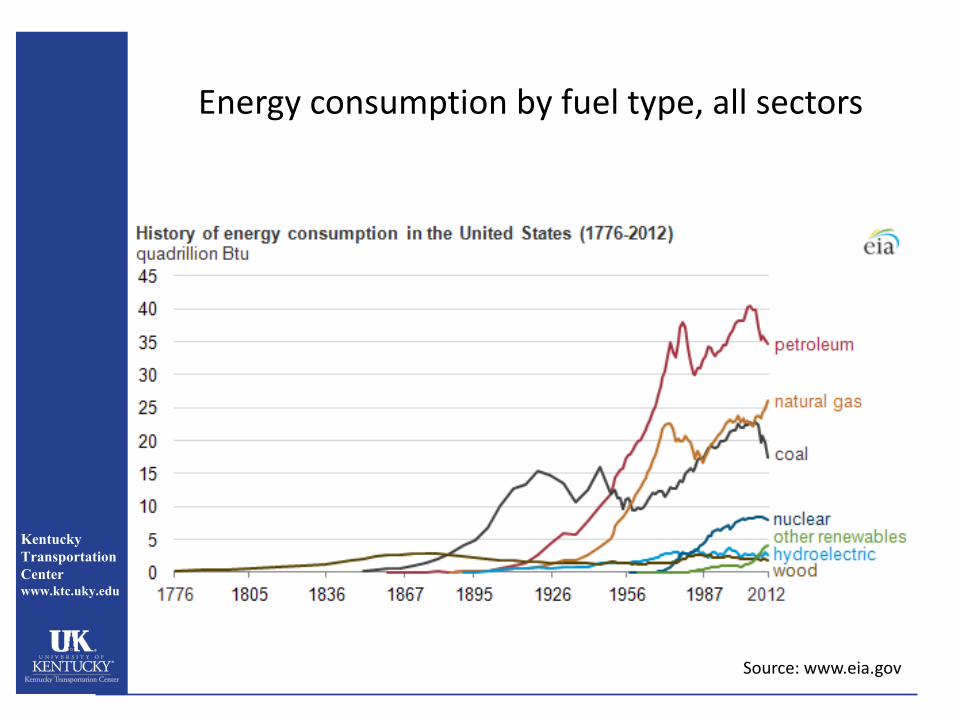
Energy consumption by fuel type, all sectors
Source: www.eia.gov
Kentucky
Transportation
Center www.ktc.uky.edu
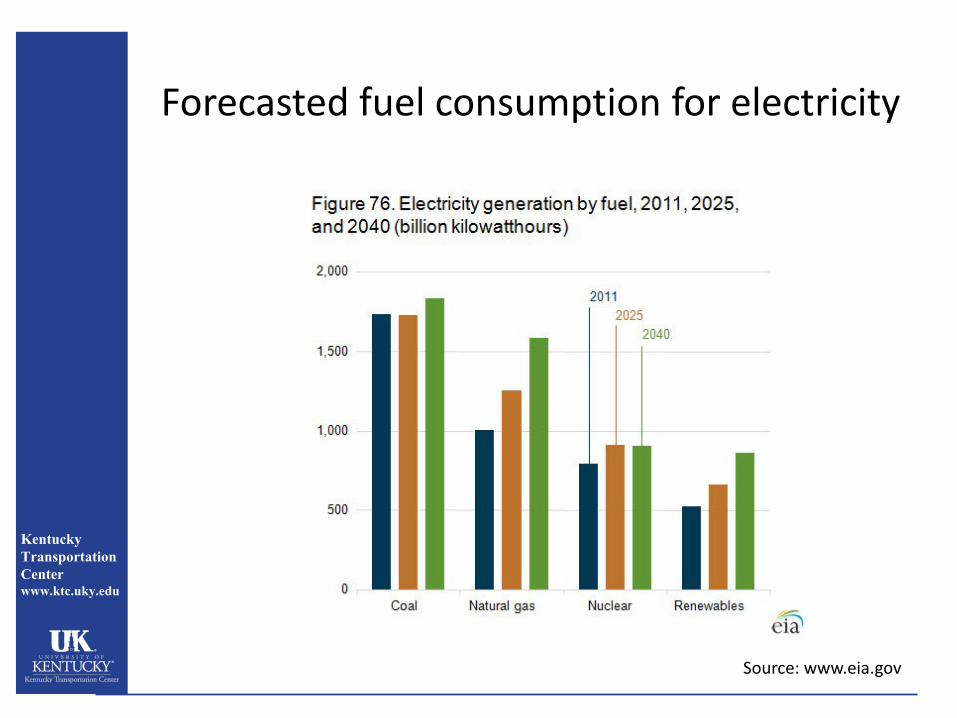
Forecasted fuel consumption for electricity
Source: www.eia.gov

Kentucky
Transportation
Center www.ktc.uky.edu
Coal exports
Source: www.eia.gov
Kentucky
Transportation
Center www.ktc.uky.edu
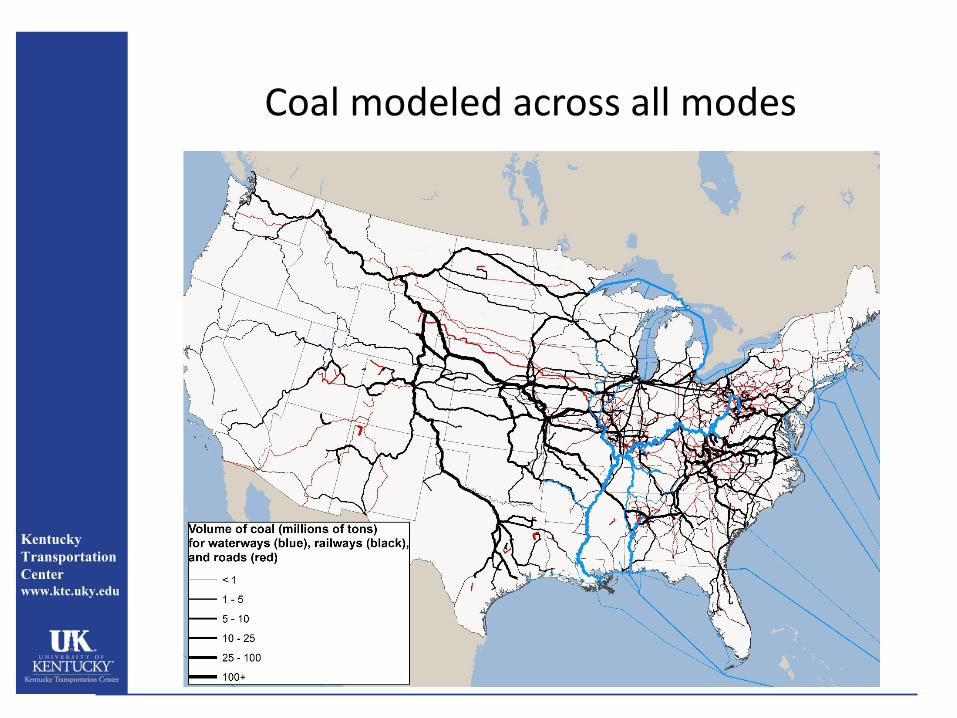
Coal modeled across all modes

Kentucky
Transportation
Center www.ktc.uky.edu
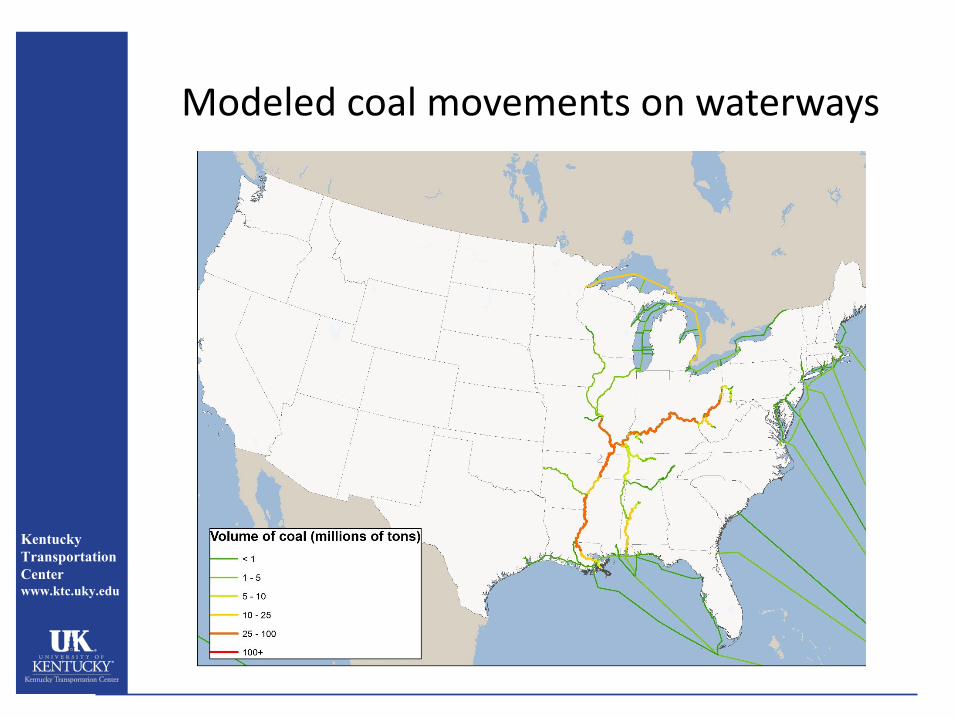
Coal transportation: Waterways
• Coal is 2nd leading ton-mile commodity (just behind petroleum) for the barge industry
• In 2009, coal accounted for 24% (volume) of all commodities shipped on the inland waterways
• Of domestic coal shipments, 11% were at least partly on inland waterways • Share of coal shipments is larger when
including imports and exports
Kentucky
Transportation
Center www.ktc.uky.edu
Modeled coal movements on waterways
Kentucky
Transportation
Center www.ktc.uky.edu
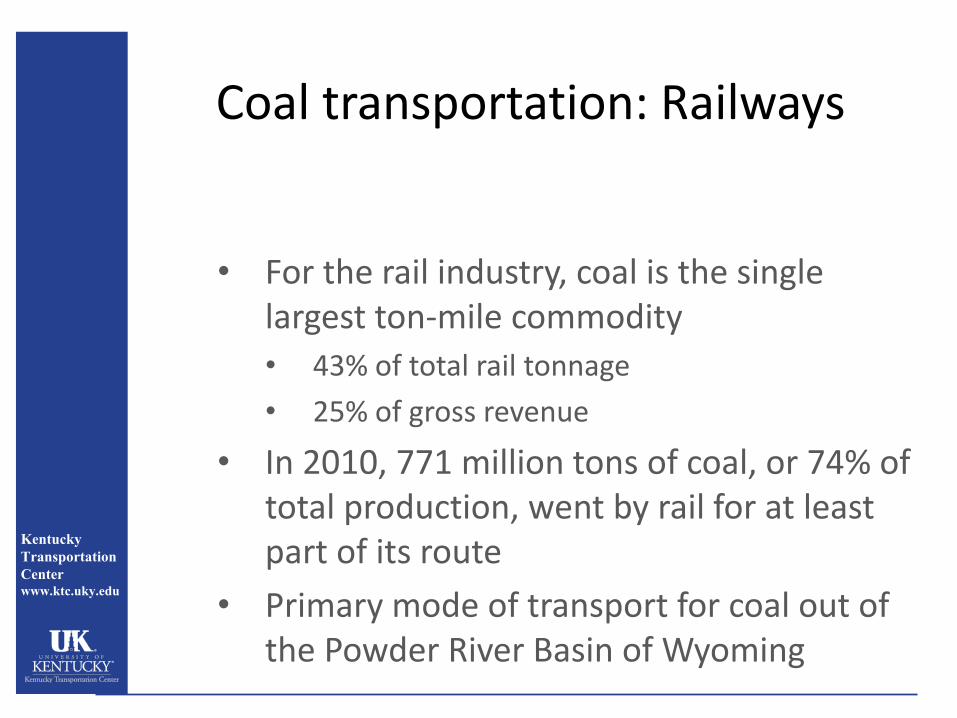
Coal transportation: Railways
• For the rail industry, coal is the single largest ton-mile commodity
• 43% of total rail tonnage
• 25% of gross revenue
• In 2010, 771 million tons of coal, or 74% of total production, went by rail for at least part of its route
• Primary mode of transport for coal out of the Powder River Basin of Wyoming

Kentucky
Transportation
Center www.ktc.uky.edu
Modeled coal movements on railways
Kentucky
Transportation
Center www.ktc.uky.edu
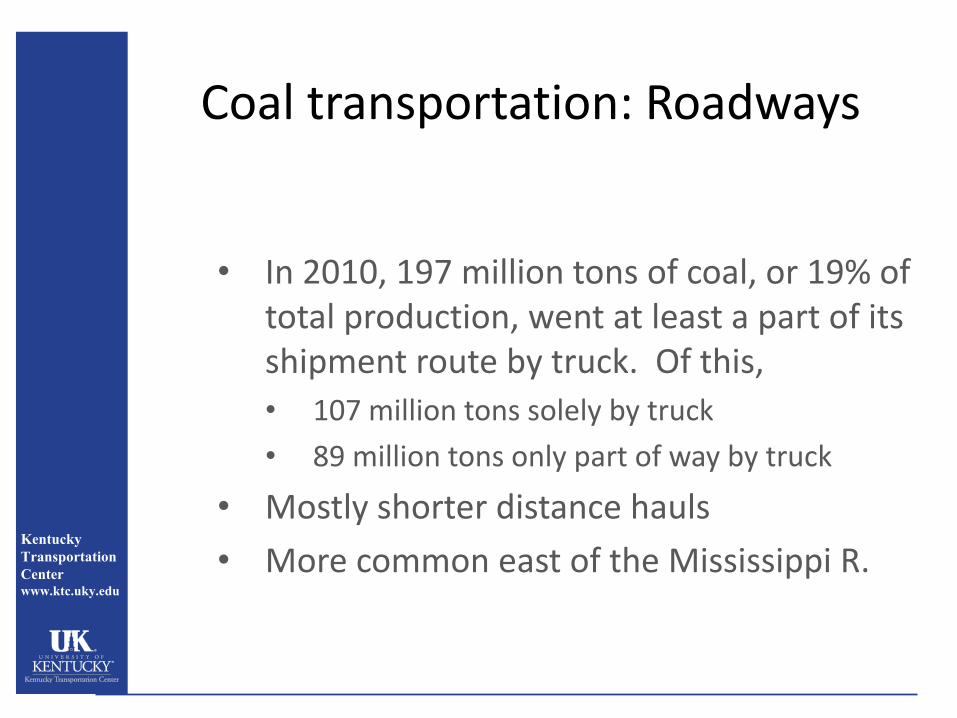
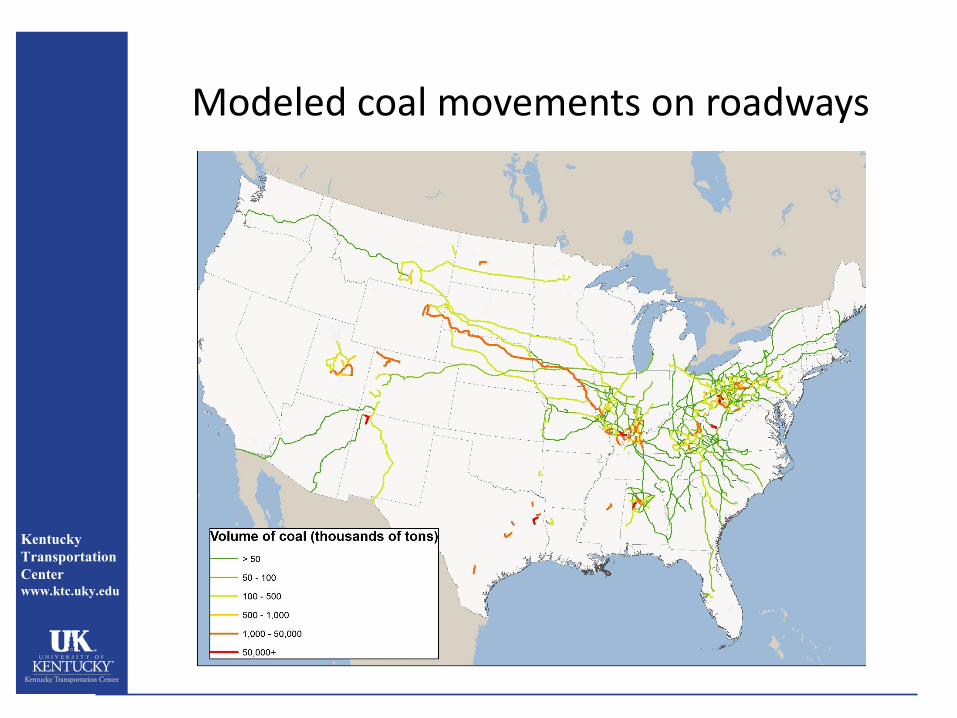
Coal transportation: Roadways
• In 2010, 197 million tons of coal, or 19% of total production, went at least a part of its shipment route by truck. Of this,
• 107 million tons solely by truck
• 89 million tons only part of way by truck
• Mostly shorter distance hauls
• More common east of the Mississippi R.
Kentucky
Transportation
Center www.ktc.uky.edu
Modeled coal movements on roadways

Kentucky
Transportation
Center www.ktc.uky.edu
Modal comparison for hauling coal
Source: US Army Corps of Engineers, Great Lakes and Ohio River Basin Navigation Systems Commerce Report, 2008

Kentucky
Transportation
Center www.ktc.uky.edu
Modeled coal movements from the Powder River Basin
462 million tons produced
Kentucky
Transportation
Center www.ktc.uky.edu
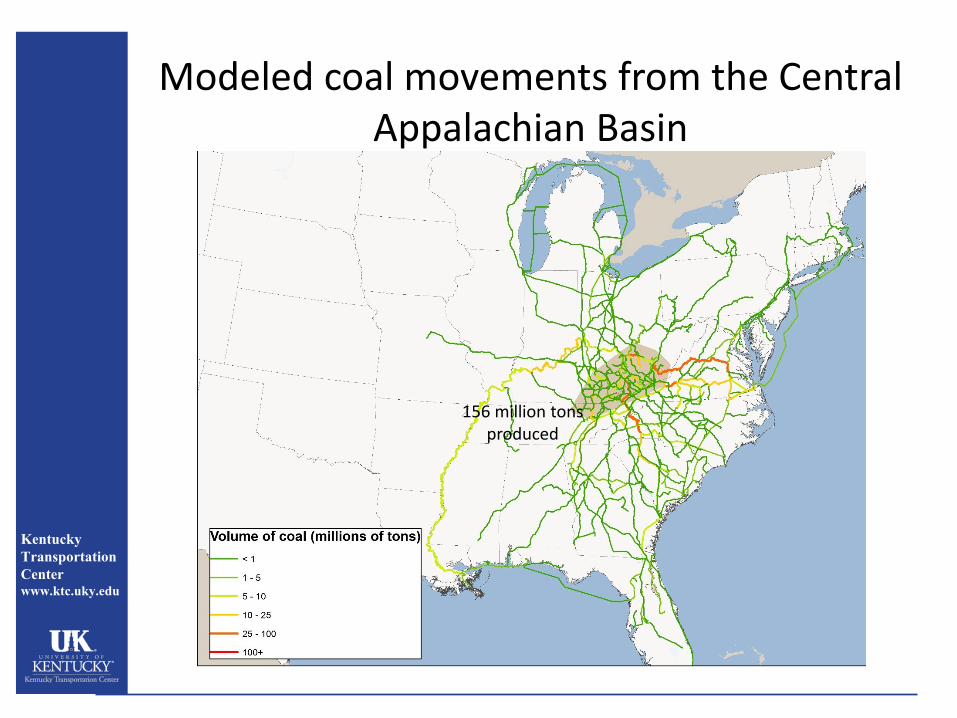
Modeled coal movements from the Central Appalachian Basin
156 million tons produced

Kentucky
Transportation
Center www.ktc.uky.edu
Modeled coal movements to Texas and Illinois
Powder River Basin
91 million tons consumed
58 million tons consumed

Kentucky
Transportation
Center www.ktc.uky.edu
Modeled coal exports (millions of tons)
Mobile: 9.7
New Orleans: 9.4
Norfolk: 32.0
Baltimore: 13.9
Kentucky
Transportation
Center www.ktc.uky.edu
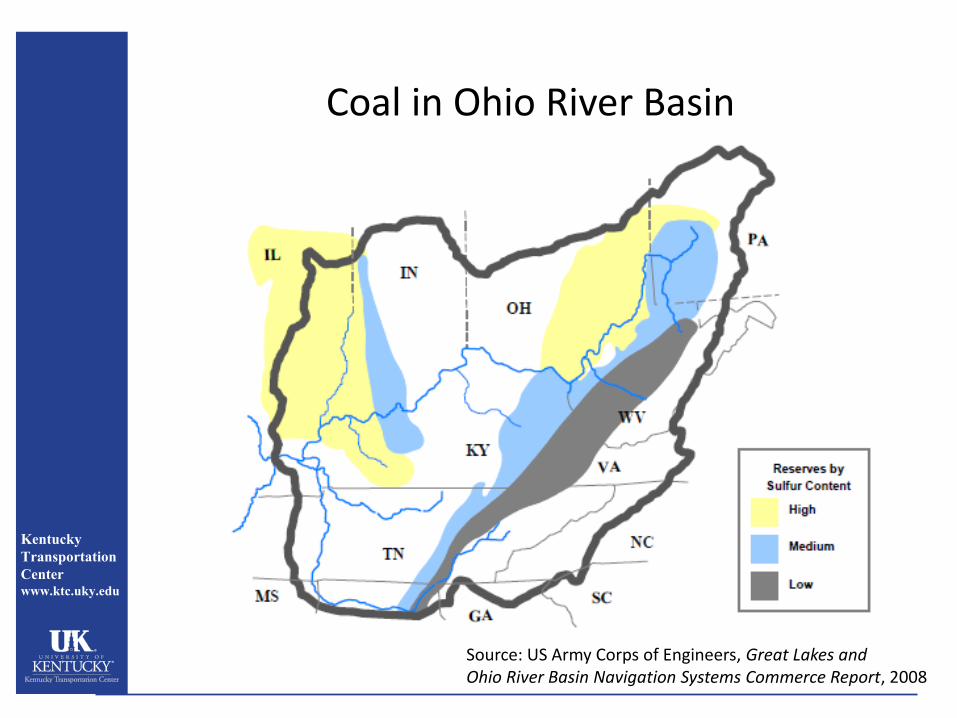
Coal in Ohio River Basin
Source: US Army Corps of Engineers, Great Lakes and Ohio River Basin Navigation Systems Commerce Report, 2008
Kentucky
Transportation
Center www.ktc.uky.edu
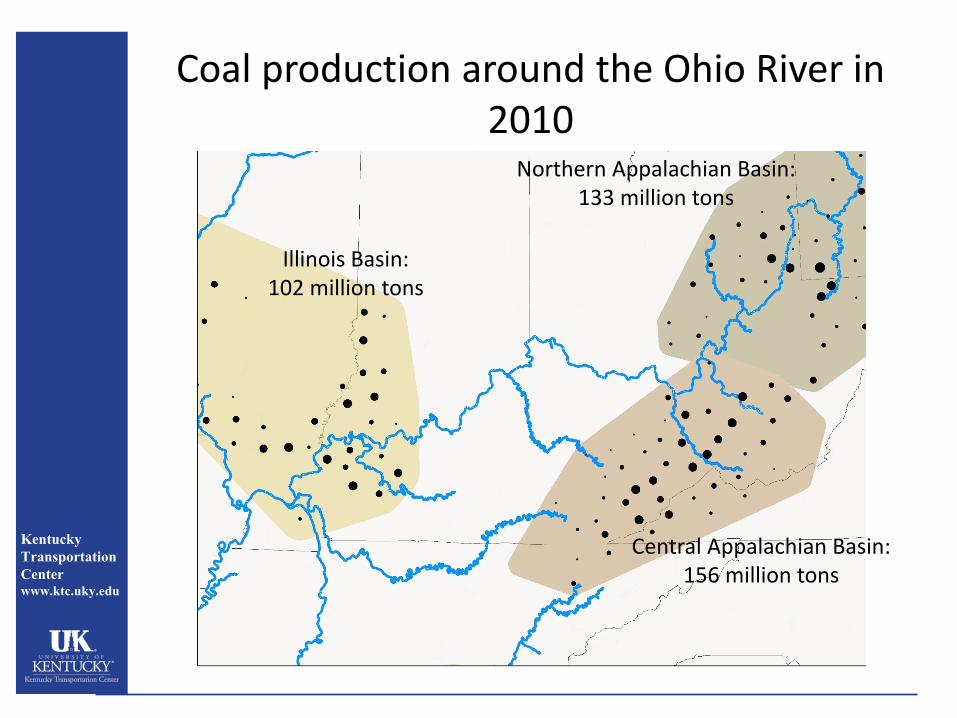
Coal production around the Ohio River in 2010
Illinois Basin: 102 million tons
Central Appalachian Basin: 156 million tons
Northern Appalachian Basin: 133 million tons

Kentucky
Transportation
Center www.ktc.uky.edu
Coal consumption around the Ohio River

Kentucky
Transportation
Center www.ktc.uky.edu
Coal consumption around the Ohio River
116 million tons of coal received at power plants along the Ohio River in 2010
Kentucky
Transportation
Center www.ktc.uky.edu
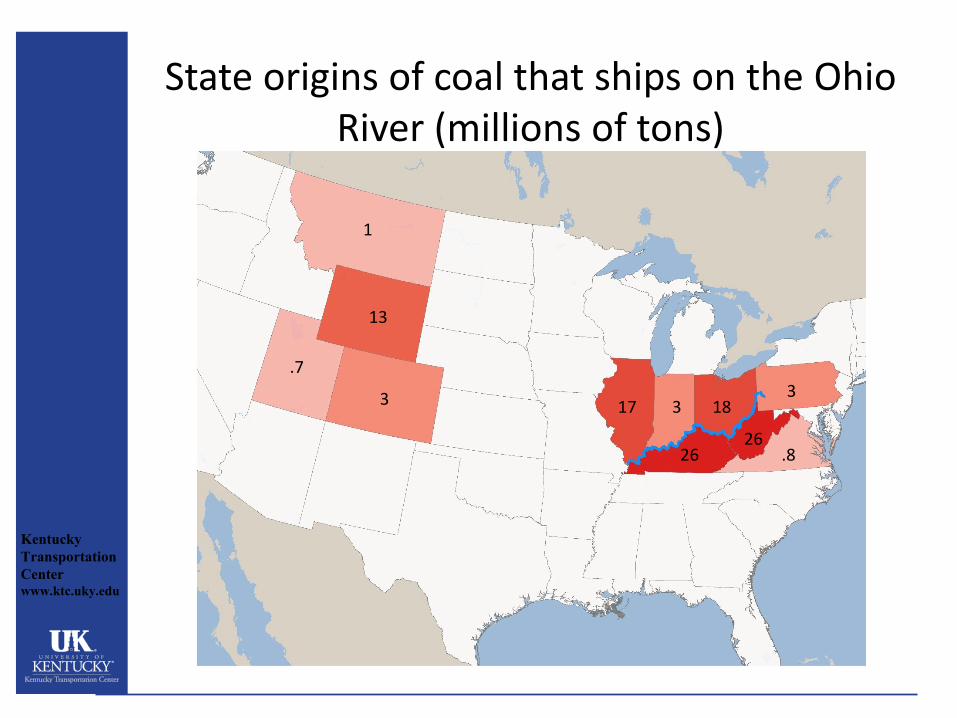
State origins of coal that ships on the Ohio River (millions of tons)
1
13
3 17 3
26
18 3
.7
26 .8

Kentucky
Transportation
Center www.ktc.uky.edu
State destinations of coal that ships on the Ohio River (millions of tons)
7
19
30 9
12
5
8
7
.5
13
.01
.04

Kentucky
Transportation
Center www.ktc.uky.edu
Full intermodal routes of coal that ships on the Ohio River
Kentucky
Transportation
Center www.ktc.uky.edu
Future directions
• Modeling all energy movements on an annual basis • Coal, petroleum, natural gas
• Diversion studies • What happens if a segment of the network is
closed
• Incorporation of more robust shipping rate data • Modeling and estimation of all types of
commodities across the three modes