an introduction to catastrophe insurance futures
TRANSCRIPT

AN INTRODUCTION TO CATASTROPHE INSURANCE FUTURES
Michael Bayard Smith L. Jaimie Pickles Consulting Actuary Financial Consultant
Tillinghast, A Towers Perrin Company Tillinghast, A Towers Perrin Company 1200 Gulf Life Drive, Suite 610 200 West Madison Street, Suite 3400
Jacksonville, Florida 32207 Chicago, Illinois 60606 Telephone: 904-398-5661 Telephone: 312-609-9400
Telefax: 904-399-8267 Telefax: 312-609-9393
The goal of the paper is to introduce catastrophe insurance futures and options. We
first provide background on natural catastrophes and the associated financial effects on
both the primary and reinsurance markets for property insurance. Next, we describe the
recently introduced catastrophe insurance futures product and present a general framework
for its pricing. We then illustrate the risk management and speculation potential of the
futures contracts with several examples. In conclusion, we discuss the future of the
contract and suggest several areas for further research.
817

introduction aux contrats 31 terme sur assurance des risques de catastrophe
Michael Bayard Smith L. Jaime Pickles Actuaire Conseil Conseiller financier Tillinhast, A Towers Perrin Company Tillinhast, A Towers Perrin Company 1200 Gulf Life Drive, Suite 610 200 West Madison Street, Suite 3400 Jacksonville, Florida 32207 Chicago, Illinois 60606 Telephone : 904-398-5661 Telephone : 312-609-9400 Fax : 904-399-8267 Fax : 312-609-9393
Msum6
Le but du present expose est d’introduire les options et contrats 3 terme sur
l’assurance des risques de catastrophe Nous presentons tout d’abord des donnees
g&r&ales sur les catastrophes naturelles et leur impact financier a la fois sur les
marches primaires et sur les marches de reassurance de la propriete. Nous decrivons
ensuite le produit recemment introduit de contrats a terme sur assurance des risques
de catastrophe et presentons un cadre general permettant d’btablir son prix. Nous
illustrons ensuite la gestion du risque et le potentiel de speculation des contrats &
terme ZI I’aide de quelques exemples. En conclusion, nous traitons de I’avenir du
contrat et suggerons plusieurs secteurs pouvant faire I’objet de recherches
supplementaires.
818

AN INTRODUCTION TO CATASTROPHE INSURANCE FUTURES 819
INTRODUCTION
Natural catastrophes place significant financial demands on society. In recent years the
magnitude of catastrophe losses (both insured and uninsured) has been staggering.
Insurance markets are faced with the dilemma of increasing consumer demand and
decreasing reinsurance supply. Partly in response to and partly in anticipation of current
insurance (and reinsurance) market conditions, financial markets have responded.
Derivative financial instruments linked to the level of catastrophe losses have been
introduced in the United States and are under consideration in Europe. To date market
activity has been thin (in the sense of few players and minimal volume) with the notable
exception of call option spreads on the futures contract.
In the sections that follow more background is given on natural catastrophes and the
insurance/reinsurance markets (in particular current market conditions for property
insurance and property catastrophe reinsurance.) Then, the catastrophe insurance futures
product is described, and pricing considerations are set forth relative to the empirical
evidence from the market. A general pricing structure is introduced. Several illustrative
examples of hedging applications are presented. In conclusion, the future of catastrophe
insurance futures is discussed.
NATURAL CATASTROPHES AND INSURANCE/REINSURANCE MARKETS
Natural catastrophes cause significant loss to life and damage to property. Large
international reinsurers and others devote significant resources to the analysis of such
catastrophes (Munich Reinsurance, 1988; Swiss Reinsurance, 1993).
820 4TH AFIR INTERNATIONAL COLLOQUIUM
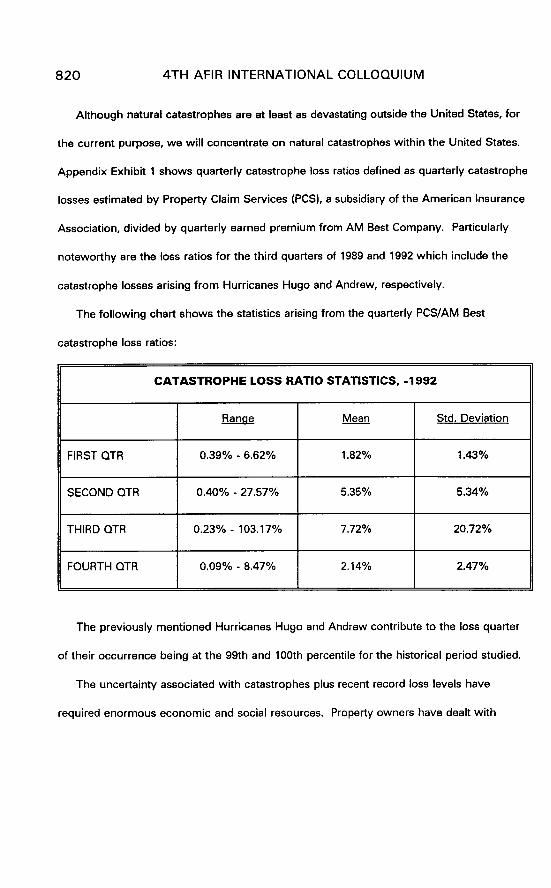
Although natural catastrophes are at least as devastating outside the United States, for
the current purpose, we will concentrate on natural catastrophes within the United States.
Appendix Exhibit 1 shows quarterly catastrophe loss ratios defined as quarterly catastrophe
losses estimated by Property Claim Services (PCS), a subsidiary of the American Insurance
Association, divided by quarterly earned premium from AM Best Company. Particularly
noteworthy are the loss ratios for the third quarters of 1989 and 1992 which include the
catastrophe losses arising from Hurricanes Hugo and Andrew, respectively.
The following chart shows the statistics arising from the quarterly PCS/AM Best
catastrophe loss ratios:
CATASTROPHE LOSS RATIO STATISTICS, -1992
FIRST QTR
SECOND QTR
THIRD QTR
FOURTH QTR
Ranqe
0.39% - 6.62%
0.40% - 27.57%
0.23% - 103.17%
0.09% - 8.47%
Mean
1.82%
5.35%
7.72%
2.14%
Std. Deviation
1.43%
5.34%
20.72%
2.47%
The previously mentioned Hurricanes Hugo and Andrew contribute to the loss quarter
of their occurrence being at the 99th and 100th percentile for the historical period studied.
The uncertainty associated with catastrophes plus recent record loss levels have
required enormous economic and social resources. Property owners have dealt with
AN INTRODUCTION TO CATASTROPHE INSURANCE FUTURES 821
physical injury and death in addition to loss of property. Insurance company resources and
government aid programs have been stressed responding to financial claims for disaster
relief. Reinsurers stand behind the insurance companies providing financial resources, and
taxpayers ultimately fund government relief programs.
Property owners, especially in catastrophe prone areas, are faced with the unavailability
of insurance coverage as well as an increased deductible level, restricted coverage and
increased prices when coverage is available. Insurance companies are faced with increased
demand from insureds, regulatory restrictions on price increases, and increasing retention
levels and prices associated with decreasing reinsurance capacity. Reinsurers, once able to
retrocede risk to other reinsurers, are now accepting business from ceding companies with
extremely limited retrocession support (Schnieper, 1993). Governments, as regulators of
the insurance markets, play a role administering the estates of companies rendered
insolvent by catastrophes, and organizing governmental or quasi-governmental facilities
providing primary insurance or reinsurance capacity. Governments are also involved in
financing risk handling facilities, providing disaster relief assistance directly and through
government loans.
Financial institutions, particularly those with large mortgage portfolios, are recognizing
the risks and examining mechanisms for managing the risk. The same risk management
approach would apply to large property owners.
There are clear signals of a crisis with financial and social implications. In the spirit of
innovation, the Chicago Board of Trade (CBOT) launched catastrophe insurance futures and
options in late 1992. The financial market features of market price discovery and the

822 4TH AFIR INTERNATIONAL COLLOQUIUM
potential for additional liquidity provide an interesting alternative to consider for mitigating
the crisis.
The next section describes the catastrophe insurance futures and options.
CATASTROPHE INSURANCE FUTURES b OPTIONS
Although insurance futures and options have been considered for many years prior to
1992, the CBOT has been the first organization to devote the developmental resources to
bring such products to market. After consideration of health insurance and automobile
physical damage insurance futures contracts, the CBOT introduced catastrophe insurance
futures and options on futures in December 1992.
The futures contracts settlement price was based on an index calculated by dividing
quarterly “catastrophe” losses incurred in a given loss quarter and reported during that
quarter or the next quarter by earned premium based on overall historical market statistics.
The “catastrophe” losses were defined as losses for a particular line of business and cause
of loss from data reported to ISODATA, Inc. (ISODATA), an insurance industry statistical
organization, by a group of 22 insurance companies. The reported catastrophe losses are
adjusted to total market levels based on the relationship of reporting company premiums to
market premiums. The plan was to introduce National, Eastern, Midwestern and Western
contracts. National and Eastern contracts were released in December 1992; the Midwestern
in May 1993.
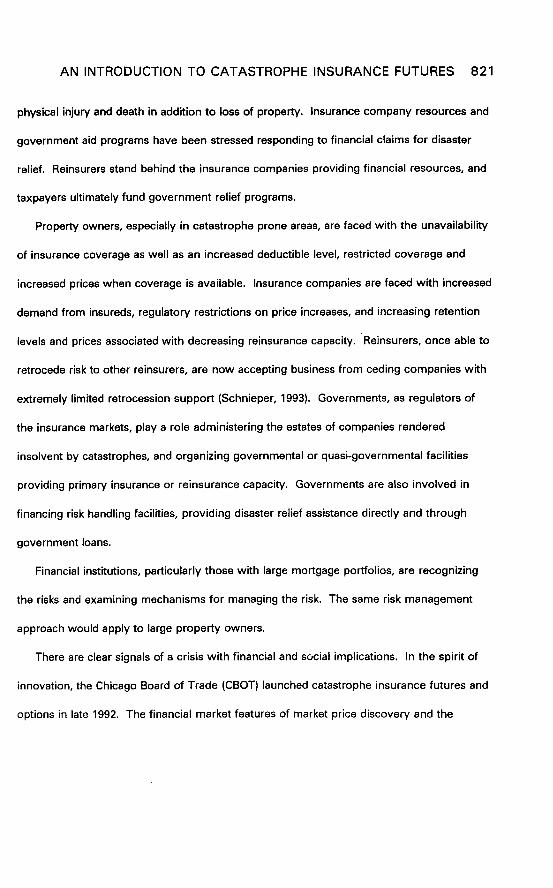
In an effort to educate the marketplace, the CBOT released historical “simulations” of
final settlement prices based on reconstruction of loss data reported to ISODATA and the
current premium base for the initial contracts. The construction of the historical
AN INTRODUCTION TO CATASTROPHE INSURANCE FUTURES 823
“simulation” could lead to a slight understatement of the mean settlement value for a loss
quarter and an overstatement of the variability. The historical “simulations” of settlement
prices are presented below:
‘Simulated’ Futures Settlement Prices, 3089 - 3092
(Catastrophe Loss Ratio x $25,000)
2nd National
Eastern
1989
$6,375
$12,075
$1,800
$1,425
$1,175
$2.325
$1,525
$2,800
$825
1991 I 1992 I Mean Standard
1 1 1 Deviation
$1,950 $2,225 $1,867 $406
$1,375 $4,100 $2,217 $1,634
$4,225 $4,325 $3,625 $1,127
$2,750 $1,925 $2,067 $625
$1.475 $24,800 $9,692 $13,100
51.875 $44.725 $15,808 $25,048
$775 - $1,108 $599
$650 - $1,017 $437
Actual settlements have been effected for the fourth loss quarter of 1992 and the 1st
loss quarter of 1993.
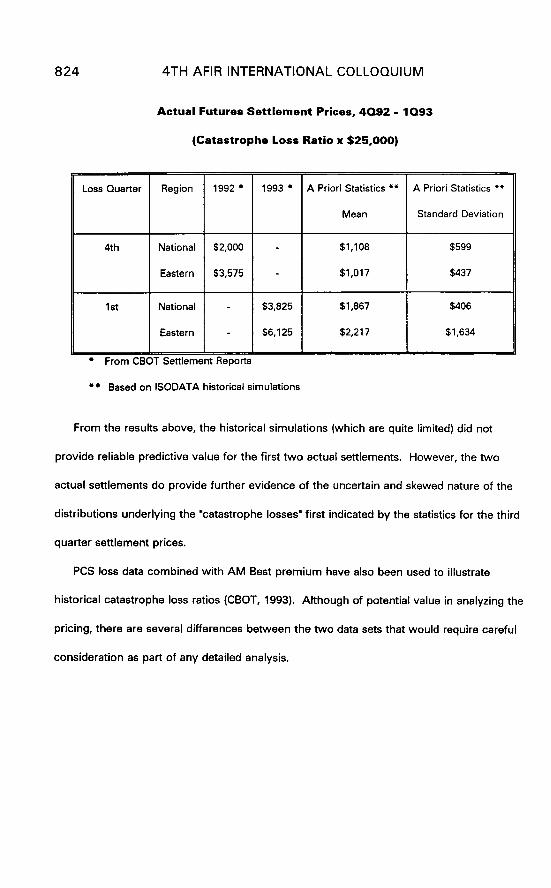
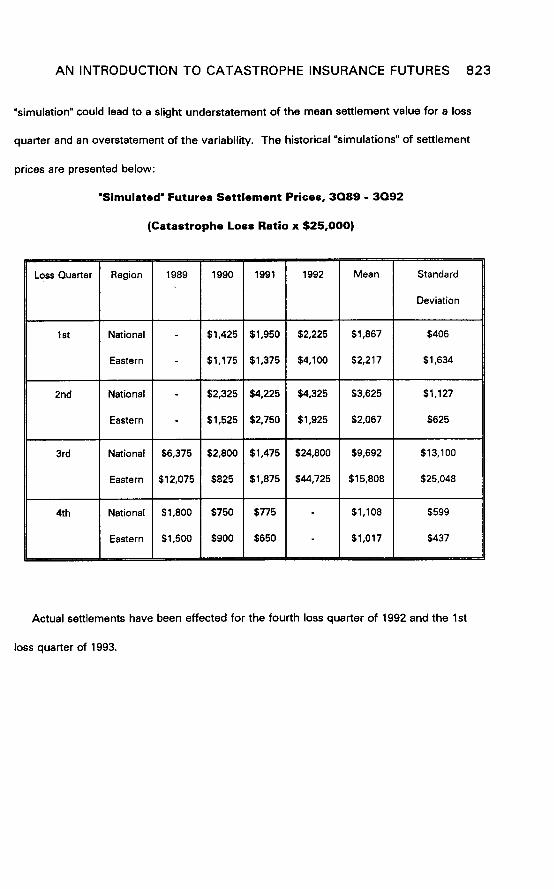
824 4TH AFIR INTERNATIONAL COLLOQUIUM
Actual Futures Settlement Prices, 4092 - 1093
(Catastrophe Loss Ratio x $25,000)
Loss Quarter Region 1992 l 1993 l A Priori Statistics l *
Mean
4th National $2,000 -
Eastern $3,575 -
1st National - $3,825
Eastern - $6,125
l From CBOT Settlement Reports
$1,108
$1,017
$1,867
$2,217
A Priori Statistics l *
Standard Deviation
$599
$437
$406
$1,634
l * Based on ISODATA historical simulations
From the results above, the historical simulations (which are quite limited) did not
provide reliable predictive value for the first two actual settlements. However, the two
actual settlements do provide further evidence of the uncertain and skewed nature of the
distributions underlying the “catastrophe losses” first indicated by the statistics for the third
quarter settlement prices.
PCS loss data combined with AM Best premium have also been used to illustrate
historical catastrophe loss ratios (CBOT, 1993). Although of potential value in analyzing the
pricing, there are several differences between the two data sets that would require careful
consideration as part of any detailed analysis.

AN INTRODUCTION TO CATASTROPHE INSURANCE FUTURES 825
CATASTROPHIC LOSS PROCESS
Since the futures contracts are restricted to a given loss quarter, the flow of information
about catastrophes within the loss quarter will likely have considerable effect on price
discovery within the marketplace. An idealized graphical description of the loss process
and the reporting process is shown below:
The incurred losses, although idealized, begin at zero at the beginning of the loss
quarter and reach the maximum value at the end of the loss quarter. The reported losses
lag the incurred losses and reach the ultimate incurred value many months after the actual
settlement has taken place for a particular loss quarter. Tools for detailed analysis of the
loss development process are part of the typical education of a casualty actuary in the
United States. The limited time horizon and the risk of a significant catastrophe make such
analysis difficult in actual applications.

826 4TH AFIR INTERNATIONAL COLLOQUIUM
Data quality issues and real time processing practicalities necessitate that the interim
reported value (as of the end of the loss quarter) is only publicly announced at the end of
the reporting period, and the final settlement is only publicly announced approximately
three months after the end of the reporting period.
Various loss distributions can be considered for modeling the catastrophe loss
distribution. Investigators have applied frequency/severity compound distributions to study
United States hurricanes (Levi b Partrat, 1991) Direct modeling of the compound aggregate
distribution is also a possibility.
The “catastrophic” losses included in the CBOT contract will include hurricanes,
earthquakes, and other catastrophes as well as a core of non-catastrophic losses
conforming to the cause of loss/line of business data definitions. Thus, any “catastrophic”
loss model by component should include a basic variable of limited variability plus variables
of greater variability corresponding to each significant type of natural catastrophe.
Other useful tools for analyzing the catastrophe losses are the various exposure/damage
models. These models rely on distributed exposure data and simulate the effects of
windstorms, earthquakes, tornados, and other natural catastrophes. The output of the
model simulation exercise could then be used to construct an aggregate loss distribution for
the catastrophic components of the futures contract. Coupled with the basic component
described above, the total “catastrophe” aggregate loss distribution could be used to
estimate futures settlement prices (and confidence intervals) and to investigate the behavior
of options on the catastrophe insurance futures.

AN INTRODUCTION TO CATASTROPHE INSURANCE FUTURES 827
Within a given loss quarter, the level of incurred “catastrophic” losses is monotonically
increasing and is dramatically affected by the occurrence or non-occurrence of major
catastrophes. Accordingly models for the process need to take account of the informational
value of actual catastrophes in the loss quarter relative to expected catastrophes estimated
prior to the loss quarter.
EMPIRICAL MARKET OBSERVATIONS
As mentioned previously, the trading to date for futures has been very limited. Starting
in July 1993, there has been some trading of options on the futures contract in the form of
call option spreads synthesizing a layer of catastrophic reinsurance. Such trading activity
has been concentrated in the loss quarters ending September 1993 and December 1993.
From inception to settlement the future contracts that have exhibited the following price
ranges:
Loss Quarter
4th Quarter 1992
1st Quarter 1993
Region Price Range Final Price
National $2,000 - $3,000 $2,000
Eastern $2,175 - $4,850 $3,575
National $2,025 - $4,000 $3,825
Eastern $1,750 - $8,775 $6,125
The daily prices for these contracts as well as volume are shown in Appendix Exhibit 2,
Sheets 1 - 6.

828 4TH AFIR INTERNATIONAL COLLOQUIUM
POTENTIAL USES OF CATASTROPHE INSURANCE FUTURES AND OPTIONS ON FUTURES
Hedqina with Futures
An insurer with significant exposures on the East coast is interested in protecting itself
from unexpected catastrophic losses. The insurer can construct synthetic catastrophe
reinsurance by purchasing September 1994 Eastern futures contracts. These contracts
cover losses occurring on the East coast in the third quarter. The insurer and the industry
have the following expectations:
3rd Quarter 1994 Insurer
Incurred Losses $2 million
Earned Premiums $5 million
Industry
$2.4 billion
$6.0 billion
The insurer assumes that its losses are perfectly correlated with the industry’s. Further,
it is expected that 75% of the industry’s ultimate third-quarter losses will be reported to IS0
DATA by December 31, 1994. With this information, the rational opening price of the
September 1994 Eastern futures will be $7,500 [$25,000 x (($2.4 billion x 75%)/$6 billion)].
The insurer should purchase 267 contracts [$5 million/($25,000 x 75%)] to create a
hedge against larger than expected losses. The CBOT requires a margin to be deposited;
however, this margin price is substantially less than the $7,500 contract price.
The table below illustrates that the insurer establishes a hedge by “locking in” an
expected loss ratio.

AN INTRODUCTION TO CATASTROPHE INSURANCE FUTURES 829
Loss Ratio
Futures Price
Original Futures Price
Net Futures Gain (Loss)
Number of Contracts
Gain (Loss) on Futures ($1.001.250) 0 $1.001.250 $2,002,500 $3.003.750
Unexpected Gain (Loss)
on Insurer’s Book of
Business
Net Position ($1,250) 0 $1,250
$7,500
($3.750)
267
$1.000.000
267
0
60%
$11,250
$7,500
$3,750
267
($1.000.000)
267 267
($2.000.000) ($3.000,000)
--&q-G-
Hedoino with Futures and Ootions on Futures
If an insurer wants to hedge against losses up to a specific loss ratio, it could
simultaneously purchase insurance futures and options on futures. The following example
uses the same assumptions in the previous example; however, we will assume that the
company believes its ultimate loss ratio and the ISODATA ultimate loss ratio will not exceed
100%. The company buys 267 Eastern September futures contracts. In addition, the
company sells 267 Eastern September call option contracts with a 100% loss ratio strike
(X= 100).

830 4TH AFIR INTERNATIONAL COLLOQUIUM
The hedge is effective up to a 100% loss ratio, and the company profits from selling the
option (267 x option premium). However, if the loss ratio exceeds a 100% loss ratio, the
company experiences a negative net position.
Hedoino with Ootions on Futures
Consider again the insurer we used in the above “Hedging with Futures” example. If a
company’s objective is to protect itself against a loss ratio greater than 40%, it would
similarly purchase 267 September 1994 Eastern call options with a strike price of 40 (i.e.,
40% loss ratio). The table below illustrates the results of this hedge.
Loss Ratio
Futures Price
Gain per Options
contract
Number of
Contracts
Gain on Options
(before Option
Premium)
0 0 $1,001,250 $2,002,500 $3,003,750
Unexpected Gain $1 ,ooo,ooo 0 ($1,000,000) ($2,000,000) ($3,000,000)
(Loss) on Insurer’s
Book of Business
Net Position $1,000,000 0 $1,250 $2,500 $3,750
AN INTRODUCTION TO CATASTROPHE INSURANCE FUTURES 831
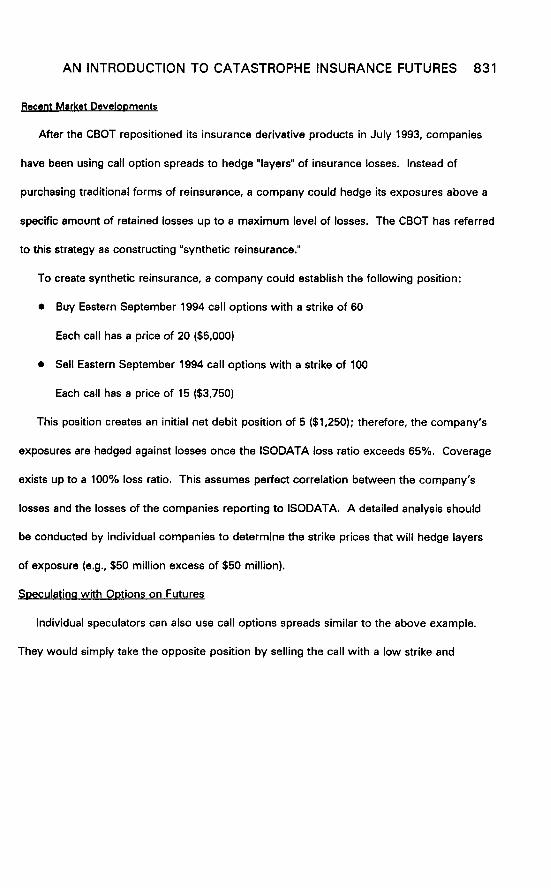
Recent Market Develooments
After the CBOT repositioned its insurance derivative products in July 1993, companies
have been using call option spreads to hedge “layers” of insurance losses. Instead of
purchasing traditional forms of reinsurance, a company could hedge its exposures above a
specific amount of retained losses up to a maximum level of losses. The CBOT has referred
to this strategy as constructing “synthetic reinsurance.”
To create synthetic reinsurance, a company could establish the following position:
l Buy Eastern September 1994 call options with a strike of 60
Each call has a price of 20 ($5,000)
a Sell Eastern September 1994 call options with a strike of 100
Each call has a price of 15 ($3,750)
This position creates an initial net debit position of 5 ($1,250); therefore, the company’s
exposures are hedged against losses once the ISODATA loss ratio exceeds 65%. Coverage
exists up to a 100% loss ratio. This assumes perfect correlation between the company’s
losses and the losses of the companies reporting to ISODATA. A detailed analysis should
be conducted by individual companies to determine the strike prices that will hedge layers
of exposure (e.g., $50 million excess of $50 million).
Soeculatina with Options on Futures
Individual speculators can also use call options spreads similar to the above example.
They would simply take the opposite position by selling the call with a low strike and

832 4TH AFIR INTERNATIONAL COLLOQUIUM
purchasing a call with a higher strike. Each point between the spread is worth $250;
therefore, the 60/100 spread would create a $10,000 exposure.
Similarly, a reinsurer could sell layers of insurance by selling a call spread. In fact, some
argue that catastrophe insurance options on futures provide effective diversification more
efficiently than utilizing traditional reinsurance distribution channels (CBOT, 1993).
Arbitraqe Oooonunities
Given the nature of this product and the fundamental lack of market information, it is
difficult to develop an accurate pricing model. Individuals and companies that can construct
pricing models may be able to make arbitrage profits.
When the market matures and liquidity is sufficient in trading futures and options on
futures (calls and puts), arbitrage profits will exist if the American put/call parity does not
hold. The American put/call parity applies if the following relationship exists:
C - FO,T + (e”-f?A)K =z= P c= C - (e^-RA)FO,T + K
Where:C = Price of call
FO,T = Spot price of futures contract
(e^-RA)K = Present value of strike price
P = Price of put
(e A -RA)FO,T = Present value of futures spot price delivered at futures maturity
date (Time = A)
K = Strike price
The following table illustrates the conditions that must be met in order to avoid arbitrage
opportunities:

AN INTRODUCTION TO CATASTROPHE INSURANCE FUTURES 833
Action
Buy Call
Sell Put
Sell Futures
Borrow
;Risk Free Rate)
Column Totds
Inflow at Time Zero Inflow at Time = A
FA,T <= K
-C 0
,-G-/-s (e”-RA)(FO,T - K) -FO,T + K
Must equal zero 0
Inflow at Time = A
FA.T > K
FA,T - K
0
-(FA,T - F0.T)
-FO,T + K
0
By simultaneously selling the put, selling the futures contract and borrowing at the risk
free rate, a short position in a “synthetic” call is created. Therefore, if the true call price
does not equal the synthetic call price, an opportunity to make arbitrage profits exists. For
example, if the call is underpriced, the position created in the table above would produce an
arbitrage profit at “Time Zero.” If the call is overpriced, reverse the positions (i.e., sell the
call, buy the put, buy the futures contract and lend at the risk free rate).
THE FUTURE OF INSURANCE DERIVATIVES
Currently, this alternative market is providing only several million dollars of synthetic
reinsurance capacity. In October 1993, the CBOT estimated this number to be
approximately $6 million dollars. When this paper is presented, these insurance derivatives
will have been traded for over one year. However, it is difficult to predict if the insurance

834 4TH AFIR INTERNATIONAL COLLOQUIUM
industry will incorporate the contracts into their fundamental risk management strategies, as
a number of barriers to success remain:
Financial Innovation - The learning curve remains steep, and many individuals and
companies are reluctant to incorporate hedging activity into their business strategy.
Requlation - The National Association of Insurance Commissioners (NAIC) has not yet
determined specific accounting practices and procedures for insurance derivatives. This
announcement is expected in 1994. In the U.S., regulations have been implemented in
Illinois and are expected to take effect in New York and California in 1994.
Liauiditv - Traders face significant liquidity problems, as volume remains low in this
market.
Participants - lt is difficult to identify natural sellers in this market. However, reinsurers,
Wall Street and institutional investors have expressed an interest in these products and
may emerge as sellers.
Pricing - Given the nature of this product and the lack of information available to buyers
and sellers, it is difficult to determine prices of the contract. Until an accurate pricing
model is created, market trading volume will remain low.
It is necessary to conduct further research to develop accurate pricing models. For
example, premiums, by state and line of business, would be converted to exposure values.
Subsequently, exposure values would be geographically distributed. Once this is
accomplished, the model would, based on fundamental assumptions, simulate the effects of

AN INTRODUCTION TO CATASTROPHE INSURANCE FUTURES 835
catastrophic events (hurricane, tornado, earthquake, hail, etc.). These statistics could then
be used to estimate expected prices for futures and options on futures. Further, during the
loss period of contracts, participants could use models to estimate the impact of
catastrophes, before and after the events.
Other pricing models could be based on’historical information. As the market develops,
PCS and ISODATA statistics may be used to estimate expected prices. There appear to be
many areas of fruitful research open to those interested in this innovative new product.

836 4TH AFIR INTERNATIONAL COLLOQUIUM
APPENDIX

Irn4b
20%
Exhibit 1 National Catastrophe Loss Ratio
1 r
Source: PCS/AM But Year

838 4TH AFIR INTERNATIONAL COLLOQUIUM

EXHIBIT 2 Sheet 2
Chicago Board of Trade Eastern Catastrophe Insurance Futures Daily Volume
90
80
70
60
02 50 !? 2 40
30
20
10
0 ll-Dee 26-Jan lo-Mar 22-Apr 04-Jun 19-Jul 30-Aug
Trading Date

840 4TH AFIR INTERNATIONAL COLLOQUIUM
I
I I

EXHIBIT 2 Sheet 4
20
15
.z 10 &
5
0 11-Dee
Chicago Board of Trade National Catastrophe Insurance Futures Daily Closing Prices
n 15.3
J-
26-Jan lo-Mar 22-Apr 04-Jun 19-Jul 30-Aug Trading Date
__ March (formerly June)
- - Settle Price
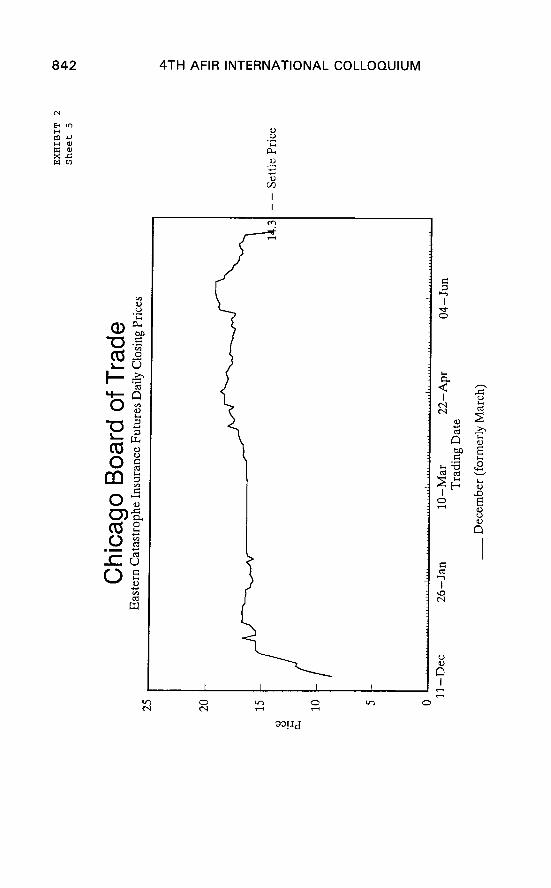
842 4TH AFIR INTERNATIONAL COLLOQUIUM

EXHIBIT 2 Sheet 6
30
25
20
.B 15 2
10
5
0
-
Chicago Board of Trade Eastern Catastrophe Insurance Futures Daily Closing Prices
ll-Dee 2h- Jan lo-Mar 22-Apr 04-Jun 19-Jul M--Au&
Trading Date
__ March (formerly June)
- - Settle Price

844 4TH AFIR INTERNATIONAL COLLOQUIUM
REFERENCES
1 Chicago Board of Trade (1992) Reference Guide: Catastrophe Insurance Futures and
Options. CBOT, Chicago.
2 Chicago Board of Trade (1993) Background Reports: Catastrophe Insurance Futures and
Options. CBOT, Chicago.
3 Levi, C. and Partrat, C. (1991) Statistical Analysis of Natural Events in the United States.
ASTIN Bulletin 21/2, 253-276.
4 Munich Reinsurance (1988) World Map of Natural Hazards. Munich Reinsurance,
Munich.
5 Pickles, J.L. and Mathewson S.B. (1993) The Future of Futures. Emphasis 3, 10-13.
6 Schnieper, Rene (1993) The Insurance of Catastrophic Risks. SCOR Notes: Rewarding
Risk, 1 l-60.
7 Swiss Reinsurance (1993) Natural Catastrophes and Major Losses in 1992. Sigma
Economic Studies 2, l-24.