an introduction to ecology and the biosphere the functioning and distribution of organisms across...
TRANSCRIPT

Chapter 52
An Introduction to Ecology
and the Biosphere
AP Biology

Overview: The Scope of Ecology
• Ecology is the scientific study of the interactions between organisms and
the environment
– These interactions between organisms and their environments can
occur at a various levels, including:
• Organismal ecology (Ch. 52)
• Population ecology (Ch. 53)
• Community ecology (Ch. 54)
• Ecosystem ecology (Ch. 55)
• Landscape ecology (Ch. 56)
• Global ecology (Ch. 56)

• Organismal ecology studies how an organism’s structure, physiology, and
behavior meets environmental challenges
– Ex) How do hammerhead sharks
select a mate?
• Population ecology focuses on factors affecting how many individuals of a
species live in an area
– A population is a group of individuals of the
same species living in an area
• Ex) What environmental factors affect the
reproductive rate of deer mice?
Fig. 52-2a
Fig. 52-2b

• Community ecology examines how interactions between species (ex: predation,
competition) affect community structure and organization
– A community is a group of populations of
different species in an area
• Ex) What factors influence the
diversity of species that make up
a forest?
• Ecosystem ecology emphasizes energy flow and chemical cycling between
organisms and the environment
– An ecosystem is the community of
organisms in an area and the physical
factors with which they interact
• Ex) What factors control
photosynthetic productivity in a
temperate grassland ecosystem?
Fig. 52-2c
Fig. 52-2d
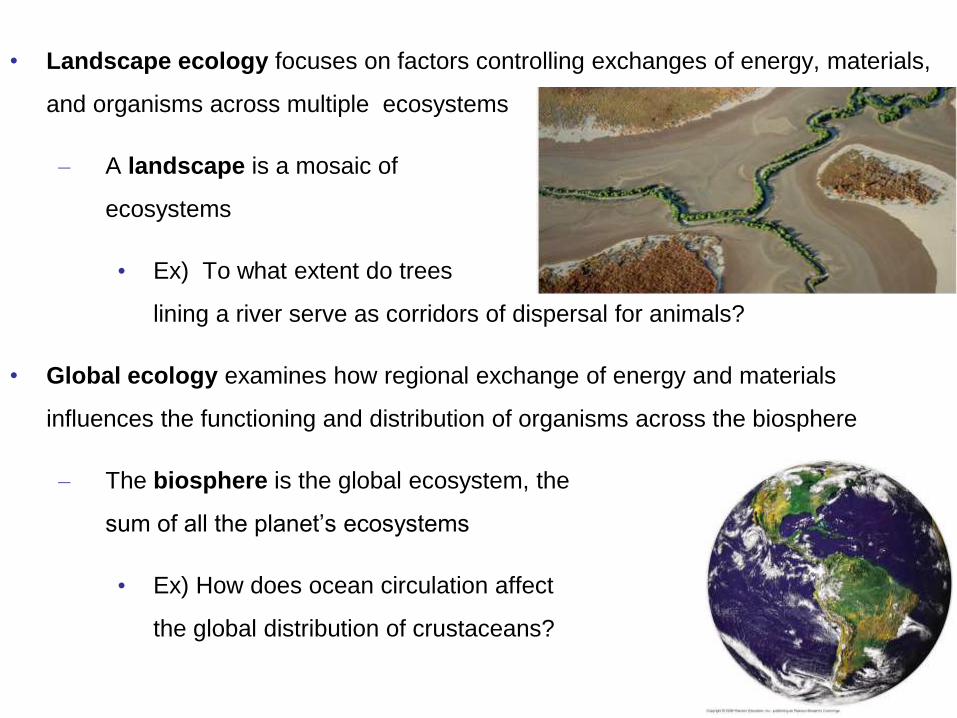
• Landscape ecology focuses on factors controlling exchanges of energy, materials,
and organisms across multiple ecosystems
– A landscape is a mosaic of connected
ecosystems
• Ex) To what extent do trees
lining a river serve as corridors of dispersal for animals?
• Global ecology examines how regional exchange of energy and materials
influences the functioning and distribution of organisms across the biosphere
– The biosphere is the global ecosystem, the
sum of all the planet’s ecosystems
• Ex) How does ocean circulation affect
the global distribution of crustaceans?
Fig. 52-2e
Fig. 52-2f

Concept 52.1: Ecology Integrates All Areas of Biological Research
and Informs Environmental Decision Making
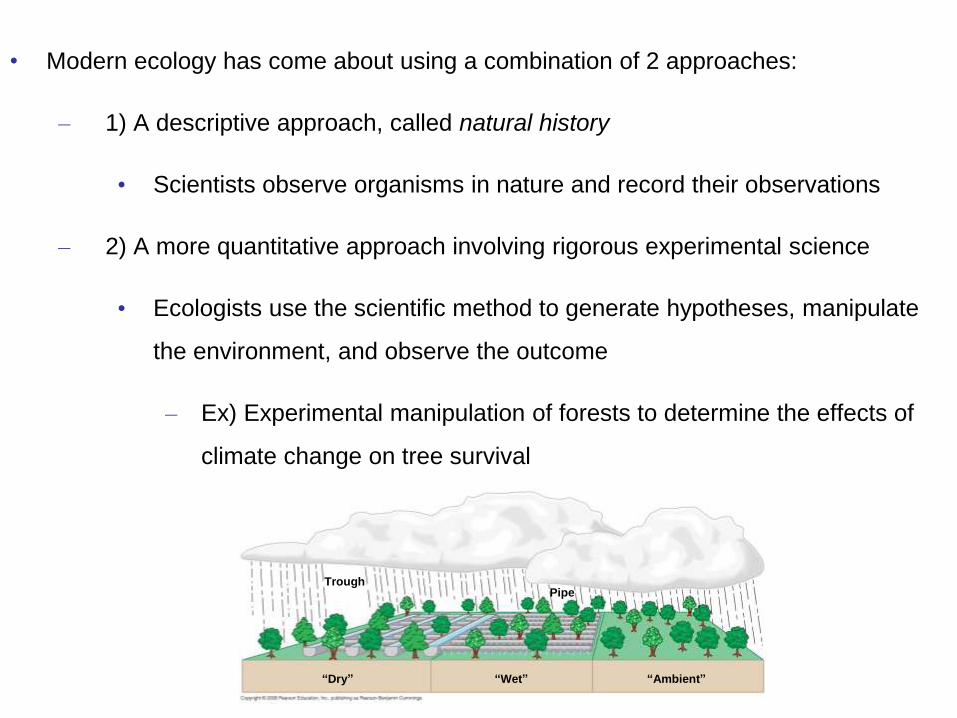
• Modern ecology has come about using a combination of 2 approaches:
– 1) A descriptive approach, called natural history
• Scientists observe organisms in nature and record their observations
– 2) A more quantitative approach involving rigorous experimental science
• Ecologists use the scientific method to generate hypotheses, manipulate
the environment, and observe the outcome
– Ex) Experimental manipulation of forests to determine the effects of
climate change on tree survival
Fig. 52-3
TroughPipe
“Dry” “Wet” “Ambient”
Linking Ecology and Evolutionary Biology
• There is a strong link between ecology and evolution:
– The differential survival and reproduction of individuals in an ecosystem
ultimately leads to evolutionary change over many generations
• The differential survival and reproduction of individuals that leads to
evolution occurs in ecological time (the minute-to-minute time frame of
interactions between organisms and the environment)
• The adaptation that occurs over many generations occurs in the time
frame of evolutionary time
– Ex) As a farmer applies a new fungicide to protect his wheat crop from
fungus, the frequency of fungicide resistance increases in a population of
fungus over time

Ecology and Environmental Issues
• Ecology also provides the scientific understanding needed to help conserve and
sustain life on Earth
– Because ecology is useful in conservation and environmental efforts, many
people associate ecology with environmentalism (advocating the protection of
nature)
– There is, however, an important distinction between science and advocacy
• Many ecologists feel a responsibility to educate legislators and the public
about environmental issues
• How society uses this ecological knowledge, however, depends on much
more than science alone
– Policymakers must weigh environmental concerns against social and
financial costs
Concept Check 52.1
• 1) Contrast the terms ecology and environmentalism. How
does ecology relate to environmentalism?
• 2) How can an event that occurs on the ecological time scale
affect events that occur on an evolutionary time scale?
• 3) A wheat farmer tests four fungicides on small plots and finds
that the wheat yield is slightly higher when all four fungicides
are used together than when any one fungicide is used alone.
From an evolutionary perspective, what would be the likely
long-term consequence of applying all four fungicides together?
Concept 52.2: Interactions between organisms and the
environment limit the distribution of species

• Ecologists have long recognized global and regional patterns of distribution
of organisms within the biosphere
– Ex) Kangaroos are found only in Australia;
• Ecologists recognize two kinds of factors that determine distribution of
organisms:
– 1) Biotic (living) factors: all the organisms that are part of an
individual’s environment
• Ex) Food availability, competition, predators
– 2) Abiotic (nonliving) factors: all the chemical and physical factors that
influence distribution and abundance of organisms
• Ex) Temperature, light, water, nutrients
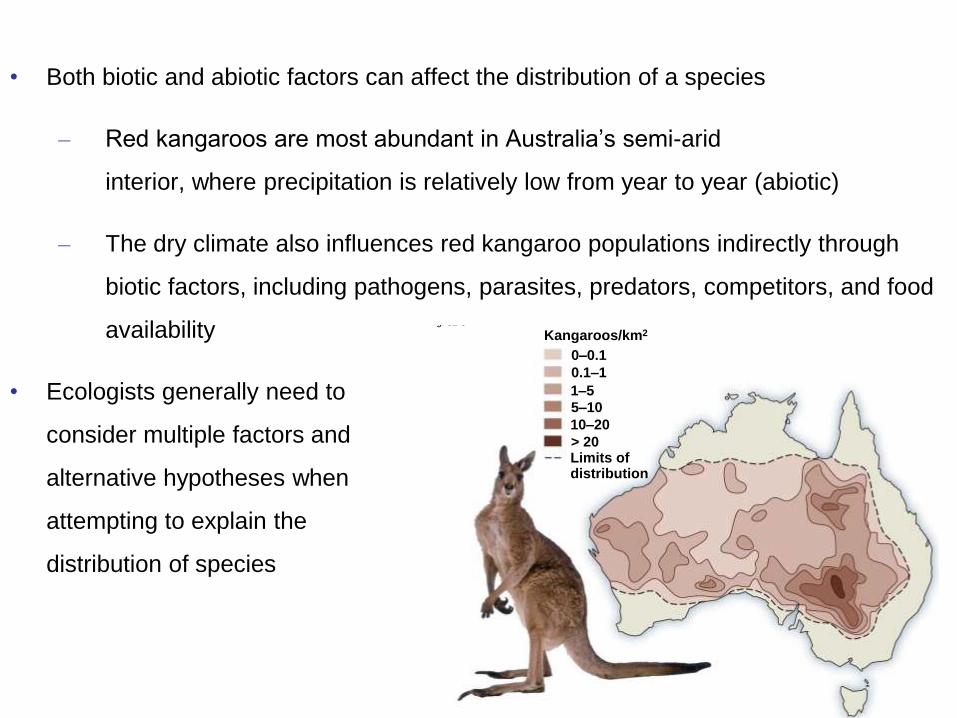
• Both biotic and abiotic factors can affect the distribution of a species
– Red kangaroos are most abundant in Australia’s semi-arid
interior, where precipitation is relatively low from year to year (abiotic)
– The dry climate also influences red kangaroo populations indirectly through
biotic factors, including pathogens, parasites, predators, competitors, and food
availability
• Ecologists generally need to
consider multiple factors and
alternative hypotheses when
attempting to explain the
distribution of species
Fig. 52-5
Kangaroos/km2
0–0.1
0.1–1
1–5
5–10
10–20
> 20Limits ofdistribution

• One factor that ecologists consider when attempting to explain the distribution of
species is dispersal
– Dispersal is movement of individuals away from centers of high population
density or from their area of origin
– Ex) A scientist might hypothesize that there are no kangaroos in North
America because a barrier to their dispersal existed
Fig. 52-6
Why is species X absentfrom an area?
Does dispersallimit its
distribution?Does behavior
limit itsdistribution?
Area inaccessibleor insufficient time
Yes
No
No
No
Yes
YesHabitat selection
Do biotic factors(other species)
limit itsdistribution?
Predation, parasitism,competition, disease
Do abiotic factorslimit its
distribution?
Chemicalfactors
Physicalfactors
WaterOxygenSalinitypHSoil nutrients, etc.
TemperatureLightSoil structureFireMoisture, etc.

Natural Range Expansions
• Some organisms can disperse more readily than others, leading to
natural range expansion
– In natural range expansion, organisms reach areas where they
did not exist previously
• Ex) In the last 200 years,
cattle egrets expanded
their natural range from
Africa, across the Atlantic
Ocean, to the United
States and southern
Canada
Fig. 52-7
Current
1966
1970
1965 1960
1961
1958
1951
1943
1937
1956
1970

Species Transplants
• Opportunities to observe natural range expansions directly are rare
– To determine if dispersal is the key factor limiting the distribution of a species,
ecologists therefore often turn to experimental methods
• Species can be transplanted, either intentionally or accidentally, relocating
them from their original distribution to areas where they were previously
absent
• For these transplants to be successful, some of the relocated organisms
must survive and reproduce in the new area
– If the transplant is successful, then the potential range of the species
is larger than its actual range
– Ecologists can thus conclude that dispersal is not the limiting factor in
the dispersal of that species
Consequences of Species Transplants
• Species transplants can have negative consequences,
however, and often disrupt the communities or ecosystems to
which they have been introduced
– Therefore, scientists rarely conduct transplant experiments
across geographic regions
– Instead, they document outcomes of species that have
been transplanted for other reasons
• Ex) Introduction of game animals or predators of pest
animals

Behavior and Habitat Selection
• If organisms do not occupy all of their potential range, other factors must be
considered:
– Does behavior limit the distribution of a species?
• When individuals seem to avoid potentially suitable habitats, the distribution of these
organisms may be limited by habitat selection behavior
– Ex) Female insects often deposit eggs only in response to a very narrow set of
stimuli, thus restricting distribution of these insects to certain host plants
• For example, egg-laying females of the European corn borer species are
attracted to odors produced only by maize, even though its larvae can feed
on a variety of plants
Fig. 52-6
Why is species X absentfrom an area?
Does dispersallimit its
distribution?Does behavior
limit itsdistribution?
Area inaccessibleor insufficient time
Yes
No
No
No
Yes
YesHabitat selection
Do biotic factors(other species)
limit itsdistribution?
Predation, parasitism,competition, disease
Do abiotic factorslimit its
distribution?
Chemicalfactors
Physicalfactors
WaterOxygenSalinitypHSoil nutrients, etc.
TemperatureLightSoil structureFireMoisture, etc.

Biotic Factors
• If behavior does not limit distribution of a species, the next factor must be examined:
– 3) Do biotic factors (other species) limits its distribution?
• Biotic factors that affect the distribution of organisms may include:
– Beneficial interactions with other species
• Ex) Pollinators for flowering plants
– Negative interactions with other organisms
• Ex) Competition, predation
Fig. 52-6
Why is species X absentfrom an area?
Does dispersallimit its
distribution?Does behavior
limit itsdistribution?
Area inaccessibleor insufficient time
Yes
No
No
No
Yes
YesHabitat selection
Do biotic factors(other species)
limit itsdistribution?
Predation, parasitism,competition, disease
Do abiotic factorslimit its
distribution?
Chemicalfactors
Physicalfactors
WaterOxygenSalinitypHSoil nutrients, etc.
TemperatureLightSoil structureFireMoisture, etc.

• Experiment: Does feeding by sea urchins limit seaweed distribution?
– Researchers reasoned that, if sea urchins are the limiting biotic factor in
seaweed distribution, then more seaweed should invade an area from which
sea urchins have been removed
– To isolate the effects of sea urchins from other seaweed-eating animals
(limpets), researchers created 3 experimental groups adjacent to a control site:
• Only sea urchins removed
• Only limpets removed
• Both sea urchins and limpets removed
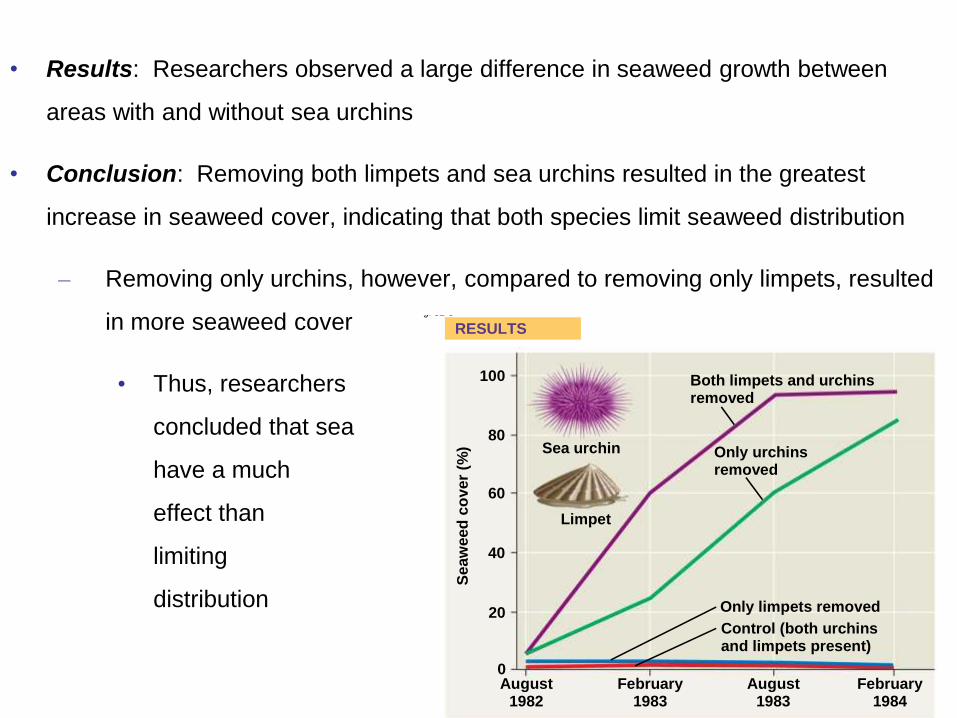
• Results: Researchers observed a large difference in seaweed growth between
areas with and without sea urchins
• Conclusion: Removing both limpets and sea urchins resulted in the greatest
increase in seaweed cover, indicating that both species limit seaweed distribution
– Removing only urchins, however, compared to removing only limpets, resulted
in more seaweed cover
• Thus, researchers
concluded that sea urchins
have a much greater
effect than limpets in
limiting seaweed
distribution
Fig. 52-8
RESULTS
Sea urchin
100
80
60
40
20
0
Limpet
Se
aw
eed
co
ver
(%)
Both limpets and urchinsremoved
Only urchinsremoved
Only limpets removed
Control (both urchinsand limpets present)
August1982
August1983
February1983
February1984

Abiotic Factors
• The final consideration for species distribution is: Do abiotic (nonliving) factors limit a
species’ distribution?
– If the physical conditions in a particular area do not allow a species to survive
and reproduce, then that species will not be found there
• Abiotic factors affecting distribution of organisms include:
– Temperature, water, sunlight, wind, rocks, and soil
Fig. 52-6
Why is species X absentfrom an area?
Does dispersallimit its
distribution?Does behavior
limit itsdistribution?
Area inaccessibleor insufficient time
Yes
No
No
No
Yes
YesHabitat selection
Do biotic factors(other species)
limit itsdistribution?
Predation, parasitism,competition, disease
Do abiotic factorslimit its
distribution?
Chemicalfactors
Physicalfactors
WaterOxygenSalinitypHSoil nutrients, etc.
TemperatureLightSoil structureFireMoisture, etc.

Temperature
• Environmental temperature is an important factor in distribution of organisms
because of its effects on biological processes
– Cells (which contain water) may freeze and rupture below 0
C
– Most proteins denature above 45
C
– Few organisms can maintain active metabolisms at very low or high
temperatures
• Most organisms function best within a specific range of
environmental temperature
– Temperatures outside this range may force animals, including
mammals and birds, to expend energy to regulate their internal
temperature
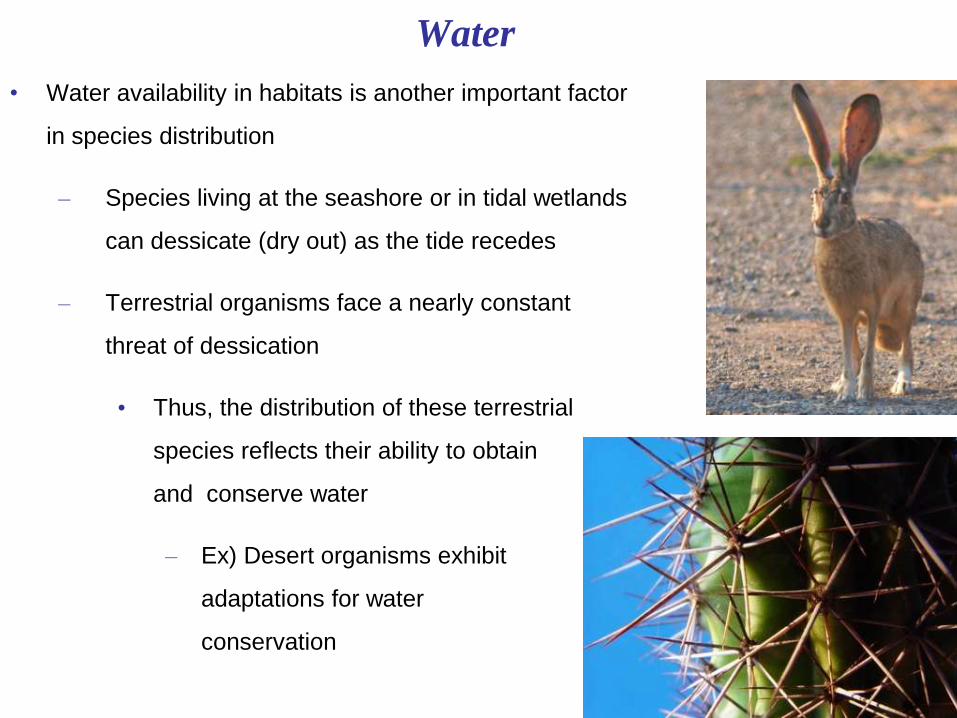
Water
• Water availability in habitats is another important factor
in species distribution
– Species living at the seashore or in tidal wetlands
can dessicate (dry out) as the tide recedes
– Terrestrial organisms face a nearly constant
threat of dessication
• Thus, the distribution of these terrestrial
species reflects their ability to obtain
and conserve water
– Ex) Desert organisms exhibit
adaptations for water
conservation
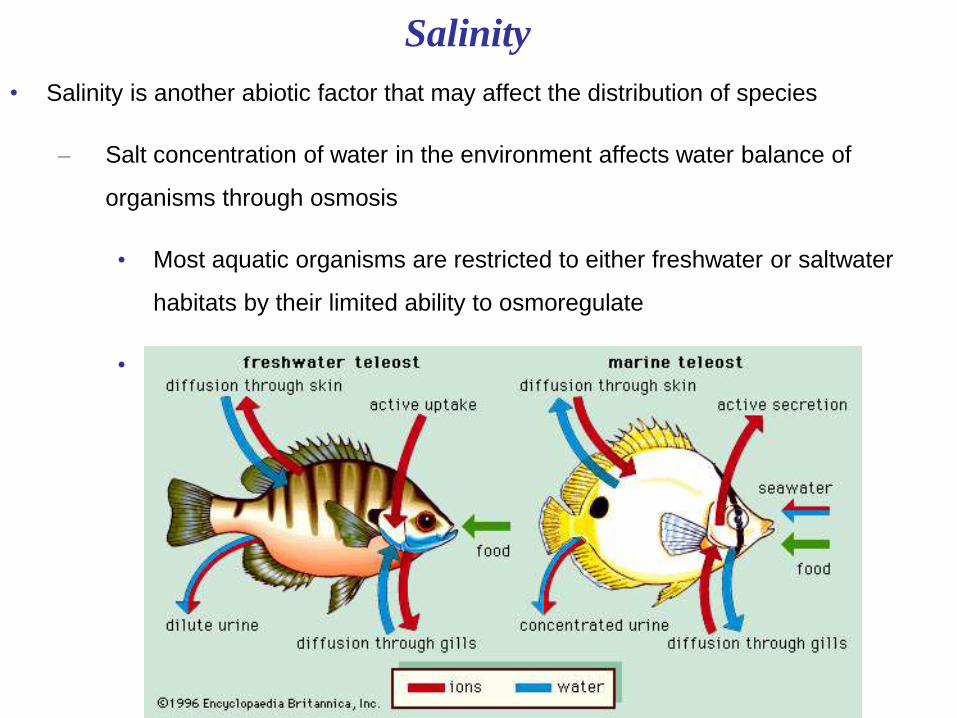
Salinity
• Salinity is another abiotic factor that may affect the distribution of species
– Salt concentration of water in the environment affects water balance of
organisms through osmosis
• Most aquatic organisms are restricted to either freshwater or saltwater
habitats by their limited ability to osmoregulate
• Few terrestrial organisms are adapted to high-salinity habitats
Sunlight
• Light intensity and quality affect photosynthesis and thus the
distribution of photosynthetic species
– In forests, competition for light is is particularly intense,
especially for seedlings growing on the forest floor
– In aquatic environments, most photosynthesis occurs near
the surface because water absorbs light
• Every meter of water depth selectively absorbs ~45% of
red light and ~2% of blue light
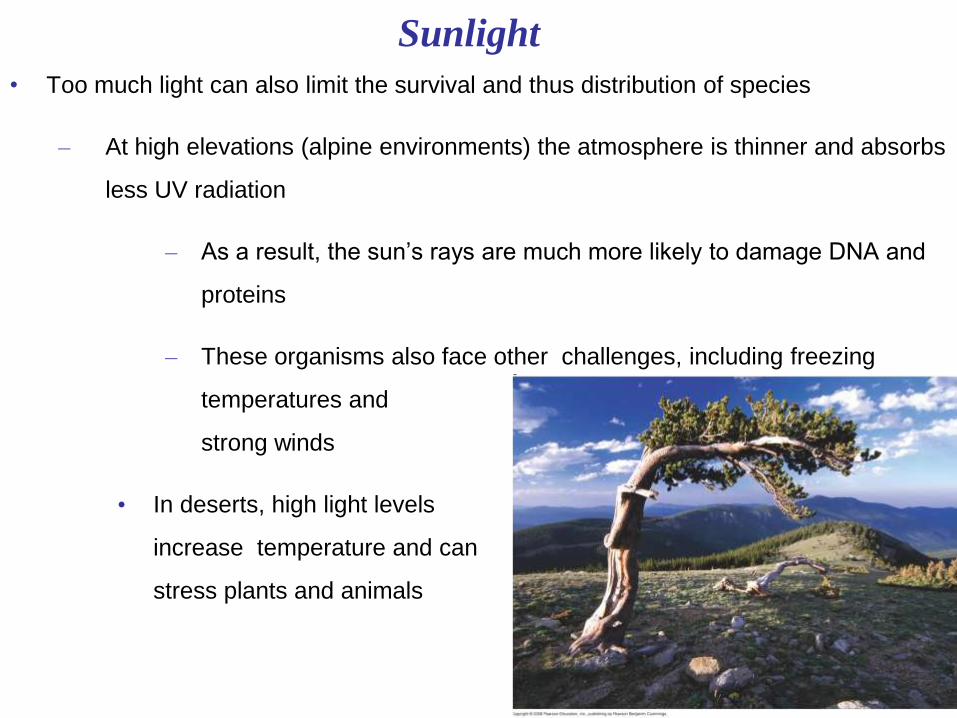
Sunlight
• Too much light can also limit the survival and thus distribution of species
– At high elevations (alpine environments) the atmosphere is thinner and absorbs
less UV radiation
– As a result, the sun’s rays are much more likely to damage DNA and
proteins
– These organisms also face other challenges, including freezing
temperatures and
strong winds
• In deserts, high light levels
increase temperature and can
stress plants and animals
Fig. 52-9

Rocks and Soil
• Many characteristics of soil limit distribution of plants and thus the animals that feed
upon them:
– Physical structure
• The structure of the substrate (bottom surface) of marine and freshwater
environments determines which organisms can attach or burrow into it
– pH
• Extremely acidic or basic conditions are intolerable to most species
• pH of soil and water can also affect the solubility of nutrients and toxins
– Mineral composition
• Many organisms, especially photosynthesizers, require specific minerals to
undergo their normal life processes

Climate
• Climate, the long-term, prevailing weather conditions in a particular area, is
another major abiotic factor that limits the distribution of species
– Four major abiotic components of climate are temperature, water,
sunlight, and wind
• Climate patterns can be described on 2 scales:
– 1) Macroclimate consists of patterns on the global, regional, and local
level
– 2) Microclimate consists of very fine patterns, such as those
encountered by the community of organisms underneath a fallen log

Global Climate Patterns
• Earth’s global climate (macroclimate) patterns are determined
largely by solar energy and the planet’s movement in space
– Fluctuations in climates are caused primarily by:
• Latitudinal variations in sunlight intensity
• Seasonal variation in sunlight intensity
• Global air circulation and precipitation patterns
• Global wind patterns

Latitudinal Variation in Sunlight Intensity
• Earth’s curved shape causes latitudinal variation in the intensity of sunlight
– In those regions where sunlight strikes most directly, more heat and and light
per unit of surface area are delivered
• Sunlight strikes most directly in the tropics (regions that lie between 23.5
north latitude and 23.5
south latitude)
• At higher latitudes, sunlight strikes Earth at an oblique angle, thus
providing less
light energy to
these regions
Fig. 52-10b
Low angle of incoming sunlight
Sun directly overhead at equinoxes
Low angle of incoming sunlight
Atmosphere
90ºS (South Pole)60ºS
30ºS
23.5ºS (Tropic ofCapricorn)
0º (equator)
30ºN
60ºN
23.5ºN (Tropic ofCancer)
90ºN (North Pole)

Seasonal Variation in Sunlight Intensity
• Earth’s tilt (23.5
relative to its plane of orbit around the sun) causes seasonal
variation in the intensity of solar radiation
– The tropics experience the greatest annual input of solar radiation and the least
seasonal variation
– Seasonal variations of light and temperature increase toward the poles
• Ex) The Northern hemisphere tilts away from the sun, and thus has the
shortest day and longest
night during the December
solstice
Fig. 52-10c
March equinox
60ºN
30ºN
0º (equator)
30ºSJune solstice
Constant tiltof 23.5º
September equinox
December solstice
Global Air Circulation and Precipitation Patterns
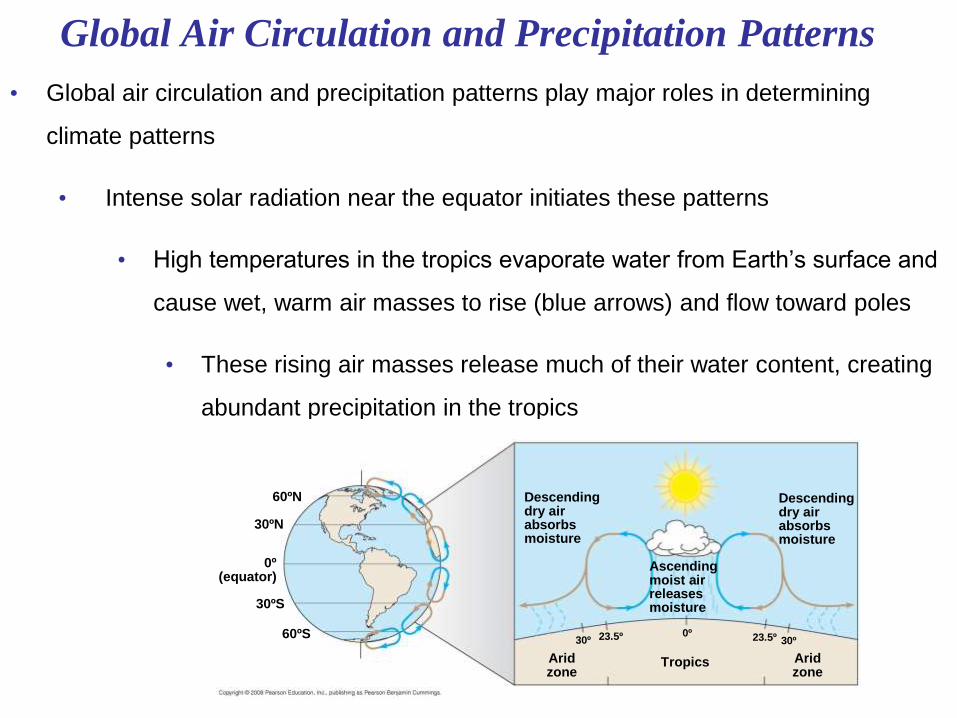
• Global air circulation and precipitation patterns play major roles in determining
climate patterns
• Intense solar radiation near the equator initiates these patterns
• High temperatures in the tropics evaporate water from Earth’s surface and
cause wet, warm air masses to rise (blue arrows) and flow toward poles
• These rising air masses release much of their water content, creating
abundant precipitation in the tropics
Fig. 52-10e
Descendingdry airabsorbsmoisture
Descendingdry airabsorbsmoisture
Ascendingmoist airreleasesmoisture
Aridzone
Aridzone
Tropics
30º 23.5º 0º 23.5º 30º
60ºN
30ºN
0º(equator)
30ºS
60ºS

• By the time these air masses reach high altitudes, they are dry and thus absorb
moisture from the land and they descend back down
• This creates an arid climate characteristic of deserts that are commonly found
at latitudes around 30
north and south
• Some of this descending air then flows toward the poles
• At latitudes around 60
north and south, the air masses rise again and release
abundant precipitation (though less than in the tropics)
• Then, this cold, dry air rises and flows to the poles
• Here, it descends and flows back toward the equator, absorbing moisture as it
goes, thus creating
the dry and bitterly
cold climates of the
polar regions
Fig. 52-10e
Descendingdry airabsorbsmoisture
Descendingdry airabsorbsmoisture
Ascendingmoist airreleasesmoisture
Aridzone
Aridzone
Tropics
30º 23.5º 0º 23.5º 30º
60ºN
30ºN
0º(equator)
30ºS
60ºS
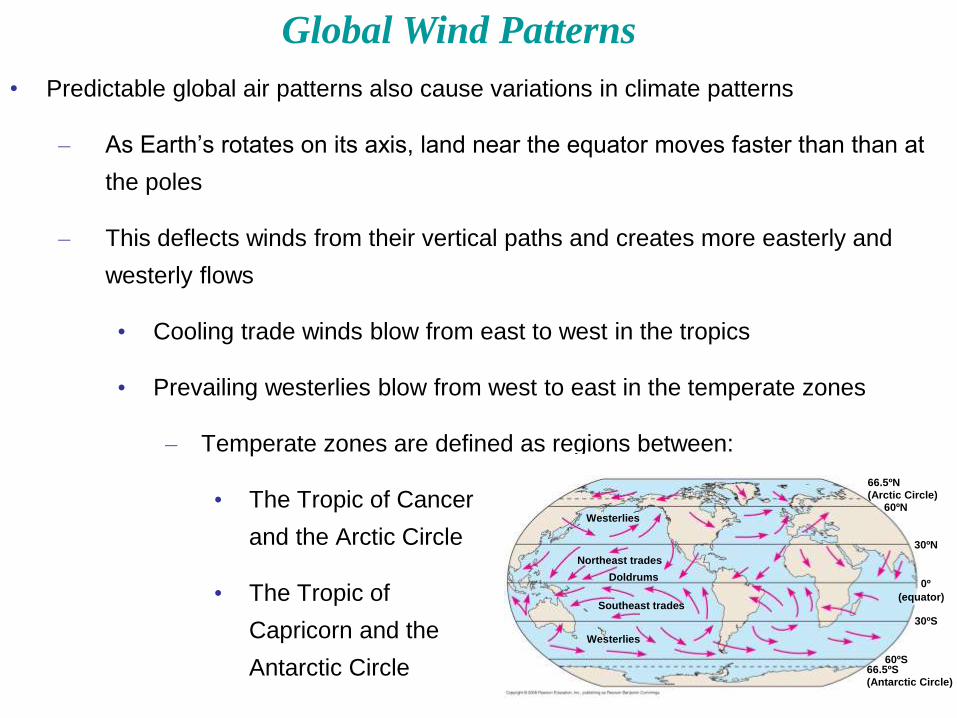
• Predictable global air patterns also cause variations in climate patterns
– As Earth’s rotates on its axis, land near the equator moves faster than than at
the poles
– This deflects winds from their vertical paths and creates more easterly and
westerly flows
• Cooling trade winds blow from east to west in the tropics
• Prevailing westerlies blow from west to east in the temperate zones
– Temperate zones are defined as regions between:
• The Tropic of Cancer
and the Arctic Circle
• The Tropic of
Capricorn and the
Antarctic Circle
Fig. 52-10f
0º
(equator)
30ºS
60ºS66.5ºS
(Antarctic Circle)
30ºN
66.5ºN
(Arctic Circle)60ºN
Westerlies
Northeast trades
Doldrums
Southeast trades
Westerlies
Global Wind Patterns
Regional, Local, and Seasonal Effects on Climate
• Proximity to bodies of water and topographic
features (ex: mountain ranges) also contribute
to local variations in climate
– Seasonal variation also influences climate

• Ocean currents influence climate along the coasts of continents by heating or cooling
overlying air masses that pass over land
– A system of deep ocean circulation called the great ocean conveyor belt is
also particularly influential
• Water is warmed at the equator and flows along the ocean surface to the
North Atlantic
• As the water moves to higher latitudes, it cools and becomes denser,
sinking thousands of meters and displacing warmer water back toward the
surface
– Warmer water near the equator heats overlying air masses, while colder water
at increasing latitudes cools the air, which may then pass across the land
• Ex) The west coast of
northern Europe has a
mild climate because
the Gulf Stream carries
warm water from the
equator to the North
Atlantic
Fig. 52-11
Labrador
current
Gulf
stream
Equator
Cold water
Warmwater

• The high specific heat of water (its ability to retain heat) also helps to moderate
climate of coastal regions
– On a hot day, the land is warmer than nearby bodies of water, causing air over
the land to heat up
• As this air heats, it rises to high elevations and is replaced by cooler air
from over the water
– The opposite effect is seen at night
• Water that has absorbed heat throughout the day is now warmed, causing
the overlying air to also warm
– This warmer air rises,
drawing cooler air from land
back over the water
– The cooler air is then
replaced with warmer
air from offshore
Fig. 52-12
Warm airover land rises.1
23
4
Air cools athigh elevation.
Cool air over watermoves inland, replacingrising warm air over land.
Coolerair sinksover water.
• Mountains also affect climate because they have a significant effect on:
– The amount of sunlight reaching an area
• South-facing slopes in the Northern Hemisphere receive more sunlight
than nearby north-facing slopes, creating warmer and drier conditions
– These abiotic differences influence species distribution
• Ex) In many mountains of western North America, spruce and
conifers occupy the cooler, north-facing slopes, while shrubby,
drought-resistant plants inhabit the south-facing slopes
– Local temperature
• Every 1000 meter increase in elevation produces a temperature drop of ~
6
C, equivalent to the decrease in temperature caused by an 880 km
increase in latitude

• Mountains also have a significant effect on rainfall
– As moist air moves in off the ocean and encounters the windward side
of a mountain, it flows upward
• This ascending air cools at higher altitudes and drops a large
amount of water in the form of precipitation
• By the time this air reaches the leeward side of the mountain, it is
cooler and drier
– This creates a “rain shadow” on this side of the mountain as
dry air picks up any available moisture from the area below
• As a result, deserts commonly occur on the leeward side of
mountain ranges
Fig. 52-13
Winddirection
Mountainrange
Leeward sideof mountain
Ocean

• Seasonal changes also influence climate
– The angle of the sun produced by Earth’s tilted axis leads to many global
changes, especially in middle to high latitudes:
• Changes in day length
• Variation in amounts of solar radiation
• Changes in temperature
– The changing angle of the sun over the course of a year also affects local
environments
• The belts of warm and dry air on either side of the equator move slightly
with the changing angle of the sun
– This produces the “wet” and “dry” seasons characteristic of the tropical
regions that lie around 20
N and 20
S of the equator
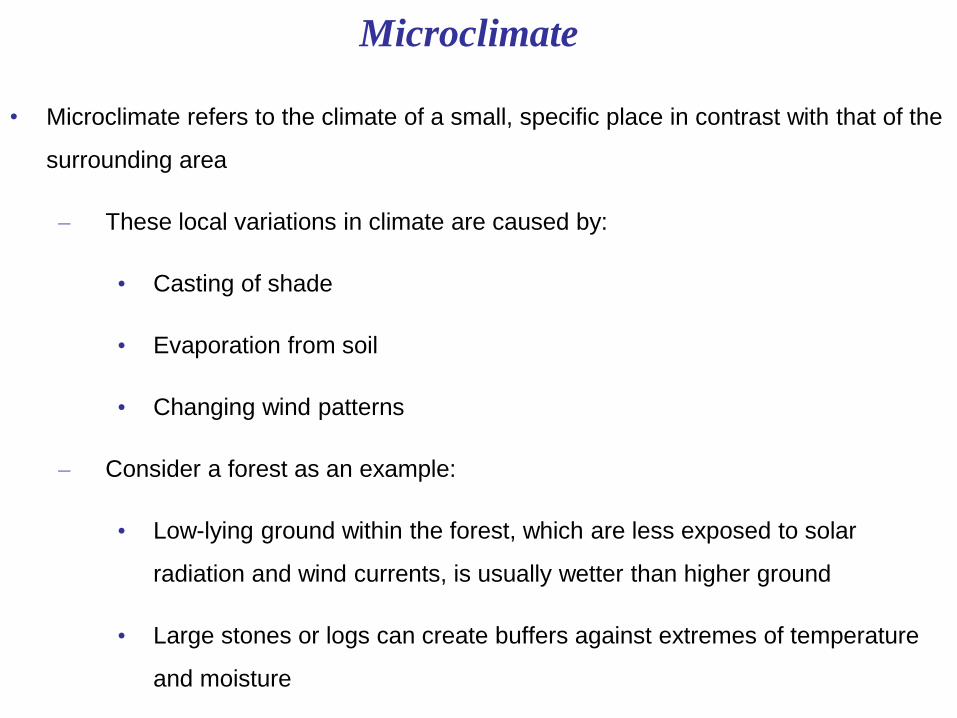
Microclimate
• Microclimate refers to the climate of a small, specific place in contrast with that of the
surrounding area
– These local variations in climate are caused by:
• Casting of shade
• Evaporation from soil
• Changing wind patterns
– Consider a forest as an example:
• Low-lying ground within the forest, which are less exposed to solar
radiation and wind currents, is usually wetter than higher ground
• Large stones or logs can create buffers against extremes of temperature
and moisture

Long-Term Climate Change
• Global climate changes currently under way will profoundly affect the biosphere
– One way to predict the effects of future global climate change is to study
previous changes, since the last ice age ended
• As glaciers began retreating 16,000 years ago, for example, tree
distribution patterns changed, expanding northward
– Based on climate-change models, as climate continues to warm, many species
will be forced to expand their natural ranges in order to survive
• Ex) The American beech will need to move 7-9 km per year northward to
keep pace with the warming climate
• Since the end of the last ice age,
however, the beech has
migrated only ~0.2 km per year
– Thus, species that have difficulty
dispersing may have smaller
ranges or could become extinct
Fig. 52-14
Currentrange
Predictedrange
Overlap
(a) 4.5ºC warming overnext century
(b) 6.5ºC warming overnext century

Concept Check 52.2
• 1) Give examples of human actions that could expand a
species’ distribution by changing its (a) dispersal or (b) biotic
interactions.
• 2) Explain how the sun’s unequal heating of Earth’s surface
influences global climate patterns.
• 3) You suspect that deer are restricting the distribution of a tree
species by preferentially eating the seedlings of the tree. How
might you test that hypothesis?
Concept 52.3: Aquatic biomes are diverse and dynamic
systems that cover most of Earth
• Varying combinations of biotic and abiotic factors determine the
nature of Earth’s many biomes
– Biomes are the major ecosystems that occupy broad
geographic regions of land or water
• Terrestrial biomes are generally characterized by
vegetation type
• Aquatic biomes are classified based on the physical
environment

• Aquatic biomes account for the largest part of the biosphere in terms of area
– Ecologists classify these aquatic biomes on the basis of physical and chemical
characteristics
• Ex) They can contain fresh water or salt water (marine)
– Oceans make up the largest marine biome, covering about 75% of Earth’s
surface
• Their vast size accounts for the enormous impact they have on the
biosphere
– Evaporation of water from the oceans provides most of the planet’s
rainfall
– Ocean temperatures have a major effect on world climate and wind
patterns
– Marine algae and
photosynthetic bacteria
supply a substantial portion
of the world’s oxygen and
consume large amounts of
atmospheric carbon dioxide
Fig. 52-15
LakesCoral reefs
RiversOceanicpelagic andbenthic zonesEstuaries
Intertidal zones
Tropic ofCancer
Equator
Tropic ofCapricorn
30ºN
30ºS

Stratification of Aquatic Biomes
• Many aquatic biomes are stratified (layered) into zones defined by:
– Light penetration
• Photic zone: the upper portion of an aquatic biome where there is
sufficient light for photosynthesis
• Aphotic zone: the lower region of an aquatic biome where little
light penetrates
Fig. 52-16
Littoralzone Limnetic
zone
Photiczone
PelagiczoneBenthic
zoneAphoticzone
(a) Zonation in a lake (b) Marine zonation
2,000–6,000 mAbyssal zone
Benthiczone
Aphoticzone
Pelagiczone
Continentalshelf
200 mPhotic zone
0
Oceanic zoneNeritic zone
Intertidal zone

• The shallow, well-lighted waters close to the shore make up the littoral
zone of lakes
– This zone is home to rooted and floating aquatic plants
• Deeper water farther from shore makes up the limnetic zone
• This zone is inhabited by a variety of phytoplankton and
cyanobacteria, as well as small drifting heterotrophs, such as
zooplankton
• The benthic zone is inhabited by
assorted invertebrates whose species
composition depends partly on oxygen
levels
– Fishes lives in all lake zones
with sufficient oxygen
Fig. 52-16a
Littoralzone Limnetic
zone
Photiczone
PelagiczoneBenthic
zoneAphoticzone
(a) Zonation in a lake

• Many aquatic biomes are stratified (layered) into zones defined by:
– Depth
• Benthic zone: the bottom portion of all aquatic biomes, composed of
organic and inorganic sediment
– The communities of organisms that inhabit the benthic zone are
collectively called the benthos
• A major source of food for many benthic species is dead organic
matter that falls from the productive surface water called detritus
• Abyssal zone: the most extensive part of the ocean that lies within the
benthic zone
at a depth of
between 2000
and 6000
meters
Fig. 52-16
Littoralzone Limnetic
zone
Photiczone
PelagiczoneBenthic
zoneAphoticzone
(a) Zonation in a lake (b) Marine zonation
2,000–6,000 mAbyssal zone
Benthiczone
Aphoticzone
Pelagiczone
Continentalshelf
200 mPhotic zone
0
Oceanic zoneNeritic zone
Intertidal zone

• Many aquatic biomes are stratified (layered) into zones defined by:
– Temperature
• Thermocline: a narrow layer of abrupt temperature change separating the
more uniformly warm upper layer from the more uniformly cold deeper
waters
– The water temperature is determined by how much sunlight
penetrates at a particular depth
• Many lakes undergo a semiannual mixing of their waters called turnover
• Turnover mixes oxygenated water from the surface with nutrient-
rich water from the bottom
Fig. 52-16
Littoralzone Limnetic
zone
Photiczone
PelagiczoneBenthic
zoneAphoticzone
(a) Zonation in a lake (b) Marine zonation
2,000–6,000 mAbyssal zone
Benthiczone
Aphoticzone
Pelagiczone
Continentalshelf
200 mPhotic zone
0
Oceanic zoneNeritic zone
Intertidal zone
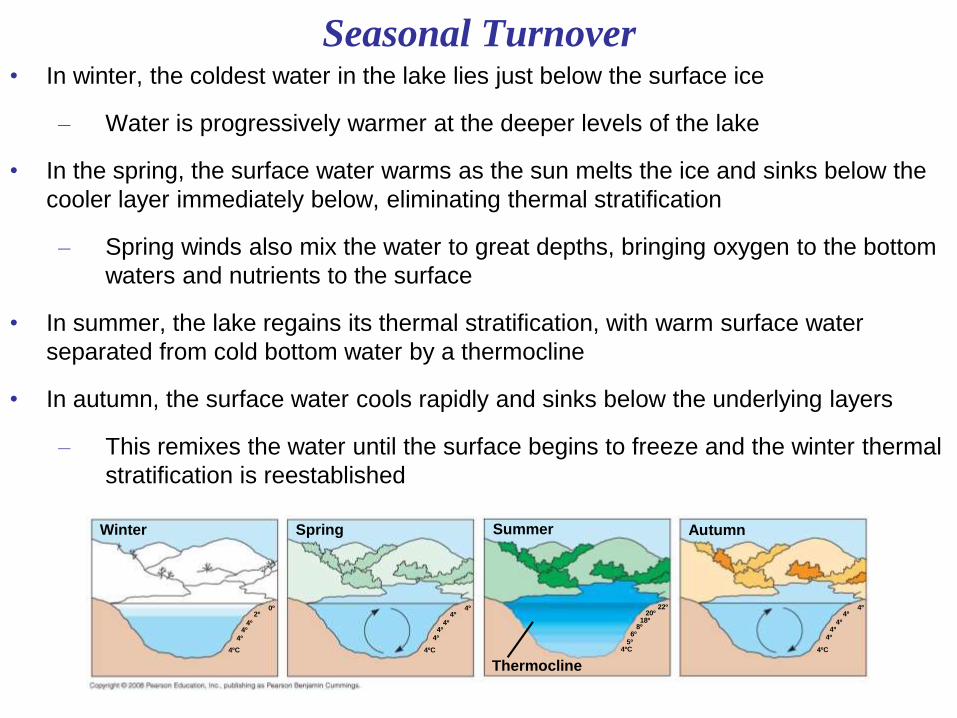
Seasonal Turnover • In winter, the coldest water in the lake lies just below the surface ice
– Water is progressively warmer at the deeper levels of the lake
• In the spring, the surface water warms as the sun melts the ice and sinks below the
cooler layer immediately below, eliminating thermal stratification
– Spring winds also mix the water to great depths, bringing oxygen to the bottom
waters and nutrients to the surface
• In summer, the lake regains its thermal stratification, with warm surface water
separated from cold bottom water by a thermocline
• In autumn, the surface water cools rapidly and sinks below the underlying layers
– This remixes the water until the surface begins to freeze and the winter thermal
stratification is reestablished
Fig. 52-17-5
Winter
4º4º
4º
4ºC
4º4º
Spring Summer Autumn
Thermocline
4º4º
4º
4ºC
4º4º
4º4º
4º
4ºC
2º0º
4ºC5º6º
8º18º
20º22º
Aquatic Biomes
• Major aquatic biomes can be characterized by
their:
– Physical environment
– Chemical environment
– Geological features
– Photosynthetic organisms
– Heterotrophs
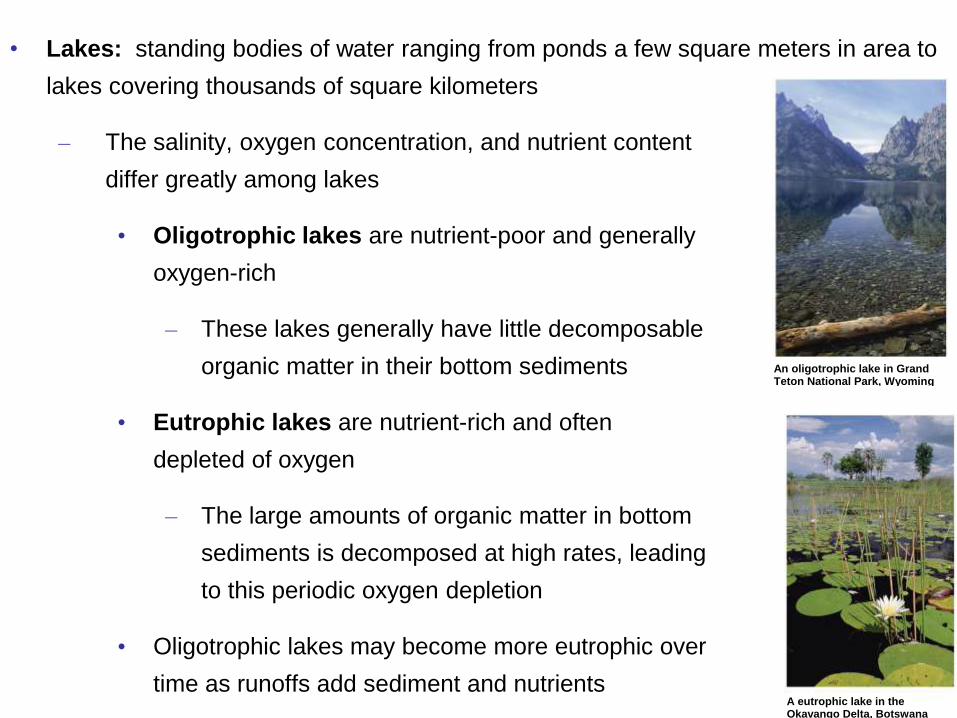
• Lakes: standing bodies of water ranging from ponds a few square meters in area to
lakes covering thousands of square kilometers
– The salinity, oxygen concentration, and nutrient content
differ greatly among lakes
• Oligotrophic lakes are nutrient-poor and generally
oxygen-rich
– These lakes generally have little decomposable
organic matter in their bottom sediments
• Eutrophic lakes are nutrient-rich and often
depleted of oxygen
– The large amounts of organic matter in bottom
sediments is decomposed at high rates, leading
to this periodic oxygen depletion
• Oligotrophic lakes may become more eutrophic over
time as runoffs add sediment and nutrients
Fig. 52-18a
An oligotrophic lake in GrandTeton National Park, Wyoming
Fig. 52-18b
A eutrophic lake in theOkavango Delta, Botswana

• A wetland is a habitat that is inundated (flooded) by water at least some of the time
and that supports plants adapted to water-saturated soil
– Some wetlands are inundated at all times, whereas others flood infrequently
• Both water and soils in wetlands are periodically low in dissolved oxygen
– This is due to high organic production by plants and decomposition by
microbes and other organisms
• Wetlands are among the most productive biomes on Earth
– Their water-saturated soils favor
growth of plants that have
adaptations enabling them to grow
in water or soil that is periodically
anaerobic
• Ex) Floating pond lilies
– Wetlands are also home to a diverse
community of invertebrates, birds,
crustaceans, dragonflies, otters,
alligators, and owls
Fig. 52-18c
Okefenokee National Wetland Reserve in Georgia

• Wetlands can be classified according to where they develop:
– Basin wetlands: develop in shallow basins, ranging from upland
depressions to filled-in lakes and ponds
– Riverine wetlands: develop along shallow and periodically
flooded banks of rivers and streams
– Fringe wetlands: occur along the coasts of large lakes and
seas, where water flows back and forth because of rising lake
levels or tidal action
• Fringe wetlands include
both freshwater and
marine biomes
Fig. 52-18c
Okefenokee National Wetland Reserve in Georgia
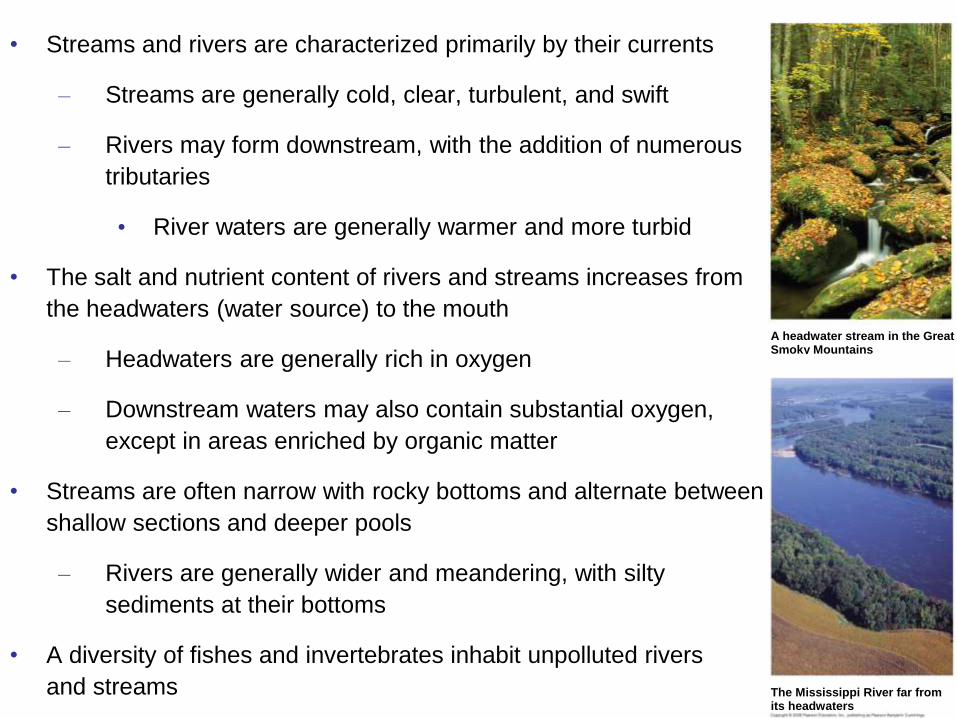
• Streams and rivers are characterized primarily by their currents
– Streams are generally cold, clear, turbulent, and swift
– Rivers may form downstream, with the addition of numerous
tributaries
• River waters are generally warmer and more turbid
• The salt and nutrient content of rivers and streams increases from
the headwaters (water source) to the mouth
– Headwaters are generally rich in oxygen
– Downstream waters may also contain substantial oxygen,
except in areas enriched by organic matter
• Streams are often narrow with rocky bottoms and alternate between
shallow sections and deeper pools
– Rivers are generally wider and meandering, with silty
sediments at their bottoms
• A diversity of fishes and invertebrates inhabit unpolluted rivers
and streams
Fig. 52-18d
A headwater stream in the GreatSmoky Mountains
Fig. 52-18e
The Mississippi River far fromits headwaters

• An estuary is a transition area between river and sea
– Seawater flows up the estuary channel during a rising tide and flows back
during the falling tide
• The higher-density seawater often occupies the bottom of these channels
and mixes little with the lower-density river water at the surface
– Salinity of estuaries varies with the rise and fall of the tides
• Estuaries are nutrient rich and highly productive
– Saltmarsh grasses and algae, including
phytoplankton, are the major producers
in estuaries
– An abundant supply of food attracts marine
invertebrates and fish
Fig. 52-18f
An estuary in a low coastal plain of Georgia
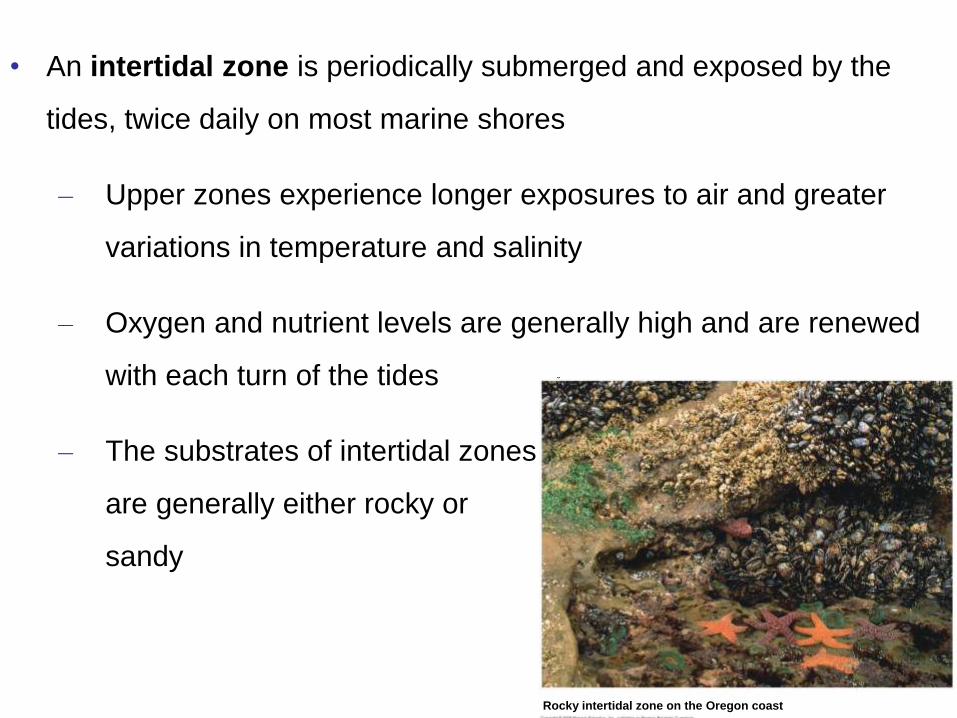
• An intertidal zone is periodically submerged and exposed by the
tides, twice daily on most marine shores
– Upper zones experience longer exposures to air and greater
variations in temperature and salinity
– Oxygen and nutrient levels are generally high and are renewed
with each turn of the tides
– The substrates of intertidal zones
are generally either rocky or
sandy
Fig. 52-18g
Rocky intertidal zone on the Oregon coast

• Changes in physical conditions from the upper to the lower intertidal zones limit the
distribution of many organisms to particular strata
– Intertidal organisms are challenged by variations in temperature and salinity
and by the mechanical forces of wave action
• A high diversity of attached marine algae inhabit rocky intertidal zones,
especially in the lower zones
– Sandy intertidal zones exposed to vigorous wave action generally lack
attached plants or algae
– Sandy intertidal zones in protected bays or lagoons often support rich
beds of sea grass and algae
• Many animals of rocky intertidal environments have structural adaptations
that enable them to attach to the hard substrate
– Many animals in sandy or muddy intertidal zones, including worms,
clams, and crustaceans, bury themselves as feed as the tide brings in
sources of food

• The oceanic pelagic biome is a vast realm of open blue water, constantly mixed by
wind-driven oceanic currents
– This biome covers approximately 70% of Earth’s surface and has an average
depth of ~4000 meters
• The deepest point in the ocean is more than 10,000 meters
– Oxygen levels are generally high and nutrient concentrations are generally
lower than in coastal waters
• Phytoplankton and zooplankton are the dominant organisms in this biome
– Photosynthetic plankton account for about half of the photosynthetic activity on
Earth
• Also found are free-swimming animals,
such as large squids, fishes, sea turtles
and marine mammals
Fig. 52-18h
Open ocean off the island of Hawaii

• Coral reefs are formed from the calcium carbonate skeletons of corals (phylum
Cnidaria)
– Shallow corals live in the photic zone of tropical marine environments with high
water clarity
– Deep-sea corals are also found 200-1500 meters below the water surface
• Corals require high oxygen levels as well as a solid substrate for attachment
– A typical coral reef begins as a fringing reef on a young, high island
– Later in the history of the island, it forms an offshore barrier reef
– As the island gets older and submerges,
it becomes a coral atoll
• Unicellular algae live within the tissues of the
corals and form a mutualistic relationship that
provides the corals with organic molecules
– Fish and invertebrate diversity is also
exceptionally high in these areas
Fig. 52-18i
A coral reef in the Red Sea

• The marine benthic zone consists of the seafloor below the surface waters of the
coastal, or neritic, zone and the offshore pelagic zone
– Except for the shallow coastal areas, the marine benthic zone receives no
sunlight
– Water temperature declines with depth, while pressure increases
• Organisms in the very deep benthic, or abyssal, zone are adapted to
continuous cold and very high water pressure
– Oxygen is present at sufficient concentrations to support a variety of life forms
• Photosynthetic organisms, mainly seaweeds and algae, are limited to
shallow benthic areas with sufficient light
• Chemoautotrophic prokaryotes
are found near deep-sea
hydrothermal vents
• Neritic benthic communities
include numerous invertebrates
and fishes
Fig. 52-18j
A deep-sea hydrothermal vent community

Concept Check 52.3
• 1) Many organisms living in estuaries experience fresh and saltwater
conditions each day with the rising and falling of tides. What
challenge does this pose for the physiology of the organisms?
• 2) Why are phytoplankton, and not benthic algae or rooted aquatic
plants, the dominant photosynthetic organisms in the ocean pelagic
zone?
• 3) Water leaving a reservoir behind a dam is often taken from deep
layers of the reservoir. Would you expect fish found in a river below
a dam in summer to be species that prefer colder or warmer water
than fish found in the undammed river? Explain.

Concept 52.4: The structure and distribution of terrestrial
biomes are controlled by climate and disturbance

• Climate is very important in determining why terrestrial biomes are
found in certain areas
– Latitudinal patterns of climate over Earth’s surface produces the
latitudinal patterns of biome distribution
– These biome patterns can, in turn, be modified by disturbances,
such as a storms, fires, or human activity
Fig. 52-19
Tropical forest
Savanna
Desert
Chaparral
Temperategrassland
Temperatebroadleaf forest
Northernconiferous forest
Tundra
High mountains
Polar ice
30ºN
Tropic ofCancer
Equator
Tropic ofCapricorn
30ºS

Climate and Terrestrial Biomes • Climate also has a great impact on the distribution of organisms
– This can be illustrated with a climograph, a plot of the temperature and
precipitation in a region
• Ex) Notice that the range of precipitation in northern coniferous forests is
similar to that in temperate forests, but the temperatures are different
• Biomes are also affected by the pattern of temperature and precipitation through the
year
– Some areas may receive regular
precipitation throughout the year,
whereas other areas with the same
annual precipitation have distinct wet
and dry seasons
• This explain why areas with
similar values for annual
temperature and precipitation
contain different biomes
Fig. 52-20
Tropical forestTemperate grasslandDesert
Temperatebroadleafforest
Northernconiferousforest
Arctic andalpinetundraA
nn
ual m
ean
tem
pera
ture
(ºC
)
Annual mean precipitation (cm)
30
15
0
0
–15
100 200 300 400

General Features of Terrestrial Biomes and the Role of Disturbance
• Terrestrial biomes are often named for major physical or climatic
factors and for their predominant vegetation
– Ex) Temperate grasslands are generally found in middle
latitudes, where the climate is more moderate (temperate) than
in the tropics or polar regions and are also dominated by various
grass species
• Terrestrial biomes usually grade into each other, without sharp
boundaries
– The area of intergradation, called an ecotone, may be wide or
narrow

• Vertical layering is also an important feature of terrestrial biomes
– In many forests, the layers from top to bottom consist of:
• The upper canopy
• The low-tree area
• The shrub understory
• The ground layer of herbaceous plants
• The forest floor (the litter area)
• The root layer
– Nonforest biomes have similar, though usually less pronounced, layers
– Grasslands have an herbaceous layer of grasses and forbs (small broadleaf
plants), a litter layer, and a root layer
• Layering of vegetation provides many different habitats for animals, which often
occupy well-defined feeding areas
– Ex) Insectivorous birds and bats feed above canopies, while small mammals,
numerous worms, and arthropods search for food in the litter and root layers

Terrestrial Biomes
• Terrestrial biomes can be characterized by:
– Distribution
– Precipitation
– Temperature
– Plants
– Animals
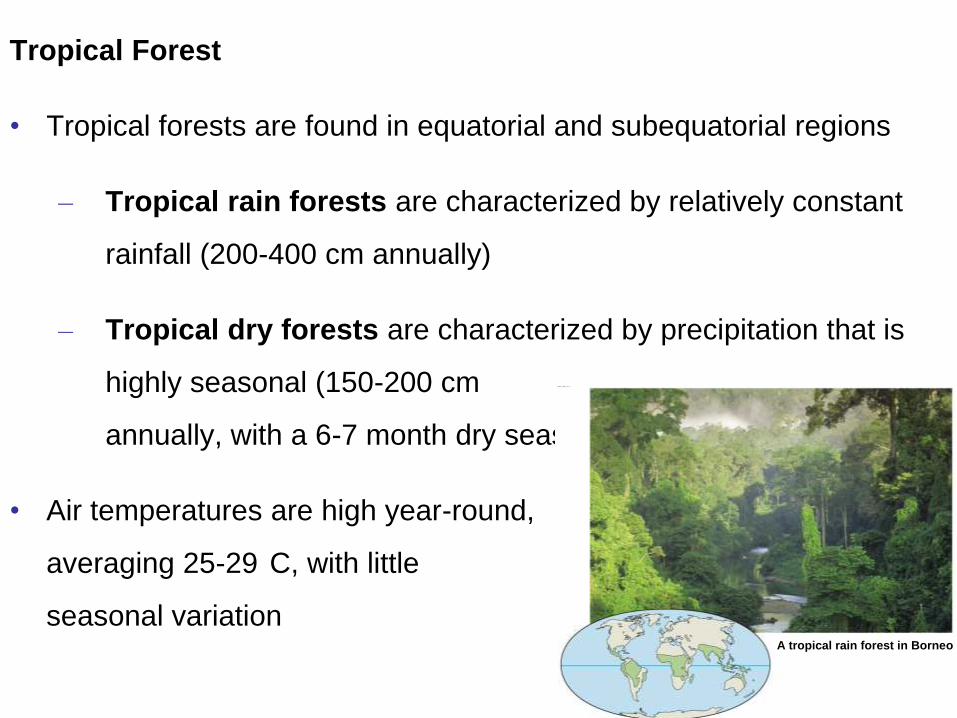
Tropical Forest
• Tropical forests are found in equatorial and subequatorial regions
– Tropical rain forests are characterized by relatively constant
rainfall (200-400 cm annually)
– Tropical dry forests are characterized by precipitation that is
highly seasonal (150-200 cm
annually, with a 6-7 month dry season)
• Air temperatures are high year-round,
averaging 25-29
C, with little
seasonal variation
Fig. 52-21a
A tropical rain forest in Borneo
Tropical Forest
• Plants: tropical forests are vertically layered and competition for light is intense
– The top layer includes emergent trees that grow above a closed canopy
• The next layer includes a canopy of trees
• Below, are one to two layers of subcanopy trees
• Shrub and herb layers are found on the forest floor
– Broadleaf evergreen trees are dominant in tropical rainforests
• Tropical dry forest trees drop their leaves during the dry season
• Animals: animal diversity is higher in tropical forests than in any other terrestrial biome
– Millions of animal species, including an estimated 5–30 million still undescribed species of insects, spiders, and other arthropods, live within these forests

Desert
• Deserts occur in bands near 30
north and south latitude or at other latitudes in the
interior of continents
– Precipitation is low and highly variable, generally less than 30 cm per year
– Deserts may be hot (above 50
C) or cold (below -30
C), with temperatures
varying seasonally and daily
• Plants: desert landscapes are dominated by low, widely scattered vegetation
– Desert plants adaptations include heat and desiccation tolerance, water
storage, and reduced leaf surface area
• Common desert animals include many
kinds of snakes and lizards, scorpions,
ants, beetles, migratory and resident
birds, and seed-eating rodents
– Many are nocturnal and have
adaptations for water conservation
Fig. 52-21b
A desert in the southwesternUnited States
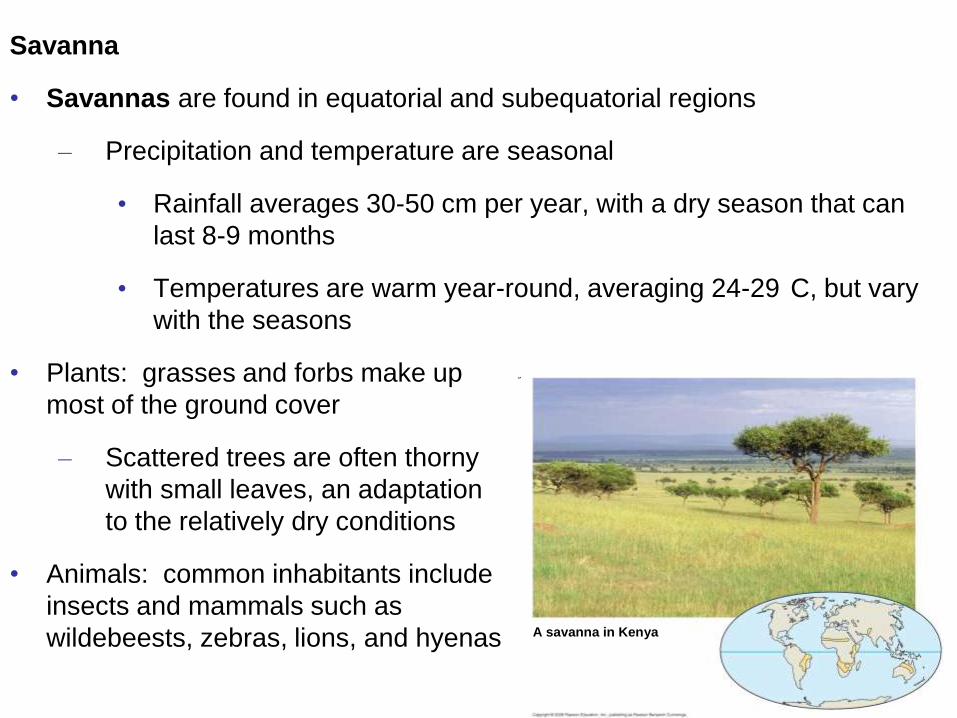
Savanna
• Savannas are found in equatorial and subequatorial regions
– Precipitation and temperature are seasonal
• Rainfall averages 30-50 cm per year, with a dry season that can
last 8-9 months
• Temperatures are warm year-round, averaging 24-29
C, but vary
with the seasons
• Plants: grasses and forbs make up
most of the ground cover
– Scattered trees are often thorny
with small leaves, an adaptation
to the relatively dry conditions
• Animals: common inhabitants include
insects and mammals such as
wildebeests, zebras, lions, and hyenas
Fig. 52-21c
A savanna in Kenya
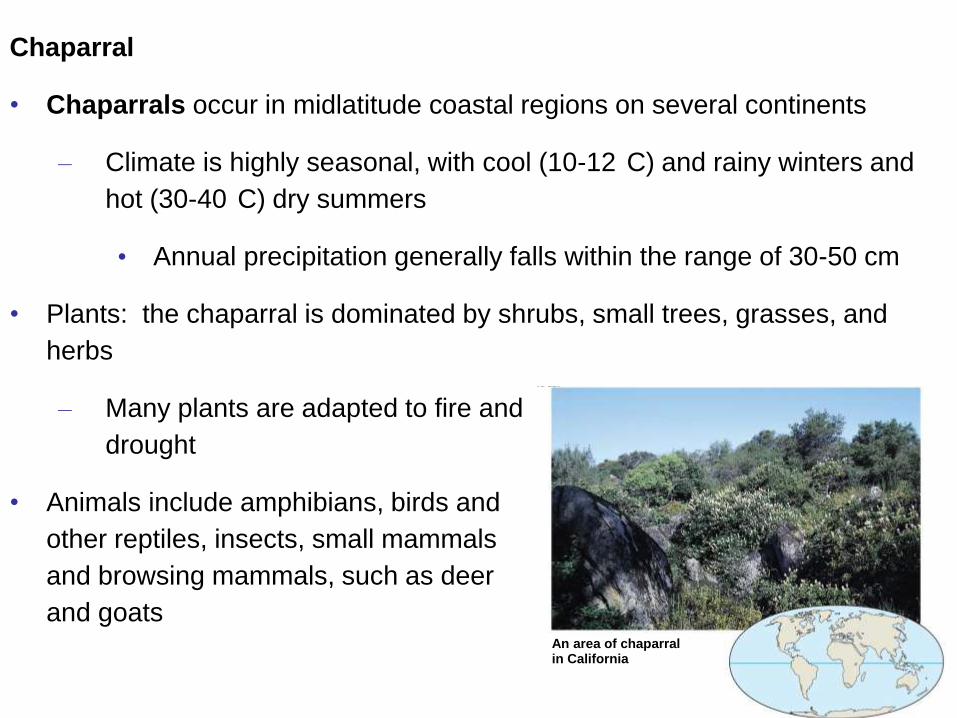
Chaparral
• Chaparrals occur in midlatitude coastal regions on several continents
– Climate is highly seasonal, with cool (10-12
C) and rainy winters and
hot (30-40
C) dry summers
• Annual precipitation generally falls within the range of 30-50 cm
• Plants: the chaparral is dominated by shrubs, small trees, grasses, and
herbs
– Many plants are adapted to fire and
drought
• Animals include amphibians, birds and
other reptiles, insects, small mammals
and browsing mammals, such as deer
and goats
Fig. 52-21d
An area of chaparralin California

Temperate Grassland
• Temperate grasslands are found on many continents
– Winters are cold (below -10
C) and dry, while summers are wet and hot
(averaging 30
C)
• Annual precipitation generally averages between 30-100 cm, with
periodic drought
• Plants: the dominant plants, grasses and forbs, are adapted to droughts and
fire
– Grazing by large mammals helps
prevent establishment of woody
shrubs and trees
• Animals: native mammals include
large grazers, such as bison and
wild horses, and small burrowers,
such as prairie dogs
Fig. 52-21e
Sheyenne National Grasslandin North Dakota

Northern Coniferous Forest
• The northern coniferous forest, or taiga, extends across northern North
America and Eurasia and is the largest terrestrial biome on Earth
– Annual precipitation generally ranges from 30-70 cm, with periodic
drought
• Some coastal coniferous forest of the U.S. Pacific Northwest are
temperate rain forests that may receive over 300 cm of annual
precipitation
– Winters are cold and long while
summers may be hot
• Temperatures can vary from
-50
C in winter to over 20
C
in the summer in Siberian
coniferous forests
Fig. 52-21f
Rocky Mountain National Parkin Colorado

Northern Coniferous Forest
• Plants: cone-bearing trees, such as pines and firs, dominate these
forests
– The conical shape of many conifers prevents too much snow
from accumulating and breaking their branches
• Animals: animals include migratory and resident birds, and large
mammals, such as moose, brown bears, and Siberian tigers Fig. 52-21f
Rocky Mountain National Parkin Colorado
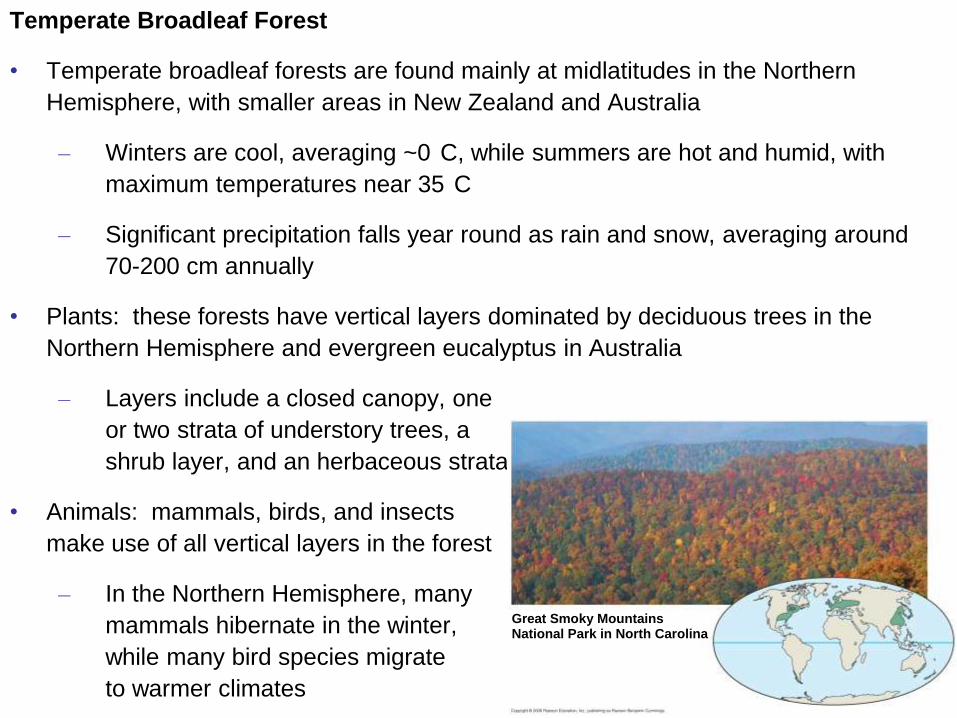
Temperate Broadleaf Forest
• Temperate broadleaf forests are found mainly at midlatitudes in the Northern
Hemisphere, with smaller areas in New Zealand and Australia
– Winters are cool, averaging ~0
C, while summers are hot and humid, with
maximum temperatures near 35
C
– Significant precipitation falls year round as rain and snow, averaging around
70-200 cm annually
• Plants: these forests have vertical layers dominated by deciduous trees in the
Northern Hemisphere and evergreen eucalyptus in Australia
– Layers include a closed canopy, one
or two strata of understory trees, a
shrub layer, and an herbaceous strata
• Animals: mammals, birds, and insects
make use of all vertical layers in the forest
– In the Northern Hemisphere, many
mammals hibernate in the winter,
while many bird species migrate
to warmer climates
Fig. 52-21g
Great Smoky MountainsNational Park in North Carolina
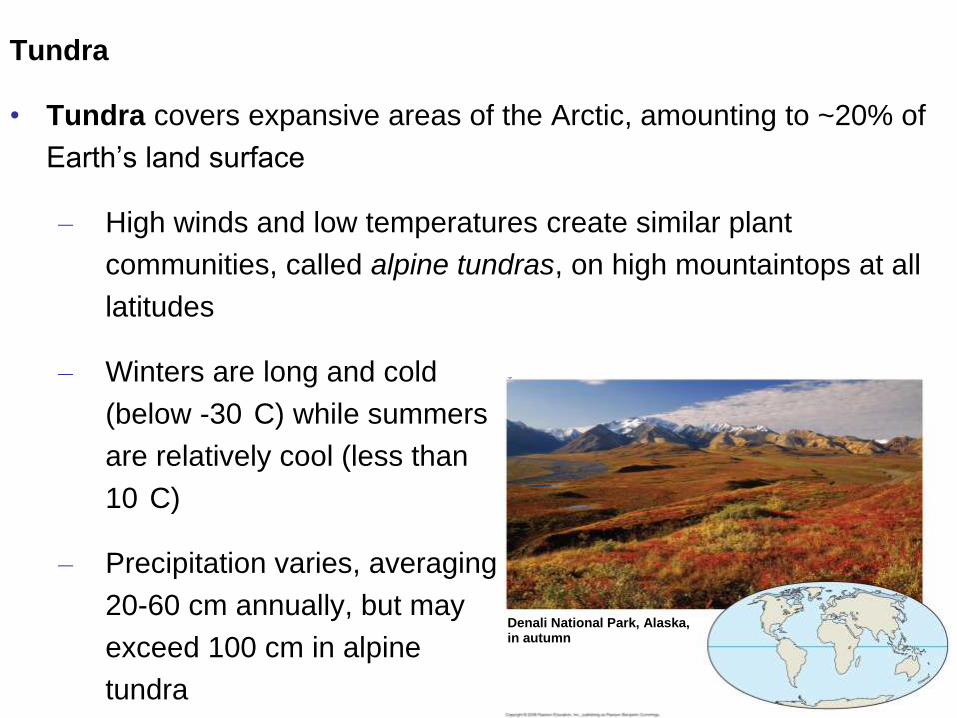
Tundra
• Tundra covers expansive areas of the Arctic, amounting to ~20% of
Earth’s land surface
– High winds and low temperatures create similar plant
communities, called alpine tundras, on high mountaintops at all
latitudes
– Winters are long and cold
(below -30
C) while summers
are relatively cool (less than
10
C)
– Precipitation varies, averaging
20-60 cm annually, but may
exceed 100 cm in alpine
tundra
Fig. 52-21h
Denali National Park, Alaska,in autumn

Tundra
• Plants: vegetation is mostly herbaceous, consisting of a mixture of mosses, grasses,
and forbs
– Permafrost, a permanently frozen layer of soil, prevents water infiltration and
restricts the growth of plant roots
• Animals: large, grazing musk oxen remain resident year-round, while caribou and
reindeer are migratory
– Predators include bears, wolves,
and foxes
– Many bird species migrate to the
tundra for summer nesting
Fig. 52-21h
Denali National Park, Alaska,in autumn
Concept Check 52.4
• 1) Based in the climograph in Figure 52.20 (pp. 1167), what
mainly differentiates dry tundra and deserts?
• 2) Identify the natural biome in which you live and summarize
its abiotic and biotic characteristics. Do these reflect your
actual surroundings? Explain.
• 3) If global warming increases average temperatures on Earth
by 4oC in this century, predict which biome is most likely to
replace tundra in some locations as a result. Explain your
answer.
You should now be able to:
1. Distinguish among the following types of
ecology: organismal, population, community,
ecosystem, and landscape
2. Explain how dispersal may contribute to a
species’ distribution
3. Distinguish between the following pairs of
terms: potential and actual range, biotic and
abiotic factors, macroclimate and microclimate
patterns

4. Explain how a body of water or mountain
range might affect regional climatic conditions
5. Define the following terms: photic zone,
aphotic zone, benthic zone, abyssal zone,
thermal stratification, thermocline, seasonal
turnover, climograph, disturbance
6. List and describe the characteristics of the
major aquatic biomes
7. List and describe the characteristics of the
major terrestrial biomes
8. Compare the vertical layering of a forest and
grassland