an introduction to enso and its impact on indiana...
TRANSCRIPT

Popular version
Edited by Ken Scheeringa 2 Apr 2009
An Introduction to ENSO and its impact on Indiana
Weather and Climate
Joseph W. Mays, Data Specialist
Dr. Dev Niyogi, State Climatologist
Ken Scheeringa, Associate State Climatologist
Indiana State Climate Office 201, Life Science Plant and Soils Laboratory
915 W. State Street Purdue University
West Lafayette, IN 47907-2054 Phone: (765) 494-6574
Email: [email protected] Web: www.iclimate.org

INTRODUCTION There are multiple natural occurrences that contribute to variations in global and
local weather. Many of these occurrences are overlooked except by scientists. However El Niño is one of the most publicized because it impacts not only weather but world economies as well. What impact does this event, and together with La Niña forming a part of the El Niño-Southern Oscillation (ENSO), have on weather around the globe, in the United States, and in Indiana?
This publication was written to help you better understand the climate events that are known as ENSO. It will provide you with information about El Niño and La Niña, their behavior, and the impacts these events have on a global and local scale. BACKGROUND – E El N Nino S Southern O Oscillation WHAT ARE EL NIÑO, LA NIÑA, AND THE SOUTHERN OSCILLATION?
The ocean and atmosphere are a coupled system. For example, a change in the atmosphere may affect ocean temperatures or currents. These ocean changes may then feed back and cause another change in the atmosphere to complete the cycle. El Niño and La Niña are alternating patterns of ocean surface temperature, wind flow, and air pressure. This occurs by exchanging energy between the ocean and the atmosphere in the Pacific near the equator. The name ENSO wraps all these energy changes together into one term.
Neutral conditions Normal – or neutral – conditions exist when neither El Nino nor La Nina is active. Trade winds near the equator blow towards the west. These winds push warm ocean surface water westward, building up a mound of warm water off the east coast of Indonesia. The sea surface may build to as much as 1½ feet higher there than along the west coast of South America! The Indonesian surface waters may reach temperatures that are 14°F warmer than those across the ocean in the eastern Pacific.
This temperature difference plays an important part in setting up world circulation patterns, both in the atmosphere and in the ocean. Many natural events are set in motion. The jet stream, high altitude wind currents, adjust their travel path around the globe to align with changing temperature patterns. This in turn causes weather patterns to adjust.
Strong upwelling of cold, nutrient rich waters from the ocean bottom are brought to the ocean surface along the western coast of South America. This new surface water is known as a “cold tongue” which travels north along the western coast of South America and then westward along the equator. Once this colder water reaches Indonesia at the other end of the Pacific, it sinks. Along the way to Indonesia, air rises in areas of warmer water producing strong storms. These storms bring rain to Indonesia, Australia, and other countries in the western Pacific.

El Niño During an El Niño the atmosphere and ocean change from their normal state. An El
Niño occurs when the tropical Pacific sea surface temperatures rise higher than normal over large areas of the Pacific ocean. If these temperatures are 1°F or more above normal for three consecutive months, El Niño conditions – also called a warm period or event – are present. If these warm conditions persist for five consecutive months, then an El Niño episode is said to exist.
Another evidence of an El Niño is the change in trade wind patterns over the Pacific. The previously strong trade winds blowing from east to west weaken, may disappear, or even reverse direction and blow from west to east. The warm ocean water that was piled up near Indonesia is now free to backflow to the central and eastern Pacific, spreading out as it travels eastward.
Water temperatures in the central Pacific usually range from 60-75°F. Under El Niño conditions these temperatures may rise higher than 80°F once the “cold tongue” disappears. The region of warmest water temperatures, greater than 80°F, are known as the warm pool. The warm pool normally exists in the western Pacific, heating up the humid air above this region and building into the area of strongest thunderstorms. However, in an El Nino the warm pool now covers much of the equatorial Pacific, and the storms leave the west Pacific and settle over the central Pacific.
These changes in sea surface temperatures cause ocean flow patterns to change as well. Upwelling of cold water from the ocean bottom slows down and becomes less efficient off the western coast of South America. Impacts of these changes – both local and global – will be discussed in a later section.
El Niños do not come and go on a fixed routine schedule, but can return anytime from two to seven years later. On average a warm event takes place every three to four years.
Figure 1 – Pacific conditions during normal, El Niño, and La Niña events. Created from NOAA / PMEL / TAO diagrams at http://www.pmel.noaa.gov/tao/proj_over/diagrams/index.html
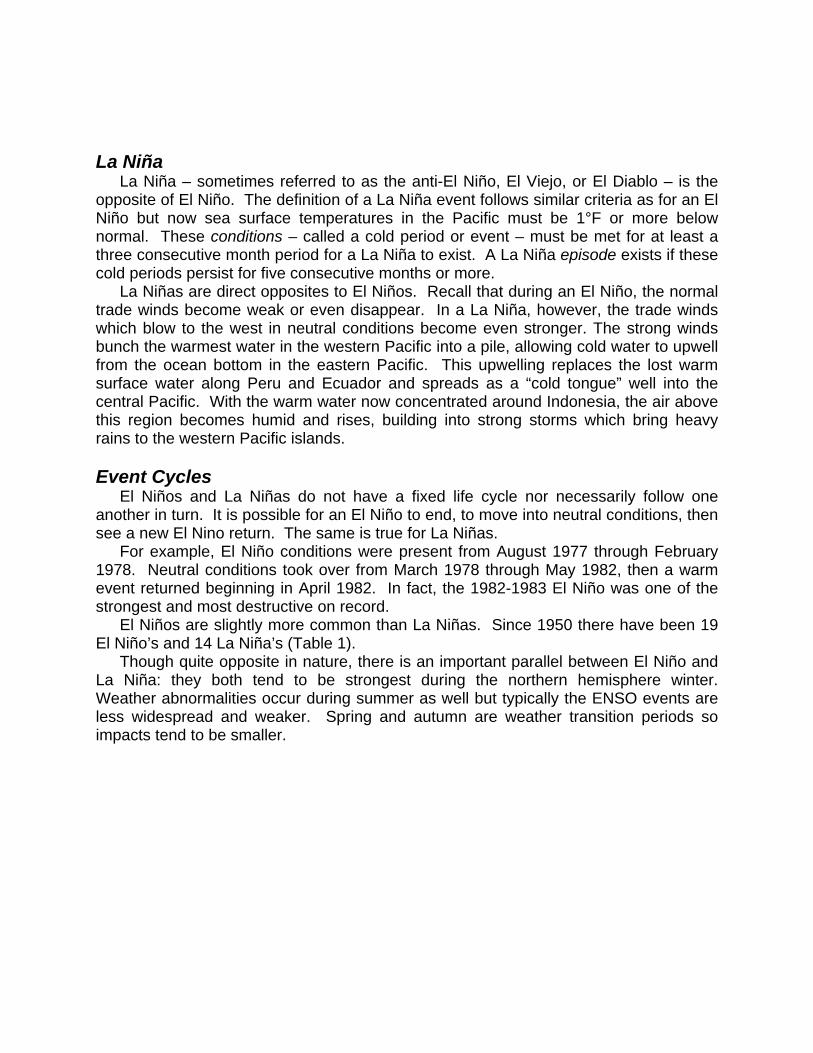
La Niña La Niña – sometimes referred to as the anti-El Niño, El Viejo, or El Diablo – is the
opposite of El Niño. The definition of a La Niña event follows similar criteria as for an El Niño but now sea surface temperatures in the Pacific must be 1°F or more below normal. These conditions – called a cold period or event – must be met for at least a three consecutive month period for a La Niña to exist. A La Niña episode exists if these cold periods persist for five consecutive months or more.
La Niñas are direct opposites to El Niños. Recall that during an El Niño, the normal trade winds become weak or even disappear. In a La Niña, however, the trade winds which blow to the west in neutral conditions become even stronger. The strong winds bunch the warmest water in the western Pacific into a pile, allowing cold water to upwell from the ocean bottom in the eastern Pacific. This upwelling replaces the lost warm surface water along Peru and Ecuador and spreads as a “cold tongue” well into the central Pacific. With the warm water now concentrated around Indonesia, the air above this region becomes humid and rises, building into strong storms which bring heavy rains to the western Pacific islands.
Event Cycles
El Niños and La Niñas do not have a fixed life cycle nor necessarily follow one another in turn. It is possible for an El Niño to end, to move into neutral conditions, then see a new El Nino return. The same is true for La Niñas.
For example, El Niño conditions were present from August 1977 through February 1978. Neutral conditions took over from March 1978 through May 1982, then a warm event returned beginning in April 1982. In fact, the 1982-1983 El Niño was one of the strongest and most destructive on record.
El Niños are slightly more common than La Niñas. Since 1950 there have been 19 El Niño’s and 14 La Niña’s (Table 1).
Though quite opposite in nature, there is an important parallel between El Niño and La Niña: they both tend to be strongest during the northern hemisphere winter. Weather abnormalities occur during summer as well but typically the ENSO events are less widespread and weaker. Spring and autumn are weather transition periods so impacts tend to be smaller.

Warm Events
(El Niño) Cold Events
(La Niña) June 1951 – February 1952 December 1950 – March 1951 March 1953 – January 1954 June 1954 – December 1956
April 1957 – June 1958 May 1964 – January 1965 May 1963 – February 1964 December 1967 – March 1968
May 1965 – June 1966 July 1970 – January 1972 August 1968 – March 1970 June 1973 – March 1976
August 1969 – February 1970 October 1983 – February 1984 May 1972 – March 1973 November 1985 – March 1986
August 1976 – February 1978 April 1988 – July 1989 August 1979 – May 1980 September 1995 – April 1996 March 1982 – July 1983 July 1998 – June 2000
July 1986 – February 1988 October 2000 – February 2001 February 1991 – July 1992 December 2005 – March 2006
February 1993 – September 1993 August 2007 – June 2008 June 1994 – April 1995 April 1997 – April 1998
June 2002 – March 2003 July 2004 – January 2005
August 2006 – January 2007
Table 1 – List of warm and cold events. Southern Oscillation
Another part of ENSO is the Southern Oscillation. While El Niño and La Niña are tied to ocean sea surface temperature cycles, the Southern Oscillation is defined by atmospheric pressure. The Southern Oscillation is the difference in air pressure between Tahiti in French Polynesia and Darwin, Australia. It has been discovered that when eastern Pacific surface waters are abnormally warm, as during an El Niño event, sea level atmospheric pressure falls in the eastern Pacific but rises in the western Pacific. The opposite is true during La Niña. This overall ocean-atmosphere coupling is known as the El Niño/Southern Oscillation, or ENSO.
The Southern Oscillation is measured using the Southern Oscillation Index (SOI). If the atmospheric pressure difference between Tahiti and Darwin is negative then the Pacific is abnormally warm. Prolonged periods of negative values indicate an El Niño.is in progress. The opposite is true for La Niña. IMPACTS – INDIANA
Abnormal weather during ENSO events is common around the Great Lakes. Both El Niño and La Niña effects tend to peak during winter in Indiana. However, El Niño effects seem to strengthen sooner (November) and weaken later (April) than during La Niña. For the most part, all of Indiana experiences the same degree of unusual weather.

For example, in warm events the entire state tends to be abnormally warm rather than just one area.
During El Niño For a visual representation of this section visit the expanded version of this paper online.
A major reason that weather conditions vary during an ENSO event is due to changes in wave patterns in the upper atmosphere. The most significant and well known of these waves would be the jet streams.
Two major jet streams affect weather in the United States – the Polar jet stream and the Subtropical Pacific jet stream. During an El Niño the favorite paths traveled by these two jet streams changes. The Subtropical Pacific jet stream moves slightly to the south and enters the U.S. over southern California. Storm systems generally ride on top of jet streams. As the Subtropical Pacific jet stream recedes southward, many storm systems are driven further south than usual across the southeast U.S states. Meanwhile the Polar jet stream recedes to the north, slowing the frequency of storm systems and bringing less cold weather into the northern U.S. Abnormally warmer weather is observed from Washington through Michigan. With these storm tracks split to the north and south, the northern and central portions of the country, specifically the region directly south of the Great Lakes, becomes quite dry.
These effects are often seen in Indiana. Though there is a significant warming just north of Indiana, the temperature impact of El Niño in Indiana is mixed. The overall trend in the state during El Niño is an annual cooling with an average temperature of 51.5°F. While the overall trend is cooling, conditions vary by month. During a warm event temperatures are below normal in January, February, April, June, August, October, and November. The remaining five months experience warmer than normal conditions but the magnitudes of change are not as large as the cooler months. December is typically the warmest month during El Niño at nearly a degree above normal. March, May, July, and September are warmer than usual as well.
The biggest impact of El Niño on Indiana weather is the amount of precipitation the state receives. Once again the annual average is not too different from normal. During El Niño Indiana receives approximately 40.6 inches, which is a tad below the normal of 41.3 inches. The state experiences seven months where precipitation totals are below normal: January, February, March, May, August, October, and November. Once more the largest differences are during the spring and early summer. April, June, July, and December receive more precipitation than normal.
So what would be the month by month weather outlook during an El Niño year? The year would more than likely begin cool and dry, especially in February. March would remain dry but would experience a slight warming. Cooler weather would return in April and excess precipitation may fall for the first time. In May conditions would revert back to those of March, warm and dry. June and July may bring moist weather with warmer conditions later in this period. The summer may end dry and very cool but that would not last as conditions become warm and moist in September. For the first time during the year two months would have similar weather as October and November tend to be cool and dry during an El Niño. December is typically warm and wet.

During La Niña
Wind patterns in the upper atmosphere are quite different in a La Niña . During a cold episode, the Subtropical Pacific jet stream will arch northward and enter the United States over Washington and Oregon. With the Subtropical Pacific jet stream so far north, warm air from southern states is transported to the Central Plain states, Midwest, Ohio Valley, and Mid-Atlantic. Near the Dakotas the Subtropical Pacific jet stream merges with the Polar jet stream, which has plunged further south. This merger, coupled with the increase in temperatures and abundance of moisture from the Gulf of Mexico, results in abnormally wet conditions south of the Great Lakes. This clash of very different air masses also produces more severe weather.
Since Indiana is located in the region with the most weather activity, conditions can be considerably different than they normally are. Both temperature and precipitation can swing widely above and below normal yet annually average near normal. In a La Niña year, the average statewide temperature runs approximately 0.3°F above the normal of 51.8°F. January, February, June, July, August, September, October, and December all historically have warmer temperatures during a cold event in the Pacific. The month with the biggest change – October – isn’t part of the winter period when La Niña is typically strongest. Yet all three winter months still experience large changes. The remaining four months, March, April, May, and November, experience cooling during a La Niña event. In summary unusually cool temperatures are not as abundant, nor as intense, as warmer temperatures.
Normally Indiana receives a statewide average of 41.3 inches of precipitation per year. During La Niña the average increases slightly to 41.6 inches. However it is more useful to examine the impacts by month. January, February, March, June, and December all experience more precipitation than normal during cold events. Notice again that all of the winter months are included. There are only five months that see an increase in precipitation but because of the size of the increases – specifically February – the annual average is shifted above normal. There are six abnormally dry months: April, May, July, August, September, and November. October has statistically seen exactly normal precipitation during La Niña (2.9 inches).
If a La Niña were to occur for an entire calendar year, what conditions should be expected? The temperature and precipitation historical observations suggest we can anticipate a warm and wet beginning of the year (January and February). Moist conditions would persist in March but a long cool spell would begin. May would be the first month with drier conditions but the cooling intensifies. A sudden switch back to warm, moist conditions in June would be followed by warm but dry conditions in July, August, and September. October would bring extremely warm weather with near average precipitation. November and December would be opposites to one another. After a cool and dry November the year would end with a warm and wet December..
These evaluations are based solely on historical climate data and do not take into account forecasts and other natural occurrences, such as volcano eruptions.. Odds are high that these monthly predictors will not all hold true during individual La Niña events.
Month El Niño La Niña January All warm & wet All warm & wet February All dry; all but southeast warm All warm; all but north central wet

March All dry; all but southeast warm All cool; all but south central and southeast dry
April All cool and wet All warm and dry
May All but north central warm; east central, south central, and south west wet
All but southeast warm; northeast, west central, central wet
June All cool and wet All but southwest warm; all but northeast wet
July All but west central warm; north and central wet All warm and dry August All cool; all but northwest and north central dry All warm; all but northeast dry
September Northwest, north central, west central cool; south wet All warm; all dry except southeast
October All cool; north and west central wet All warm and wet
November All cool; all but south dry All but north central and northeast cool; all dry
December All warm; south wet All warm; all but southeast dry
IMPACTS – GLOBAL
Since the ocean and atmosphere are coupled, the slightest changes during ENSO signal temporary global weather changes. Such changes occur at the same time but can be quite opposites depending on world location. Precipitation and temperatures may swing to greater extremes in some areas than predicted. These changes are not concentrated solely in the Pacific; they are felt worldwide. El Niño impacts
December – February Impacts during the northern hemisphere winter (December through February) vary
widely from warm and dry to wet and cool. Countries in southern Asia, such as India, Thailand, and Vietnam, experience abnormally warm conditions. These warm conditions are also felt in Japan, eastern China, the Philippines, Indonesia and Papua New Guinea. The latter three countries also experience below normal precipitation, resulting in widespread drought.
Table 2 – General regional conditions by month during the extreme phases of ENSO.

Figure 2 – Typical jet stream patterns during winter and the resulting anomalous temperature and precipitation patterns during La Niña (top) and El Niño (bottom).
The Americas also feel the effects of El Niño. In South America, Brazil experiences all kinds of unusual weather. For example, in the northeast conditions are dry but in the south, near Uruguay, it is wet. The southwest is warm. The northwestern coast near Ecuador and Peru becomes warm and wet.
In North America, eastern and western Canada, including Alaska, is much warmer than usual. In the southern U.S and in northern Mexico more rain and the threat of flooding is common. Cooler weather is typical from Texas east along the Gulf of Mexico. This is a result of a change in the jet stream path over the U.S. as already discussed. Another impact of the shifted jet stream is an increased likelihood of severe weather for Texas, Louisiana, Mississippi, Alabama, Georgia, and Florida.
June – August
As spring comes to a close, the impacts of El Niño change during the northern hemisphere summer (June through August). Southern Asia and the Pacific islands warm again to normal temperatures, although India becomes drier. The islands also

remain dry. A vast section of the western South American coast becomes warmer than normal, and there is a spike in precipitation in central Chile. The conditions Brazil saw during the winter disappear. All that remains is abnormally warm temperatures, which blanket most of the country. Countries bordering the Caribbean Sea become warm and dry. Effects in North America are small during the summer. La Niña impacts
December – February La Niña impacts also leave their mark just like those of El Niño. These impacts are
widespread and variable with especially untamed behavior during the northern hemisphere winter. Comparing La Niña averages with climate normals leads to a pronounced trend. La Niña’s greatly agitate the usual weather patterns of each region. For example, a city that is usually warm and dry will become even warmer and drier during a cold event. An example of this can be seen in the Pacific islands. This region, usually quite moist, experiences an increase in rainfall during La Niña due to the shift in storm clouds westward.
As you may have guessed, the regions that are affected during El Niño are also affected by La Niña. The impacts, much like the behaviors themselves, are opposite one other. During winter, Japan is abnormally cool, Alaska and western Canada are cool and wet, the Midwestern U.S. is wet, and the southern U.S. and northern Mexico become dry and warmer than usual. The variations in Brazil weather return during a La Niña winter; however, only two regions experience abnormal conditions. Northern Brazil is unusually wet while the west becomes quite cool. With storm systems shoved further west, Ecuador and Peru become warm and dry.
June – August
During the summer humid conditions expand from the Philippines and Indonesia north into India, Vietnam, Thailand, and China. This wet region also experiences below normal temperatures. Meanwhile northeastern Australia becomes quite warm while the western coast of South America cools. Southern Brazil and Uruguay witness below average precipitation while countries bordering the Caribbean Sea experience cool and moist conditions. Again, North America sees few unusual weather patterns during La Niña summers. Summary
Unusual weather spells are not as drastic in Indiana as they can be in the Pacific Northwest or Southeast. The state undergoes moderate temperature and precipitation fluctuations during both El Niño and La Niña events. The most obvious changes usually occur from November through March. The general climate conditions discussed here do not always hold true for every part of the state. For a more regional look at ENSO impacts visit this text online.
ALL TABLES AND IMAGES BELOW ARE FOR THE EXTENDED PAPER ON THE WEB, NOT THE PUBLICATION.

Indiana (Statewide)
Normal Departure from Normal During
El Niño
Departure from Normal During
La Niña
Month Temp. (°F)
Precip. (inches)
Temp. (°F)
Precip. (inches)
Temp. (°F)
Precip. (inches)
January 26.9 2.68 -0.66 -0.24 0.64 0.39 February 30.7 2.35 -0.75 -0.78 0.61 0.72
March 39.9 3.33 0.52 -0.48 -0.07 0.06 April 51.6 3.97 -0.68 0.42 -0.08 -0.09 May 61.5 4.40 0.70 -0.07 -0.26 -0.44 June 70.6 4.15 -0.64 0.05 0.19 0.19 July 74.3 4.32 0.04 0.17 0.14 -0.56
August 72.4 3.62 -1.30 -0.14 0.68 -0.05 September 65.5 3.17 0.21 0.07 0.16 -0.24
October 54.0 2.90 -0.74 -0.01 1.58 0.01 November 42.2 3.41 -0.65 -0.05 -0.26 -0.33 December 31.2 2.97 0.99 0.21 0.62 0.06
Table 3 – Data for Indiana. Normals and departures computed from data for
1950 through 2006.

Indiana Climate Division 1 (Northwest)
Departure from Departure from
Normal
Normal During Normal During El Niño La Niña
Temp. Precip. Temp. Precip. Temp. Precip. Month (°F) (inches) (°F) (inches) (°F) (inches)January 23.4 2.01 1.27 0.14 1.05 0.29 February 27.5 1.73 1.59 -0.47 2.16 0.49
March 37.1 2.67 1.10 -0.35 -0.83 -0.38 April 49.0 3.83 -0.62 0.25 0.53 -0.15 May 59.6 3.78 0.07 -0.18 0.26 -0.36 June 69.2 4.28 -0.85 0.35 0.61 0.25 July 73.0 4.25 0.05 0.61 0.59 -0.09
August 71.0 3.67 -0.96 0.41 1.77 -0.17 September 64.2 3.30 -0.32 -0.34 0.34 -0.66
October 52.8 3.10 -0.55 0.36 1.44 0.32 November 40.2 2.99 -1.17 -0.08 -0.04 -0.57 December 28.3 2.47 1.96 -0.12 0.32 -0.29
Table 4 – Data for northwest Indiana. Normals and departures computed from data for 1950 through 2006.

Indiana Climate Division 2
(North Central)
Departure from Departure from
Normal Normal During Normal During El Niño La Niña
Temp. Precip. Temp. Precip. Temp. Precip. Month (°F) (inches) (°F) (inches) (°F) (inches)
January 24.0 2.20 1.21 0.22 1.08 0.25 February 27.6 1.87 1.28 -0.59 2.56 0.47
March 37.1 2.62 0.99 -0.27 -0.83 -0.30 April 49.2 3.72 -0.57 0.34 0.68 -0.19 May 59.6 3.78 -0.11 -0.15 0.20 -0.11 June 69.1 4.10 -0.87 0.26 0.52 0.11 July 72.8 4.28 0.19 0.67 0.50 -0.16
August 70.7 3.70 -0.88 0.18 1.64 -0.06 September 63.8 3.20 -0.24 -0.24 0.18 -0.57
October 52.4 2.95 -0.47 0.16 1.59 0.44 November 40.3 3.01 -1.05 -0.02 0.03 -0.36 December 28.8 2.55 1.70 -0.26 0.19 -0.38
Table 5 – Data for north central Indiana. Normals and departures computed from data for 1950 through 2006.

Indiana Climate Division 3
(Northeast)
Normal Departure from Departure from Normal During Normal During
El Niño La Niña
Temp. Precip. Temp. Precip. Temp. Precip. Month (°F) (inches) (°F) (inches) (°F) (inches) January 23.9 2.19 1.26 0.29 1.06 0.26 February 27.2 1.88 1.10 -0.64 2.53 0.32
March 36.6 2.65 1.40 -0.53 -0.60 -0.21 April 48.8 3.61 -0.16 0.31 0.82 -0.28 May 59.3 3.83 0.19 -0.18 0.43 0.10 June 68.9 4.01 -0.49 0.15 0.85 -0.01 July 72.6 3.98 0.39 0.72 0.79 -0.24
August 70.6 3.57 -0.63 -0.22 1.79 0.30 September 63.6 3.12 0.04 -0.06 0.30 -0.55
October 52.1 2.76 -0.28 0.29 1.73 0.52 November 40.1 3.00 -0.97 -0.01 0.16 -0.30 December 28.7 2.56 1.83 -0.19 0.27 -0.31
Table 6 – Data for northeast Indiana. Normals and departures computed from data for 1950 through 2006.

Indiana Climate Division 4
(West Central)
Departure from Departure from Normal
Normal During Normal During El Niño La Niña
Temp. Precip. Temp. Precip. Temp. Precip. Month (°F) (inches) (°F) (inches) (°F) (inches) January 26.3 2.50 1.12 0.25 1.29 0.41 February 30.5 2.12 1.01 -0.66 2.66 0.72
March 39.9 3.18 0.68 -0.61 -0.93 -0.63 April 51.9 3.91 -0.78 0.61 0.44 -0.51 May 61.8 4.40 0.25 -0.14 0.12 0.23 June 70.9 4.29 -0.60 0.83 0.41 0.65 July 74.5 4.31 -0.04 0.22 0.31 -0.72
August 72.4 3.70 -0.82 -0.07 1.73 -0.79 September 65.6 3.18 -0.18 -0.14 0.30 -0.51
October 54.1 2.95 -0.41 0.24 1.62 0.37 November 42.2 3.11 -1.15 -0.13 -0.20 -0.37 December 30.6 5.16 1.44 -0.17 0.41 -0.18
Table 7 – Data for west central Indiana. Normals and departures computed from data for 1950 through 2006.

Indiana Climate Division 5
(Central)
Departure from Departure from Normal
Normal During Normal During El Niño La Niña
Temp. Precip. Temp. Precip. Temp. Precip. Month (°F) (inches) (°F) (inches) (°F) (inches) January 26.7 2.67 1.07 0.36 1.56 0.37 February 30.5 2.30 0.80 -0.73 2.82 0.48
March 39.7 3.23 0.77 -0.90 -0.59 -0.46 April 51.5 3.95 -0.42 0.42 0.67 -0.17 May 61.3 4.46 0.30 -0.02 0.24 0.08 June 70.5 3.98 -0.46 0.80 0.52 0.62 July 74.0 4.23 0.37 0.04 0.51 -0.55
August 72.0 3.42 -0.51 -0.33 1.74 -0.64 September 65.2 3.17 0.18 -0.04 0.39 -0.30
October 53.7 2.88 -0.22 -0.08 1.71 0.27 November 42.0 3.29 -0.94 -0.12 -0.03 -0.32 December 30.9 5.27 1.61 -0.13 0.61 -0.11
Table 8 – Data for central Indiana. Normals and departures computed from data for 1950 through 2006.

Indiana Climate Division 6
(East Central)
Normal Departure from Departure from Normal During Normal During
El Niño La Niña
Temp. Precip. Temp. Precip. Temp. Precip. Month (°F) (inches) (°F) (inches) (°F) (inches) January 25.9 2.56 0.90 0.37 1.40 0.55 February 29.4 2.16 0.53 -0.65 2.73 0.44
March 38.6 3.03 0.64 -1.01 -0.68 -0.33 April 50.3 3.90 -0.46 0.31 0.77 -0.22 May 60.3 4.31 0.06 0.01 0.18 -0.10 June 69.4 4.15 -0.75 0.91 0.36 0.27 July 73.0 4.19 0.06 0.19 0.24 -0.45
August 71.0 3.43 -0.70 -0.47 1.26 -0.56 September 64.2 2.90 0.00 -0.07 0.12 -0.31
October 52.8 2.79 -0.31 -0.05 1.48 0.35 November 41.3 3.17 -1.06 -0.08 -0.18 -0.38 December 30.2 3.54 1.38 -0.22 0.37 -0.08
Table 9 – Data for east central Indiana. Normals and departures computed from data for 1950 through 2006.

Indiana Climate Division 7
(Southwest)
Departure from Departure from
Normal Normal During Normal During El Niño La Niña
Temp. Temp. Precip. Temp. Precip. Precip. Month (°F) (inches) (°F) (inches) (inches) (°F)
January 30.7 3.19 0.80 0.05 1.47 0.42 February 34.8 3.01 0.20 -0.69 2.51 0.90
March 43.8 4.10 0.14 -1.37 -1.18 -0.32 April 55.3 4.21 -0.78 1.19 0.21 -0.13 May 64.5 4.62 0.24 -0.02 0.14 -0.65 June 73.2 3.91 -0.35 0.13 -0.06 0.55 July 76.9 4.10 0.45 -0.15 0.28 -0.77
August 75.2 3.32 -0.19 -0.44 1.45 -0.38 September 68.2 3.23 0.13 0.52 0.31 -0.42
October 56.8 3.15 -0.35 -0.02 1.44 0.10 November 45.0 3.97 -0.99 0.07 -0.37 -0.34 December 34.5 9.08 1.24 0.22 0.64 -0.09
Table 10 – Data for southwest Indiana. Normals and departures computed from data for 1950 through 2006.

Indiana Climate Division 8
(South Central)
Departure from Departure from Normal
Normal During Normal During El Niño La Niña
Temp. Precip. Temp. Precip. Temp. Precip. Month (°F) (inches) (°F) (inches) (°F) (inches) January 30.4 3.46 0.96 0.14 1.55 0.65 February 34.3 3.08 0.20 -0.70 2.52 1.03
March 42.9 4.23 0.16 -1.51 -1.07 0.07 April 54.1 4.34 -0.65 1.13 0.27 -0.26 May 63.2 4.97 0.31 0.31 0.07 -0.37 June 71.6 4.26 -0.19 0.34 0.28 0.65 July 75.5 4.38 0.65 -0.36 0.43 -0.80
August 73.9 3.73 -0.21 -0.25 1.67 -0.33 September 66.8 3.27 0.13 0.41 0.37 -0.26
October 55.4 2.96 -0.39 -0.35 1.44 0.17 November 44.3 3.86 -0.85 0.04 -0.39 -0.22 December 34.0 3.61 1.06 0.30 0.62 -0.02
Table 11 – Data for south central Indiana. Normals and departures computed from data for 1950 through 2006.

Indiana Climate Division 9
(Southeast)
Normal Departure from Departure from Normal During Normal During
El Niño La Niña
Temp. Precip. Temp. Precip. Temp. Precip. Month (°F) (inches) (°F) (inches) (°F) (inches) January 30.3 3.39 0.62 0.30 1.38 0.55 February 34.0 2.99 -0.04 -0.76 2.29 1.01
March 42.6 3.95 -0.15 -1.32 -1.19 0.12 April 53.7 4.10 -0.55 1.05 0.18 -0.34 May 63.1 4.73 0.12 0.13 -0.13 -0.39 June 71.6 4.09 -0.43 0.49 0.24 0.60 July 75.6 4.33 0.33 -0.17 0.30 -0.50
August 74.0 3.68 -0.51 -0.22 1.51 -0.47 September 67.0 3.17 0.07 0.02 0.23 0.02
October 55.5 2.91 -0.52 -0.27 1.21 0.36 November 44.2 3.64 -0.87 0.00 -0.59 -0.34 December 34.1 5.60 1.10 0.23 0.53 0.04
Table 12 – Data for southeast Indiana. Normals and departures computed from
data for 1950 through 2006.
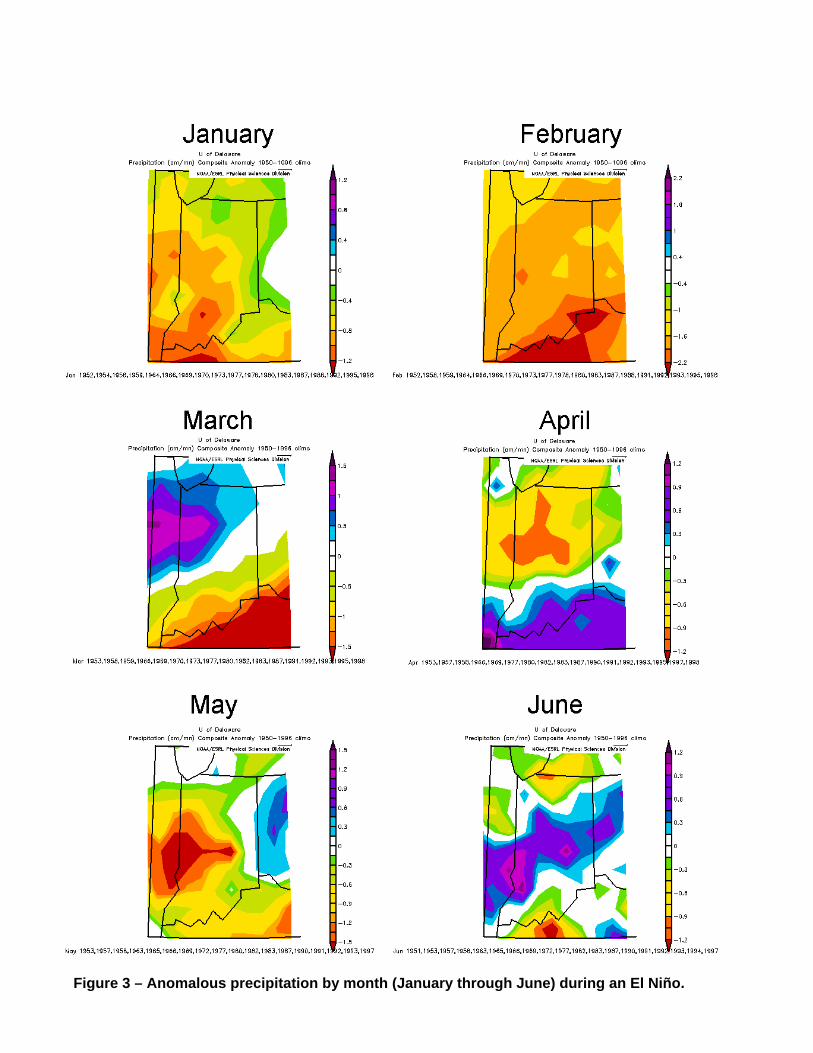
Figure 3 – Anomalous precipitation by month (January through June) during an El Niño.

Figure 4 – Anomalous precipitation by month (July through December) during an El
Niño.

Figure 5 – Anomalous temperature by month (January through June) during an El Niño.
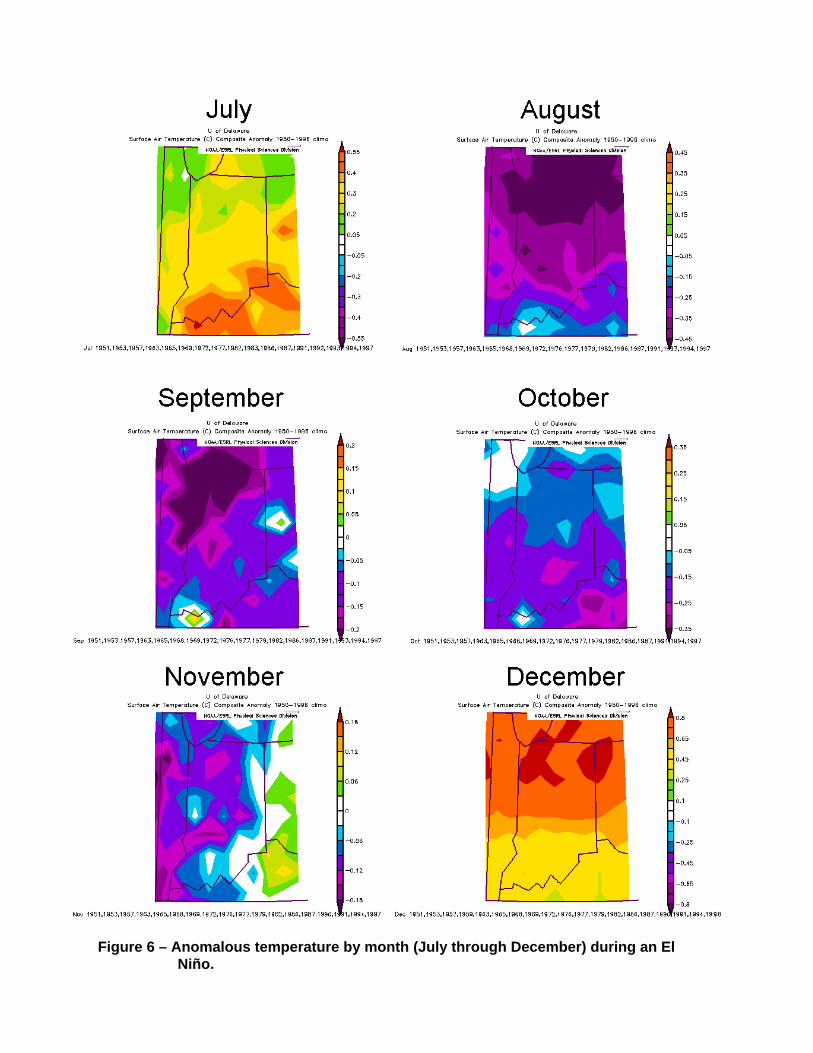
Figure 6 – Anomalous temperature by month (July through December) during an El
Niño.

Figure 7 – Anomalous precipitation by month (January through June) during a La Niña.

Figure 8 – Anomalous precipitation by month (July through December) during a La Niña.

Figure 9 – Anomalous temperature by month (January through June) during a La Niña.

Figure 10 – Anomalous temperature by month (July through December) during a La
Niña.