an introduction to matrix visualization & corrplot … introduction to matrix visualization...
TRANSCRIPT
About corrplot Seriation Application Examples GAP
An Introduction to Matrix Visualization & corrplotPackage
Taiyun Wei
The 2nd Chinese R Conference
2009-12
About corrplot Seriation Application Examples GAP
Content
1 About corrplotGraph Gallery in corrplot PackageDetails and TipsSummary
2 SeriationWhy needCriterionMethod
3 Application Examples
4 GAPscreenshots
About corrplot Seriation Application Examples GAP
Outline
1 About corrplotGraph Gallery in corrplot PackageDetails and TipsSummary
2 SeriationWhy needCriterionMethod
3 Application Examples
4 GAPscreenshots

About corrplot Seriation Application Examples GAP
Matrix Visualization
Matrix visualization is to convert a digital matrix to a graph.
Presentation1 Glyph2 Color3 Other details
Model1 Seriation (reordering) model2 Optimization algorithms3 Partition algorithms
Goal1 Display data vividly2 Find the hidden pattern in data (clustering?)
About corrplot Seriation Application Examples GAP
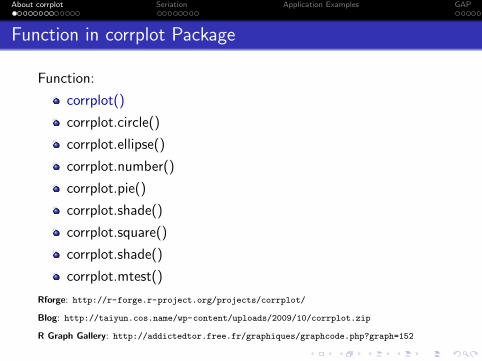
Function in corrplot Package
Function:
corrplot()
corrplot.circle()
corrplot.ellipse()
corrplot.number()
corrplot.pie()
corrplot.shade()
corrplot.square()
corrplot.shade()
corrplot.mtest()
Rforge: http://r-forge.r-project.org/projects/corrplot/
Blog: http://taiyun.cos.name/wp-content/uploads/2009/10/corrplot.zip
R Graph Gallery: http://addictedtor.free.fr/graphiques/graphcode.php?graph=152
About corrplot Seriation Application Examples GAP
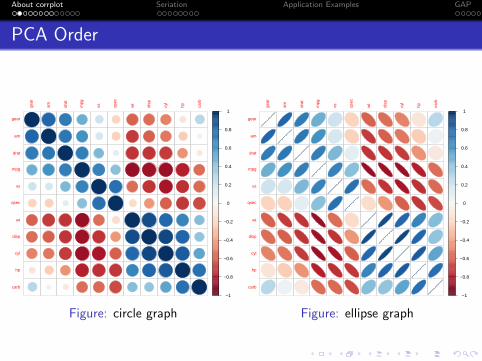
PCA Order
●
●
●
●
●
●
●
●
●
●
●
●
●
●
●
●
●
●
●
●
●
●
−1
−0.8
−0.6
−0.4
−0.2
0
0.2
0.4
0.6
0.8
1
gear
am drat
mpg
vs qsec
wt
disp
cyl
hp carb
gear
am
drat
mpg
vs
qsec
wt
disp
cyl
hp
carb
Figure: circle graph
−1
−0.8
−0.6
−0.4
−0.2
0
0.2
0.4
0.6
0.8
1
gear
am drat
mpg
vs qsec
wt
disp
cyl
hp carb
gear
am
drat
mpg
vs
qsec
wt
disp
cyl
hp
carb
Figure: ellipse graph

About corrplot Seriation Application Examples GAP
HC Order (complete)
−1
−0.8
−0.6
−0.4
−0.2
0
0.2
0.4
0.6
0.8
1
carb
wt
hp cyl
disp
qsec
vs mpg
drat
am gear
carb
wt
hp
cyl
disp
qsec
vs
mpg
drat
am
gear
Figure: square graph
−1
−0.8
−0.6
−0.4
−0.2
0
0.2
0.4
0.6
0.8
1
carb
wt
hp cyl
disp
qsec
vs mpg
drat
am gear
carb
wt
hp
cyl
disp
qsec
vs
mpg
drat
am
gear
Figure: shade graph
About corrplot Seriation Application Examples GAP
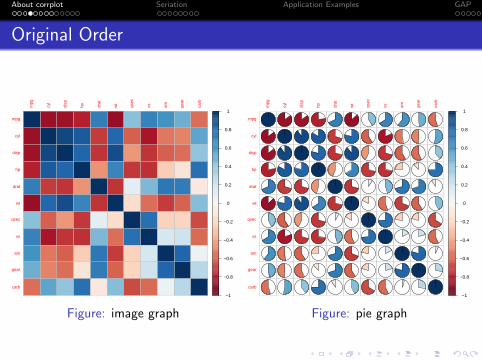
Original Order
−1
−0.8
−0.6
−0.4
−0.2
0
0.2
0.4
0.6
0.8
1
mpg
cyl
disp
hp drat
wt
qsec
vs am gear
carb
mpg
cyl
disp
hp
drat
wt
qsec
vs
am
gear
carb
Figure: image graph
−1
−0.8
−0.6
−0.4
−0.2
0
0.2
0.4
0.6
0.8
1
mpg
cyl
disp
hp drat
wt
qsec
vs am gear
carb
mpg
cyl
disp
hp
drat
wt
qsec
vs
am
gear
carb
Figure: pie graph
About corrplot Seriation Application Examples GAP
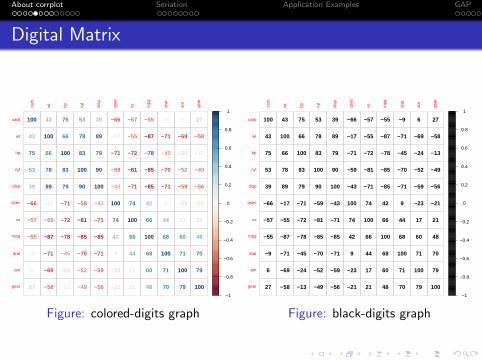
Digital Matrix
100
43
75
53
39
−66
−57
−55
−9
6
27
43
100
66
78
89
−17
−55
−87
−71
−69
−58
75
66
100
83
79
−71
−72
−78
−45
−24
−13
53
78
83
100
90
−59
−81
−85
−70
−52
−49
39
89
79
90
100
−43
−71
−85
−71
−59
−56
−66
−17
−71
−59
−43
100
74
42
9
−23
−21
−57
−55
−72
−81
−71
74
100
66
44
17
21
−55
−87
−78
−85
−85
42
66
100
68
60
48
−9
−71
−45
−70
−71
9
44
68
100
71
70
6
−69
−24
−52
−59
−23
17
60
71
100
79
27
−58
−13
−49
−56
−21
21
48
70
79
100−1
−0.8
−0.6
−0.4
−0.2
0
0.2
0.4
0.6
0.8
1
carb
wt
hp cyl
disp
qsec
vs mpg
drat
am gear
carb
wt
hp
cyl
disp
qsec
vs
mpg
drat
am
gear
Figure: colored-digits graph
100
43
75
53
39
−66
−57
−55
−9
6
27
43
100
66
78
89
−17
−55
−87
−71
−69
−58
75
66
100
83
79
−71
−72
−78
−45
−24
−13
53
78
83
100
90
−59
−81
−85
−70
−52
−49
39
89
79
90
100
−43
−71
−85
−71
−59
−56
−66
−17
−71
−59
−43
100
74
42
9
−23
−21
−57
−55
−72
−81
−71
74
100
66
44
17
21
−55
−87
−78
−85
−85
42
66
100
68
60
48
−9
−71
−45
−70
−71
9
44
68
100
71
70
6
−69
−24
−52
−59
−23
17
60
71
100
79
27
−58
−13
−49
−56
−21
21
48
70
79
100−1
−0.8
−0.6
−0.4
−0.2
0
0.2
0.4
0.6
0.8
1
carb
wt
hp cyl
disp
qsec
vs mpg
drat
am gear
carb
wt
hp
cyl
disp
qsec
vs
mpg
drat
am
gear
Figure: black-digits graph
About corrplot Seriation Application Examples GAP
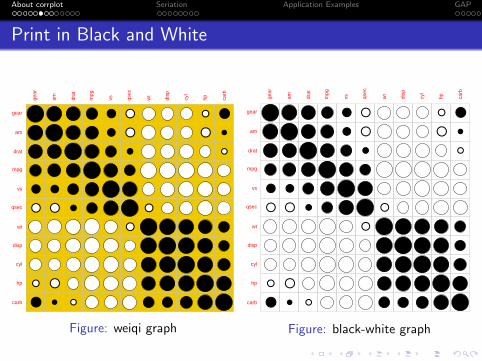
Print in Black and White
●
●
●
●
●
●
●
●
●
●
●
●
●
●
●
●
●
●
●
●
●
●
gear
am drat
mpg
vs qsec
wt
disp
cyl
hp carb
gear
am
drat
mpg
vs
qsec
wt
disp
cyl
hp
carb
Figure: weiqi graph
●
●
●
●
●
●
●
●
●
●
●
●
●
●
●
●
●
●
●
●
●
●
gear
am drat
mpg
vs qsec
wt
disp
cyl
hp carb
gear
am
drat
mpg
vs
qsec
wt
disp
cyl
hp
carb
Figure: black-white graph
About corrplot Seriation Application Examples GAP
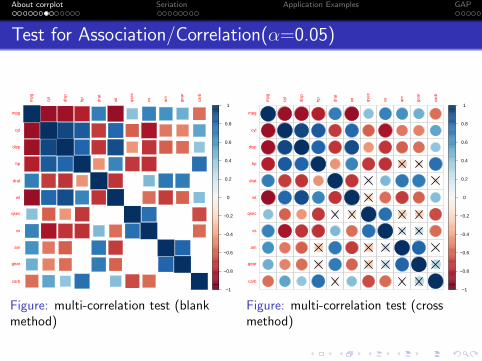
Test for Association/Correlation(α=0.05)
−1
−0.8
−0.6
−0.4
−0.2
0
0.2
0.4
0.6
0.8
1
mpg
cyl
disp
hp drat
wt
qsec
vs am gear
carb
mpg
cyl
disp
hp
drat
wt
qsec
vs
am
gear
carb
Figure: multi-correlation test (blankmethod)
●
●
●
●
●
●
●
●
●
●
●
●
●
●
●
●
●
●
●
●
●
●
−1
−0.8
−0.6
−0.4
−0.2
0
0.2
0.4
0.6
0.8
1
mpg
cyl
disp
hp drat
wt
qsec
vs am gear
carb
mpg
cyl
disp
hp
drat
wt
qsec
vs
am
gear
carb
Figure: multi-correlation test (crossmethod)
About corrplot Seriation Application Examples GAP
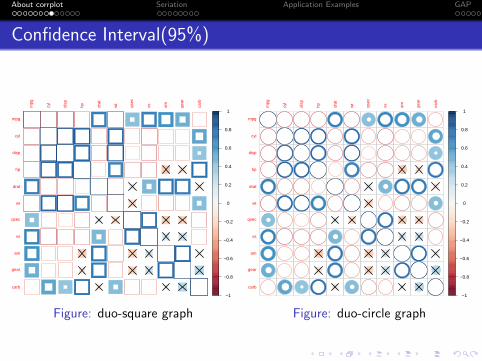
Confidence Interval(95%)
−1
−0.8
−0.6
−0.4
−0.2
0
0.2
0.4
0.6
0.8
1
mpg
cyl
disp
hp drat
wt
qsec
vs am gear
carb
mpg
cyl
disp
hp
drat
wt
qsec
vs
am
gear
carb
Figure: duo-square graph
●
●
●
●
●
●
●
●
●
●
●
●
●
●
●
●
●
●
●
●
●
●
−1
−0.8
−0.6
−0.4
−0.2
0
0.2
0.4
0.6
0.8
1
mpg
cyl
disp
hp drat
wt
qsec
vs am gear
carb
mpg
cyl
disp
hp
drat
wt
qsec
vs
am
gear
carb ●
●
●
●
●
●
●
●
●
●
●
●●
●
●
●
●
●
●
●
●
●
●
●
● ●
●
●
●
●
●
●
●
●
Figure: duo-circle graph
About corrplot Seriation Application Examples GAP
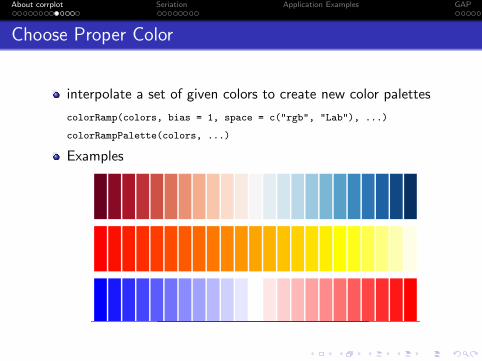
Choose Proper Color
interpolate a set of given colors to create new color palettes
colorRamp(colors, bias = 1, space = c("rgb", "Lab"), ...)
colorRampPalette(colors, ...)
Examples

About corrplot Seriation Application Examples GAP
Upper or Lowerge
ar
am
drat
mpg
vs
qsec
wt
disp
cyl
hp
carb
gear
am
drat
mpg
vs
qsec
wt
disp
cyl
hp
carb
Figure: lower
gear
am drat
mpg
vs qsec
wt
disp
cyl
hp carb
gear
am
drat
mpg
vs
qsec
wt
disp
cyl
hp
carb
Figure: upper
About corrplot Seriation Application Examples GAP
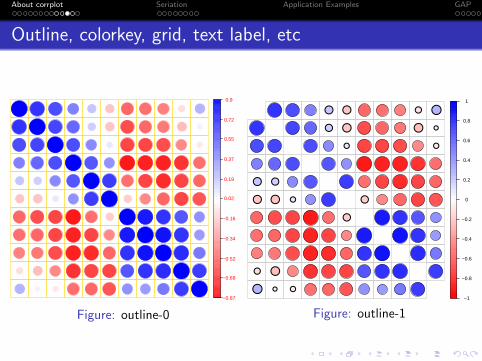
Outline, colorkey, grid, text label, etc
●
●
●
●
●
●
●
●
●
●
●
●
●
●
●
●
●
●
●
●
●
●
−0.87
−0.69
−0.52
−0.34
−0.16
0.02
0.19
0.37
0.55
0.72
0.9
Figure: outline-0
●
●
●
●
●
●
●
●
●
●
●
●
●
●
●
●
●
●
●
●
●
●
−1
−0.8
−0.6
−0.4
−0.2
0
0.2
0.4
0.6
0.8
1
Figure: outline-1
About corrplot Seriation Application Examples GAP
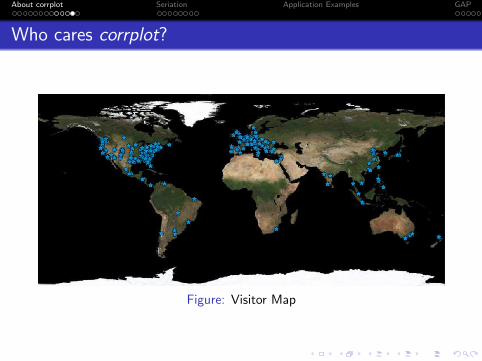
Who cares corrplot?
Figure: Visitor Map
About corrplot Seriation Application Examples GAP
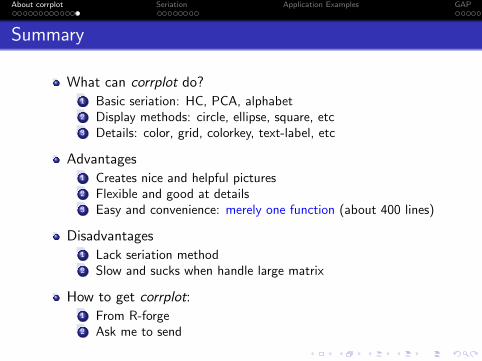
Summary
What can corrplot do?1 Basic seriation: HC, PCA, alphabet2 Display methods: circle, ellipse, square, etc3 Details: color, grid, colorkey, text-label, etc
Advantages1 Creates nice and helpful pictures2 Flexible and good at details3 Easy and convenience: merely one function (about 400 lines)
Disadvantages1 Lack seriation method2 Slow and sucks when handle large matrix
How to get corrplot:1 From R-forge2 Ask me to send
About corrplot Seriation Application Examples GAP
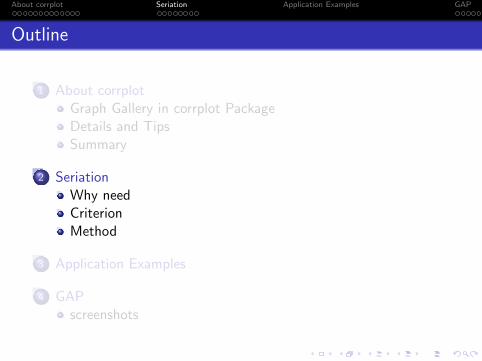
Outline
1 About corrplotGraph Gallery in corrplot PackageDetails and TipsSummary
2 SeriationWhy needCriterionMethod
3 Application Examples
4 GAPscreenshots
About corrplot Seriation Application Examples GAP
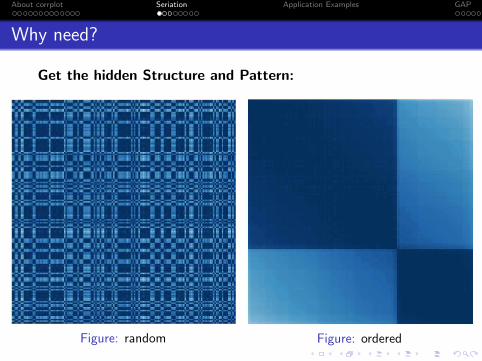
Why need?
Get the hidden Structure and Pattern:
Figure: random Figure: ordered
About corrplot Seriation Application Examples GAP
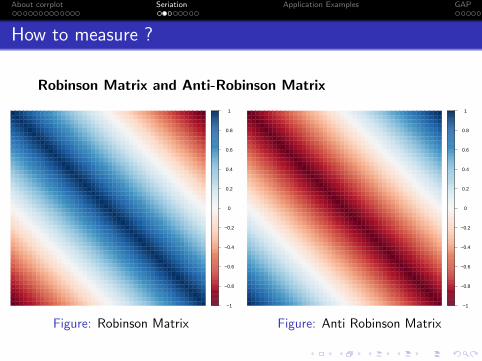
How to measure ?
Robinson Matrix and Anti-Robinson Matrix
−1
−0.8
−0.6
−0.4
−0.2
0
0.2
0.4
0.6
0.8
1
Figure: Robinson Matrix
−1
−0.8
−0.6
−0.4
−0.2
0
0.2
0.4
0.6
0.8
1
Figure: Anti Robinson Matrix
About corrplot Seriation Application Examples GAP
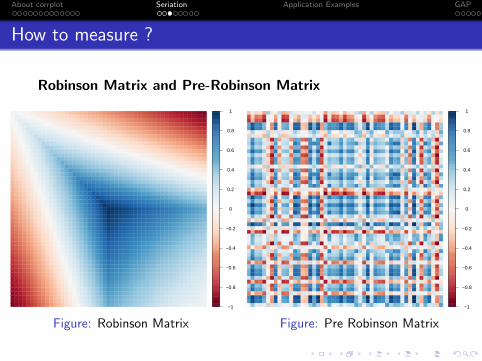
How to measure ?
Robinson Matrix and Pre-Robinson Matrix
−1
−0.8
−0.6
−0.4
−0.2
0
0.2
0.4
0.6
0.8
1
Figure: Robinson Matrix
−1
−0.8
−0.6
−0.4
−0.2
0
0.2
0.4
0.6
0.8
1
Figure: Pre Robinson Matrix
About corrplot Seriation Application Examples GAP
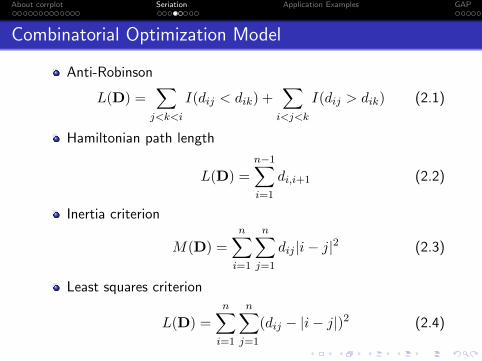
Combinatorial Optimization Model
Anti-Robinson
L(D) =∑
j<k<i
I(dij < dik) +∑
i<j<k
I(dij > dik) (2.1)
Hamiltonian path length
L(D) =
n−1∑i=1
di,i+1 (2.2)
Inertia criterion
M(D) =
n∑i=1
n∑j=1
dij |i− j|2 (2.3)
Least squares criterion
L(D) =n∑
i=1
n∑j=1
(dij − |i− j|)2 (2.4)
About corrplot Seriation Application Examples GAP
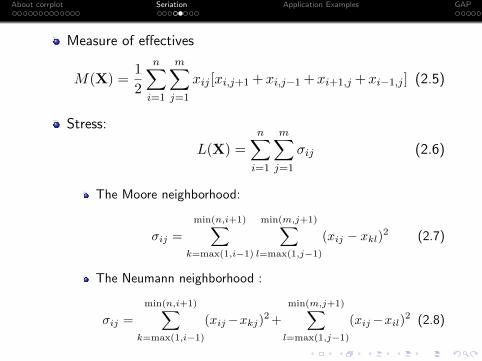
Measure of effectives
M(X) =1
2
n∑i=1
m∑j=1
xij [xi,j+1+xi,j−1+xi+1,j +xi−1,j ] (2.5)
Stress:
L(X) =
n∑i=1
m∑j=1
σij (2.6)
The Moore neighborhood:
σij =
min(n,i+1)∑k=max(1,i−1)
min(m,j+1)∑l=max(1,j−1)
(xij − xkl)2 (2.7)
The Neumann neighborhood :
σij =
min(n,i+1)∑k=max(1,i−1)
(xij−xkj)2+min(m,j+1)∑
l=max(1,j−1)
(xij−xil)2 (2.8)
About corrplot Seriation Application Examples GAP
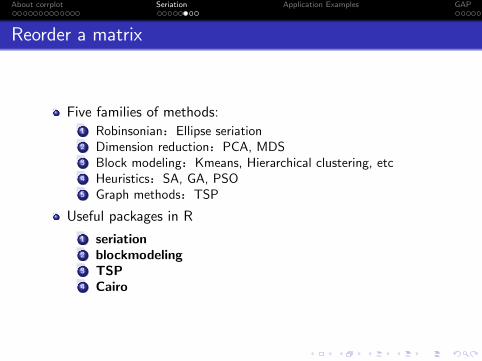
Reorder a matrix
Five families of methods:1 RobinsonianµEllipse seriation2 Dimension reductionµPCA, MDS3 Block modelingµKmeans, Hierarchical clustering, etc4 HeuristicsµSA, GA, PSO5 Graph methodsµTSP
Useful packages in R
1 seriation2 blockmodeling3 TSP4 Cairo

About corrplot Seriation Application Examples GAP
seriation package
Table: Currently implemented methods in seriation package
Algorithm method Optimizes Input data
Simulated annealing "ARSA" Gradient measure dist
Branch-and-bound "BBURCG" Gradient measure dist
Branch-and-bound "BBWRCG" Gradient measure (weighted) dist
TSP solver "TSP" Hamiltonian path length dist
Optimal leaf ordering "OLO" Hamiltonian path length dist
Bond Energy Algorithm "BEA" Measure of effectiveness matrix
TSP to optimize ME "BEA TSP" Measure of effectiveness matrix
Hierarchical clustering "HC" Other dist
Gruvaeus and Wainer "GW" Other dist
Rank-two ellipse seriation "Chen" Other dist
MDS – first dimension "MDS" Other dist
First principal component "PCA" Other matrix
About corrplot Seriation Application Examples GAP
seriation package
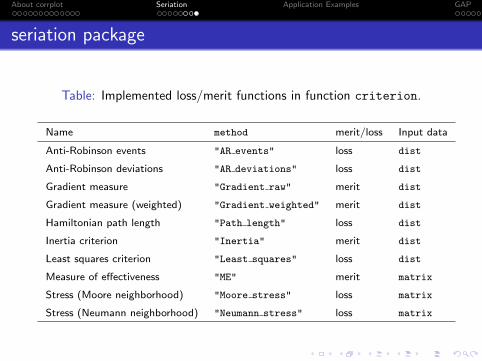
Table: Implemented loss/merit functions in function criterion.
Name method merit/loss Input data
Anti-Robinson events "AR events" loss dist
Anti-Robinson deviations "AR deviations" loss dist
Gradient measure "Gradient raw" merit dist
Gradient measure (weighted) "Gradient weighted" merit dist
Hamiltonian path length "Path length" loss dist
Inertia criterion "Inertia" merit dist
Least squares criterion "Least squares" loss dist
Measure of effectiveness "ME" merit matrix
Stress (Moore neighborhood) "Moore stress" loss matrix
Stress (Neumann neighborhood) "Neumann stress" loss matrix
About corrplot Seriation Application Examples GAP
Outline
1 About corrplotGraph Gallery in corrplot PackageDetails and TipsSummary
2 SeriationWhy needCriterionMethod
3 Application Examples
4 GAPscreenshots
About corrplot Seriation Application Examples GAP
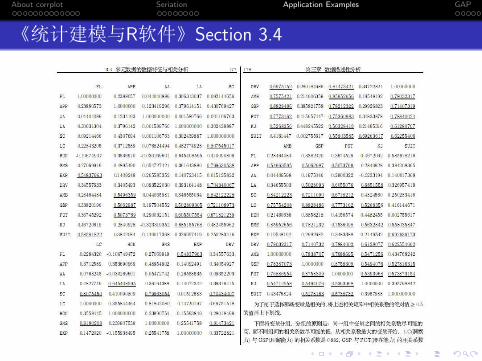
5ÚOï��R^�6Section 3.4

About corrplot Seriation Application Examples GAP
A picture is worth a thousand words!
●
●●
●●
●
●
●●
●●
●
●
●
●●●
●●●●
●●
●
●●●●●
●●●●
●●
●
●●●
●
●●
●●
●
●
●
●
●
●●
●
●●
●
●●
●
●●
●
●●
●●
●●
●
●●●
●
●
●●
●●
●●
●
●
●
●
●
●
●
●
●
●●
●
●
●
●
●
●●●●
●●●
●
●
●
●
●
●
●
●●●
●●
●
●●
●●
●
●
●
●●●●●●●●●
●
●
●
●●
●
●
●●
●
●
●
●
●
●
●
●
●
●
●●●●
●
●●
●
●
●
●●
●●
●
●
●●
●
●
●
●
●
●
●●
●
●
●
●
●●
●
●
●
●
●
●
●
●
●●
-0.32
-0.2
-0.08
0.04
0.16
0.28
0.4
0.52
0.64
0.76
0.88
驾驶水平
理解能力
潜在能力
自信心
洞察力
推销能力
事业心
诚实
外貌
讨人喜欢
交际能力
专业知识
适应性
求职信
经验
驾驶水平
理解能力
潜在能力
自信心
洞察力
推销能力
事业心
诚实
外貌
讨人喜欢
交际能力
专业知识
适应性
求职信
经验
About corrplot Seriation Application Examples GAP
●●
●●●
●
●
●
●
●
●
●●
●●
外在能
力
经验
亲和力
专业知
识
1
2
3
4
5
6
7
8
9
10
11
12
●
●
●
●●
●
●●●
●
●●
●●
●
●
●
外在能
力
经验
亲和力
专业知
识
13
14
15
16
17
18
19
20
21
22
23
24
●
●
●
●
●●●●●
●
●
●
●
●
●●
●●
●
●●●
●
●
●
●
●
●
●
●
●
外在能
力
经验
亲和力
专业知
识
25
26
27
28
29
30
31
32
33
34
35
36
●
●
●
●
●
●
●
●
●●●
●
●
●
●
●
●
●●
●●●
外在能
力
经验
亲和力
专业知
识
37
38
39
40
41
42
43
44
45
46
47
48
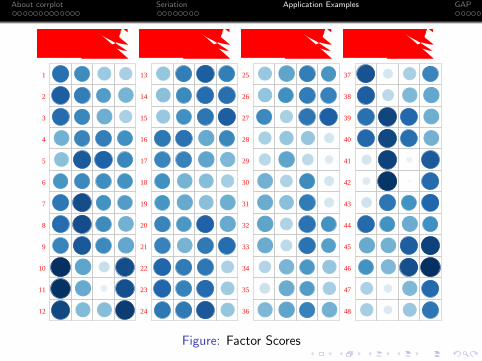
Figure: Factor Scores
About corrplot Seriation Application Examples GAP
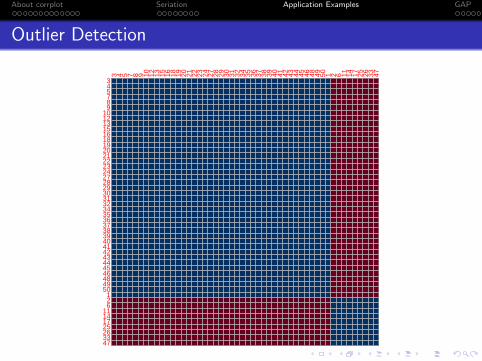
Outlier Detection
3 4 5 7 8 9 10 12 13 15 16 18 19 20 21 22 23 24 27 28 29 30 31 32 34 35 36 37 38 39 40 41 42 43 44 45 46 48 49 50 1 2 6 11 14 17 25 26 33 47
345789
10121315161819202122232427282930313234353637383940414243444546484950126
11141725263347
About corrplot Seriation Application Examples GAP
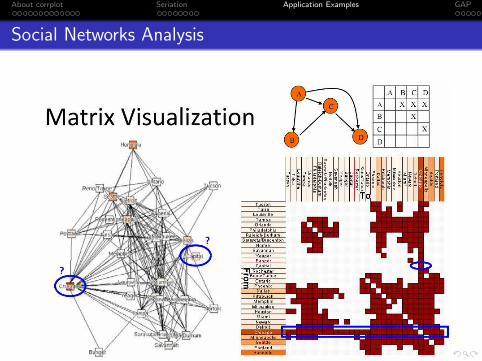
Social Networks Analysis
About corrplot Seriation Application Examples GAP
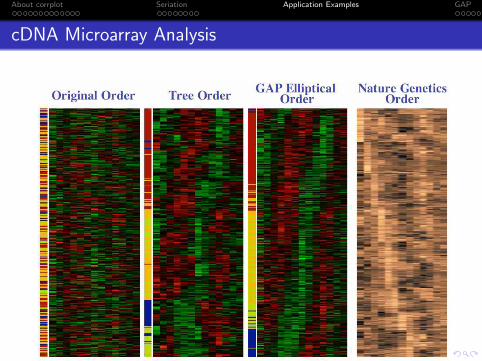
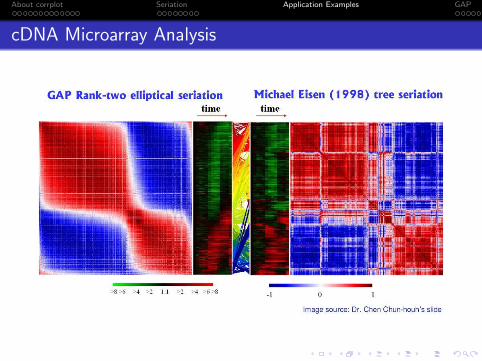
cDNA Microarray Analysis
About corrplot Seriation Application Examples GAP
cDNA Microarray Analysis

About corrplot Seriation Application Examples GAP
Outline
1 About corrplotGraph Gallery in corrplot PackageDetails and TipsSummary
2 SeriationWhy needCriterionMethod
3 Application Examples
4 GAPscreenshots
About corrplot Seriation Application Examples GAP
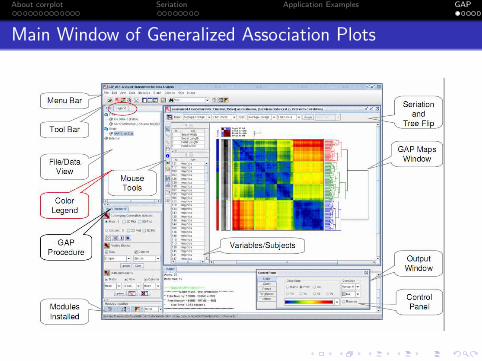
Main Window of Generalized Association Plots
About corrplot Seriation Application Examples GAP
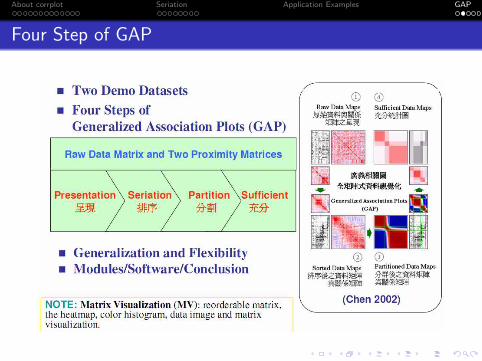
Four Step of GAP
About corrplot Seriation Application Examples GAP
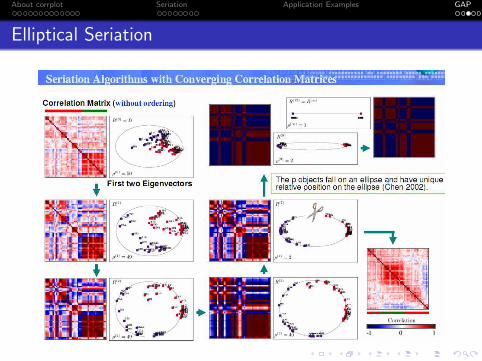
Elliptical Seriation
About corrplot Seriation Application Examples GAP
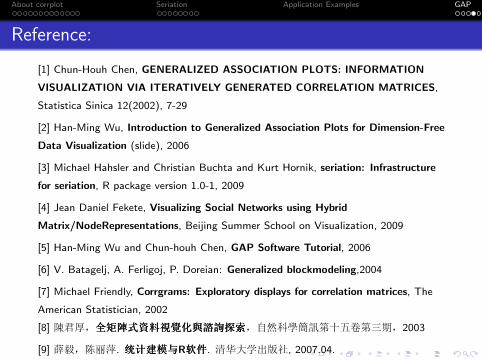
Reference:
[1] Chun-Houh Chen, GENERALIZED ASSOCIATION PLOTS: INFORMATION
VISUALIZATION VIA ITERATIVELY GENERATED CORRELATION MATRICES,
Statistica Sinica 12(2002), 7-29
[2] Han-Ming Wu, Introduction to Generalized Association Plots for Dimension-Free
Data Visualization (slide), 2006
[3] Michael Hahsler and Christian Buchta and Kurt Hornik, seriation: Infrastructure
for seriation, R package version 1.0-1, 2009
[4] Jean Daniel Fekete, Visualizing Social Networks using Hybrid
Matrix/NodeRepresentations, Beijing Summer School on Visualization, 2009
[5] Han-Ming Wu and Chun-houh Chen, GAP Software Tutorial, 2006
[6] V. Batagelj, A. Ferligoj, P. Doreian: Generalized blockmodeling,2004
[7] Michael Friendly, Corrgrams: Exploratory displays for correlation matrices, The
American Statistician, 2002
[8] =�þ§���ÝÝÝ444ªªªiii���rrrôôôzzz��� ÜÜÜ&&&¢¢¢§g,�A�(1�Êò1nϧ2003
[9] ÅÀ§�w±. ÚÚÚOOOïïï������R^̂̂���. �u�ÆÑ��, 2007.04.

About corrplot Seriation Application Examples GAP
Acknowledgements
I am grateful to Yihui, linkinbird, wind, paladin1651, zwdbordeaux,
miniwhale, lovelyday, Ihavenothing, Saul, pengchy, myli, soweimei,
sunfeng06, 7¶, sbdwgu, luansheng, bjt, dingpeng, etc, for their nice
comments and great suggestions in COS Home and Forum.
I am also grateful to Shuai Huang, Roimain Francois, David Smith,
Andrew Gelman, Tian Zheng, Bob, Sandip, Fangqin, Rory, Xiaoru,
Michelle Zhou, Shixia, Jean Daniel, Kwanliu, Guohui, Zhanwu, Jian
Huang, Hanwei, Alex Pang, etc, for their warm encouragements and
relevant criticisms while we talked face-to-face and exchanged ideas via
email, blog.
Special thanks should go to Yixuan, Lanfeng, Anhua, Hao Li, Chen Zuo,
Jiebiao, Ying Fang , Jian Fan, Yanping, Peng Ding, Linlin, Sizhe, Yihui,
Liyun, Junwei, Tang Li, Yifeng, Chi Zhang, Xing Wang, Bo Zhang, etc,
for their sweet consideration and invaluable help when I was in Beijing.
Thank RUC, ECNU, Mango Solutions and everyone here :)

About corrplot Seriation Application Examples GAP
Best Wishes For You!
Thank You
Tel: 135-08489467Email: [email protected]
Blog: http://taiyun.cos.name