an introduction to python (with some science)
TRANSCRIPT

An Introduction to Python (with someScience)
Release Ed 0.3.2
Jeff A
Feb 12, 2019

Contents
1 The shell: awesome calculator 11.1 Launching IDLE . . . . . . . . . . . . . . . . . . . . . . . . . . . . . . . . . . . . . . . . . . . . . 11.2 Again, again! . . . . . . . . . . . . . . . . . . . . . . . . . . . . . . . . . . . . . . . . . . . . . . . 31.3 Space is big . . . mind-bogglingly big . . . . . . . . . . . . . . . . . . . . . . . . . . . . . . . . . . 41.4 And my brain is so small . . . . . . . . . . . . . . . . . . . . . . . . . . . . . . . . . . . . . . . . . 5
2 IDLE: write a program 72.1 Launching IDLE to write a program . . . . . . . . . . . . . . . . . . . . . . . . . . . . . . . . . . . 72.2 Using the turtle library . . . . . . . . . . . . . . . . . . . . . . . . . . . . . . . . . . . . . . . . 82.3 A triangle . . . . . . . . . . . . . . . . . . . . . . . . . . . . . . . . . . . . . . . . . . . . . . . . . 92.4 Define your own function . . . . . . . . . . . . . . . . . . . . . . . . . . . . . . . . . . . . . . . . 102.5 A splash of colour . . . . . . . . . . . . . . . . . . . . . . . . . . . . . . . . . . . . . . . . . . . . 112.6 Read The Friendly Documentation . . . . . . . . . . . . . . . . . . . . . . . . . . . . . . . . . . . 13
3 Spectacular Spirals 153.1 First take your polygon . . . . . . . . . . . . . . . . . . . . . . . . . . . . . . . . . . . . . . . . . . 153.2 Offset and fill the polygon . . . . . . . . . . . . . . . . . . . . . . . . . . . . . . . . . . . . . . . . 163.3 Turn and repeat . . . . . . . . . . . . . . . . . . . . . . . . . . . . . . . . . . . . . . . . . . . . . . 173.4 Grow a little each time . . . . . . . . . . . . . . . . . . . . . . . . . . . . . . . . . . . . . . . . . . 173.5 Choose wild numbers . . . . . . . . . . . . . . . . . . . . . . . . . . . . . . . . . . . . . . . . . . 18
4 Colour in the computer 214.1 Red, Green, Blue . . . . . . . . . . . . . . . . . . . . . . . . . . . . . . . . . . . . . . . . . . . . . 214.2 An RGB colour square . . . . . . . . . . . . . . . . . . . . . . . . . . . . . . . . . . . . . . . . . . 22
5 Colour gets arty 255.1 RGB and HSL colour . . . . . . . . . . . . . . . . . . . . . . . . . . . . . . . . . . . . . . . . . . 255.2 A colour wheel . . . . . . . . . . . . . . . . . . . . . . . . . . . . . . . . . . . . . . . . . . . . . . 25
6 The Koch Snowflake 296.1 The basic unit . . . . . . . . . . . . . . . . . . . . . . . . . . . . . . . . . . . . . . . . . . . . . . 296.2 Recursion . . . . . . . . . . . . . . . . . . . . . . . . . . . . . . . . . . . . . . . . . . . . . . . . . 306.3 Need for speed . . . . . . . . . . . . . . . . . . . . . . . . . . . . . . . . . . . . . . . . . . . . . . 326.4 Looks like snow . . . . . . . . . . . . . . . . . . . . . . . . . . . . . . . . . . . . . . . . . . . . . 32
7 Celestial Wheels 337.1 Turtles, turtles, turtles . . . . . . . . . . . . . . . . . . . . . . . . . . . . . . . . . . . . . . . . . . 33
i

7.2 Setting up the guide turtles . . . . . . . . . . . . . . . . . . . . . . . . . . . . . . . . . . . . . . . . 347.3 Moving the guides . . . . . . . . . . . . . . . . . . . . . . . . . . . . . . . . . . . . . . . . . . . . 357.4 Compute the shape . . . . . . . . . . . . . . . . . . . . . . . . . . . . . . . . . . . . . . . . . . . . 357.5 Tidy up . . . . . . . . . . . . . . . . . . . . . . . . . . . . . . . . . . . . . . . . . . . . . . . . . . 367.6 Inspiring examples . . . . . . . . . . . . . . . . . . . . . . . . . . . . . . . . . . . . . . . . . . . . 387.7 Some advanced questions . . . . . . . . . . . . . . . . . . . . . . . . . . . . . . . . . . . . . . . . 38
ii

CHAPTER 1
The shell: awesome calculator
We can talk directly to Python through a program called “the shell”. You can run the shell by launching IDLE.
1.1 Launching IDLE
Launch IDLE from the “programming” section of the desktop menu. The menu will look a little like this:
Make sure you pick IDLE 3. This will open a “shell” window like this:
1

An Introduction to Python (with some Science), Release Ed 0.3.2
Python is ready to do things for you. At the >>> prompt type 6*7. The star * means multiplication. Python will replywith the answer 42.
Hint: You will often make mistakes and get rude, red error messages from Python. Don’t worry: this is normal inprogramming. Try to guess what you did wrong and try again at the next >>> prompt.
Now try this:
>>> a = 7>>> b = 6>>> a * b42
a and b are variables. A variable is just a name you use for a value that matters to you. The = means “make the namerefer to this value”.
About names for variables
You can use almost name for a variable, made of letters, digits and the _ character, but not spaces. An exampleis top_5_cats. You can’t start with a digit, because that looks like a number to Python. You can’t use the 33words already taken by Python (like for and in), that come out orange in IDLE. You can use names like printor list (purple in IDLE) that already mean something to Python, but it confuses humans.
Programmers use short names (letters) for variables that are not needed for long. When a variable will be used inlots of places, they use long helpful names to remind them what it means.
When we tell Python to do a calculation, instead of a number, we can use a variable that refers to the number. It couldbe an easy calculation, or one that’s a bit complicated:
>>> a + b13>>> (a+b) * (a-b)13
2 Chapter 1. The shell: awesome calculator

An Introduction to Python (with some Science), Release Ed 0.3.2
You can make the variable (the name) mean something different any time you like. Try:
>>> a = 116
Let’s re-calculate the complicated expression, but without typing. In the IDLE shell, you can re-use lines you typedearlier. Put the cursor on the line that says (a+b) * (a-b), using the mouse or the arrow keys, and press enter.This makes a copy of that line at the prompt, as if you had typed it. Press enter again, and Python will work it out:
>>> (a+b) * (a-b)13420
This time, the meaning of a is different, so you get a different answer.
A variable can refer to any kind of information. Sometimes you want to refer to a string of text. Strings are written inquotes. Single and double quotes mean the same, and you can use + to stick strings together:
>>> h = 'Hello'>>> w = "world!">>> h + ' ' + w'Hello world!'
1.2 Again, again!
Just now, we used the same expression over again with a new value by copying. Often, you need to work somethingout for a whole list of values. Here is a list being assigned to a variable and printed out (try it):
>>> alist = [2, 0.5, a, 2*b, "banana"]>>> print(alist)[2, 0.5, 116, 12, 'banana']
Notice that the expressions in the list (like a and 2*b) were calculated as the list was being made.
Now type at the prompt:
>>> n = 3>>> for x in alist:
print(n, 'times', x, 'is', n*x)
After the first line, the IDLE shell will move the cursor across, so the next line starts in the right place. It will do thatagain after your print statement in case you have another line to enter. Enter an empty line and it will know you’vefinished.
If you made a mistake, use the trick you learned earlier to copy your first attempt to the prompt so you can edit it. Putthe cursor at the end of the last line and press enter twice to try again.
What happened here?
Python looked at for x in and understood that you wanted to use a variable called x, and make it refer to each ofthe values in the list. And for each different value given to x, you wanted to do what it says on the next line. Theprint(...) part means print those things on a line in the shell window.
We call this whole thing a “for-loop”, because the computer goes round and round the same instructions, once for eachvalue.
Often we want to do this with a list of numbers. Remember you can save typing using the copy trick, just changealist to range(13) and hit return on the last line:
1.2. Again, again! 3

An Introduction to Python (with some Science), Release Ed 0.3.2
>>> for x in range(13):print(n, 'times', x, 'is', n*x)
If you did it right, Python will have replied with the 3-times table. Or the times-table for whatever you set n to. Trythe biggest number you can think of.
The range(13) that comes where alist used to be, means “all the numbers from zero up to, but not including,13”. You can see the lists range makes like this:
>>> list( range(10) )[0, 1, 2, 3, 4, 5, 6, 7, 8, 9]>>> list( range(5,13) )[5, 6, 7, 8, 9, 10, 11, 12]
1.3 Space is big . . . mind-bogglingly big
Super powers of the mathematician
A mathematician would call these “the powers of 3”. She would write them like this: 34, 35 and 36, and say themlike “3 to the 4” and so on.
Notice that the order of the numbers matters when you compute powers:
>>> 6**1060466176>>> 10**61000000
610 is a much bigger number than 106 (a million).
Try some really big powers. What are 3100, 31000, and 310000? What do you notice about the last few digits of thesenumbers? And do you get the same pattern with powers of other numbers (7 or 2, say)? Patterns in powers ofnumbers are behind the codes that keep us safe on the Internet.
If you want to investigate this, Python will do the hard work for you. (Use what you learned about the for-loop tomake tables of powers.)
Sometimes we need to multiply the same number together several times:
>>> 3*3*3*381
You could do that with a for-loop, but there’s a helpful shortcut for it:
>>> 3**481>>> 3**5243>>> 3**6729
Python will happily calculate enormous numbers. Eighty tens multiplied together is roughly the number of atoms inthe Universe:
4 Chapter 1. The shell: awesome calculator

An Introduction to Python (with some Science), Release Ed 0.3.2
>>> 10**80100000000000000000000000000000000000000000000000000000000000000000000000000000000
That’s still a small number to Python. What’s a thousand twos multiplied together (2**1000)? Or ten-thousand?
If you keep going like this, you will run out of computer memory or patience before Python gives up.
1.4 And my brain is so small
Programmers can’t possibly know everything about a language. (Python has thousands of features.) Don’t worry, helpis at hand.
If your machine is connected to the Internet (or you have the documentation installed specially) the IDLE menu “Help”>> “Python Docs” will take you there in a browser.
If you’ve followed this project to here, you’re already up to Chapter 3 of the Tutorial.
1.4. And my brain is so small 5
An Introduction to Python (with some Science), Release Ed 0.3.2
6 Chapter 1. The shell: awesome calculator
CHAPTER 2
IDLE: write a program
You’re using Python, but you haven’t written a program yet. A program has instructions like the ones you’ve typed,but they’re saved so you can use them any time you want.
2.1 Launching IDLE to write a program
The best way to start a Python project is to make an empty Python file in the folder where you want to work, then openit with IDLE.
On the RPi, in your home folder, use the file manager to make or find a suitable folder (called club, say). Go intothat folder, then right-click, and make a new file. Call it first.py.
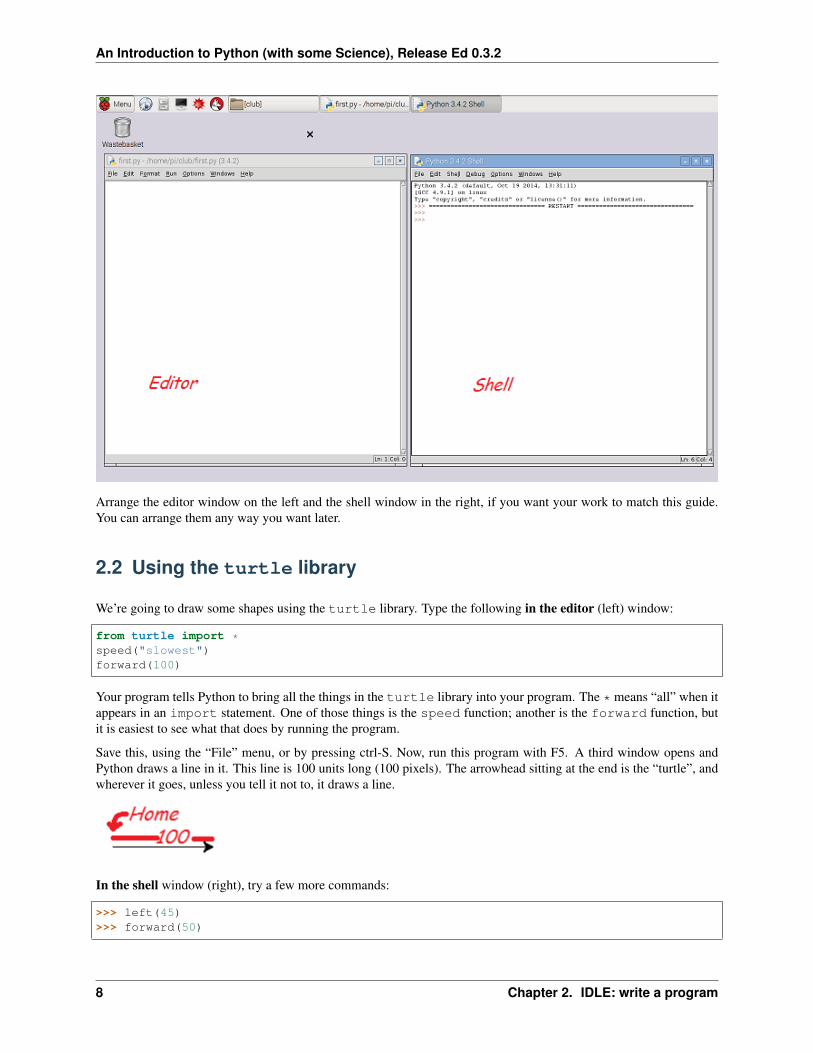
Right-click on that file (first.py) and open it with Python 3 IDLE. This is the editor, where you will type yourprogram. To open the shell from here, use the “Run” menu, or press F5. Try it now.
7
An Introduction to Python (with some Science), Release Ed 0.3.2
Arrange the editor window on the left and the shell window in the right, if you want your work to match this guide.You can arrange them any way you want later.
2.2 Using the turtle library
We’re going to draw some shapes using the turtle library. Type the following in the editor (left) window:
from turtle import *speed("slowest")forward(100)
Your program tells Python to bring all the things in the turtle library into your program. The * means “all” when itappears in an import statement. One of those things is the speed function; another is the forward function, butit is easiest to see what that does by running the program.
Save this, using the “File” menu, or by pressing ctrl-S. Now, run this program with F5. A third window opens andPython draws a line in it. This line is 100 units long (100 pixels). The arrowhead sitting at the end is the “turtle”, andwherever it goes, unless you tell it not to, it draws a line.
In the shell window (right), try a few more commands:
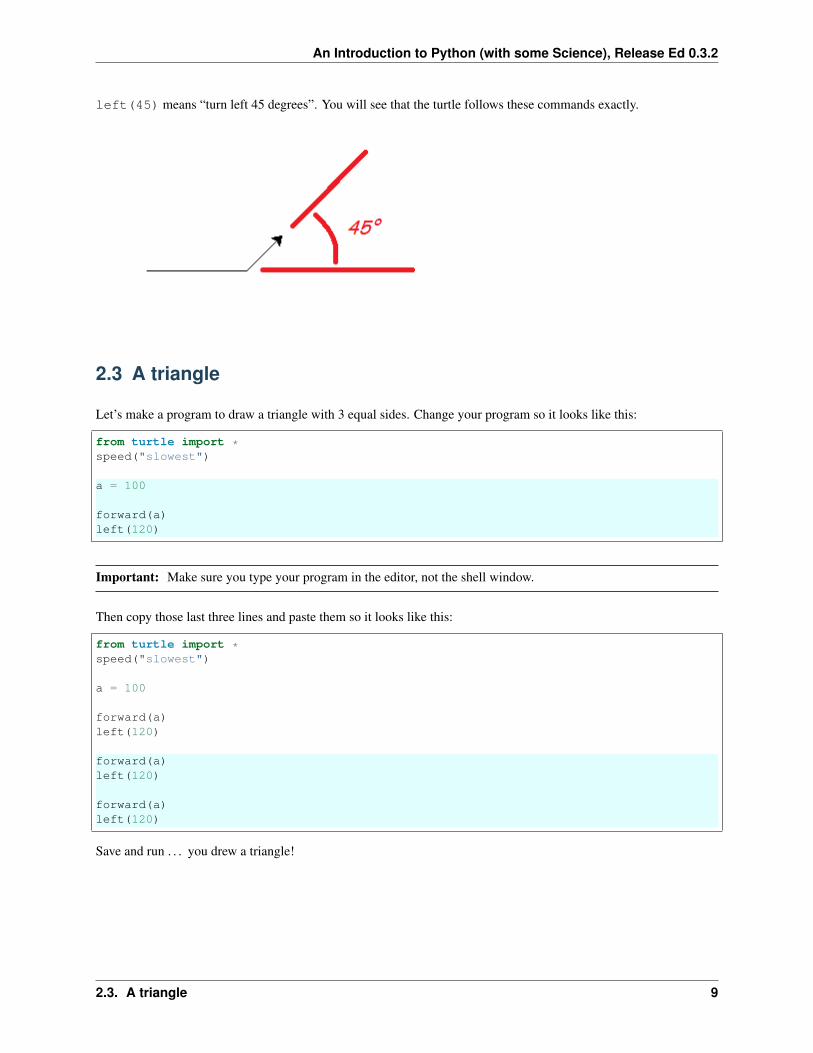
>>> left(45)>>> forward(50)
8 Chapter 2. IDLE: write a program
An Introduction to Python (with some Science), Release Ed 0.3.2
left(45) means “turn left 45 degrees”. You will see that the turtle follows these commands exactly.
2.3 A triangle
Let’s make a program to draw a triangle with 3 equal sides. Change your program so it looks like this:
from turtle import *speed("slowest")
a = 100
forward(a)left(120)
Important: Make sure you type your program in the editor, not the shell window.
Then copy those last three lines and paste them so it looks like this:
from turtle import *speed("slowest")
a = 100
forward(a)left(120)
forward(a)left(120)
forward(a)left(120)
Save and run . . . you drew a triangle!
2.3. A triangle 9

An Introduction to Python (with some Science), Release Ed 0.3.2
This kind of cut-and-paste code is ugly to programmers. We do repetition with a for-loop. Change your code to bemore elegant, like this:
from turtle import *speed("slowest")
a = 100
for i in range(3):forward(a)left(120)
Run it to make sure you get the same result.
You can change the size of the triangle by changing the value a refers to. But suppose we want to change the numberof sides? Could we just change the 3 to a 4 to draw a square? We will get 4 lines, but the angle 120 degrees is onlycorrect for a triangle.
We can work out what to do. Watch the turtle carefully as it draws a triangle. It turns all the way round once, as if youhad typed left(360) in the shell. (There are 360 degrees in a full rotation.) To get the shape we want, this rotationhas to be shared equally between all the corners. So now we know how much to turn each time we draw a line. In ashape with n corners, it’s 360/n degrees:
from turtle import *speed("slowest")
a = 100n = 4
for i in range(n):forward(a)left(360/n)
Try changing the value n refers to and running the program again.
2.4 Define your own function
You have been happily using functions like range, print and forward. You use a function (we say you call it)by giving the name, followed by values (called arguments) in parentheses ().
You can also wrap up a piece of your own code in a function, using the def keyword. It might be code you want touse in several places, or even put in a library for someone else to use.
Here’s how to define a function to draw a shape with equal sides. You’re nearly there already. Change your programto look like this:
from turtle import *speed("slowest")
(continues on next page)
10 Chapter 2. IDLE: write a program

An Introduction to Python (with some Science), Release Ed 0.3.2
(continued from previous page)
def polygon(a, n):for i in range(n):
forward(a)left(360/n)
Notice what has happened to a and n: you deleted the lines that give these variables their values. Instead, a and n arementioned in the function definition, and they only exist inside the function while it is working. You give them theirvalues each time you call the function.
Hint: You type the next few things in the shell, after your program has run. Code you type in the shell is shown withthe shell prompt >>>. (Don’t type the >>>.)
Now, if you run your program . . . nothing much happens. At the shell prompt (right) try:
>>> polygon(50, 3)>>> polygon(50, 4)>>> polygon(50, 5)
You should get a triangle, a square and a pentagon. (If you got an error message, try to figure out from it where youwent wrong.) Now that your shape is a function, you can make a pattern with it. Try:
>>> clear()>>> for i in range(3):
polygon(100, 6)right(120)
Try to work out what this does, then run it:
>>> clear()>>> for i in range(20):
polygon(5*i, 3)left(30)
2.5 A splash of colour
Our thin black lines are a little dull.
What is beautiful?
You’ve reached the point where simple drawings turn into pleasing shapes. It’s worth asking why.
2.5. A splash of colour 11

An Introduction to Python (with some Science), Release Ed 0.3.2
We like symmetry, repetition and precision, which are things computers do well. And we like to discover a pattern,which is what your code supplies. Similarity to things we’ve seen in nature, and colours that “go together” alsomake objects look right to us.
One theory is that our human mind is constantly looking for simple explanations for what we see. The pattern hasto be complex enough to be interesting, but simple enough to make sense. The programs here and in projects tocome are quite simple, although you might not guess the program from the picture.
In the little universe of our computer, shapes that resemble nature are called into existence with just a few words.
You can change the pen you use, or fill the shapes you draw with colour. Notice that the turtle module uses theAmerican spelling “color”. Change your program like this, or with some other shapes, to try out the colour functions:
from turtle import *speed("fastest")
def polygon(a, n):for i in range(n):
forward(a)left(360/n)
pencolor("dark green")pensize(5)
fillcolor("light green")
for i in range(20):begin_fill()polygon(5*i, 3)end_fill()left(30)
It is easy to guess what most of the new functions do. The bit that may be puzzling you is how to fill the shape withcolour. The call to begin_fill means “start remembering what you’ve drawn”. Then you can draw any shape (oras many shapes as you like). And finally, the call to end_fill says “fill what you remember drawing”.
What difference does it make if begin_fill and end_fill are outside the loop, like this:
begin_fill()for i in range(20):
polygon(5*i, 3)left(30)
end_fill()
12 Chapter 2. IDLE: write a program

An Introduction to Python (with some Science), Release Ed 0.3.2
2.6 Read The Friendly Documentation
Press F1, and IDLE will open the Python documentation in a browser. Go to the “Global Module Index”, then to letter“t”, and the “turtle” module. All the functions we have used and many more are explained. Visit a few you think youunderstand (like forward), then take a look at some you might be interested in trying out.
You won’t understand all of it, but don’t let that put you off. Try things; make mistakes; learn.
2.6. Read The Friendly Documentation 13

An Introduction to Python (with some Science), Release Ed 0.3.2
14 Chapter 2. IDLE: write a program

CHAPTER 3
Spectacular Spirals
This project uses turtle graphics to draw spirals: choose your own design. On the way, we meet a spiral that is 200million years old.
3.1 First take your polygon
Start the project by making an empty file spiral.py. Right-click and open it with IDLE. Type this (or copy mostof it from final.py in the introduction) and save it:
from turtle import *speed("fastest")
def polygon(a, n):"n-sided polygon, side a."for i in range(n):
forward(a)left(360/n)
The new line is called a documentation string, a little reminder of what the function does. It makes no difference towhat the code does, but in IDLE, when you get as far as typing polygon(, IDLE will pop up this string as a reminder.
Important: Never throw code away.
In these projects we explain the program a piece at a time. Mostly you should add each new code fragment to theprogram you have already, normally at the end. Sometimes the fragments show a change to what you have.
Occasionally, there is a short fragment of code that you only need for a few tests, then you’ll replace it.
If ever you want to delete a lot of code, first use “File” >> “Save Copy As” and give a name like spiral_2.py, soyou can go back to your program as it was.
15

An Introduction to Python (with some Science), Release Ed 0.3.2
3.2 Offset and fill the polygon
Your program is going to draw lots of different spirals. Here’s a simple example where you can see what’s going on:
Drawing starts with the smallest square tile, nearest the middle, and continues anti-clockwise, putting down tiles.
Each tile is slightly bigger than the last. Each circuit has the same number of tiles, that you choose, 9 in this case. Bythe time it gets round once, the tile is twice the original size, and twice as far from the centre. It will go round as manytimes as you choose.
You will draw each tile with your polygon method. To put it in the right place, suppose the turtle is in the centre,and pointing the right way. We need to go forward some distance, then draw the polygon. Then we go back to thecentre, ready for next time.
In code, it looks like this:
def tile(r, a, n):"n-sided polygon, side a, at range r (assumes pen is up)."forward(r)pendown()
begin_fill()polygon(a, n)end_fill()
penup()back(r)
Add that at the end of your program, and then add this to test it:
# Testfillcolor("red")tile(100, 50, 6)
Lines that begin with a # are comments. Python ignores them: they’re a hint to the humans. You should put commentsin code you invent, but you don’t have to copy them in these examples.
Save and run that. It should look like this:
16 Chapter 3. Spectacular Spirals

An Introduction to Python (with some Science), Release Ed 0.3.2
The initial line is not a fault: it is there because we started with the pen down.
3.3 Turn and repeat
Putting the tiles down in a spiral is still too difficult for us in one leap. Think instead how would we put tiles down ina circle.
That would be rather like drawing a polygon, except we use the tile function each time instead of forward. Addafter your last function:
def circ(r, scale, n, tiles):"Circle of n-sided polygons at radius r and size r/scale."# Angle between each tilestep = 360 / tiles
# Now draw itpenup()for i in range(tiles):
tile(r, r/scale, n)left(step)
Change your test code at the end to read:
# Testfillcolor("red")circ(100, 10, 4, 9)
Save and run: you should get a circle of 9 little squares.
3.4 Grow a little each time
How can we turn the circle into a spiral? This means making the distance from home (the radius) and the tile sizegrow each time a tile is placed.
Here “grow” means that we should multiply the size and the radius by some amount each time we put down a tile.The growth factor should be only a little more than one, or the size will get huge in just a few tiles. Remember whathappens to powers of numbers from chapter 1?
We have to work out the starting radius and the growth per tile. Choosing that number, a little bigger than one, to getthe final size you want, is the the hardest part. You may not have learned the maths for this yet, but the commentsexplain what’s happening. Add after your last function:
3.3. Turn and repeat 17
An Introduction to Python (with some Science), Release Ed 0.3.2
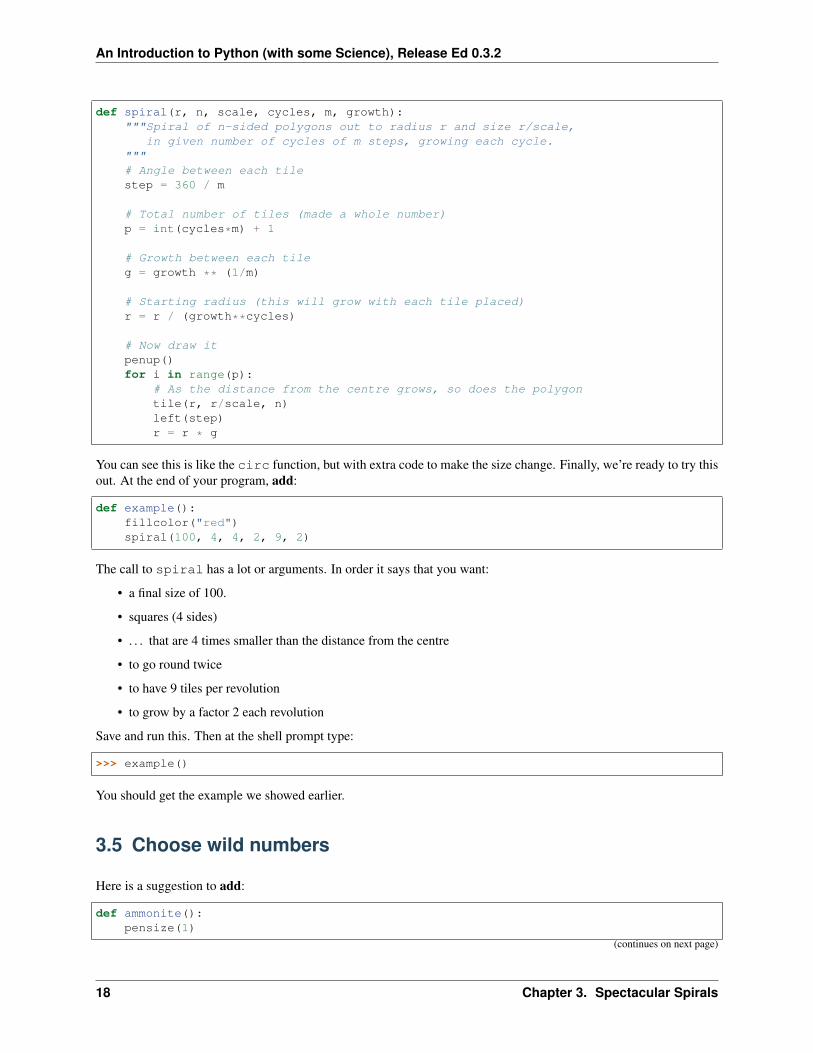
def spiral(r, n, scale, cycles, m, growth):"""Spiral of n-sided polygons out to radius r and size r/scale,
in given number of cycles of m steps, growing each cycle."""# Angle between each tilestep = 360 / m
# Total number of tiles (made a whole number)p = int(cycles*m) + 1
# Growth between each tileg = growth ** (1/m)
# Starting radius (this will grow with each tile placed)r = r / (growth**cycles)
# Now draw itpenup()for i in range(p):
# As the distance from the centre grows, so does the polygontile(r, r/scale, n)left(step)r = r * g
You can see this is like the circ function, but with extra code to make the size change. Finally, we’re ready to try thisout. At the end of your program, add:
def example():fillcolor("red")spiral(100, 4, 4, 2, 9, 2)
The call to spiral has a lot or arguments. In order it says that you want:
• a final size of 100.
• squares (4 sides)
• . . . that are 4 times smaller than the distance from the centre
• to go round twice
• to have 9 tiles per revolution
• to grow by a factor 2 each revolution
Save and run this. Then at the shell prompt type:
>>> example()
You should get the example we showed earlier.
3.5 Choose wild numbers
Here is a suggestion to add:
def ammonite():pensize(1)
(continues on next page)
18 Chapter 3. Spectacular Spirals

An Introduction to Python (with some Science), Release Ed 0.3.2
(continued from previous page)
color("peru", "wheat")spiral(100, 6, 3/2, 4.7, 22.5, 2)hideturtle()
The Ammonite
This spiral looks like the shell of a creature that lived in Earth’s oceans 200 million years ago.
The ammonite lived in the last chamber of a spiral shell, while the others it filled with air. It could only grow inproportion to the existing size of the shell: too big and it would sink and die, because there would not be enough airto keep it afloat.
This exact proportion of the new chamber to the previous ones is the rule built into your program. Your programhelps explain why the creature grew in a perfect geometric spiral.
And here is another a suggestion to add:
def vortex():pensize(5)color("navy blue", "royal blue")spiral(500, 6, 3, 15, 4.2, 1.4)hideturtle()
Call them at the shell prompt, like you did with example(). The function call reset() will clear the drawingwindow between tests.
In the vortex you get a sort of two-way spiral because the number of tiles per cycle is not a whole number, but isclose to a whole number (4.2). So what might have been 4 straight lines becomes 4 curved lines. What number wouldmake them curve the other way?
Try calling spiral in your own function with a variety of numbers. If you find a combination you like, give it a new
3.5. Choose wild numbers 19

An Introduction to Python (with some Science), Release Ed 0.3.2
name.
20 Chapter 3. Spectacular Spirals

CHAPTER 4
Colour in the computer
This project explores how colour is represented as numbers in a computer, by showing the colours you can mix onyour screen, from the basic red, green and blue that a monitor can produce. It assumes you know about for-loops andfunctions. It introduces the idea of tuples to represent colour.
4.1 Red, Green, Blue
Start the project by making an empty file rgb.py. Right-click and open it with IDLE. Type in the editor:
# Explore RGB colourfrom turtle import *
def square(a, c):fillcolor(c)begin_fill()for i in range(4):
forward(a)left(90)
end_fill()
Save and run this file. Then in the shell type:
>>> square(50, "lime green")
You should get a filled square of size 50.
This command, and the code in most other projects in this set, select colours by name. It is difficult to know whatnames you can use, or what they mean. (Look up “X11 colour names” in Wikipedia if you care about the differencebetween “light goldenrod” and “papaya whip”.)
21

An Introduction to Python (with some Science), Release Ed 0.3.2
Run the program again, just to clear the screen, and type:
>>> square(50, (.2, .8, .2) )
You should get exactly the same filled square as before.
RGB colour in web pages
On web pages, in HTML and CSS, you can use similar names to the ones in the turtle module. (Just remove thespaces.)
You can also use the notation rgb(20%, 80%, 20%) (that’s lime green again). This is the method most like thetuples that turtle uses.
You will most often see colours written in hexadecimal. “lime green” is #50CD50. Python turtle can understandthese hexadecimal colours too, but humans shouldn’t have to.
In the turtle module, the names for colours are turned into 3 numbers, that can be written in like this (r, g, b).This is called a tuple in Python. A tuple is a lot like a list, except that you can’t change what’s in it.
The numbers in a colour tuple have to be between zero and one. They represent the amount or red, green and bluein the colour, in that order. (1,0,0) is red, (0,1,0) is green, (0,0,1) is blue, and (0,0,0) is black. Everyother colour is a mixture of some kind. We call this the “RGB model”. Try a few mixtures:
>>> square(50, (.5, 0, 0))>>> square(50, (.5, .7, 0))>>> square(50, (.5, .3, 0))>>> square(50, (.5, .3, .6))
Remember, you don’t have to type all this: pull down the previous line with up-arrow and the enter key, then changethe parts that should be different.
4.2 An RGB colour square
Let’s write a program to experiment some more with RGB colours.
We need a program that will step though colour combinations, and show each of them to us. Because there are threecolours, this is a little messy, but for two colours we can make a grid of little squares. Add this function to your code:
22 Chapter 4. Colour in the computer

An Introduction to Python (with some Science), Release Ed 0.3.2
def rg_square(a, blue=0, N=10):# N+1 little squares wide so ...a = a/(N+1)start = position()for i in range(N+1):
green = i/N# Go to start of row isetposition( start + (0,i*a) )for j in range(N+1):
# Draw square j on row ired = j/Nc = (red, green, blue)square(a, c)forward(a)
setposition(start)
And at the end add this short program to your code:
# Programhideturtle()penup()speed("fastest")
rg_square(200)
Red + green = yellow?!
The design you get from rg_square(200) mixes green and red light in different amounts, and the amount ofblue is zero. Was it a surprise to find yellow at the top right?
Take a close look at this on your screen. You’ll see only green and red dots. Stand back and yellow is what yourbrain sees. There is such a thing as real, yellow light, that has a wavelength between red and green. Light wavesfrom a yellow LED or the older kind of streetlamp are 590 billionths of a metre long.
Your eyes have red, green and blue sensors, but they’re not very precise. Real yellow light is between red and green,and excites the sensors about equally. So that’s all the computer has to do to make you see yellow.
There are infinitely more colours in real life than human eyes can see, or your monitor produce.
There are two loops in rg_square, one inside the other. The inner one draws a row of squares with increasingamounts of red. The outer one chooses increasing amounts of green in each row. Save and run. You should see 121different combinations of red and green.
Finally, let’s experiment with adding blue. Add this function to your code:
from time import sleep
(continues on next page)
4.2. An RGB colour square 23

An Introduction to Python (with some Science), Release Ed 0.3.2
(continued from previous page)
def rgb_cube(a, N=10):for b in range(N):
blue = (b+1)/Nrg_square(a, blue, N)sleep(1)update()
Change your program to call the new function instead of rg_square:
# Programhideturtle()penup()bgcolor((0,0,0))tracer(0)
rgb_cube(200)
This begins with the same red-green square as before, then it adds more and more blue (in 10 steps). You can think ofthese as layers of a cube that has red-green on the bottom, and increasing amounts of blue as you go higher. What yousee at the end is the top of the cube. Just for fun, try bigger values of N.
24 Chapter 4. Colour in the computer

CHAPTER 5
Colour gets arty
This project looks at colour the way a website developer or graphic artist might. It draws a colour wheel using hueand lightness. It makes use of named and default arguments to functions. It is helpful to have done the RGB colourproject, but not essential.
5.1 RGB and HSL colour
Colour is stored in your computer in the same way that it is put on your screen: as amounts of red, green and bluelight. This is called the RGB model. You may already have looked at this in the RGB colour project.
If you are a web designer, or choosing colours for your room, the RGB model is not the best way to think about colour.You might prefer to think in these terms:
• hue: the actual colour, where it belongs in the rainbow.
• saturation: how strong the colour is; how different it is from grey.
• lightness: a scale from black (0), through brightly-coloured (0.5), to white (1).
This is called the HSL model. In this project you will use the Python library module called colorsys to convertfrom HSL to the RGB model that turtle needs.
5.2 A colour wheel
Start the project by making an empty file wheel.py. Right-click and open it with IDLE.
You’re going to make a sort of circular rainbow, where the hue goes from zero to one. At each hue, you will draw athin pie-slice (a sector) in that colour. Type in the editor:
# Explore HSL colourfrom turtle import *import colorsys
(continues on next page)
25

An Introduction to Python (with some Science), Release Ed 0.3.2
(continued from previous page)
def sector(r, angle, c):"Sector filled with colour c"fillcolor(c)begin_fill()forward(r)left(90)circle(r, angle)right(90)backward(r)end_fill()
Save and run this file. Test this function in the shell by typing:
>>> sector(200, 15, (0,0,1))
You should see a blue sector:
(If it didn’t work, debug your code.) In the function call, we specified the colour as an RGB tuple (0,0,1), meaningno red, no green, and 1 full unit of blue. (The numbers in a colour tuple are fractions that run from zero to one.)
Colour in website design
Web designers take a lot of care over the colours they use. One simple way to get a pleasing set of colours is tochoose the same hue for all of them.
Here is a set of 5 colours that all have the same hue (0.3), but have different saturation and lightness:
26 Chapter 5. Colour gets arty

An Introduction to Python (with some Science), Release Ed 0.3.2
A designer might use the first three for headings, text and background, and the last two for boxes and graphicalhighlights. The use of a single hue means all the colours go well together. The different saturation and lightnessensure that text can be read against the page background and a small amount of the brightest colour catches the eye.
Now we want to piece together a circle from sectors of different colour. The angle of the sectors has to add up to 360degrees. Add this function to your code after the sector function:
def wheel(r, sat=1.0, light=0.5, N=24):"A colour wheel of radius r with N sectors"for i in range(N):
c = colorsys.hls_to_rgb(i/N, light, sat)sector(r, 360/N, c)
Notice that the Python library likes to call the HSL model the HLS model. (Both are ok, just be careful with the orderof the arguments, when you use it.) And when we call it, we have to mention the module colorsys in front: thisis because we used a different kind of import statement. As a test, save and run, then try wheel(200) at the shellprompt.
Add this program at the end of your code:
# Programhideturtle()penup()tracer(0)
K = 50for k in range(K):
r = 300*(1-k/K)wheel(r, light=(K-k-1)/K, sat=1.0, N=120)update()
tracer(0) makes the program run fast by putting off drawing until the call to update.
Save and run this. You should see a wheel of all the hues, like the one in the sidebar. Lightness runs from zero in themiddle (black), to 1 at the rim (white).
To learn how saturation affects colour, try altering sat=1.0 to sat=0.5. How would you change the program todisplay varying saturation, at a lightness you choose? (Remember, a lightness of 0.5 is the most colourful.)
5.2. A colour wheel 27

An Introduction to Python (with some Science), Release Ed 0.3.2
28 Chapter 5. Colour gets arty

CHAPTER 6
The Koch Snowflake
This project draws a fractal curve, with only a few lines of turtle graphics code. It assumes you know about for-loopsand functions. And it introduces the computer science idea of recursion.
6.1 The basic unit
Start the project by making an empty file koch.py. Right-click and open it with IDLE.
We’re going to define a function that either draws a line with a kink in it, or draws a straight line the same length.Which one it does will depend on whether the argument order is greater than zero. Type this in the editor, save it(ctrl-S) and run it (F5):
A bit of geometry
In the order=1 case this function draws a carefully-designed curve:
29

An Introduction to Python (with some Science), Release Ed 0.3.2
Each of the 4 lines is a/3 long, and because of the choice of angles, the distance between the ends of the line is a.
# Draw a Koch snowflakefrom turtle import *
def koch(a, order):if order > 0:
for t in [60, -120, 60, 0]:forward(a/3)left(t)
else:forward(a)
# Testkoch(100, 0)pensize(3)koch(100, 1)
The symbol > means “greater than”. Be careful about the indenting (the spaces before each line). You should get this:
6.2 Recursion
This is where your head explodes. You will replace the forward(a/3) with another call to koch, to draw a kinkedline of the same length. That’s a line with 4 parts, . . .
• and each of those parts has 4 parts,
• and each of those parts has 4 parts,
• and each of those parts has 4 parts, . . .
30 Chapter 6. The Koch Snowflake

An Introduction to Python (with some Science), Release Ed 0.3.2
Well, not in practice. In practice, the variable order goes down by one each time, and when it hits zero, we just drawa line. Change the function koch, just a little:
for t in [60, -120, 60, 0]:koch(a/3, order-1)left(t)
When a function calls itself, we say it is recursive. Recursion can solve problems that simple iteration (like a for-loop)cannot.
Save and run. You will get the same two curves as before, because of the test code. But try this in the shell:
>>> reset()>>> koch(100, 2)
Now each line segment has become a Koch curve. There are 16 little lines.
What happens for koch(100,3) or koch(100,4)? The order 4 curve has 256 tiny lines. One thing that happensis that it starts to take a long time to draw. A call to speed("fastest") before you start drawing will help.
The real Koch Curve
Helge von Koch was a Swedish mathematician. He wanted to prove a curve could exist that was:
• Continuous (you draw it without lifting up your pen).
• Not smooth anywhere (all “corners”).
The real Koch Curve is not any of the things you have drawn. The real Koch curve is what these drawings get closerand closer to as the order goes up, and the lines get smaller. Mathematicians call things defined that way a limit.
The curves we draw all have smooth (straight line) segments. But they look like the Koch curve, once the straightparts are too small for us to see.
Look at the Koch curve drawing, or snowflake, for order 5 or more. Do you see how the same 3-lobe pattern repeatsat different sizes and angles? The whole curve contains miniature versions of itself, smaller and smaller, down intoinvisibility. This is a property of fractals. We say the curve is self-similar.
You can easily see how recursion makes that happen. In the code we have to stop eventually; in the real Koch curve,it goes on forever.
6.2. Recursion 31

An Introduction to Python (with some Science), Release Ed 0.3.2
6.3 Need for speed
The drawing is still too slow once order is 6 or more. (The calculation is fast.) The turtle module wants to showyou every change as it is happening: good when debugging, not so good when you just want the result.
We can delay putting the actions on the screen with the tracer function. But then we have to tell it to appear usingthe update function, when we’re ready.
6.4 Looks like snow
The snowflake is made from 3 Koch curves. Although there are only 3 “sides”, it has 6-fold symmetry, like a realsnowflake.
Delete the test code from your program, and add this program at the end:
# Choose colours and sizecolor("sky blue", "white")bgcolor("black")size = 400order = 0
# Ensure snowflake is centredpenup()backward(size/1.732)left(30)pendown()
# Make it fasttracer(100)hideturtle()
begin_fill()
# Three Koch curvesfor i in range(3):
koch(size, order)right(120)
end_fill()
# Make the last parts appearupdate()
Save and run. This should give you a big, white triangle. Adjust size so it nicely fills the drawing window when run.Now set order to 6 or 7. Run the program and enjoy the result.
How many sides does this have? (Hint: every time the order goes up by one, there are 4 times as many.)
32 Chapter 6. The Koch Snowflake
CHAPTER 7
Celestial Wheels
This project draws a loopy curve, that mathematicians call an epitrochoid, and everyone else calls a spirograph pattern.It introduces the idea of an object and its methods.
7.1 Turtles, turtles, turtles
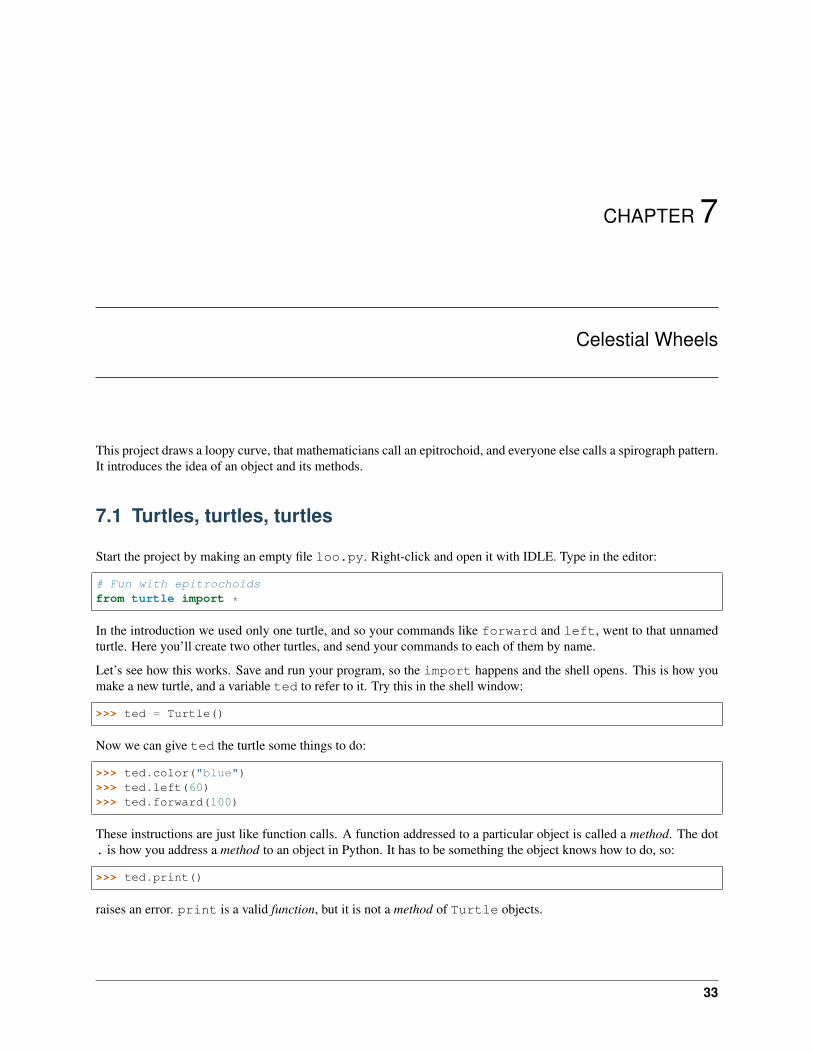
Start the project by making an empty file loo.py. Right-click and open it with IDLE. Type in the editor:
# Fun with epitrochoidsfrom turtle import *
In the introduction we used only one turtle, and so your commands like forward and left, went to that unnamedturtle. Here you’ll create two other turtles, and send your commands to each of them by name.
Let’s see how this works. Save and run your program, so the import happens and the shell opens. This is how youmake a new turtle, and a variable ted to refer to it. Try this in the shell window:
>>> ted = Turtle()
Now we can give ted the turtle some things to do:
>>> ted.color("blue")>>> ted.left(60)>>> ted.forward(100)
These instructions are just like function calls. A function addressed to a particular object is called a method. The dot. is how you address a method to an object in Python. It has to be something the object knows how to do, so:
>>> ted.print()
raises an error. print is a valid function, but it is not a method of Turtle objects.
33

An Introduction to Python (with some Science), Release Ed 0.3.2
7.2 Setting up the guide turtles
Calculating with positions
A position is described with two numbers (x,y). x is how far it is right of home, and y is how far it is up fromhome. We call this pair a vector. A movement, from one position to another, is a vector too: move x right, and yup.
What was going on when you typed this?
>>> mid = (1/2) * (p+q)
When you add two vectors, Python knows to add the x-parts together to get the x-part of the result, then the samewith the y-parts:
>>> p+q(150.00,50.00)
Subtraction works the same way. You can also multiply a number (called a scalar) and a vector together:
>>> (1/2) * (p+q)(75.00,25.00)
Congratulations, you just learned some year 10 maths!
We need two “guide” turtles, each of which draws a circle. Each has to be set up a certain distance from home, so addthis function to your code:
def new_guide(r, c):"Return a new guide turtle of radius r and colour c"t = Turtle()t.speed("fastest")t.color(c)# Go to (r,0) without drawingt.penup()t.setposition(r,0)t.left(90)t.pendown()return t
Notice this function returns a turtle. Save and run, then try this in the shell:
>>> g = new_guide(100, "blue")>>> p = g.position()>>> g.circle(50, 90)>>> q = g.position()>>>>>> mid = (1/2) * (p+q)>>> setposition(mid)
You should see this:
34 Chapter 7. Celestial Wheels

An Introduction to Python (with some Science), Release Ed 0.3.2
The unnamed turtle (black) has moved halfway between start and end of the blue arc.
7.3 Moving the guides
The first job is to make the guides move in their orbits. Add this to your program at the end:
def epitrochoid(a, b, L, M=1):ta = new_guide(a, "blue")tb = new_guide(b, "red")# N little steps s make one circleN = 500s = 360/Nfor i in range(N):
# ta will go L times roundta.circle(a, L*s)# tb will go M times roundtb.circle(b, M*s)
# Testepitrochoid(90, 100, 3, 2)
Save and run. You should see blue and red circles drawn.
The blue turtle goes round L=3 times, and the red turtle M=2 times. You can see how this works in the code. N justhas to be a big enough number to make the final curve smooth. N steps of size s make 360 degrees, exactly one circle.So N steps of L or M steps make L or M full circles.
M=1 on the first line says that, if you don’t give it a value in the call to epitrochoid, M will be equal to 1.
7.4 Compute the shape
The shape we are looking for is drawn by keeping our pen mid-way between the two guides.
Change the epitrochoid function to add these lines:
def epitrochoid(a, b, L, M=1):"Epitrochoid: a, b are guide radii; L, M the number of orbits."ta = new_guide(a, "blue")tb = new_guide(b, "red")# Local function for midpoint between the guidesdef midpoint():
return (1/2) * (ta.position() + tb.position())# Set start position for unnamed turtlepenup()setposition(midpoint())pendown()# N little steps s make one circleN = 500s = 360/Nfor i in range(N):
# ta will go L times roundta.circle(a, L*s)# tb will go M times roundtb.circle(b, M*s)
(continues on next page)
7.3. Moving the guides 35

An Introduction to Python (with some Science), Release Ed 0.3.2
(continued from previous page)
# unnamed will be half-way between themsetposition(midpoint())
Save and run. You should see this:
7.5 Tidy up
It would be nice if the guide circles were not on the final drawing. Add this tidy-up code at the end of epitrochoid,and style the unnamed turtle to your liking:
def epitrochoid(a, b, L, M=1):
ta = new_guide(a, "blue")tb = new_guide(b, "red")...# Erase guidesguide_erase(ta)guide_erase(tb)
def guide_erase(t):"Erase what turtle t drew"t.hideturtle()t.clear()
speed("fastest")width(5)color("lime green")
# Testepitrochoid(90, 100, 3, 2)
hideturtle()
Roman astronomy
Early astronomers took the Earth to be stationary, with the Sun, Moon and planets moving round it. If you take
36 Chapter 7. Celestial Wheels

An Introduction to Python (with some Science), Release Ed 0.3.2
careful measurements of the position of a planet in the sky, you find it speeds up, slows down, and sometimes travelsbackwards. The Roman astronomer Ptolemy (around AD 145) deduced from this that the planets moved in cycleslike the ones you are drawing.
In this theory, the orbit of Venus has the shape you get from:
epitrochoid(230, 300, 13, 8)
In the 16th century, when the telescope let us see the planets more clearly, we understood that the Earth and Venus
7.5. Tidy up 37

An Introduction to Python (with some Science), Release Ed 0.3.2
both orbit the Sun, The difference of these two orbits is the motion Ptolemy observed.
7.6 Inspiring examples
Try changing the numbers in the call to epitrochoid like this:
a, b = 100, 300epitrochoid(a, b, 4)color("goldenrod")epitrochoid(a, b, 5)color("sienna")epitrochoid(a, b, 6)
(Remember, M=1 if you don’t give a fourth argument.) Suppose you change just one line now:
a, b = -100, 300
and run again. When the loops point outwards, the shape is called a hypotrochoid.
What’s happening here?
a, b = 250, 300epitrochoid(a, b, 4)color("goldenrod")epitrochoid(a, b, 5)color("sienna")epitrochoid(a, b, 6)
And what about here?
L = 6a, x = 50, 80epitrochoid(a, L*a, L)color("goldenrod")epitrochoid(a, L*a + x, L)color("sienna")epitrochoid(a, L*a - x, L)
Find other interesting shapes of your own.
7.7 Some advanced questions
If you like investigating mathematical patterns, this code project poses some interesting questions.
• What determines the number of loops?
• What values for a and b make the curve pass through (0,0)? (Hint: where would the guide turtles be at thatmoment?)
A shape in this family, where the curve passes through zero, is called a “rose”.
38 Chapter 7. Celestial Wheels

An Introduction to Python (with some Science), Release Ed 0.3.2
• When do the loops become points?
• Both curves below have 3 loops: what is the difference between them?
7.7. Some advanced questions 39