an introduction to: schroder isf* us small & mid (smid ... · schroder isf us small & mid...
TRANSCRIPT
An Introduction to:Schroder ISF* US Small & Mid (SMID) Cap Equity November 2006
For Professional Investors Only
Representing Schroders:
Jenny Jones – Executive Vice President and Portfolio Manager
John Harrington, CFA – Senior Vice President and Product Manager
*Schroder International Selection Fund is referred to as Schroder ISF throughout this presentation.
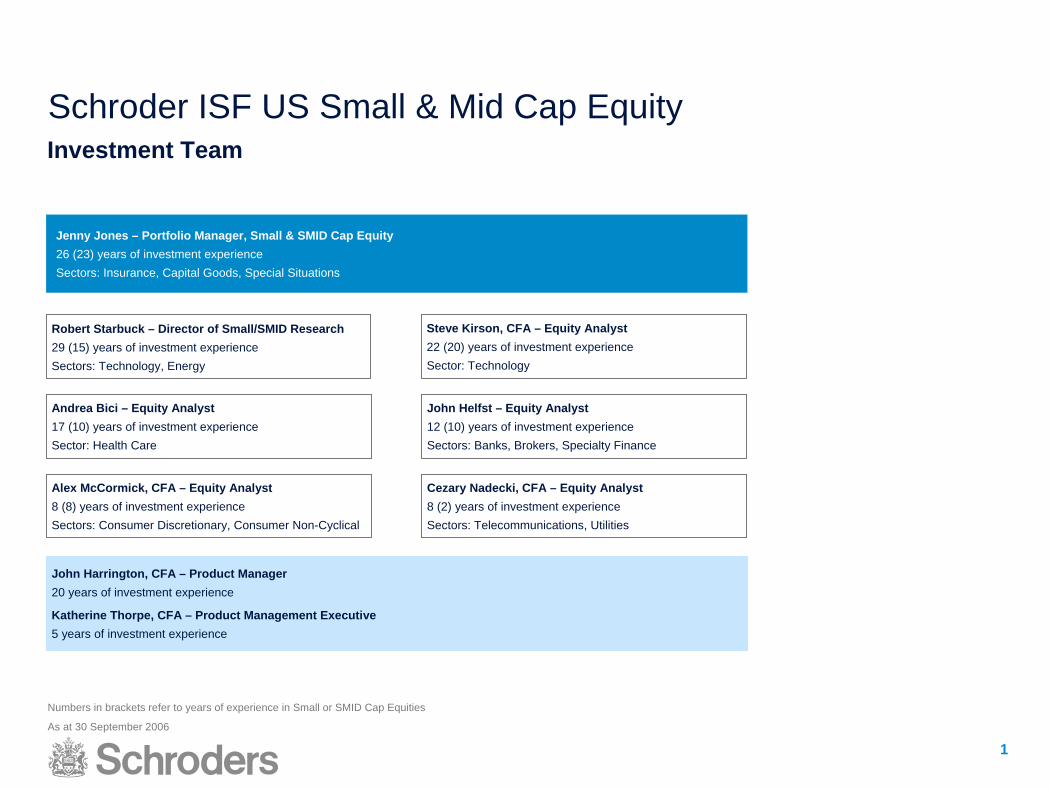
Schroder ISF US Small & Mid Cap EquityInvestment Team
Jenny Jones – Portfolio Manager, Small & SMID Cap Equity26 (23) years of investment experienceSectors: Insurance, Capital Goods, Special Situations
Steve Kirson, CFA – Equity Analyst22 (20) years of investment experienceSector: Technology
Robert Starbuck – Director of Small/SMID Research29 (15) years of investment experienceSectors: Technology, Energy
Andrea Bici – Equity Analyst17 (10) years of investment experienceSector: Health Care
John Helfst – Equity Analyst12 (10) years of investment experienceSectors: Banks, Brokers, Specialty Finance
Alex McCormick, CFA – Equity Analyst8 (8) years of investment experienceSectors: Consumer Discretionary, Consumer Non-Cyclical
Cezary Nadecki, CFA – Equity Analyst8 (2) years of investment experienceSectors: Telecommunications, Utilities
John Harrington, CFA – Product Manager20 years of investment experience
Katherine Thorpe, CFA – Product Management Executive5 years of investment experience
Numbers in brackets refer to years of experience in Small or SMID Cap Equities
As at 30 September 2006
1
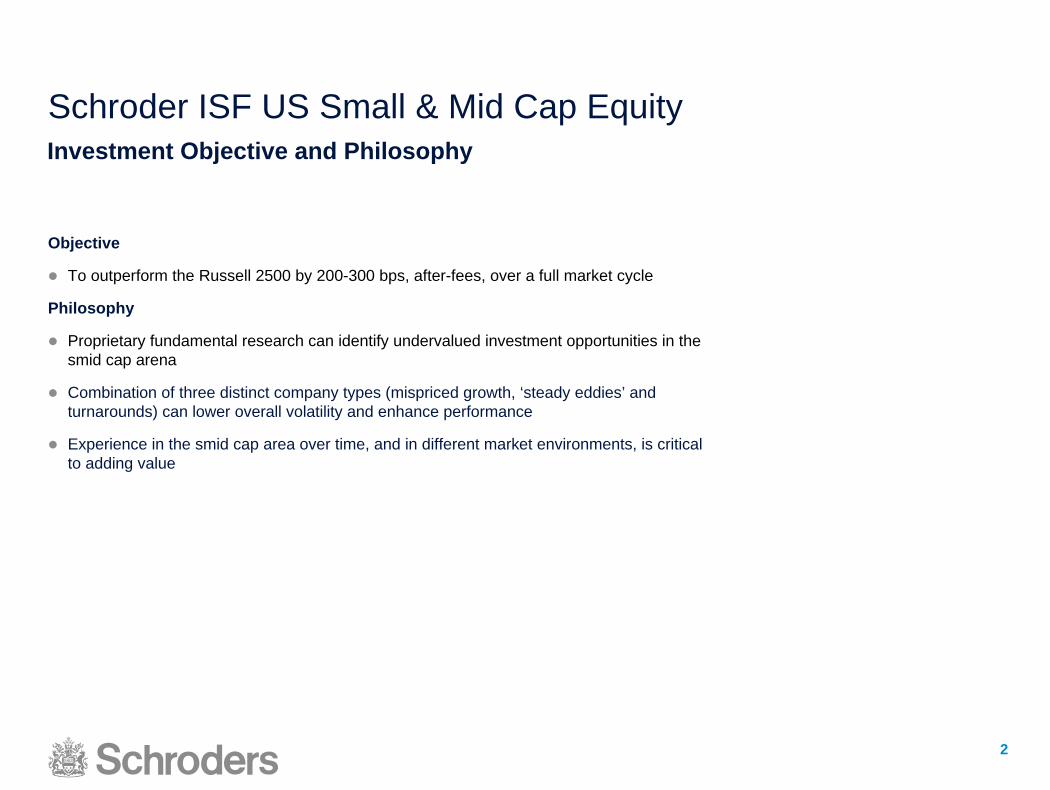
Schroder ISF US Small & Mid Cap EquityInvestment Objective and Philosophy
Objective
To outperform the Russell 2500 by 200-300 bps, after-fees, over a full market cycle
Philosophy
Proprietary fundamental research can identify undervalued investment opportunities in the smid cap arena
Combination of three distinct company types (mispriced growth, ‘steady eddies’ and turnarounds) can lower overall volatility and enhance performance
Experience in the smid cap area over time, and in different market environments, is critical to adding value
2

Schroder ISF US Small & Mid Cap Equity
200names
600 names
1,200 names
Investment Process
3
55-75 Stocks
SISF US Small & Mid Cap
Equity
Fine Tuning The List
Reducing The List
The Universe
Stocks with Market capitalizationUS$1bil –US$7 bil
Compelling financial metrics
Screenedresults
Turnaround candidates
Portfolio consideration
Liquidity profile
Valuation
Cross fertilization from small cap
Internal team meetings
Sell-side boutiques
Company managements
Input from competitors
Liquidity profile
HOLT screens
Superior businessmodels
Portfolio manager conviction
Company meetings
Conferences
Reasonable valuation
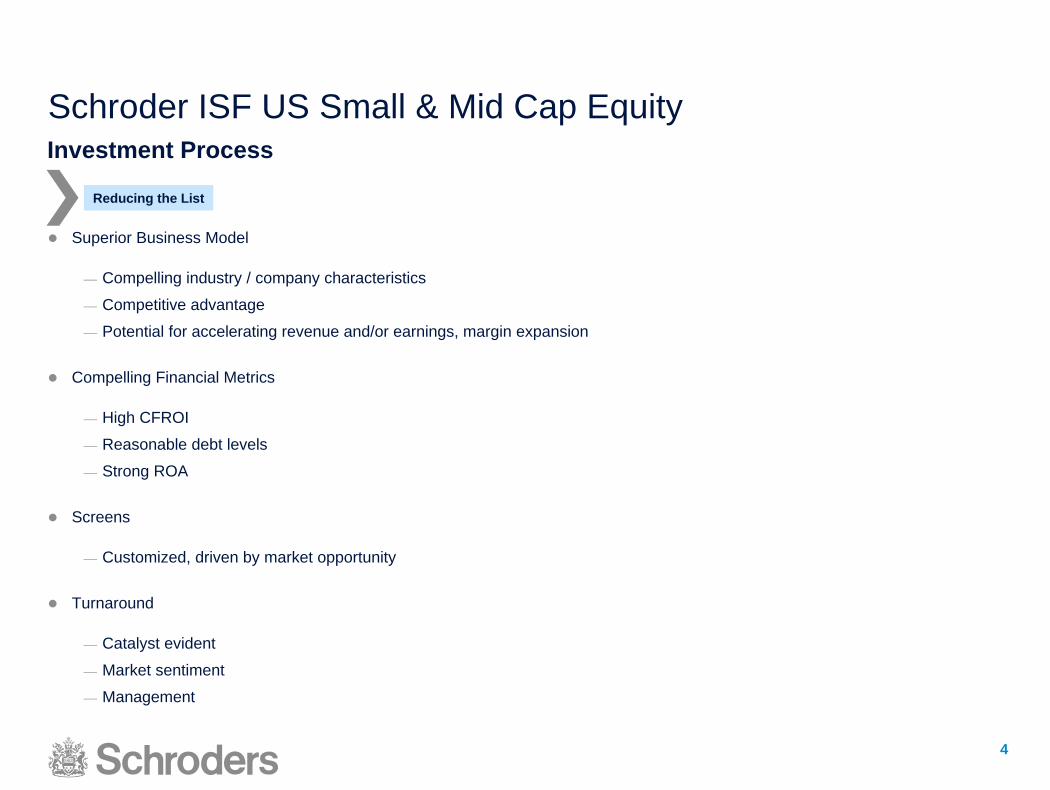
Schroder ISF US Small & Mid Cap EquityInvestment Process
Superior Business Model
— Compelling industry / company characteristics
— Competitive advantage
— Potential for accelerating revenue and/or earnings, margin expansion
Compelling Financial Metrics
— High CFROI
— Reasonable debt levels
— Strong ROA
Screens
— Customized, driven by market opportunity
Turnaround
— Catalyst evident
— Market sentiment
— Management
Reducing the List
4

Schroder ISF US Small & Mid Cap EquityInvestment Process
Fine tuning the list
Valuation
— P/E
— P/FCF
— EV/EBIT
— Discount to expected earnings growth (PEG)
Conviction /Judgment
— Upside/downside expectation
— Confidence in management
Portfolio Consideration
— Liquidity
— Exposure to industry
5

Schroder ISF US Small & Mid Cap EquityInvestment Process – Three Distinct Company Types
Mispriced Growth (50-60% of portfolio)
Companies that are exhibiting solid top and bottom line growth. Top line should be growing at 10%+, and bottom line at 15%+
Product or service that is at early stage of life cycle and end market demand is strong
Strong, talented management team
Balance sheet strength and improving cash flows
Steady Eddies (20-40% of portfolio)
A predictable, high quality company, with consistent results and low variability in revenue/earnings
Bottom line most likely growing at 8-12%
Strong free cash flow, strong balance sheet, consistently meets earnings estimates
Valuation may be higher than ‘mispriced growth’ stocks, due to consistency and lower risk
Turnarounds (5-20% of portfolio)
Out-of-favour in the market
Significant accounting or management issue
Restructuring
6

Schroder ISF US Small & Mid Cap EquityPortfolio Construction
Cash target 5% or less
Position size limited to 5%
Top ten positions >20%
Sector weights within 1000 basis points of benchmark weight
7
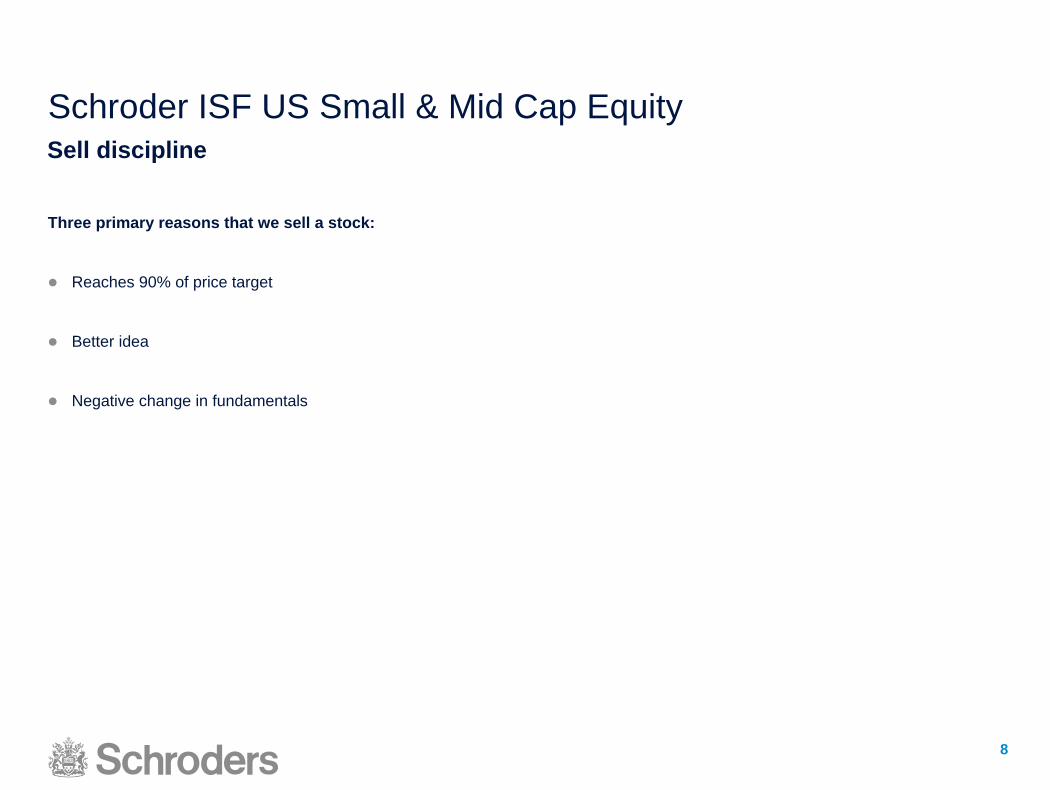
Schroder ISF US Small & Mid Cap EquitySell discipline
Three primary reasons that we sell a stock:
Reaches 90% of price target
Better idea
Negative change in fundamentals
8

Schroder ISF US Small & Mid Cap EquityTop Ten Holdings – 30 September 2006
Company Description % of Fund
VeriSign Inc. Provider of intelligent infrastructure services 3.0
Invitrogen Corp. Develops research tools for the life sciences industry 2.5
Scientific Games Corp. Lottery systems and services 2.4
Constellation Brands Inc. International producer and marketer of alcoholic beverages 2.2
Dresser-Rand Manufacturer of equipment for the oil and gas industries 2.1
Dover Corp. Manufacturers specialized industrial products and manufacturing equipment 2.0
Tektronix Inc. Supplier of monitoring products and solutions to technology companies 2.0
Thermo Electron Corp. Provider of analytical equipment for life science and environmental laboratories 1.9
Watson Wyatt Worldwide Inc. Global human capital consulting firm 1.9
Medicis Pharmaceutical Specialty pharmaceutical company focusing on dermatology products 1.9
Total 21.9
Source: Factset
9

Schroder ISF US Small & Mid Cap EquitySector Weights – 30 September 2006
%Portfolio vs Index
13.4
2.3 2.03.4
13.4
10.3
16.1
7.06.1
16.418.3
6.5
11.1
25.0
3.6
6.2
2.3
5.0
12.4
9.4
0
5
10
15
20
25
Health Care Technology Energy Materials ConsumerStaples
ProducerDurables
Autos &Transportation
Utilities ConsumerDiscretionary
FinancialServices
Schroder ISF US SMID Cap Equity Russell 2500
Source: Factset.
10
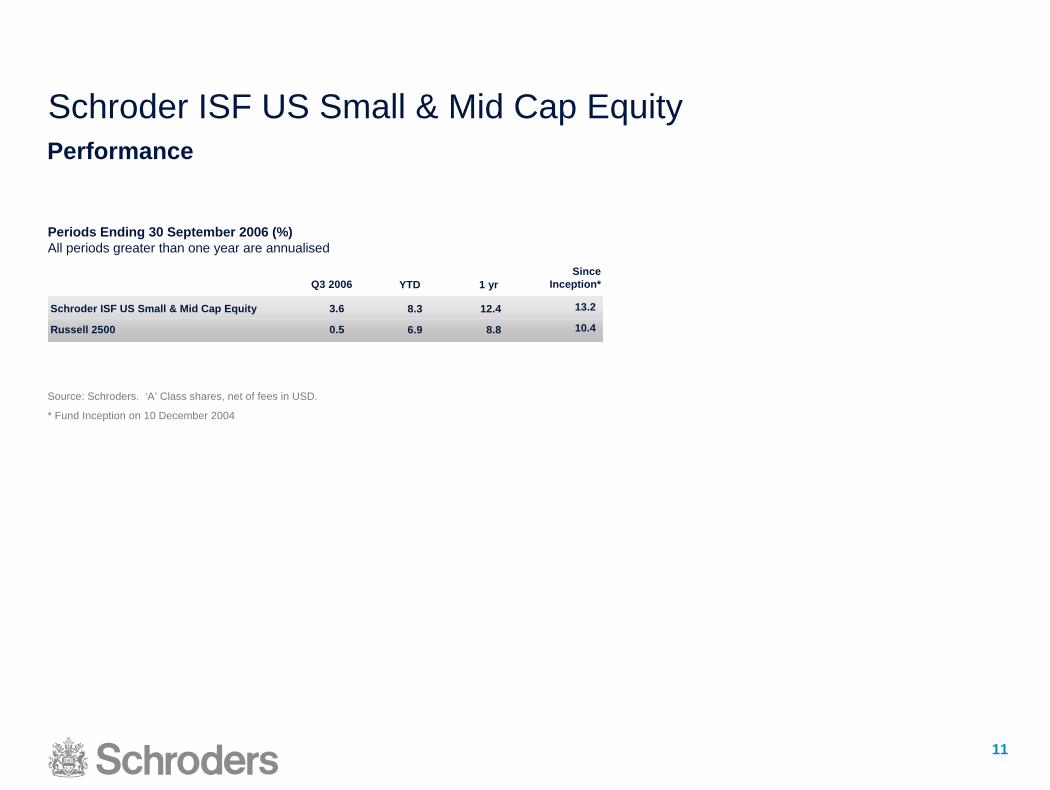
Schroder ISF US Small & Mid Cap EquityPerformance
Periods Ending 30 September 2006 (%)All periods greater than one year are annualised
Schroder ISF US Small & Mid Cap Equity
Russell 2500
Q3 2006
3.6
0.5
Since Inception*
13.2
10.4
YTD
8.3
6.9
1 yr
12.4
8.8
Source: Schroders. ‘A’ Class shares, net of fees in USD.
* Fund Inception on 10 December 2004
11
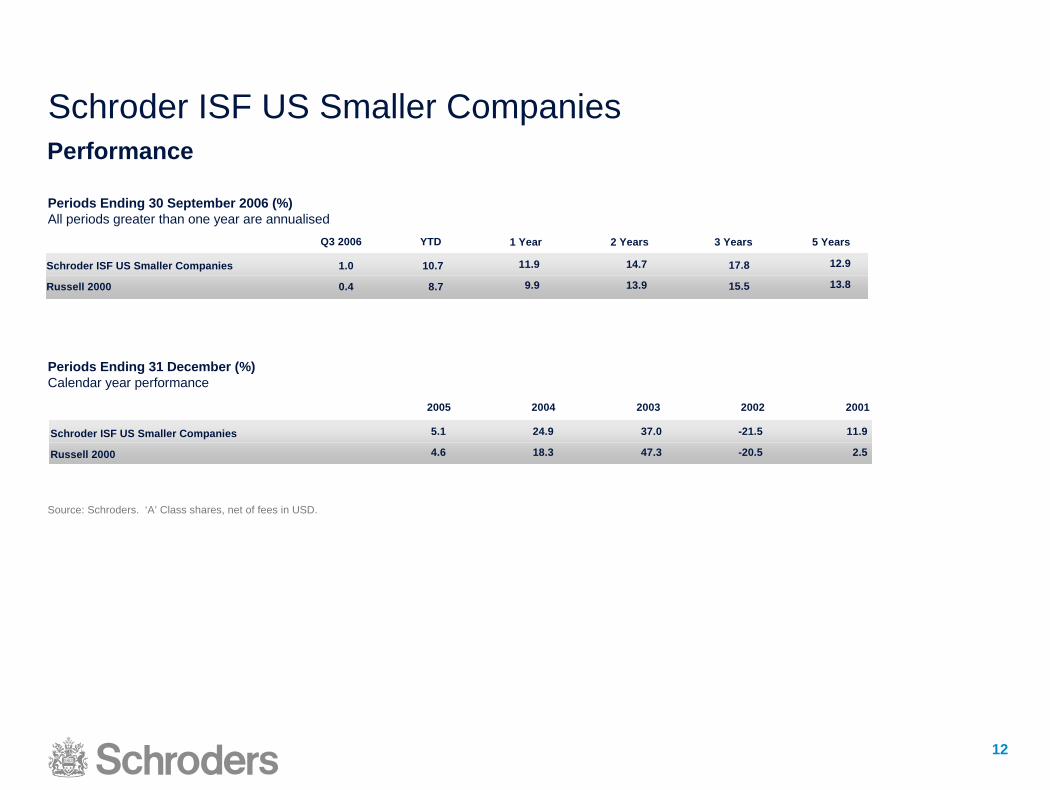
Schroder ISF US Smaller CompaniesPerformance
Periods Ending 30 September 2006 (%)All periods greater than one year are annualised
Schroder ISF US Smaller Companies
Russell 2000
YTD
10.7
8.7
1 Year
11.9
9.9
3 Years 5 Years2 Years
14.7
13.9
17.8
15.5
12.9
13.8
Q3 2006
1.0
0.4
Schroder ISF US Smaller Companies
Russell 2000
2005
5.1
4.6
2004
24.9
18.3
2003
37.0
47.3
2002
-21.5
-20.5
2001
11.9
2.5
Periods Ending 31 December (%)Calendar year performance
Source: Schroders. ‘A’ Class shares, net of fees in USD.
12
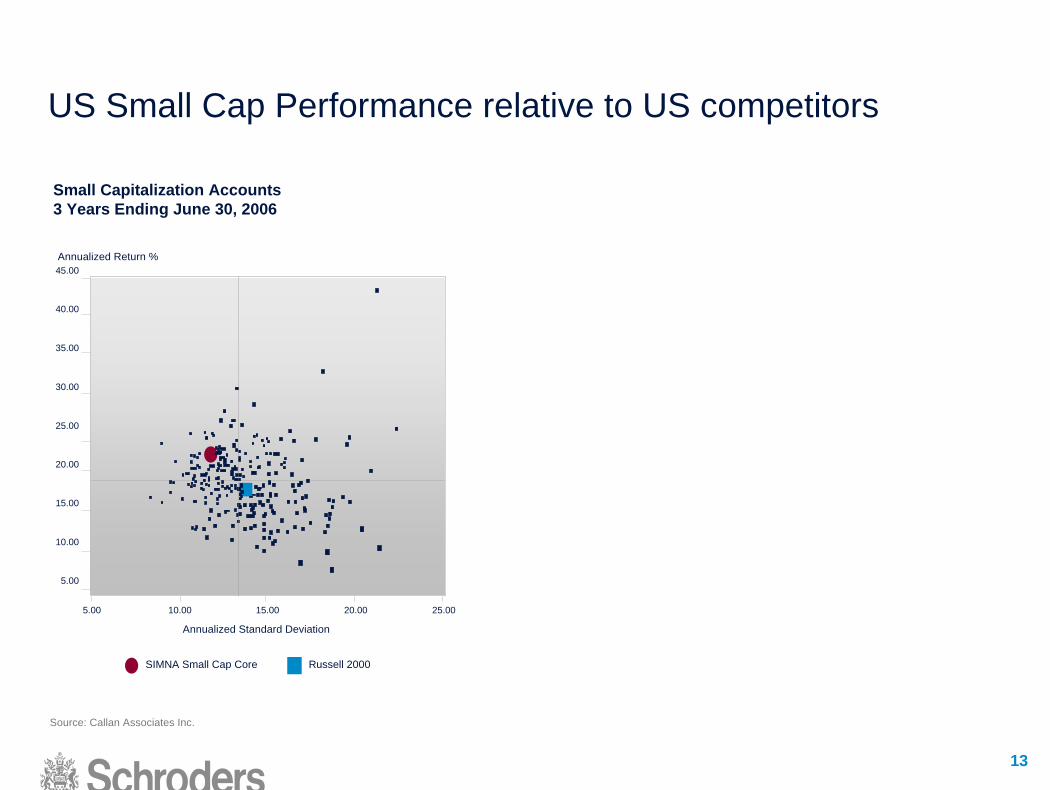
US Small Cap Performance relative to US competitors
Small Capitalization Accounts 3 Years Ending June 30, 2006
Annualized Return %
10.00
15.00
20.00
25.00
30.00
35.00
40.00
5.00 15.00 20.00 25.00
5.00
45.00
10.00
Annualized Standard Deviation
SIMNA Small Cap Core Russell 2000
Source: Callan Associates Inc.
13
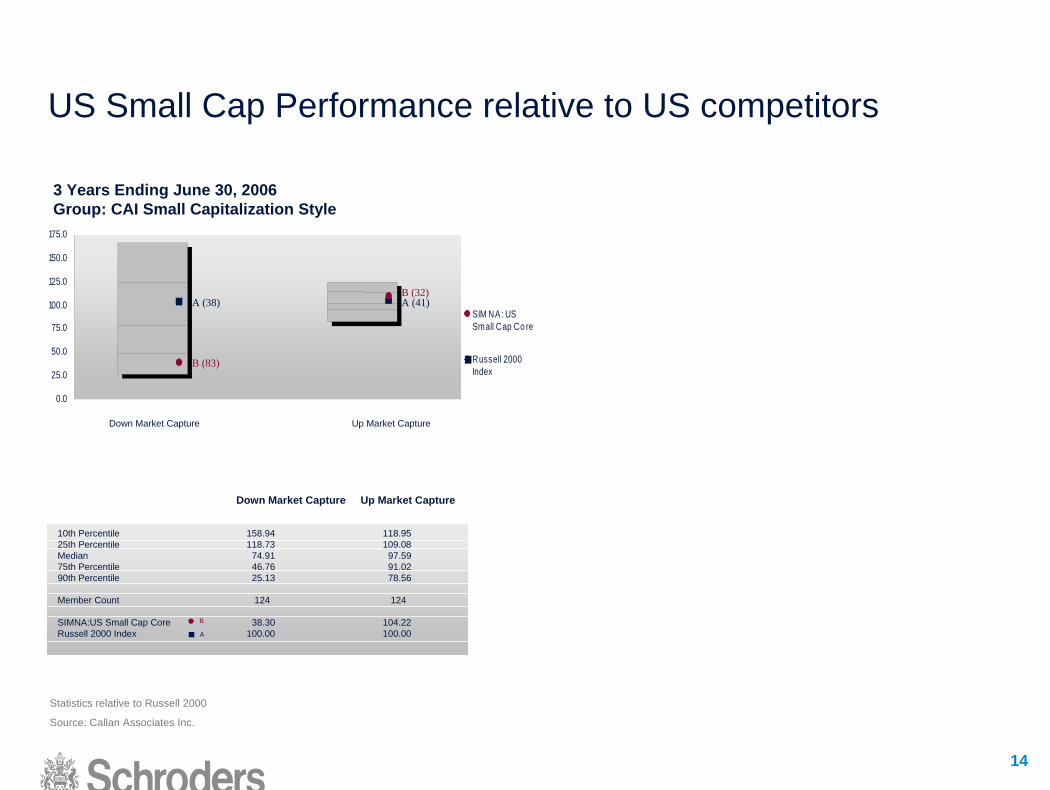
US Small Cap Performance relative to US competitors
3 Years Ending June 30, 2006 Group: CAI Small Capitalization Style
0.0
25.0
50.0
75.0
100.0
125.0
150.0
175.0
SIM NA : USSmall Cap Co re
Russell 2000Index
Down Market Capture Up Market Capture
Down Market Capture
10th Percentile25th PercentileMedian75th Percentile90th Percentile
Member Count
SIMNA:US Small Cap CoreRussell 2000 Index A
158.94118.73
74.9146.7625.13
124
38.30100.00
B
Up Market Capture
118.95109.08
97.5991.0278.56
124
104.22100.00
A (38) A (41)
B (83)
B (32)
Statistics relative to Russell 2000
Source: Callan Associates Inc.
14
Schroder ISF US Small & Mid Cap EquitySummary
Highly experienced investment professionals
Successful Small Cap product
Core investment approach based on fundamental analysis of individual stocks
15

Appendix
16
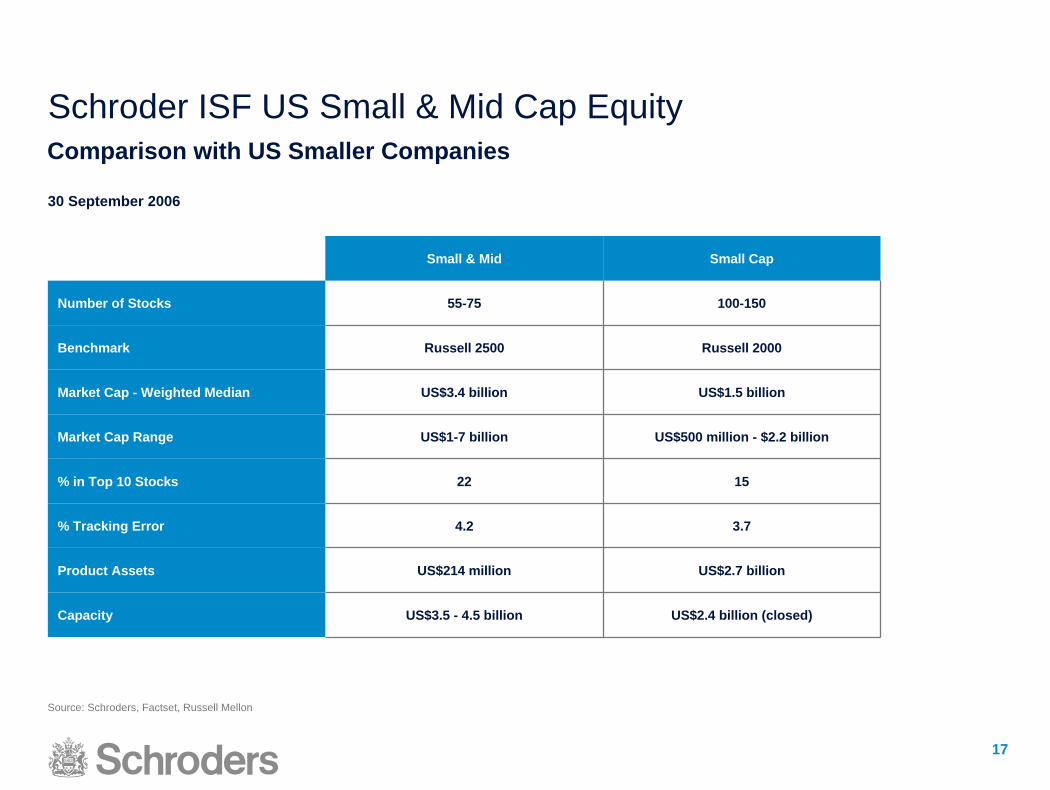
Schroder ISF US Small & Mid Cap EquityComparison with US Smaller Companies
30 September 2006
Small & Mid Small Cap
Number of Stocks 55-75 100-150
Benchmark Russell 2500 Russell 2000
Market Cap - Weighted Median US$3.4 billion US$1.5 billion
Market Cap Range US$1-7 billion US$500 million - $2.2 billion
% in Top 10 Stocks 22 15
% Tracking Error 4.2 3.7
Product Assets US$214 million US$2.7 billion
Capacity US$3.5 - 4.5 billion US$2.4 billion (closed)
Source: Schroders, Factset, Russell Mellon
17

The Case for SMID Cap Equity
18

US Small & Mid Cap EquityUS Equity Market Capitalisation Segments as of 30 September 2006
Number of Companies5% 1%
76%
13%
5%
Mid/Large (over $7bil)
Mid (SMID) ($2bil-$7bil)
Small (SMID) ($1bil-$2bil)
Small ($0.2bil-$1bil)
Micro (below $0.2bil)
450
700
650
1,800
6,750
Source: Factset
19
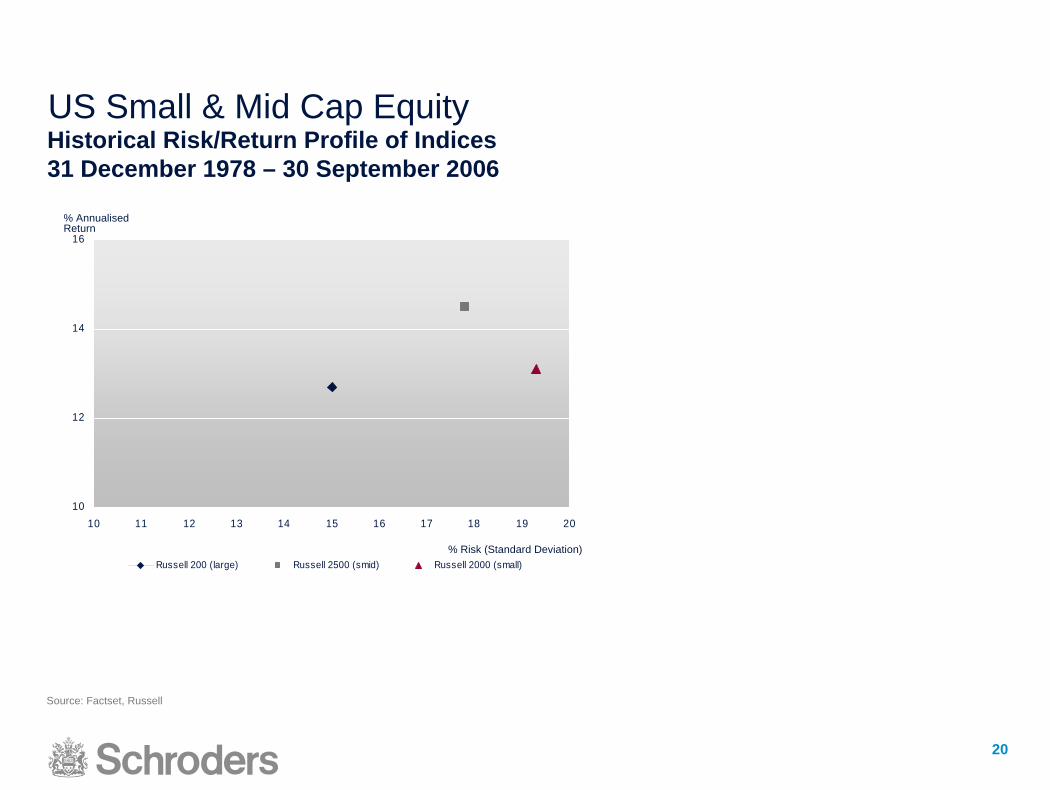
Historical Risk/Return Profile of Indices31 December 1978 – 30 September 2006
US Small & Mid Cap Equity
10
12
14
16
10 11 12 13 14 15 16 17 18 19 20
Russell 200 (large) Russell 2500 (smid) Russell 2000 (small)
% Annualised Return
% Risk (Standard Deviation)
Source: Factset, Russell
20

US Small & Mid Cap EquityCompany/Stock Attributes by Market Cap Segment
Market Cap Range Ownership Cost of Capital
Earnings Volatility Liquidity Volatility Analyst
Coverage Historical Returns
Less than US$2 billion Higher insider ownership High
Moderate
Low High
Low
+200 bps > Large
US$2 - $7 billion
Significant insider ownership, but growing, institutional shareholder base
2-6High
Lower 5-10
Lowest >15
Moderate Moderate +200 bps > Large
>US$7 billionMinimal insider ownership, mostly institutional shareholder base
High Lowest Large
Source: Schroders, Factset
21
Schroder ISF US Small & Mid Cap EquityPerformance Notes
This presentation does not constitute an offer to anyone, or a solicitation by anyone, to subscribe for shares of Schroder International Selection Fund (the “Company”). Nothing in this document should be construed as advice and is therefore not a recommendation to buy or sell shares.
Subscriptions for shares of the Company can only be made on the basis of its latest prospectus together with the latest audited annual report (and subsequent unaudited semi-annual report, if published), copies of which can be obtained, free of charge, from Schroder Investment Management (Luxembourg) S.A.
In accordance with the current prospectus, other than for the Schroder ISF Global Property Securities fund, the Company will seek UK distributor status for all distribution A and C shares.
An investment in the Company entails risks, which are fully described in the prospectus.
Past performance is not a guide to future performance and may not be repeated. Investors may not get back the full amount invested, as prices of shares and the income from them may fall as well as rise.
Exchange rate changes may cause the value of any overseas investments to rise or fall.Schroders has expressed its own views and opinions in this document and these may change.
Schroder ISF US Small & Mid Cap Equity is not within the scope of the European Union Directive 2003/48/EC (Taxation of Savings Income in the Form of Interest Payments), as implemented in Luxembourg Law.
This document is issued by Schroder Investment Management (Luxembourg) S.A., 5, rue Höhenhof, L-1736 Senningerberg, Luxembourg.
For your security, all telephone calls are recorded.
22