an introduction to simdata scott schnee (nrao) victoria workshop – jan 18, 2011
TRANSCRIPT

An Introduction to Simdata
Scott Schnee (NRAO)
Victoria Workshop – Jan 18, 2011

What is Simdata Good For?
• Number of antennas• Antenna configuration• Length of observation• Noise
Take a model image and find out how it would look if observed with ALMA

Model Image30Dor Spitzer IRAC 8um image from SAGE
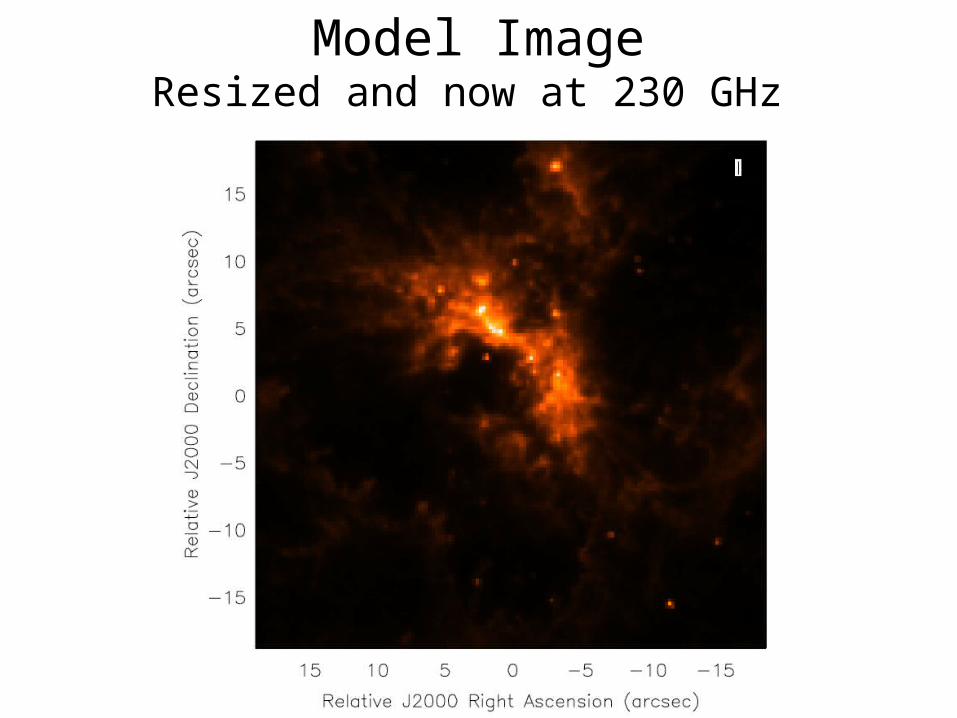
Model ImageResized and now at 230 GHz

Fourier Transforms of Images
From http://carmilumban-ap186.blogspot.com

Scales Measured by ES ConfigurationAntenna Placement uv-coverage synthesized beam
2 hour observation

Scales Measured by FS CompactAntenna Placement uv-coverage synthesized beam
2 hour observation

Scales Measured by FS ExtendedAntenna Placement uv-coverage synthesized beam
2 hour observation

Model Image in ES Configuration
Model Image Convolved Model “Observed” Image
2 hour observation

Model Image in FS Compact
Model Image Convolved Model “Observed” Image
2 hour observation

Model Image in FS Extended
Model Image Convolved Model “Observed” Image
2 hour observation

Basic Simdata Inputs
• Image / model of target• Observing time• Antenna configuration

Basic Simdata Inputs
FITS Image Basics
• Coordinates• Brightness• Observing Frequency• Resolution (angular and spectral)• Polarization (if needed)

modifymodel
• modifymodel = True• skymodel = “30dor.fits”• inbright = ”0.1mJy/pixel”• indirection = "J2000 10:00:00 -40:00:00”• incell = "0.25arcsec”• incenter = "230GHz”• inwidth = '2GHz'

setpointings
• integration = '600s’• mapsize = "”• pointingspacing = ""

predict
• repodir = os.getenv("CASAPATH").split(' ')[0]• antennalist = repodir+"/data/alma/simmos/alma.early.250m.cfg"

Simdata Output
• analyze = True• showarray = True• showconvolved = True• showdifference = False• showfidelity = False

Simdata Output

Simdata Output

Simdata Output - Viewer

Other Simdata OptionsThermal Noise
• thermalnoise = ‘tsys-atm’• image = True• vis=‘$project.noisy.ms’

Other Simdata OptionsThermal Noise
Convolved Model Thermal NoiseNo Thermal Noise

Other Simdata OptionsPhase Noise
Convolved Model No Phase Noise Phase Noise

Other Simdata OptionsPhase Noise
• Create measurement set with simdata• Use the “toolkit” to add phase noise– http://casa.nrao.edu/docs/CasaRef/CasaRef.html– http://casaguides.nrao.edu/index.php?title=Corrupt– sm.openfromms("simPN.ms")– sm.settrop(mode='screen',pwv=1.0,deltapwv=0.15)– sm.corrupt()– sm.done()
• Use clean (in CASA) to make the image

Your Turn
• Find a fits file of an object you want to image• Use simdata to see how it would look if
observed with ALMA– Rescale image if necessary– Try different antenna configurations– Add noise if interested
• Don’t be afraid to ask for help!