an introduction to strategy maps and balanced...
TRANSCRIPT

Chris Washington-Sare | Managing Director | Pentatonic Marketing 07415 121929 | [email protected] | www.pentatonicmarketing.com
Briefing An Introduction to Strategy Maps and Balanced Scorecards
2 Chris Washington-Sare | Managing Director | Pentatonic Marketing 07415 121929 | [email protected] | www.pentatonicmarketing.com
1. Introduction
The strategy map and balanced scorecard is a strategic planning and management system that is used extensively in business and industry, government, and non-profit organisations worldwide to align business activities to their vision and mission, improve internal and external communications and monitor organisational performance against strategic goals.
It was originated by two consultants, Robert Kaplan and David Norton, as a performance measurement framework that added strategic non-financial performance measures to traditional financial metrics to give managers and executives a more 'balanced' view of organisational performance. The balanced scorecard system has been selected by the editors of Harvard Business Review as one of the most influential business ideas of the past 75 years. 2. Why are strategy maps and balanced scorecards needed?
Kaplan and Norton’s research has indicated that 9 out of 10 strategies fail to achieve their objectives. Why is this?
• Only 10% of staff typically understand a strategy • 46% of companies do not have a formal system to execute their strategies. Of
these, 73% reported below-average performance. • Less than 2 hours a week is spent discussing strategy • Only 30% of staff have goals aligned to strategies
3. What is a strategy map and balanced scorecard?
If you can't explain it simply, you don't understand it well enough Albert Einstein
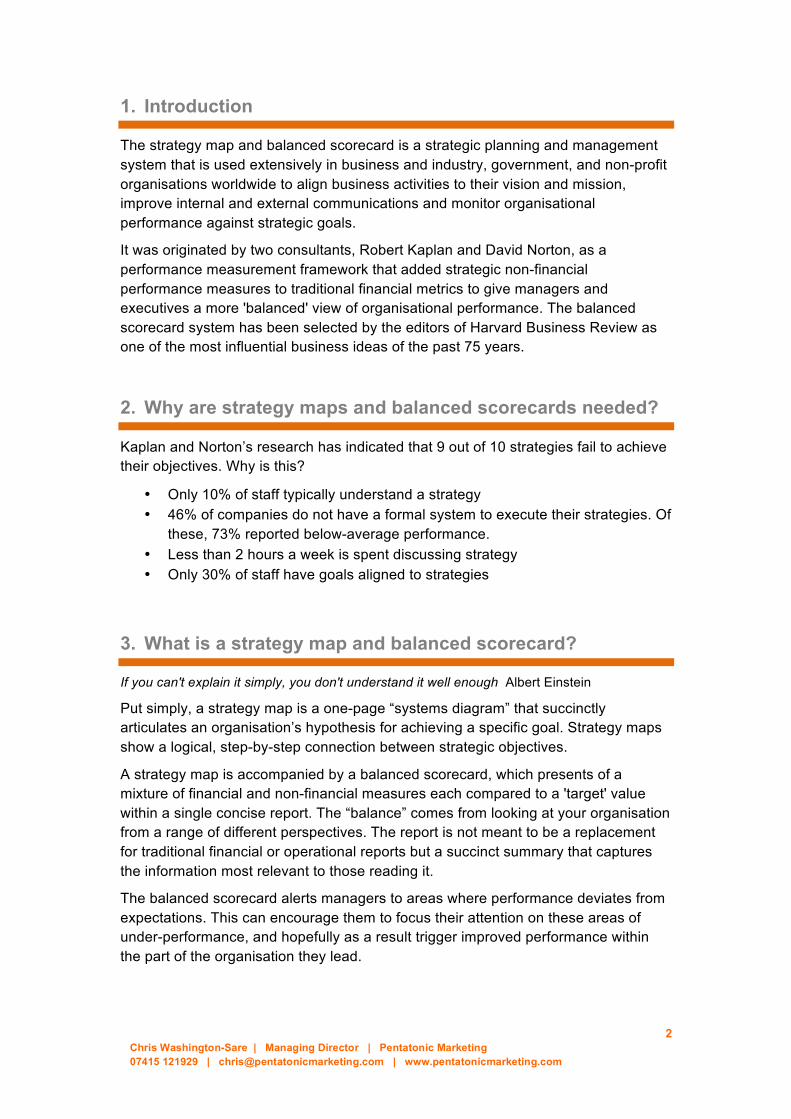
Put simply, a strategy map is a one-page “systems diagram” that succinctly articulates an organisation’s hypothesis for achieving a specific goal. Strategy maps show a logical, step-by-step connection between strategic objectives.
A strategy map is accompanied by a balanced scorecard, which presents of a mixture of financial and non-financial measures each compared to a 'target' value within a single concise report. The “balance” comes from looking at your organisation from a range of different perspectives. The report is not meant to be a replacement for traditional financial or operational reports but a succinct summary that captures the information most relevant to those reading it.
The balanced scorecard alerts managers to areas where performance deviates from expectations. This can encourage them to focus their attention on these areas of under-performance, and hopefully as a result trigger improved performance within the part of the organisation they lead.
3 Chris Washington-Sare | Managing Director | Pentatonic Marketing 07415 121929 | [email protected] | www.pentatonicmarketing.com
FRGoal2016-2020
Webelievethatwewillbestrongerifhavemorepeoplesuppor=ngus.Ourgoalistohave20,000donorsby2020
StakeholdersWhatmustwe
achieveforthem?
ProcessesWhatdoweneedto
excelat?
LearningandDevelopment
Wheredoweneedtodevelop?
FinancialWhatdoweneedtodotoachieveourfundraisinggoal?
MonthlyDonors
ORGANISATIONALSTRUCTUREWewillincreaseourcapacityto
engagewithmoredonors
DONORVALUEWewillincreasetheaverage
incomepersupporter
ClarityofFRVision
Diversefunding
Importance
Relevance
SystemsandProcesses
DEMONSTRATINGRELEVANCEWewillmakeourworkrelevant
topeoplebycul=va=nganetworkofgrassrootscommunitygroups
MAKINGINVESTMENTSWewillmakefundraising
investmentstogrowefficientlyandeffec=vely
CHANNELDIVERSIFICATIONWewillcul=vatenewandexis=ngchannelstoengage
supportershowtheywant,whentheywant,wheretheywant
COMPELLINGPROPOSITIONSWewilldevelopcompellingfundraisingproposi=onsforindividuals,majordonorsand
legacypledgers
SYSTEMSANDREPORTINGWewillimproveoursystemsandprocessestomakeevidence-
baseddecisionsaboutfundraisinginvestments
One-OffDonors
LegacyPledgers
CapabilityandCapacity
Resources
DEMONSTRATINGIMPACTWewillmakesupportersfeelpowerfulandeffec=veby
demonstra=ngtheimpactwehaveglobally
DONORSTEWARDSHIPWewillimplementexcellentdonorstewardshipprogramsthatmakesupportersproudto
supporttheorganisa=on
SKILLSDEVELOPMENTWewillworkwithfundraising
colleaguesacrossthemovementtodevelopourcapabili=es
DONORNUMBERSWewillgrowthenumberofdonorsgivingtousregularly
MajorDonors
PrimaryStakeholders
DONORRETENTIONWewillincreasethelengthof=meadonorsupportsus
4. Getting Your Terminology Right
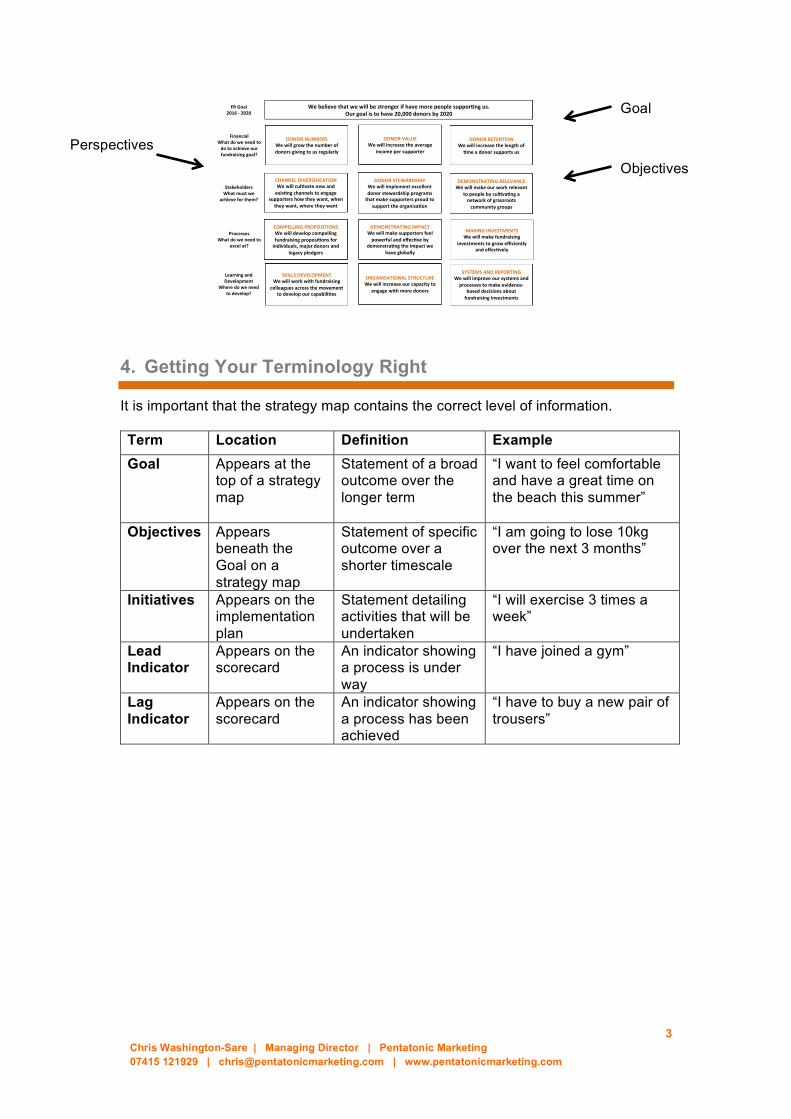
It is important that the strategy map contains the correct level of information. Term Location Definition Example Goal Appears at the
top of a strategy map
Statement of a broad outcome over the longer term
“I want to feel comfortable and have a great time on the beach this summer”
Objectives Appears beneath the Goal on a strategy map
Statement of specific outcome over a shorter timescale
“I am going to lose 10kg over the next 3 months”
Initiatives Appears on the implementation plan
Statement detailing activities that will be undertaken
“I will exercise 3 times a week”
Lead Indicator
Appears on the scorecard
An indicator showing a process is under way
“I have joined a gym”
Lag Indicator
Appears on the scorecard
An indicator showing a process has been achieved
“I have to buy a new pair of trousers”
Perspectives Objectives
Goal
4 Chris Washington-Sare | Managing Director | Pentatonic Marketing 07415 121929 | [email protected] | www.pentatonicmarketing.com
5. Strategy Map Perspectives
The strategy map balanced scorecard suggests that we view the organisation from four perspectives, and to develop metrics, collect data and analyze it relative to each of these perspectives:
• The Financial or Resources Perspective
What do we need to do to achieve our goal?
Timely and accurate financial data will always be a priority but it is vital that other perspectives are also considered to achieve a truly balanced perspective. In a Fundraising strategy map this perspective is typically called the Financial Perspective. In a Programme or Campaign strategy map this perspective is often referred to as the Resources Perspective.
• The Beneficiary/Donor/Supporter Perspective
What do we need to do for our beneficiaries/donors/supporters?
This perspective will focus on one group depending on the goal stated in the strategy map. If it is a fundraising map, then use a Donor Perspective. If it is an advocacy/campaign focused strategy map then use Supporter Perspective. A Programme focused strategy map would use a Beneficiary Perspective. In a commercial context this is often referred to as the Client or Customer Perspective.
• The Systems and Process Perspective
What do we need to be really good at?
This perspective refers to internal business processes. Metrics based on this perspective allow the managers to know how well their business is running.
• The Capabilities and Development Perspective
What do we need to do to be really good?
This perspective includes employee training and corporate cultural attitudes related to both individual and corporate self-improvement.

5 Chris Washington-Sare | Managing Director | Pentatonic Marketing 07415 121929 | [email protected] | www.pentatonicmarketing.com
6. Sequencing Strategy Map Perspectives
The perspectives can be sequenced in whatever way is appropriate for the organisation. The best way to determine the most appropriate sequence for the perspectives is to use a simple How / Why logic. The How logic interrogates a strategy map from top to bottom. The Why logic interrogates a strategy map from bottom to top. Use the How/Why mechanisms to check the logic of your strategy map as you are developing the objectives. Example 1: Fundraising Strategy Map Perspective Sequence
Perspective How Logic Why Logic
Financial How will raise the required funds?
…and raise the funds we require.
Donor
…by engaging donors effectively…
…so that we can engage donors effectively…
Process …with excellent systems and processes…
…in order to develop our systems and processes…
Development
…delivered with skill, precision and expertise
Why are we developing our staff?
Example 2: Programme Strategy Map Perspective Sequence
Perspective How Logic Why Logic
Beneficiary
How will we improve the lives of beneficiaries
…in order to improve the lives of beneficiaries
Processes …by being excellent in key processes…
… our systems and processes …
Development …which we will develop by…
…in order to develop…
Resources
…investing in our people
Why are we developing our staff?

6 Chris Washington-Sare | Managing Director | Pentatonic Marketing 07415 121929 | [email protected] | www.pentatonicmarketing.com
7. Building A Strategy Map
Step 1
Identify the business drivers impacting on your ability to achieve your goals A business driver is a situation, resource, process or condition that is vital for the continued success and growth of an organisation. Use tools such as:
PESTLE Analysis
PESTLE analysis, which is sometimes referred as PEST analysis, is used as a tool by organisations to track the environment they’re operating in or are planning to launch a new project/product/service etc.
Political: These factors determine the extent to which a government may influence the economy or a certain industry. [For example] a government may impose a new tax or duty due to which entire revenue generating structures of organisations might change. Political factors include tax policies, Fiscal policy, trade tariffs etc. that a government may levy around the fiscal year and it may affect the business environment (economic environment) to a great extent.
Economic: These factors are determinants of an economy’s performance that directly impacts an organisation and have resonating long-term effects. [For example] a rise in the inflation rate of any economy would affect the way companies’ price their products and services. Adding to that, it would affect the purchasing power of a consumer and change demand/supply models for that economy. Economic factors include inflation rate, interest rates, foreign exchange rates, economic growth patterns etc
Social: These factors scrutinise the social environment of the market, and gauge determinants like cultural trends, demographics, population analytics etc. An example for this can be buying trends during holiday seasons.

7 Chris Washington-Sare | Managing Director | Pentatonic Marketing 07415 121929 | [email protected] | www.pentatonicmarketing.com
Technological: These factors pertain to innovations in technology that may affect the operations of the industry and the market favorably or unfavorably. This refers to automation, research and development and the amount of technological awareness that a market possesses.
Legal: These factors have both external and internal sides. There are certain laws that affect the business environment in a certain country while there are certain policies that companies maintain for themselves. Legal analysis takes into account both of these angles and then charts out the strategies in light of these legislations. For example, consumer laws, safety standards, labor laws etc.
Environmental: These factors include all those that influence or are determined by the surrounding environment. This aspect of the PESTLE is crucial for certain industries particularly for example tourism, farming, agriculture etc. Factors of a business environmental analysis include but are not limited to climate, weather, geographical location, global changes in climate, environmental offsets etc.
Source: pestleanalysis.com
SWOT Analysis
SWOT stands for Strengths, Weaknesses, Opportunities, and Threats. Almost everybody in the business world is aware of SWOT.
The analysis focuses on identifying the external and internal factors that might affect the future performance of any business. The four factors mentioned in a SWOT analysis (Strengths, Weaknesses, Opportunities, and Threats) aim to evaluate the balance between the internal resources and capabilities of a company and external possibilities and threats.
It can be helpful to combine the McKinsey 7s Framework below with SWOT analysis to ensure your analysis is robust. Source: pestleanalysis.com
8 Chris Washington-Sare | Managing Director | Pentatonic Marketing 07415 121929 | [email protected] | www.pentatonicmarketing.com
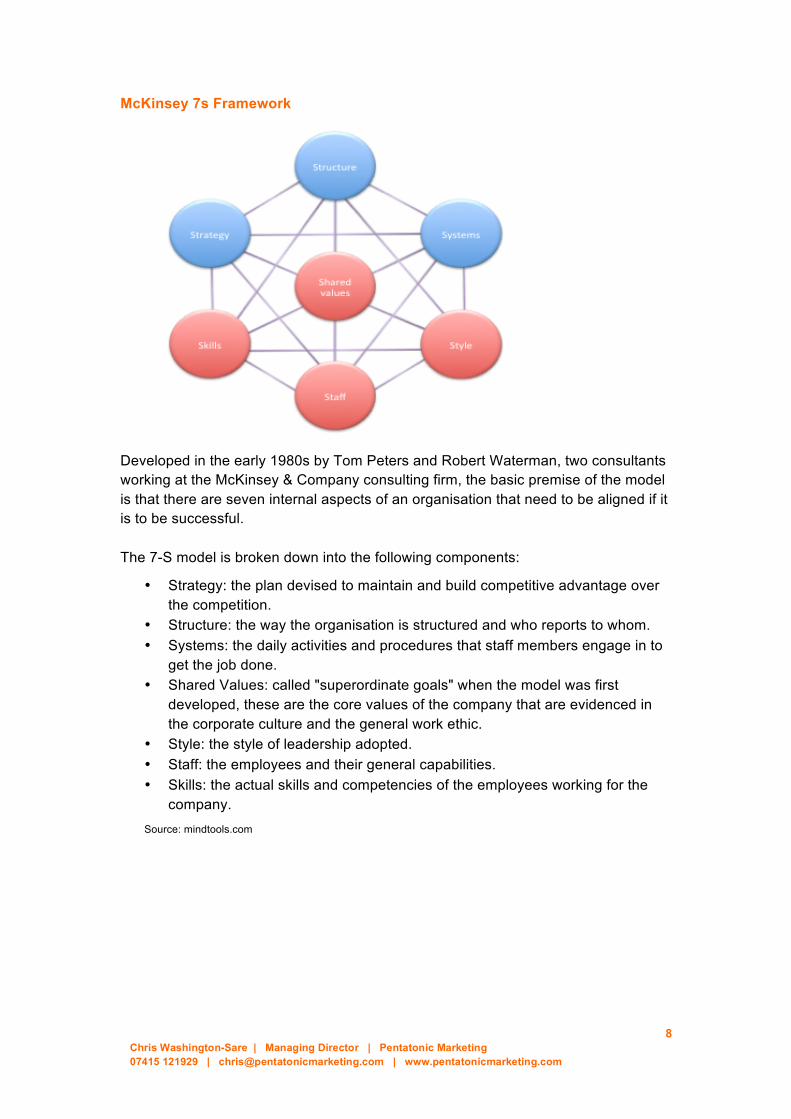
McKinsey 7s Framework
Developed in the early 1980s by Tom Peters and Robert Waterman, two consultants working at the McKinsey & Company consulting firm, the basic premise of the model is that there are seven internal aspects of an organisation that need to be aligned if it is to be successful. The 7-S model is broken down into the following components:
• Strategy: the plan devised to maintain and build competitive advantage over the competition.
• Structure: the way the organisation is structured and who reports to whom. • Systems: the daily activities and procedures that staff members engage in to
get the job done. • Shared Values: called "superordinate goals" when the model was first
developed, these are the core values of the company that are evidenced in the corporate culture and the general work ethic.
• Style: the style of leadership adopted. • Staff: the employees and their general capabilities. • Skills: the actual skills and competencies of the employees working for the
company. Source: mindtools.com
9 Chris Washington-Sare | Managing Director | Pentatonic Marketing 07415 121929 | [email protected] | www.pentatonicmarketing.com
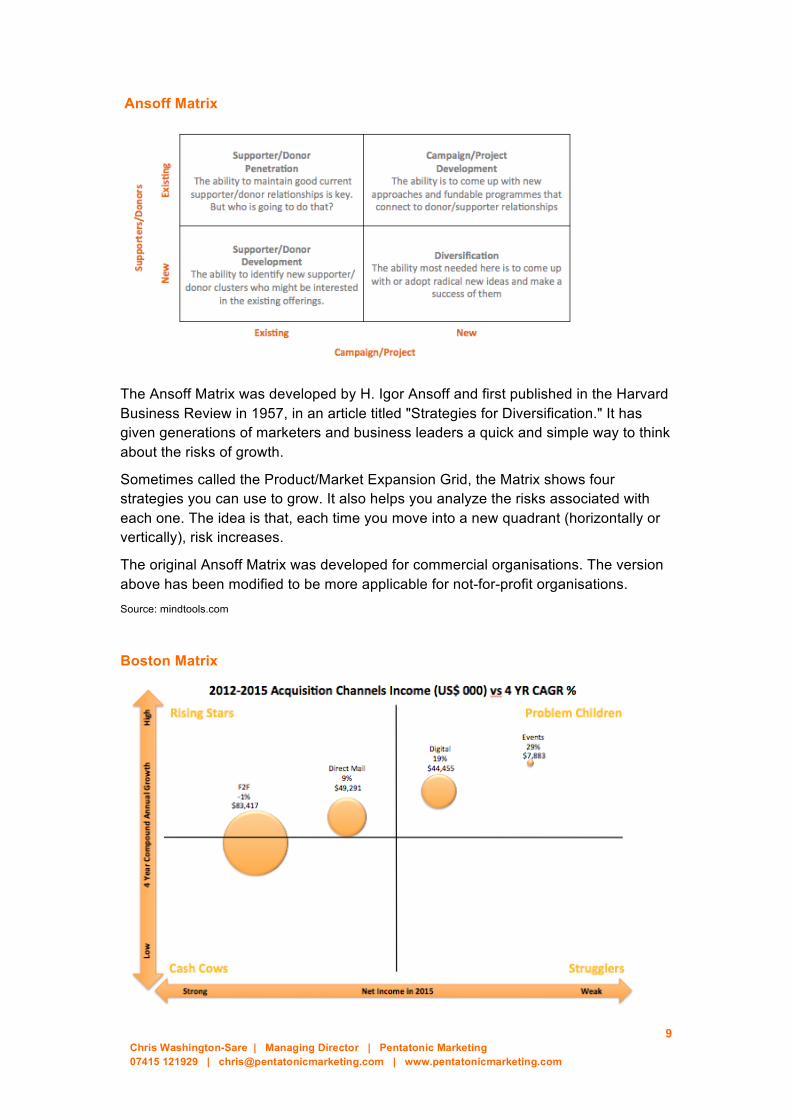
Ansoff Matrix
The Ansoff Matrix was developed by H. Igor Ansoff and first published in the Harvard Business Review in 1957, in an article titled "Strategies for Diversification." It has given generations of marketers and business leaders a quick and simple way to think about the risks of growth.
Sometimes called the Product/Market Expansion Grid, the Matrix shows four strategies you can use to grow. It also helps you analyze the risks associated with each one. The idea is that, each time you move into a new quadrant (horizontally or vertically), risk increases.
The original Ansoff Matrix was developed for commercial organisations. The version above has been modified to be more applicable for not-for-profit organisations. Source: mindtools.com
Boston Matrix

10 Chris Washington-Sare | Managing Director | Pentatonic Marketing 07415 121929 | [email protected] | www.pentatonicmarketing.com
The Boston Matrix is a marketing tool used for product portfolio analysis and management, developed by the Boston Consulting Group in the early 1970s. It considers the degree of market share and market growth and helps identify where best to use resources to maximize profit from a product management perspective. Market share represents the percentage of the total market achieved by an organization and is measured in terms of income. The Boston Matrix assumes a high market share provides financial benefits, so a higher share of the market means higher cash earnings. Market growth reflects the attractiveness of a market.
The Boston Matrix describes the impact of market share and market growth on businesses by using four categories: dogs (in the example above ‘Strugglers’, cash cows, question marks (in the example above ‘Problem children’) and rising stars.
Strugglers are confronted with weak market share and low market growth problems. They tend to absorb cash rather than generate it.
Cash cows enjoy a strong market share in low growing market. These service or products usually generate cash in excess but opportunities or new investments are limited, due to the low growing market. The aim is to protect them for as long as possible.
Problem children have low market share in a high growing market. These are products or services that grow rapidly and consume a high amount of resources, but generate low cash because of the low market share. They have the potential to grow market share and generate income thus turning into stars or cash cows when market growth slows, but there is also the possibility of them degrading into Strugglers with little return and wasted investment. Problem children are also called ‘question marks’ because we must analyze them carefully to decide whether they are worth the investment required to increase market share.
Stars represent the ideal combination for a company: high market-share in a fast growing industry, two elements which generate cash and further opportunities. Source: oxlearn.com
Porter's Five Forces
Five Forces Analysis assumes that there are five important forces that determine competitive power in a business situation. These are:
Supplier Power: Here you assess how easy it is for suppliers to drive up prices. This is driven by the number of suppliers of each key input, the uniqueness of their product or service, their strength and control over you, the cost of switching from one to another, and so on. The fewer the supplier choices you have, and the more you need suppliers' help, the more powerful your suppliers are.
Buyer Power: Here you ask yourself how easy it is for buyers to drive prices down. Again, this is driven by the number of buyers, the importance of each individual buyer to your business, the cost to them of switching from your products and services to those of someone else, and so on. If you deal with few, powerful buyers, then they are often able to dictate terms to you.

11 Chris Washington-Sare | Managing Director | Pentatonic Marketing 07415 121929 | [email protected] | www.pentatonicmarketing.com
Competitive Rivalry: What is important here is the number and capability of your competitors. If you have many competitors, and they offer equally attractive products and services, then you'll most likely have little power in the situation, because suppliers and buyers will go elsewhere if they don't get a good deal from you. On the other hand, if no-one else can do what you do, then you can often have tremendous strength.
Threat of Substitution: This is affected by the ability of your customers to find a different way of doing what you do – for example, if you supply a unique software product that automates an important process, people may substitute by doing the process manually or by outsourcing it. If substitution is easy and substitution is viable, then this weakens your power.
Threat of New Entry: Power is also affected by the ability of people to enter your market. If it costs little in time or money to enter your market and compete effectively, if there are few economies of scale in place, or if you have little protection for your key technologies, then new competitors can quickly enter your market and weaken your position. If you have strong and durable barriers to entry, then you can preserve a favorable position and take fair advantage of it.
Source: mindtools.com

12 Chris Washington-Sare | Managing Director | Pentatonic Marketing 07415 121929 | [email protected] | www.pentatonicmarketing.com
Comparator Analysis: Points of Parity and Difference
Step 2
Identify the business drivers Invariably once you have conducted the initial analysis you will have identified many points and facts. It is not unusual to have identified over 100 different issues. It is important that you cluster these issues into broad groups. Your aim should be to arrive at between 8-10 clusters of issues. Review each of these clusters and summarise the recurring theme running through the group of facts that you have brought together. The result is a key business driver.
Step 3
Identify the single-minded business goal you wish to achieve Your goal needs to link directly to your over-arching organisational Vision and Mission. Often a senior management team would identify the broad goal that needs to be achieved. Do not put targets or indicators into your goals. Do not try and have two goals in one map – this indicates are potential lack of focus and invariably will mean that one of the goals suffers. Examples of clear goals are:
• Our goal is to sustainably increase net income to ensure we can meet our programme needs
• Our goal is to reduce infant mortality rates by improving healthcare simultaneously in communities and at health facilities in Malawi
Comparator 1 Comparator 2 Comparator 3
Points of Difference
Things We Do That They Don’t
Things We Do Better Than Them
Points of Parity
Things They Do Better Than Us
Things They Do That We Don’t

13 Chris Washington-Sare | Managing Director | Pentatonic Marketing 07415 121929 | [email protected] | www.pentatonicmarketing.com
Step 4
Build the strategy map The following instructions explain how to build a strategy map in a workshop setting. Gather together a group of people from across the organisation that can add insight and strategic thinking. The ideal group size is between 10-15 people.
Write your goal from Step 2 on a sheet of paper and stick it on a large blank wall. It is also helpful to put a summary of the business drivers on the wall.
Agree the sequence of the perspectives. Do not under-estimate how important this is. It can take some debate, so be prepared to allow time for this. Write each perspective on a separate sheet of paper and stick them on the wall in the correct sequence on the left hand side of your map.
Using the How/Why logic, start with the first perspective on your map. If we were to assume it is a fundraising strategy map you are building, ask the workshop participants: What do we need to do from a financial perspective to achieve our goal? Allow participants to brainstorm objectives, writing each objective on an individual piece of paper. Cluster similar objectives together and summarise as a single objective. Once you have identified the objectives, stick each one on the wall.
Don’t worry too much about how many objectives you have or if they are really in the right position. As you progress with the building of the map it will become self-evident
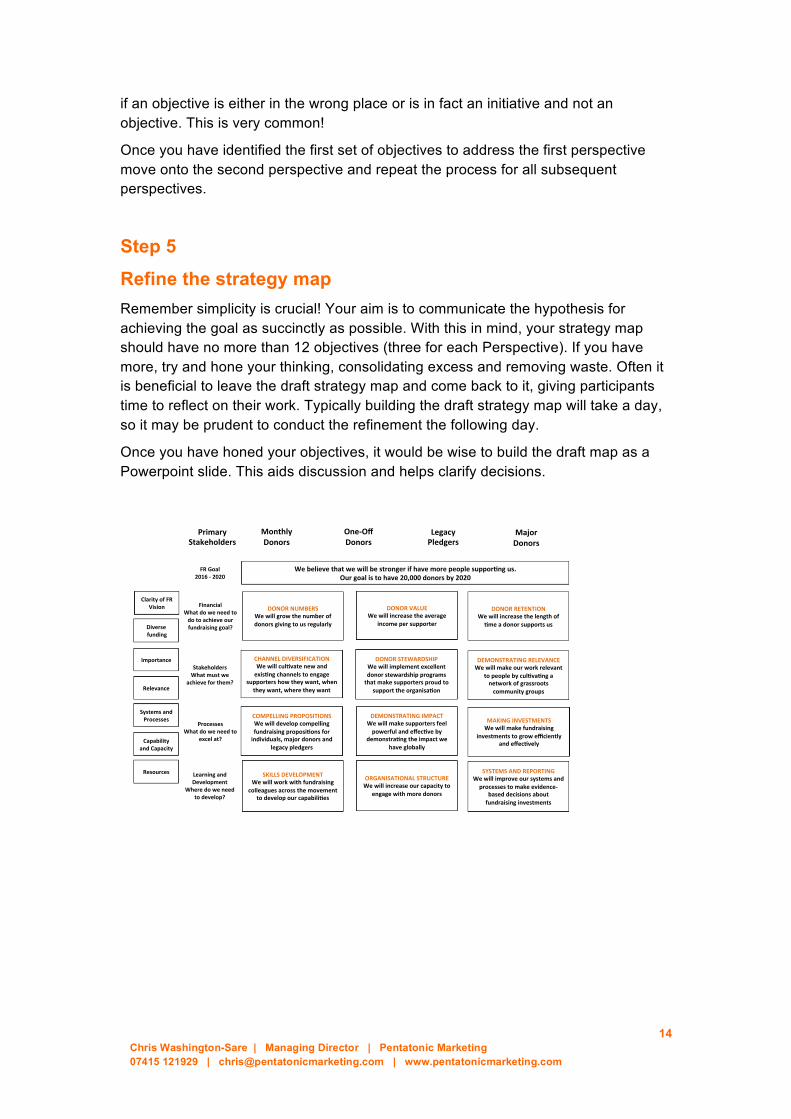
This is your agreed goal
These are your stakeholders
These are your objectives
These are your perspectives
14 Chris Washington-Sare | Managing Director | Pentatonic Marketing 07415 121929 | [email protected] | www.pentatonicmarketing.com
FRGoal2016-2020
Webelievethatwewillbestrongerifhavemorepeoplesuppor=ngus.Ourgoalistohave20,000donorsby2020
StakeholdersWhatmustwe
achieveforthem?
ProcessesWhatdoweneedto
excelat?
LearningandDevelopment
Wheredoweneedtodevelop?
FinancialWhatdoweneedtodotoachieveourfundraisinggoal?
MonthlyDonors
ORGANISATIONALSTRUCTUREWewillincreaseourcapacityto
engagewithmoredonors
DONORVALUEWewillincreasetheaverage
incomepersupporter
ClarityofFRVision
Diversefunding
Importance
Relevance
SystemsandProcesses
DEMONSTRATINGRELEVANCEWewillmakeourworkrelevant
topeoplebycul=va=nganetworkofgrassrootscommunitygroups
MAKINGINVESTMENTSWewillmakefundraising
investmentstogrowefficientlyandeffec=vely
CHANNELDIVERSIFICATIONWewillcul=vatenewandexis=ngchannelstoengage
supportershowtheywant,whentheywant,wheretheywant
COMPELLINGPROPOSITIONSWewilldevelopcompellingfundraisingproposi=onsforindividuals,majordonorsand
legacypledgers
SYSTEMSANDREPORTINGWewillimproveoursystemsandprocessestomakeevidence-
baseddecisionsaboutfundraisinginvestments
One-OffDonors
LegacyPledgers
CapabilityandCapacity
Resources
DEMONSTRATINGIMPACTWewillmakesupportersfeelpowerfulandeffec=veby
demonstra=ngtheimpactwehaveglobally
DONORSTEWARDSHIPWewillimplementexcellentdonorstewardshipprogramsthatmakesupportersproudto
supporttheorganisa=on
SKILLSDEVELOPMENTWewillworkwithfundraising
colleaguesacrossthemovementtodevelopourcapabili=es
DONORNUMBERSWewillgrowthenumberofdonorsgivingtousregularly
MajorDonors
PrimaryStakeholders
DONORRETENTIONWewillincreasethelengthof=meadonorsupportsus
if an objective is either in the wrong place or is in fact an initiative and not an objective. This is very common!
Once you have identified the first set of objectives to address the first perspective move onto the second perspective and repeat the process for all subsequent perspectives.
Step 5
Refine the strategy map Remember simplicity is crucial! Your aim is to communicate the hypothesis for achieving the goal as succinctly as possible. With this in mind, your strategy map should have no more than 12 objectives (three for each Perspective). If you have more, try and hone your thinking, consolidating excess and removing waste. Often it is beneficial to leave the draft strategy map and come back to it, giving participants time to reflect on their work. Typically building the draft strategy map will take a day, so it may be prudent to conduct the refinement the following day.
Once you have honed your objectives, it would be wise to build the draft map as a Powerpoint slide. This aids discussion and helps clarify decisions.

15 Chris Washington-Sare | Managing Director | Pentatonic Marketing 07415 121929 | [email protected] | www.pentatonicmarketing.com
Step 6
Map the dependencies After translating the strategy map into a digital format, it is necessary to map the key dependencies. Your aim at this stage is to identify those objectives that have the most dependencies. In doing so you will be able to see where you need to focus the most attention to give your plan the greatest chance of success. Often people use arrows to connect objectives. You can use whatever works best for you and your colleagues.
Step 7
Assign accountability This step is critical if you want to implement the strategy map effectively. Assign senior managers the accountability to oversee the achievement of specific objectives. Their immediate focus should be on:
• Helping identify key performance indicators
• Helping develop an implementation plan identifying the key initiatives or activities that need to be undertaken to achieve the objective
• Writing a brief narrative about the objective for which they are responsible
Step 8
Identify the key performance indicators For every objective in your strategy map, identify at least one key performance indicator that will show how the objective has been completely achieved. Ensure someone is held accountable for reporting on the KPI on a regular basis. Consider what you will do with the information once you have gathered it. Specifically what will you:
• Stop doing as it is not achieving the desired results
• Start doing to improve an existing situation
• Change to enhance the results
It is important that the indicator you identify show the activity has been completed. This is sometimes referred to as a Lag indicator. An indicator that shows you are on the way to achieving the objective is sometimes called a Lead or Process Indicator (see below):
• Example Objective: We will grow trust and foundation income
• Lead indicator: Number of funding applications submitted
• Lag indicator: Number of successful funding applications
A word of warning about creating the balanced scorecard! This is the most challenging part of the process as qualitative and quantitative indictors are required. Often it is difficult to create a scorecard in a workshop setting. It is often more effective to task individuals to develop indicators for specific objective, sharing their thoughts and suggestions over a few weeks.

16 Chris Washington-Sare | Managing Director | Pentatonic Marketing 07415 121929 | [email protected] | www.pentatonicmarketing.com
Step 9
Create the implementation plan Perhaps the easiest way to develop an implementation plan is to take the format below and build the plan using Excel or a project management software. Ensure milestones are clearly differentiated and easily identifiable to help keep the project on track. Additionally, ensure a person is identified who is responsible for delivering each initiative. It is suggested that the implementation plan has a rolling horizon of approximately 6 months and is reviewed monthly to ensure tasks are being completed.
Objective Initiative Responsibility Mth 1 Mth 2 Mth 3
eg: Increase the amount of money raised from trusts
eg: Research suitable trusts
eg: Fundraising Mgr
eg: Create shortlist
eg: Fundraising Mgr
Milestone
eg:
Draft case for support
eg: Fundraising Mgr
Step 10
Produce a narrative summary To aid comprehension it is recommended that a brief narrative be written to support each objective in the strategy map. Restrict this to no more than 150 words per objective and use it to clarify any nuances that may not be immediately clear in the strategy map.
17 Chris Washington-Sare | Managing Director | Pentatonic Marketing 07415 121929 | [email protected] | www.pentatonicmarketing.com
8. About Pentatonic Marketing
Pentatonic is an independent, UK-based consultancy, serving not-for-profit and ethically driven organisations of all sizes across the globe. Our approach offers clients a broad range of services which all share a common feature: rigorous quantitative and qualitative fundraising insight, combined with creative, lateral thinking.
It is Pentatonic Marketing’s ability to combine left-brain analytical thinking with right brain innovation that sets us apart from others. We offer clients specialist expertise in strategic development, direct marketing management and brand development. For more information go to
www.pentatonicmarketing.com
Chris Washington-Sare
Specialist expertise includes:
Planning, developing and delivering a range of fundraising projects, with an emphasis on fundraising from individuals
Marketing strategy and balanced scorecard development
Developing long term plans for fundraising programmes internationally
Chris is Pentatonic Marketing’s founder and Managing Director. Chris has spent over 20 years working for organisations in the commercial and not-for-profit sectors. Prior to establishing Pentatonic Marketing, he was Director of Marketing for CAMRADATA. He was previously Principal Consultant for The Management Centre, providing strategic and marketing consultancy services to charities around the world.
He has worked in organisations as diverse as the RSC, World Animal Protection and Greenpeace Australia Pacific and has first-hand experience developing and implementing fundraising programmes for a range of organisations.
He established the Greenpeace Australia Pacific in-house street fundraising programme. Within six months of establishing the operation, there were teams in 5 cities, 70 fundraisers and 9,000 new donors generated in the first year.
Recently Chris has run fundraising strategic planning workshops in Romania, Germany and Ireland for Transparency International; provided fundraising consultancy support to Amnesty sections in Brazil, Mexico, Argentina and Canada; drafted revised global fundraising policy guidelines for Amnesty International; and acted as interim Fundraising Director for World Animal Protection UK.

18 Chris Washington-Sare | Managing Director | Pentatonic Marketing 07415 121929 | [email protected] | www.pentatonicmarketing.com
9. Some Recent Clients
Acting as Interim Director of Global Fundraising Support (job share) to provide global fundraising strategic advice and direction whilst also directly supporting sections in Canada, Brazil, Mexico, Thailand, Taiwan, India, New Zealand and Argentina
Interim UK Director of Marketing and Fundraising for World Animal Protection, managing the organisation’s £11m fundraising strategy, significantly improving forecast ROI and introducing a new management accounting process
Providing workshop facilitation and mentoring services to East European chapters of Transparency International, an anti-corruption charity. Writing case for support documents to support approaches to high value donors.
Conducting a direct marketing review and segmentation exercise to improve fundraising activities for 10:10, a climate change charity
Conducting data analysis and RFM segmentation on CBM’s donor data file, identifying prospective donors suitable for re-activation, upgrade or conversion to regular giving
Designing and implementing websites using the DNN content management system for camradata.com and assetview.co.uk, an analytics firm providing data services to institutional investors
Developing a growth model and supporting budget planning templates to be used to create robust individual giving projections
19 Chris Washington-Sare | Managing Director | Pentatonic Marketing 07415 121929 | [email protected] | www.pentatonicmarketing.com
10. Testimonials
“Engaging, creative and insightful are the attributes you want from a marketing expert and all of these can be said about Chris. Clear, decisive and humorous are the ones you dream of as an operations director and Chris delivers these in abundance. Chris is comfortable working his marketing magic into the operational fabric of an organisation rather than solely delivering an unsustainable cosmetic solution and for this I can recommend him to you.”
Alastair Lamb, European Director of Operations & Resources, World Animal Protection
“Chris is one of those fundraisers you want to spend time with because each time you do, you learn something great that makes a difference to the way you run your business. His fundraising and marketing knowledge is both deep and wide with a very strong understanding of donor stewardship and retention strategies.”
Kevin Sher, Managing Director at Blackbaud Pacific
“Chris provided highly insightful strategic review and effectively engaged the SMT in developing a powerful new strategy.”
Marie Janson, Director of Development at Alzheimer's Research UK
“Chris is an outstanding marketing person. My first contact with Chris was when I attended one of his presentations. I very quickly became aware that, apart from being an engaging presenter, Chris has a deep understanding of marketing concepts. He intimately understands the marketplace he operates in. In working with Chris I have found that he is a perceptive thinker who adds value all along the way. In addition to all this, Chris is a delightful guy and a pleasure to work with.”
Frank Chamberlin, Managing Director, ActionWords
“I have seen that Chris has a very practical and common sense approach to fundraising that is extremely professional yet down to earth. His enthusiasm is inspiring and his expertise is very high level. The presentation he gave at a recent industry conference was engaging, interesting, open and honest.”
Sarah Mansfield, Fundraising Director, Fundraising Direct