an inverse linearization model for the characterization of...
TRANSCRIPT

INTERNATIONAL JOURNAL ON SMART SENSING AND INTELLIGENT SYSTEMS VOL. 9, NO. 2, JUNE 2016
637
AN INVERSE LINEARIZATION MODEL FOR THE
CHARACTERIZATION OF NON-CONTACT THERMOPILES
J-S. Botero V.1 A. Salazar1,2 and L-J. Morantes G.1 1Grupo de investigación AEyCC,
1Facultad de Ingenierías, Instituto Tecnológico Metropolitano ITM,
Carrera 31 No. 54-10, Medellín, Colombia. 2Grupo de Investigación SISTEMIC,
Facultad de Ingeniería, Universidad de Antioquia UdeA
Calle 70 No. 52-21, Medellín, Colombia
Email: [email protected], [email protected], [email protected]
Submitted: Dec. 16, 2015 Accepted: Mar. 20, 2016 Published: June 1, 2016
Abstract- A thermopile is an electronic device that converts thermal energy into electrical energy by means of
arrangements of thermocouples that are connected in series. In addition, optical filters restrict the wavelength that
strikes the thermopile. One of the main advantages of using a thermopile is its sensitivity to infrared radiation,
which allows implementing non-contact thermometers. However, the thermopile does not provide an absolute
temperature value, but a value that is proportional to the temperature gradient between the local temperature in the
measurement range of the thermopile and its internal temperature. Therefore, it is necessary to integrate
temperature sensors aiming to correct the output temperature value. In this sense, the output of the thermopile
corresponds to a value generated from the relationship between the internal temperature of the thermopile and the
output temperature. This work proposes and evaluates a thermopile characterization model, which uses an
incubation system and a thermoelectric cooling device to control the room temperature and the temperature that is
read out using the thermopile, respectively. This is based on the automation of the data collection procedure and
the characterization of the thermistor that is used to measure the temperature of the thermopile. The result is an
experimental operating surface, from which a linearization model was derived.
Index terms: Linearization, non-contact, thermopile, Peltier effect, thermistor.
J-S. Botero V., A. Salazar and L-J. Morantes G, AN INVERSE LINEARIZATION MODEL FOR THE CHARACTERIZATION OF NON-CONTACT THERMOPILES
638
I. INTRODUCTION
The thermopile is a passive thermal radiation detector that absorbs incoming radiation and converts
it into an electrical signal, on the same principle as a thermocouple [1]. Usually it is built using
arrays of thermocouples that are connected in series. Basically, it converts the difference between
the ambient temperature and the temperature of the object being measured into a voltage using the
Seebeck effect. This method is simple, requires no mechanics and can accurately detect static
signals. A thermistor is used internally, which consists of a resistor that changes its resistance
depending on the ambient temperature, to accurately measure the actual temperature [2]. It is a fact
that at present the study of sensors and these networks is very important for IoT development and
and reduce its cost [3]–[5].
The main applications of these sensors are non-contact temperature measurements and
measurements of infrared radiation used in medical procedures [6]–[8], monitoring and process
control [9]–[11], security systems [12], [13] and biological experiments [14] where the temperature
is important. In [7] a thermopile array for detecting fever patients with infectious diseases in the
clinical setting was developed. In [9] a calorimeter based on a thermopile was built for determining
the heat output associated with the growth of microorganism cultures. In [11] a resonant inductive-
capacitive (L-C) circuit-based wireless temperature sensor suitable for working in harsh
environments to monitor the temperature of rotating components, such as jet turbines, engines, and
power plants, etc. is presented. In [13] a technique is proposed to locate fire. The method is based
on an arrangement of two thermopiles controlling an extinguisher system.
In order to ensure the reliability of those processes, i.e., that they operate within specified limits,
calibration systems are utterly necessary, which is also important in measuring physical variables,
e.g., for the properly estimation of the accelerometer’s orientation [15], noise [5] or magnetometers
[16]. The standard method for calibrating thermocouples by comparison techniques [17] is based
on measuring the voltage of the sensor that is being analyzed at specific points, where the
temperature at each point is being measured with a standard thermometer. The number and
selection of the measurement points depend on the type of thermocouple, temperature range, and
accuracy. In [18], they estimate that the calibration equations allow improving accuracy in two
types of thermocouples by 0.4°C. In [19], they show calibration curves of two types of
thermocouples, selecting five temperature ranks, to evaluate the fit with different polynomial
INTERNATIONAL JOURNAL ON SMART SENSING AND INTELLIGENT SYSTEMS VOL. 9, NO. 2, JUNE 2016
639
equations. Furthermore in [20], they characterized two different types of thermal sensors,
thermistors and resistance temperature detectors, based on Labview’s system interface to sensor,
and associated an analog circuit for data conditioning, analysis, display, and control. However,
despite that they are developed based on the same principle of measurement as infrared
thermometers the literature does not report calibration studies of thermopiles.
A thermopile does not provide an absolute temperature value but one that is proportional to the
temperature gradient between the local temperature in the measurement field of the thermopile and
its internal temperature. Therefore, it is necessary to include temperature sensors to correct the
output temperature value. This work proposes a characterization method based on a linearization
procedure, which consists in the estimation of a function where the sensor output is the data set and
the linearized response is the target of the estimation.
Adhering to the manufacturer’s advice to use the data sheet, which suggests using look-up tables
with steps of 10°C in different object temperatures and internal temperatures, leads to low accuracy.
In this paper, a distribution function of temperature rise is generated for signal conditioning of
thermopiles, which allows measuring a wide range of temperatures and has long-term stability and
a high reliability.
The method proposed in this work can be used for the characterization of any thermopile. As a case
study, we used a thermopile composed of 116 thermocouples. The temperature readings of an
object were compared to those of a T type thermocouple in the controlled environment of an
incubator at different ambient temperatures. Likewise, a thermoelectric cooling device based on
the Peltier effect was used to vary the object’s temperature and to generate a test surface to describe
the behavior of the chosen sensor.
The main contributions of this work are:
A method to compensate the effect of the room temperature on the read-out of a thermopile.
An improving in the accuracy of the estimated temperature by replacing looking at a table
of numbers from the manufacturer’s data sheet for a surface that gives measures in a
continuous manner within the whole range of measurement.
For practical applications the calibration equation of the thermopile is expressed as an
inverse equation.
A characterization method that works for non-linear devices.
J-S. Botero V., A. Salazar and L-J. Morantes G, AN INVERSE LINEARIZATION MODEL FOR THE CHARACTERIZATION OF NON-CONTACT THERMOPILES
640
In addition to this introduction, the rest of this paper is organized as follows. The Section 2
describes the materials and methods used for the characterization of the sensor. Next, the
experimental setup is depicted in Section 3. Section 4 shows the results of the proposed
characterization method, and finally, the conclusions are drawn in Section 5.
II. MATERIALS AND METHODS
In this section we briefly describe the phenomena that define the behavior of the devices used in
this work to derive the linearization model for the characterization of a thermopile.
First, we define the Seebeck Effect and the Peltier Effect, which are the cause of the thermoelectric
effect [2], [21]. This phenomenon converts temperature differences at the junctions of two different
conductors into voltage and vice versa.
a. The Seebeek and Pertier effects
The Seebeck Effect describes how a voltage is created from a temperature difference between two
metals or semiconductors. This difference causes a current in the conductors, if they form a
complete loop. Having two materials (A and B), the Seebeck potential is determined from the
differential coefficient AB A B and the net voltage ABV of the junction is given by
AB ABdV dT .
The coefficient is temperature dependent, and therefore the potential is different at different
temperatures [2].
The Peltier Effect refers to the reversible absorption of heat, when an electric current passes through
a junction of two different metals. The effect occurs when power is applied externally or is induced
by the thermocouple junction itself. The Peltier effect is used for two purposes: it can produce heat
or cold (remove heat), depending on the direction of the current i, such as:
PdQ pidt .
INTERNATIONAL JOURNAL ON SMART SENSING AND INTELLIGENT SYSTEMS VOL. 9, NO. 2, JUNE 2016
641
The coefficient p has dimensions of voltage and represents the thermoelectric properties of the
material [2].
Next, we describe the models used to estimate the temperature of an object using a combination of
a thermistor and a thermopile.
b. Non-contact measuring of temperature
The resistance of a semiconductor can be modeled with the Steinhart-Hart model [22], described
by Equation (1).
31
ln( ) lna b R c RT . (1)
Where, T is the temperature in kelvin, R is the resistance of the semiconductor at T, and a, b, and c
are the Steinhart–Hart coefficients. The value of the coefficients varies depending on the type of
thermistor [2].
The β-model is a simplified version of the Steinhart-Hart equation with
0
0
1 1 1ln( ), , and 0.a R b c
T
From above, the behavior of a thermistor can be described using the Equation (2).
0
1 1 1ln
o
R
T T R
, (2)
where 0R is the resistance at temperature oT (298.15 K). Typically, the values of 0R and β are
provided by the manufacturer, but we will demonstrate here that this values must be recomputed
in order to get more accurate temperature values. From Equation (2), it is possible to define the
resistance of a thermistor as a function of the temperature, thus,

J-S. Botero V., A. Salazar and L-J. Morantes G, AN INVERSE LINEARIZATION MODEL FOR THE CHARACTERIZATION OF NON-CONTACT THERMOPILES
642
( ) TR T e
, (3)
with
0
0
T
R
e
.
Similarly, the temperature of a thermopile can be expressed as a function of the resistance as is
described by Equation (4). This model was derived from Equation (3) and is used to compensate
the polynomial model of a thermopile TTH.
( )
lnTHT R
R
. (4)
In the next section, we describe the devices used to characterize a non-contact temperature sensor.
The OTP-538U thermopile and the TEC1-12706 thermoelectric cooler were selected as case of
study, but the proposed method can be used for any other devices of the same kind. Also the
incubator system controlling the room temperature, which was used as reference, is described.
c. Devices used in this work
Thermopile: The OTP-538U is a thermopile sensor composed of an array of 116 thermocouples in
series on a floating membrane with a diameter of 545 microns and a dark surface to absorb incident
infrared thermal radiation, which in response induces an electric tension in the terminal exits. The
infrared (IR) window is a band pass filter with a 50% cut-on at a wavelength of 5 µm, and cut-
down at 14 µm. The sensor responds proportionally to the impacting IR radiation and has a signal
of constant response in its cut-off frequency, which is limited by the time constant. It also includes
a thermistor with an earthed conductor that delivers the ambient temperature reference [23]. Table
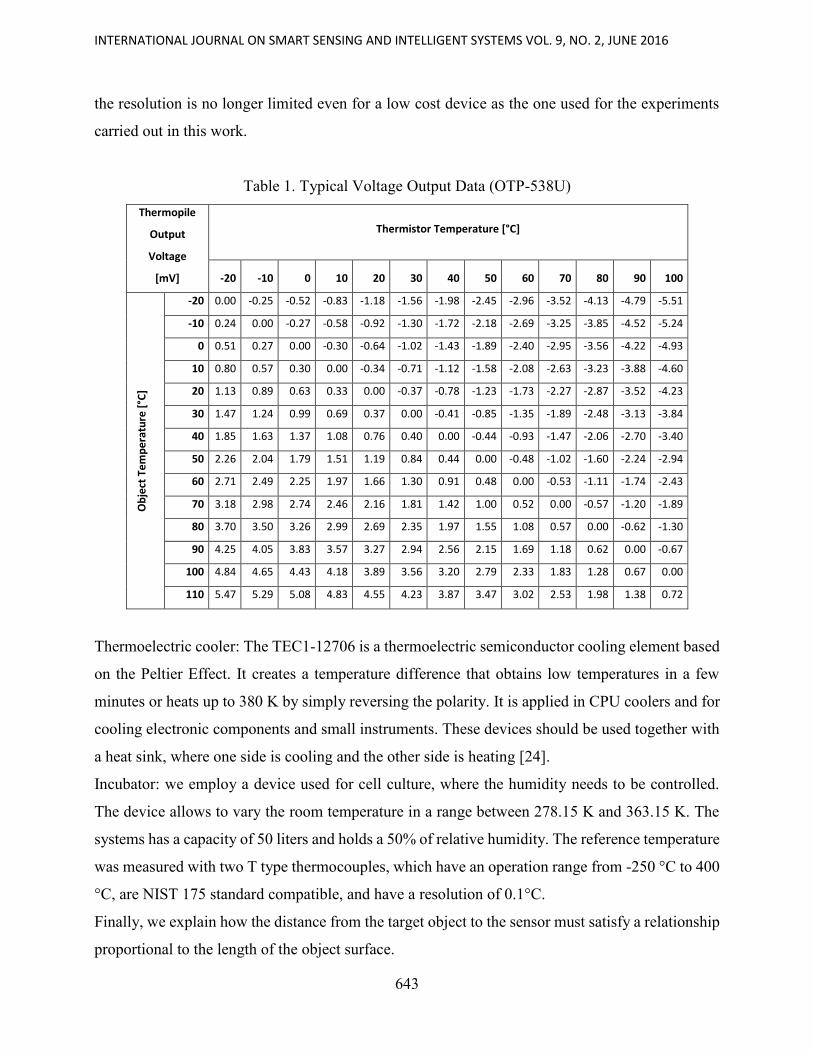
1 shows the look-up table given by the manufacturer. As can be seen the measuring resolution is
10°C, which is very limited. We will demonstrate that, with the proposed calibration procedure,
INTERNATIONAL JOURNAL ON SMART SENSING AND INTELLIGENT SYSTEMS VOL. 9, NO. 2, JUNE 2016
643
the resolution is no longer limited even for a low cost device as the one used for the experiments
carried out in this work.
Table 1. Typical Voltage Output Data (OTP-538U)
Thermopile
Output
Voltage
[mV]
Thermistor Temperature [°C]
-20 -10 0 10 20 30 40 50 60 70 80 90 100
Ob
ject
Te
mp
era
ture
[°C
]
-20 0.00 -0.25 -0.52 -0.83 -1.18 -1.56 -1.98 -2.45 -2.96 -3.52 -4.13 -4.79 -5.51
-10 0.24 0.00 -0.27 -0.58 -0.92 -1.30 -1.72 -2.18 -2.69 -3.25 -3.85 -4.52 -5.24
0 0.51 0.27 0.00 -0.30 -0.64 -1.02 -1.43 -1.89 -2.40 -2.95 -3.56 -4.22 -4.93
10 0.80 0.57 0.30 0.00 -0.34 -0.71 -1.12 -1.58 -2.08 -2.63 -3.23 -3.88 -4.60
20 1.13 0.89 0.63 0.33 0.00 -0.37 -0.78 -1.23 -1.73 -2.27 -2.87 -3.52 -4.23
30 1.47 1.24 0.99 0.69 0.37 0.00 -0.41 -0.85 -1.35 -1.89 -2.48 -3.13 -3.84
40 1.85 1.63 1.37 1.08 0.76 0.40 0.00 -0.44 -0.93 -1.47 -2.06 -2.70 -3.40
50 2.26 2.04 1.79 1.51 1.19 0.84 0.44 0.00 -0.48 -1.02 -1.60 -2.24 -2.94
60 2.71 2.49 2.25 1.97 1.66 1.30 0.91 0.48 0.00 -0.53 -1.11 -1.74 -2.43
70 3.18 2.98 2.74 2.46 2.16 1.81 1.42 1.00 0.52 0.00 -0.57 -1.20 -1.89
80 3.70 3.50 3.26 2.99 2.69 2.35 1.97 1.55 1.08 0.57 0.00 -0.62 -1.30
90 4.25 4.05 3.83 3.57 3.27 2.94 2.56 2.15 1.69 1.18 0.62 0.00 -0.67
100 4.84 4.65 4.43 4.18 3.89 3.56 3.20 2.79 2.33 1.83 1.28 0.67 0.00
110 5.47 5.29 5.08 4.83 4.55 4.23 3.87 3.47 3.02 2.53 1.98 1.38 0.72
Thermoelectric cooler: The TEC1-12706 is a thermoelectric semiconductor cooling element based
on the Peltier Effect. It creates a temperature difference that obtains low temperatures in a few
minutes or heats up to 380 K by simply reversing the polarity. It is applied in CPU coolers and for
cooling electronic components and small instruments. These devices should be used together with
a heat sink, where one side is cooling and the other side is heating [24].
Incubator: we employ a device used for cell culture, where the humidity needs to be controlled.
The device allows to vary the room temperature in a range between 278.15 K and 363.15 K. The
systems has a capacity of 50 liters and holds a 50% of relative humidity. The reference temperature
was measured with two T type thermocouples, which have an operation range from -250 °C to 400
°C, are NIST 175 standard compatible, and have a resolution of 0.1°C.
Finally, we explain how the distance from the target object to the sensor must satisfy a relationship
proportional to the length of the object surface.
J-S. Botero V., A. Salazar and L-J. Morantes G, AN INVERSE LINEARIZATION MODEL FOR THE CHARACTERIZATION OF NON-CONTACT THERMOPILES
644
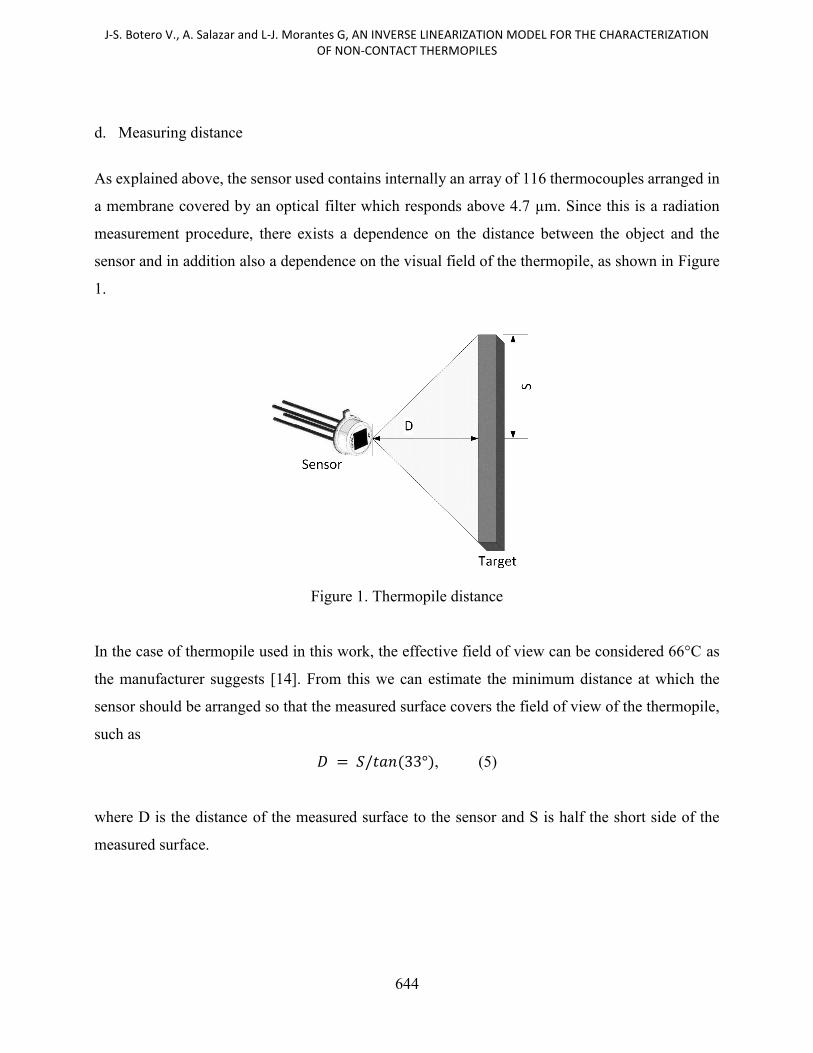
d. Measuring distance
As explained above, the sensor used contains internally an array of 116 thermocouples arranged in
a membrane covered by an optical filter which responds above 4.7 µm. Since this is a radiation
measurement procedure, there exists a dependence on the distance between the object and the
sensor and in addition also a dependence on the visual field of the thermopile, as shown in Figure
1.
Figure 1. Thermopile distance
In the case of thermopile used in this work, the effective field of view can be considered 66°C as
the manufacturer suggests [14]. From this we can estimate the minimum distance at which the
sensor should be arranged so that the measured surface covers the field of view of the thermopile,
such as
𝐷 = 𝑆/𝑡𝑎𝑛(33°), (5)
where D is the distance of the measured surface to the sensor and S is half the short side of the
measured surface.
INTERNATIONAL JOURNAL ON SMART SENSING AND INTELLIGENT SYSTEMS VOL. 9, NO. 2, JUNE 2016
645
III. EXPERIMENTAL SETUP
Two different experiments were carried out in this work. First, we verified the theoretical model
provided by the manufacturer of the thermistor. The second experiment aimed to generate a surface
that captures the behavior of a thermopile as a function of its output voltage and the temperature
of a target object, which is the basis of the inverse model introduced in this paper. In both
experiments an incubator was used to guarantee a controlled room temperature. The reference
temperature was measured with a T type thermocouple.
The validation of the theoretical model of the thermistor was compared with the one obtained from
the interpolation of the resistance values, measured while varying the room temperature of the
incubator in a range between 260 K and 360 K. A set of 100 samples was acquired, which
corresponds to a sampling step of 1 K. By using Least Squares Minimization a curve was fitted to
the data. As this curve corresponds to the theoretical model described by Equation (3), the
experimental values of τ and β can be derived from the experimental data. This experiment is
denoted as ECT.
In order to model the relationship between the incident IR radiation and the internal temperature
of a thermopile, read-outs in millivolts were obtained from the thermopile while the temperature
of the Peltier cooler was varied. 15 different read-outs of the Peltier cell between 278.15 K and
363.15 K were taken, as well as 15 different ambient temperature values between 278.15 K and
363.15 K to obtain a total data set of 225 samples. This experiment is denoted as ESTH. With these
experimental data a surface was adjusted to a quadratic polynomial, as shown in Equation (6).
2 2
00 10 01 20 11 02TH TP TH TH TP TPV a a T a T a T a T T a T , (6)
where TTP and TTH represent the temperatures of the Peltier cell (temperature of the target object)
and the internal temperature of the thermopile, respectively. V corresponds to the voltage measured
in the terminals of the thermopile. It is given that the value of V is known, thus TTH is written in the
form of a quadratic equation, as shown in Equation (7).
2 2
02 11 01 00 10 20( 0 )TP TH TP TH THa T a T a T V a a T a T . (7)
J-S. Botero V., A. Salazar and L-J. Morantes G, AN INVERSE LINEARIZATION MODEL FOR THE CHARACTERIZATION OF NON-CONTACT THERMOPILES
646
Next, using the solution of a quadratic equation, Equation (7), which is defined as a function of V
and TTH, is solved. In this way, we introduce the calibration equation as an inverse equation, which
is very useful in practice. Equation (8) shows the calibration equation of a thermopile.
2 2 1/2
11 01 11 01 02 00 10 20
02
1( ( ) (( ) 4 ( ))+ )
2TP TH TH TH THT a T a a T a a V a a T a T
a . (8)
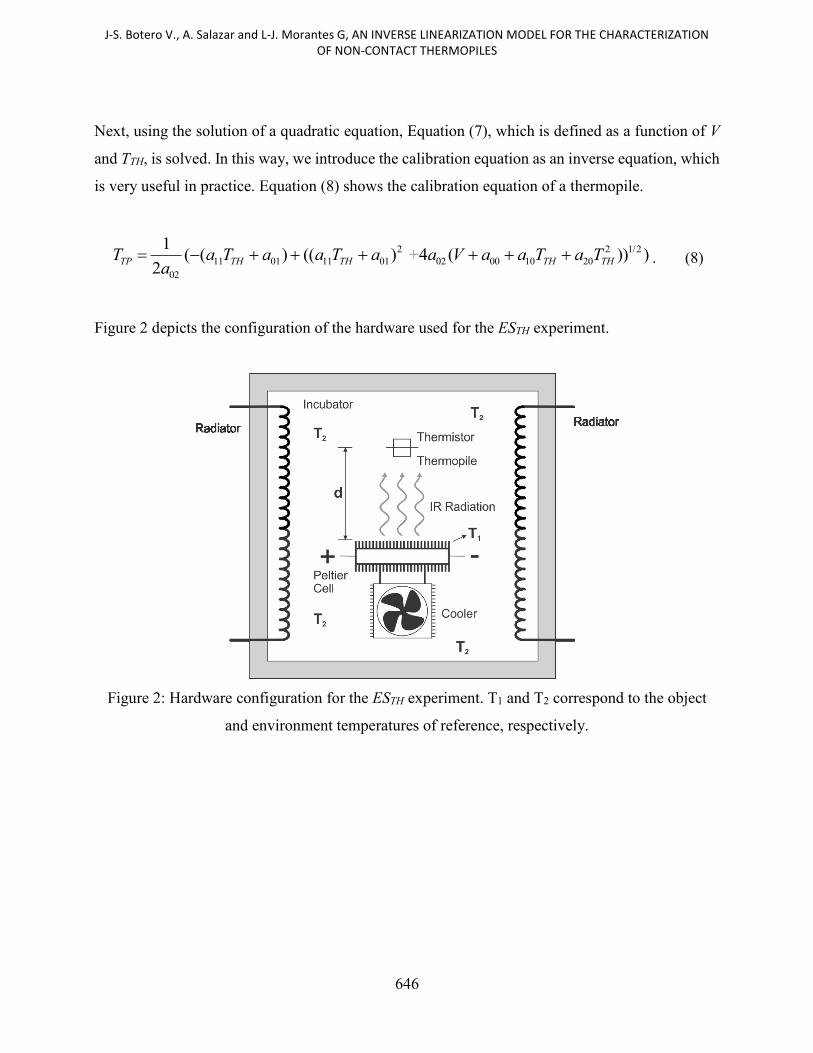
Figure 2 depicts the configuration of the hardware used for the ESTH experiment.
Figure 2: Hardware configuration for the ESTH experiment. T1 and T2 correspond to the object
and environment temperatures of reference, respectively.
INTERNATIONAL JOURNAL ON SMART SENSING AND INTELLIGENT SYSTEMS VOL. 9, NO. 2, JUNE 2016
647
IV. RESULTS
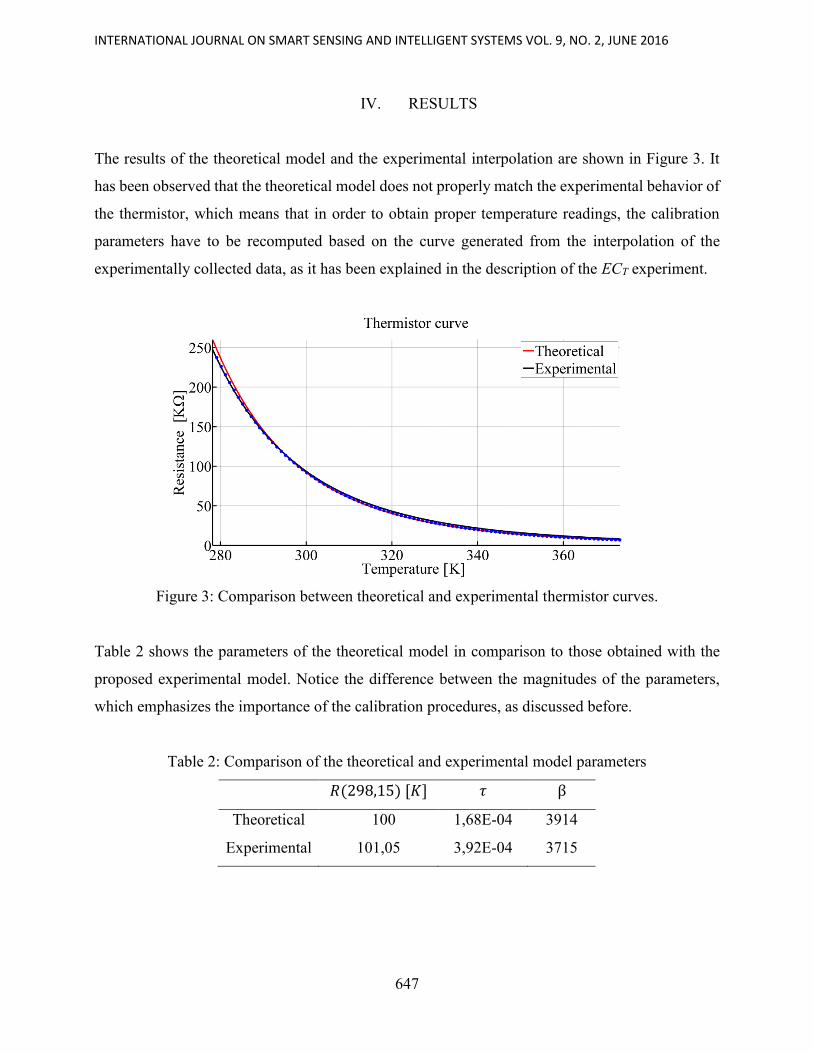
The results of the theoretical model and the experimental interpolation are shown in Figure 3. It
has been observed that the theoretical model does not properly match the experimental behavior of
the thermistor, which means that in order to obtain proper temperature readings, the calibration
parameters have to be recomputed based on the curve generated from the interpolation of the
experimentally collected data, as it has been explained in the description of the ECT experiment.
Figure 3: Comparison between theoretical and experimental thermistor curves.
Table 2 shows the parameters of the theoretical model in comparison to those obtained with the
proposed experimental model. Notice the difference between the magnitudes of the parameters,
which emphasizes the importance of the calibration procedures, as discussed before.
Table 2: Comparison of the theoretical and experimental model parameters
𝑅(298,15) [𝐾] 𝜏 β
Theoretical 100 1,68E-04 3914
Experimental 101,05 3,92E-04 3715

J-S. Botero V., A. Salazar and L-J. Morantes G, AN INVERSE LINEARIZATION MODEL FOR THE CHARACTERIZATION OF NON-CONTACT THERMOPILES
648
Finally, Figure 4 shows the test surface describing the behavior of the thermopile. This surface was
obtained from the data of the ESTH experiment. Notice that the resolution of the measures is no
longer limited to specific values, because it derived from a surface. In addition, for the first time,
results were obtained from a model that combines the internal temperature of a thermopile, its
output voltage, and the temperature of an object.
Figure 4: Thermopile surface
VI. CONCLUSIONS
A characterization method of a thermopile is proposed in this work. An incubation system controls
the environmental temperature whereas a thermoelectric cooling device is used to vary the
temperature of the object. The temperature measured with a T type thermocouple is used as a
reference. With this setup, several readings are collected and a surface describing the behavior of
the thermopile is derived. As a result, a calibration equation for thermopiles is proposed. This
model allows obtaining more accurate read-outs in a broader temperature making the
measurements more reliable.
As further work, we want to study the influence of the distance between the target object and the
sensor, which results in a more compact model for non-invasive temperature measurement.
INTERNATIONAL JOURNAL ON SMART SENSING AND INTELLIGENT SYSTEMS VOL. 9, NO. 2, JUNE 2016
649
REFERENCES
[1] T. M. Adams and R. A. Layton, Introductory MEMS Fabrication and Applications. Springer
Science+Business Media, 2010.
[2] J. Fraden, Handbook of Modern Sensors: Physics, Designs, and Applications, Fourth Ed.
Springer New York, 2010.
[3] M. Assaad, I. Yohannes, A. Bermak, D. Ginhac, and F. Meriaudeau, “Design and
characterization of automated color sensor system,” Int. J. smart Sens. Intell. Syst., vol. 7,
no. 1, pp. 1–12, 2014.
[4] D. Bhattacharjee, G. Sharma, and R. Bera, “Universal intelligent sensor interface,” Int. J.
Smart Sens. Intell. Syst., vol. 8, no. 4, pp. 2307–2327, 2015.
[5] J. Hughes, J. Yan, and S. Kenichi, “Development of Wireless Sensor Network Using
Bluetooth Low Energy ( Ble ) for Construction,” Int. J. Smart Sens. Intell. Syst., vol. 8, no.
2, pp. 1379–1405, 2015.
[6] M. Liess, H. Karagözoglu, and H. Ernst, “Reducing thermal transient induced errors in
thermopile sensors in ear thermometer applications,” Sensors Actuators A Phys., vol. 154,
no. 1, pp. 1–6, Aug. 2009.
[7] G. Sun, T. Saga, T. Shimizu, Y. Hakozaki, and T. Matsui, “Fever screening of seasonal
influenza patients using a cost-effective thermopile array with small pixels for close-range
thermometry.,” Int. J. Infect. Dis. - IJID Off. Publ. Int. Soc. Infect. Dis., vol. 25, pp. 56–8,
Aug. 2014.
[8] A. Mahajan, C. Oesch, H. Padmanaban, L. Utterback, and F. Figueroa, “Physical and Virtual
Intelligent Sensors for Integrated Health Management Systems,” Int. J. Smart Sens. Intell.
Syst., vol. 5, no. 3, pp. 559–575, 2012.
[9] J. Higuera-Guisset, J. Rodríguez-Viejo, M. Chacón, F. J. Muñoz, N. Vigués, and J. Mas,
“Calorimetry of microbial growth using a thermopile based microreactor,” Thermochim.
Acta, vol. 427, no. 1–2, pp. 187–191, Mar. 2005.
[10] S. a. O’Shaughnessy, M. a. Hebel, S. R. Evett, and P. D. Colaizzi, “Evaluation of a wireless
infrared thermometer with a narrow field of view,” Comput. Electron. Agric., vol. 76, no. 1,
pp. 59–68, Mar. 2011.
[11] R. I. Rodriguez and Y. Jia, “A wireless inductive-capacitive (L-C) sensor for rotating
component temperature monitoring,” Int. J. Smart Sens. Intell. Syst., vol. 4, no. 2, pp. 325–
337, 2011.
[12] K. Keränen, J.-T. Mäkinen, P. Korhonen, E. Juntunen, V. Heikkinen, and J. Mäkelä,
“Infrared temperature sensor system for mobile devices,” Sensors Actuators A Phys., vol.
158, no. 1, pp. 161–167, Mar. 2010.
[13] A. Pesatori and M. Norgia, “Infrared image system for fire location,” Measurement, vol. 46,
no. 10, pp. 4172–4178, Dec. 2013.
[14] S. P. Singh and P. Singh, “Effect of temperature and light on the growth of algae species: A
review,” Renew. Sustain. Energy Rev., vol. 50, pp. 431–444, 2015.
[15] J.-S. Botero V., W. Hernandez, and E. Fernandez, “Orientation of a triaxial accelerometer
using a homogeneous transformation matrix and Kalman filters,” Int. J. Smart Sens.
J-S. Botero V., A. Salazar and L-J. Morantes G, AN INVERSE LINEARIZATION MODEL FOR THE CHARACTERIZATION OF NON-CONTACT THERMOPILES
650
iIntelligent Syst., vol. 7, no. 4, pp. 1631–1646, 2014.
[16] M. Kiani, S. H. Pourtakdoust, and A. A. Sheikhy, “Consistent calibration of magnetometers
for nonlinear attitude determination,” Measurement, vol. 73, pp. 180–190, 2015.
[17] ASTM International, “E220-13, Standard Test Method for Calibration of Thermocouples
By Comparison Techniques,” in Book of Standards, West Conshohocken, PA: ASTM
International, 2013.
[18] C. Chen, Y.-K. Weng, and T.-C. Shen, “Performance evaluation of an infrared
thermocouple.,” Sensors (Basel)., vol. 10, no. 11, pp. 10081–94, Jan. 2010.
[19] A. Chen and C. Chen, “Evaluation of piecewise polynomial equations for two types of
thermocouples.,” Sensors (Basel)., vol. 13, no. 12, pp. 17084–97, Jan. 2013.
[20] N. Afsarimanesh and P. Z. Ahmed, “LabVIEW Based Characterization and Optimization of
Thermal Sensors,” Int. J. Smart Sens. Intell. Syst., vol. 4, no. 4, pp. 726–739, 2011.
[21] X. C. Tong, Advanced Materials for Thermal Management of Electronic Packaging.
Springer Science+Business Media, 2011.
[22] J. S. Steinhart and S. R. Hart, “Calibration curves for thermistors,” Deep Sea Res. Oceanogr.
Abstr., vol. 15, no. 4, pp. 497–503, 1968.
[23] Oriental System Technology Inc. - Orisystech, “Thermopile Sensor OTP-538U,” Datasheet
Oriental System Technology Inc., 2009. .
[24] Hebei, “Thermoelectric Cooler TEC1-12 706,” Datasheet Hebei I.T. (Shanghai) Co., Ltd. .