an investigation of cancer incidence...
TRANSCRIPT

AN INVESTIGATION OF CANCER INCIDENCE IN MAPLETON, UTAH, 1978 - 2001
January 28, 2004
Prepared by:
Greg Williams, M.P.H., Epidemiologist John Contreras, Epidemiologist
Environmental Epidemiology Program Office of Epidemiology
Utah Department of Health

TABLE OF CONTENTS
EXECUTIVE SUMMARY ............................................................................................................ 1 INTRODUCTION .......................................................................................................................... 3 METHODS ..................................................................................................................................... 4
Cancer Data................................................................................................................................. 4 Census Data ................................................................................................................................ 4 Geographic Data ......................................................................................................................... 4 Comparison Population............................................................................................................... 4 Statistical Analysis...................................................................................................................... 5 Literature Search......................................................................................................................... 5
CANCERS OF CONCERN............................................................................................................ 6 RESULTS ....................................................................................................................................... 6
Cancer of all the Sites ................................................................................................................. 6 Oral Cavity & Pharynx ............................................................................................................... 6 Stomach Cancer .......................................................................................................................... 7 Colon Cancer .............................................................................................................................. 7 Rectum and Rectosigmoid Junction Cancer ............................................................................... 7 Urinary Bladder Cancer .............................................................................................................. 7 Liver Cancer................................................................................................................................ 7 Prostate Cancer ........................................................................................................................... 7 Female Breast Cancer ................................................................................................................. 8 Lung and Bronchial Cancer ........................................................................................................ 8 Soft Tissue Cancer ...................................................................................................................... 8 Brain Cancer ............................................................................................................................... 8 Non-Hodgkin’s lymphoma and Chronic Lymphocytic Leukemia ............................................. 8
DISCUSSION................................................................................................................................. 9 CANCER RISK FACTORS ......................................................................................................... 10
Cancer of the Oral Cavity/Pharynx........................................................................................... 11 Stomach Cancer ........................................................................................................................ 11 Colorectal Cancer...................................................................................................................... 11 Urinary Bladder Cancer ............................................................................................................ 11 Liver Cancer.............................................................................................................................. 12 Prostate Cancer ......................................................................................................................... 12 Female Breast Cancer ............................................................................................................... 12 Cancer of the Lung and Bronchus ............................................................................................ 13 Cancer of the Soft Tissue.......................................................................................................... 13 Brain Cancer ............................................................................................................................. 13 Non-Hodgkin’s Lymphoma ...................................................................................................... 14 Lymphocytic Leukemia ............................................................................................................ 14
CONTAMINANTS....................................................................................................................... 14 LIMITATIONS OF INVESTIGATION....................................................................................... 16 CONCLUSION............................................................................................................................. 16 REFERENCES ............................................................................................................................. 17 APPENDIX A - Map .................................................................................................................... 19 APPENDIX B - Population Estimates.......................................................................................... 20
i
APPENDIX C - Statistical Calculations ....................................................................................... 21 APPENDIX D - Tables................................................................................................................. 22
All Sites Combined................................................................................................................... 23 Oral Cavity & Pharynx ............................................................................................................. 23 Stomach..................................................................................................................................... 23 Colon......................................................................................................................................... 24 Rectum & Rectosigmoid Junction ............................................................................................ 24 Urinary Bladder ........................................................................................................................ 24 Prostate...................................................................................................................................... 25 Female Breast............................................................................................................................ 25 Lung & Bronchus...................................................................................................................... 25 Soft Tissue ................................................................................................................................ 26 Brain.......................................................................................................................................... 26 Non Hodgkin’s Lymphoma & Chronic Lymphocytic Leukemia ............................................. 26
ii
AN INVESTIGATION OF CANCER INCIDENCE IN MAPLETON, UTAH, 1978-2001
January 28, 2004
Environmental Epidemiology Program
Office of Epidemiology Utah Department of Health
EXECUTIVE SUMMARY Mapleton, Utah is a town located approximately 10 miles southeast of Provo in Utah County. In 1978, the Utah Division of Water Quality detected increased nitrate levels in the ground water beneath Mapleton. At that time, the Utah Division of Water Quality estimated that less than one percent of Mapleton's population was utilizing private wells as a source of drinking water. Currently all Mapleton residents are on the public water system that (historically) has not exceeded the Environmental Protection Agency's Maximum Contaminant Level of 10 mg/L for nitrate. In 1986, a containment pond located within the former Trojan Corporation property, now Ensign-Bickford Industries, Inc., ruptured and released nitric acid into the soil and ground water. Some residents of Mapleton perceived that the numbers of cancers in Mapleton have been increasing and speculated that the source for the increased cancers in their community was associated with the increased levels of nitrate and Royal Demolition Explosive (RDX) in the private drinking wells. The closer the private wells were located to Ensign-Bickford Industries, Inc. the higher the contamination of nitrates (>10 mg/L) and RDX. As a result, in 1989 the Utah Department of Environmental Quality requested quarterly testing of private wells in Mapleton for nitrate levels. The State of Utah and Ensign-Bickford Industries, Inc. signed a stipulation and Consent Agreement in 1991 that required Ensign-Bickford Industries, Inc. to continue quarterly sampling in conjunction with the Utah Division of Water Quality. This sampling process is still ongoing, and as of 1999, active remediation of the ground water has been ongoing. No private water users are consuming their well water for culinary purposes. All constituents are in the process of removal. Nitrate across the area is now below the drinking water MCL of 10 mg/L. In addition, the public drinking wells in Mapleton have all tested negative for RDX contamination with the exception of Mapleton Well #1. There have been no reports of residents consuming water from this well since November of 1994. Mapleton Well #1 is currently under remediation. In October of 1994, the Utah County Health Department requested assistance from the Bureau of Epidemiology, Utah Department of Health, in conducting an epidemiologic investigation of cancer rates in Mapleton. In April 1995, a cancer cluster investigation of Mapleton, census tract 10301, was conducted using reported cases of cancer from 1978 through 1993. The results of the 1995 investigation found statistically significant increases in rates of prostate cancer, cancer of the soft tissue, and chronic lymphocytic leukemia in at least one period (three time intervals were evaluated) as compared to Salt Lake County. In 1997, a second investigation was conducted in
1

census tract 10301 that included an additional two years of cancer data (1994 and 1995). The results of the 1997 investigation identified statistically significant increases in cancer from all the sites combined, prostate cancer, cancer of the soft tissue, and chronic lymphocytic leukemia in at least one period (five time intervals were evaluated) as compared to Salt Lake County. Neither the 1995 nor the 1997 investigations identified a statistically significant elevation of cancer rates for cancers that are believed to potentially be associated with chronic nitrates or RDX exposures. The reported cancer cases for both investigations were obtained from the Utah Cancer Registry. In 2003, the Office of Epidemiology (previously called the Bureau of Epidemiology) examined the cancer incidence in Mapleton (census tract 10301), with an additional six years of data (1996 - 2001). This allowed this investigation to examine 24 years of cancer data (1978 - 2001) in Mapleton, as a follow-up to the two previous cancer cluster investigations. This investigation, however, applied the state of Utah as the comparison population. Cancer data for this investigation were obtained from the Utah Cancer Registry for census tract 10301 and for the state of Utah. The year 2001 was the most recent year for which complete data were available. Population demographics for Mapleton (census tract 10301) and the state of Utah were obtained from the 1970, 1980, 1990, and 2000 U.S. Census Data. The results of this investigation did not find a statistically significant excess of cancer in Mapleton as compared to the state of Utah. This investigation found one cancer (soft tissue) that was significantly elevated in only one of the periods (1997 - 2001) evaluated and cumulatively from 1978 - 2001 (six time intervals were evaluated). An established mechanism for carcinogenicity does not exist between the contaminants of concern in this investigation and cancer of the soft tissue.
2

An Investigation of Cancer Incidence In Mapleton, Utah, 1978-2001 January 28, 2004
AN INVESTIGATION OF CANCER INCIDENCE IN MAPLETON, UTAH, 1978-2001
January 28, 2004
Environmental Epidemiology Program Office of Epidemiology
Utah Department of Health INTRODUCTION Mapleton, Utah is a town located approximately 10 miles southeast of Provo in Utah County. In 1978, the Utah Division of Water Quality detected increased nitrate levels in the ground water beneath Mapleton. At that time, the Utah Division of Water Quality estimated less than one percent of Mapleton’s population was utilizing private wells as a source of drinking water. All Mapleton residents are on the public water system that (historically) has not exceeded the Environmental Protection Agency’s Maximum Contaminant Level (MCL) of 10 mg/L for nitrate. In 1986, a containment pond located within the former Trojan Corporation, now Ensign-Bickford Industries, Inc., ruptured and released nitric acid and Royal Demolition Explosive (RDX) into the soil and ground water. The closer the private wells were located to Ensign-Bickford Industries, Inc. the higher the contamination of nitrates (>10 mg/L) and RDX. As a result, the Utah Department of Environmental Quality requested the quarterly testing of private wells in Mapleton for nitrate levels in 1989. The State of Utah and Ensign-Bickford Industries, Inc. signed a stipulation and Consent Agreement in 1991 that required Ensign-Bickford Industries, Inc. to continue quarterly sampling in conjunction with the Utah Division of Water Quality. In October of 1994, the Utah County Health Department requested assistance from the Bureau of Epidemiology, Utah Department of Health, in conducting an epidemiologic investigation of cancer rates in Mapleton (census tract 10301). In April 1995, a cancer cluster investigation of Mapleton was conducted using cancer data from 1978 to1993. The results of the 1995 investigation found prostate cancer, cancer of the soft tissue, and chronic lymphocytic leukemia to be statistically significantly elevated in at least one of the three periods evaluated as compared to Salt Lake County. In October 1997, a second investigation was conducted that included an additional two years of cancer data (1994 and 1995). The results of the 1997 investigation found cancer from all the sites combined, prostate cancer, cancer of the soft tissue, and chronic lymphocytic leukemia to be statistically significantly elevated in at least one of the five periods evaluated as compared to Salt Lake County. The 1995 and 1997 investigations could not establish any etiologic carcinogenic association to chronic nitrate or RDX exposure based on the cancers that were significantly elevated (UDOH 1997). The Office of Epidemiology (formerly called the Bureau of Epidemiology), Environmental Epidemiology Program began this investigation of cancer incidence in Mapleton, with an additional six years of data (1996 - 2001). This allowed this investigation to examine 24 years of cancer data (1978 - 2001) in Mapleton (census tract 10301), as a follow-up to the two previous
3

An Investigation of Cancer Incidence In Mapleton, Utah, 1978-2001 January 28, 2004
cancer cluster investigations. The purpose of this investigation is to determine if cancer cases are occurring at a significantly greater rate in Mapleton (census tract 10301) as compared to the state of Utah from 1978 - 2001. A map showing the location of the study area in relation to the surrounding area and Ensign-Bickford properties is presented in Appendix A. METHODS
Cancer Data Data for this investigation were obtained directly from the Utah Cancer Registry. The Utah Cancer Registry receives reports on each newly diagnosed case of cancer in Utah from hospitals, radiation therapy facilities, pathology laboratories, nursing homes, and physicians. Each newly diagnosed case is assigned to the census tract of residence at the time of diagnosis. Data from the Utah Cancer Registry were separated by cancer site/type, gender, age group, and the year of diagnosis for the residents of Mapleton (census tract 10301) and the state of Utah (minus the reported cases in census tract 10301). Cases were grouped by year into periods. The following periods were used: 1978 - 1981 (four years), 1982 - 1986 (five years), 1987 - 1991 (five years), 1992 - 1996 (five years), 1997 - 2001 (five years), and 1978 - 2001 (24 years). The year 2001 was the most recent year for which a complete dataset was available.
Census Data The population demographics for Mapleton (census tract 10301) and the state of Utah were obtained from the 1970, 1980, 1990, and 2000 U.S. Census Data, provided electronically by Geolytics CensusCD products. The intercensal populations were estimated linearly based on the 1970, 1980, 1990, and 2000 populations. The population estimates were based on the assumption of a constant rate of growth. A table of population estimates used in this report is presented in Appendix B.
Geographic Data Census tract 10301 was selected for this study based on the correspondence of the tract boundary to the city boundary of Mapleton. The census tract for Mapleton 10301 has remained almost constant throughout the study period (see Map in Appendix A).
Comparison Population A comparison population to the study population was selected in order to evaluate whether the observed number of cases in the study population was statistically significantly different from the number of expected cases if the members had not been at any special risk. The state of Utah (minus census tract 10301) was used as the comparison population for this investigation. In the
4

An Investigation of Cancer Incidence In Mapleton, Utah, 1978-2001 January 28, 2004
previous two investigations, Salt Lake County was used as the comparison population. From this point after census tract 10301 will be referred to as Mapleton and the state of Utah will be referred to as Utah, unless otherwise specified.
Statistical Analysis A Standardized Morbidity Ratio (SMR) was calculated for each period and used to determine if there is a greater risk or a lower risk of acquiring a disease or condition compared to a comparison population. The SMR is calculated by dividing the crude observed count by the expected count (Aldrich and Griffith, 1993). The expected count was calculated by multiplying the age-specific comparison rate (Utah) by the age-specific population of the study group (Mapleton) and summing the results. The ratio of observed to expected is then used to determine if there is a greater risk or a lower risk of acquiring a disease or condition compared to a comparison population. A SMR of one (1.0) indicates rates are equal and there is no increased risk. A SMR greater than one (1.0) indicates an increased risk for the study group, while a SMR less than one (1.0) indicates a decreased risk for the study group. A more detailed description of the standardization of the data is presented in Appendix C. The confidence interval for the SMR is the range within which the true SMR value has a specified probability of being included. The specified probability is called the confidence level, and the endpoints of the confidence interval are called the confidence limits. For this investigation, a specified probability of 95 percent was applied. The confidence limits were calculated using the method of Frumkin and Kantrowitz (Frumkin and Kantrowitz, 1987). By assessing the confidence interval, information about the variability of the data and the statistical significance of the SMR was obtained. The differences between the observed versus the expected were considered significant if the confidence interval does not include one (1.0). The SMRs and associated confidence intervals were calculated using a Microsoft Excel 2002 spreadsheet. The statistical formula for the SMR confidence interval (95 percent) is presented in Appendix C.
Literature Search A literature search was conducted relative to the association between the identified cancers of concern in this investigation and nitrate and RDX. This investigation employed the National Library of Medicine’s Medical Literature Analysis and Retrieval System. The computer files of the National Library of Medicine consist of more than 30 biomedical databases. Medline contains more than 20 years of bibliographic data from more than 3,600 major medical journals. Search analysis was conducted covering the years 1966 through 2003.
5

An Investigation of Cancer Incidence In Mapleton, Utah, 1978-2001 January 28, 2004
CANCERS OF CONCERN The Agency for Toxic Substances and Disease Registry recommends against performing statistical analysis whenever there are fewer than three cases of the same type of cancer in a population (ATSDR, 1993). The cancer types with fewer than three cases in all periods evaluated were excluded. This investigation evaluated all the cancers reported to the cancer registry from 1978 - 2001 that occurred in Mapleton. The following are the cancers that occurred three or more times in at least one of the periods evaluated by this investigation or have a potential association to the contaminants of concern (chronic nitrate or RDX exposure).
Cancer from all sites Oral Cavity & Pharynx Stomach Colon Rectum & Rectosigmoid Jct Bladder Liver Prostate Female Breast Lung & Bronchus Soft Tissue Brain Non-Hodgkin’s lymphoma & Chronic Lymphocytic Leukemia
RESULTS This investigation found only one cancer (soft tissue) that was significantly elevated in only one of the periods (1997 - 2001) evaluated and cumulatively from 1978-2001. This investigation also found several other cancer types that were significantly lower than expected in multiple periods. Tables of the SMRs (with confidence intervals) for the significantly elevated cancer and cancers relevant to the contaminants of interest, for Mapleton are presented in Appendix D.
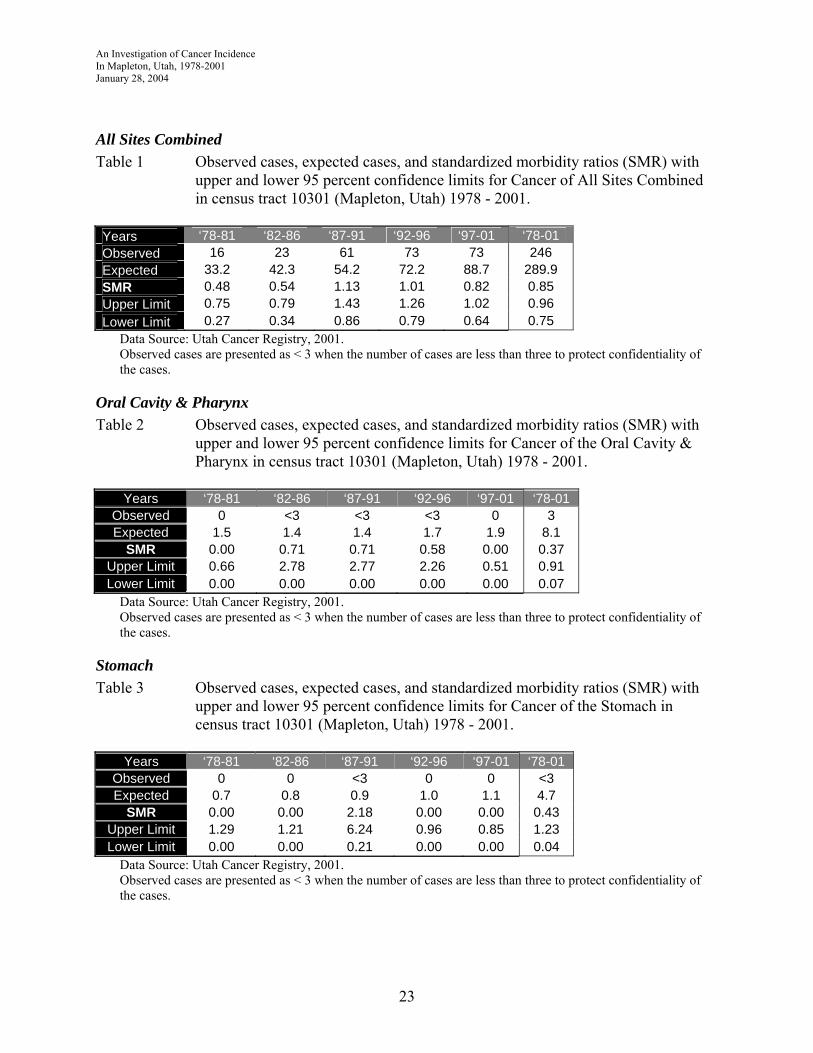
Cancer of all the Sites When looking at cancer from all the sites combined, both the observed number of cases and the expected number of cases increased steadily throughout the periods evaluated. From 1978 -1991 the SMRs increased from 0.48 to 1.13, then decreased to 0.82 in the final period. Cumulatively from 1978 - 2001, the rate was significantly lower than expected for cancers of all sites combined. No statistically significant increases of cancer of all the sites were found during any of the periods evaluated (Table 1).
Oral Cavity & Pharynx There were only three cases of cancer of the oral cavity and pharynx reported from 1978 - 2001. The SMR values were less than one in each of the periods evaluated (Table 2).
6

An Investigation of Cancer Incidence In Mapleton, Utah, 1978-2001 January 28, 2004
Stomach Cancer All study periods were lower than expected except one. During the period of 1987 - 1991, the number of observed stomach cancer cases was nearly 2.2 times greater than what was expected (SMR 2.18). However, this increased SMR for this period was not statistically significant (Table 3). This suggests it could have been a random occurrence.
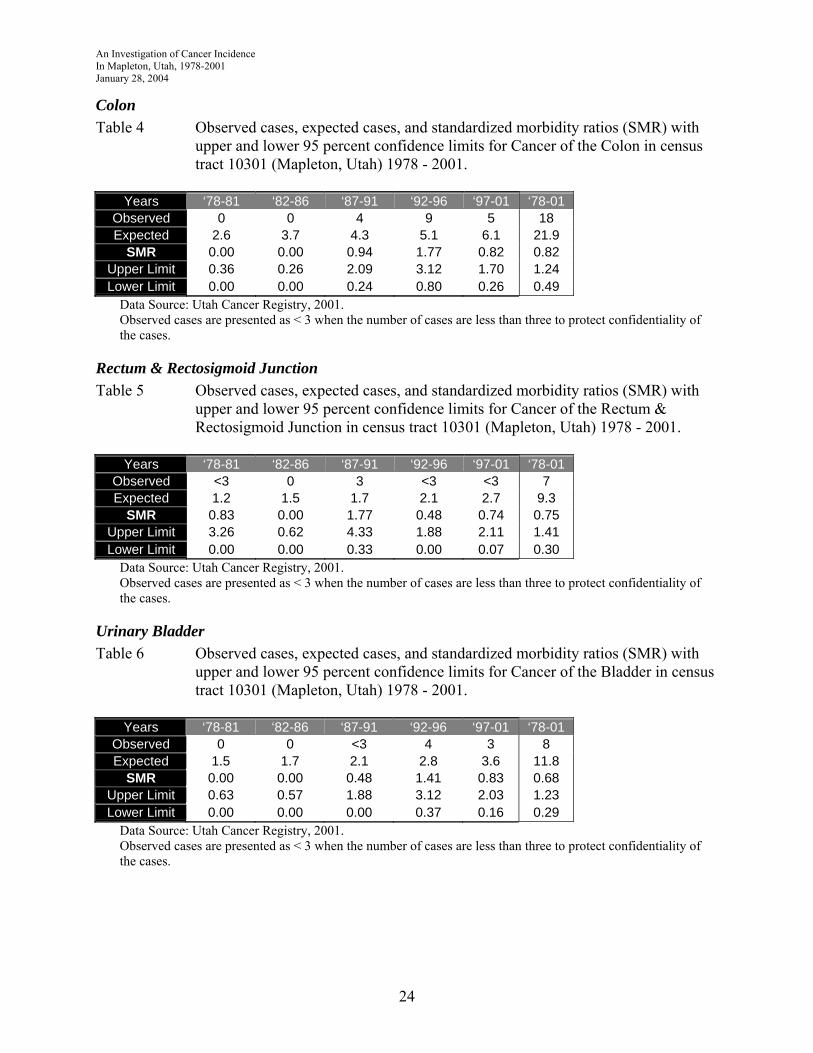
Colon Cancer There were no periods that demonstrated significant increases, including the cumulative period of 1978 - 2001. The only SMR (1.77) that was greater than one was observed in the period of 1992 - 1996. The cumulative (1978 - 2001) SMR was 0.82 (Table 4).
Rectum and Rectosigmoid Junction Cancer Only one period (1987 - 1992) was identified where the observed number of rectum and rectosigmoid junction cancer cases slightly exceeded the expected number of cases. This period demonstrated a SMR of 1.77, but was not significantly elevated (Table 5).
Urinary Bladder Cancer The observed number of bladder cancer cases exceeded the expected number in only one period (1992 - 1996) with an SMR value of 1.41. No significant increases were found (Table 6).
Liver Cancer There were no cases of liver cancer reported to the Utah Cancer Registry from 1978 - 2001 in Mapleton.
Prostate Cancer The number of prostate cases and the number of expected cases has increased steadily from 1978 - 2001. From 1987 to 2001, the number of observed cases of prostate cancer exceeded the expected number of cases. The highest SMRs (1.48) were observed from 1987 - 1996. No statistically significant increases were found during any of the periods evaluated (Table 7).
7

An Investigation of Cancer Incidence In Mapleton, Utah, 1978-2001 January 28, 2004
Female Breast Cancer In the periods from 1978 - 1986 and 1997 - 2001, female breast cancer cases were lower than the expected number of cases. During the periods from 1987 through 1996, the observed number of cases slightly exceeded the expected number. Cumulatively, from 1978 - 2001, the number of female breast cancers did not exceed the expected number of cases. The highest SMR (1.19) was observed during the period of 1987 - 1991. The cumulative (1978 - 2001) SMR was 0.85 (Table 8). There were no periods that demonstrated a significant increase in female breast cancer.
Lung and Bronchial Cancer There were no periods that demonstrated significant increases, including the cumulative period of 1978 - 2001 nor was the number of lung and bronchial cancers increasing in Mapleton. The highest SMR (0.91) was observed during the period of 1987 - 1991. The cumulative (1978 - 2001) SMR was 0.31 (Table 9).
Soft Tissue Cancer Cancer of the soft tissue was significantly elevated in two of the periods evaluated (1997 - 2001 and 1978 - 2001). The period 1997 - 2001 demonstrated a SMR of 4.95 (CI 1.29, 10.98) and the cumulative period 1978 - 2001 demonstrated a SMR of 3.13 (CI 1.24, 5.88). The number of observed cases was four times the number of what would be expected during the period of 1997 - 2001 (Table 10). However, this investigation did not identify a trend that suggested that cancer of the soft tissue was increasing over time in Mapleton.
Brain Cancer Cancer of the brain was very slightly elevated (SMRs greater than one) in three periods (1982 - 1986, 1992 - 1996, and 1997 - 2001) and cumulatively from 1978 - 2001. Only one period (1992 - 1996) demonstrated a SMR (2.26) or level of risk that reached two-fold. None of these periods demonstrated a significant increase in the observed number of cases (Table 11).
Non-Hodgkin’s lymphoma and Chronic Lymphocytic Leukemia The cases for Non-Hodgkin’s lymphoma and Chronic Lymphocytic Leukemia were combined. Despite being classified separately by the International Classifications of Diseases, Chronic Lymphocytic Leukemia is now considered a Non-Hodgkin’s lymphoma (Adami 2002). From 1978 through 1991, the observed cases increased and exceeded the expected number of cases. The expected number of cases increased slightly in each period from 1978 - 2001. Except for the period from 1992 - 1996, the SMR values were greater than one in all the periods and cumulatively from 1978 - 2001. However, they were not significantly elevated (Table 12).
8

An Investigation of Cancer Incidence In Mapleton, Utah, 1978-2001 January 28, 2004
DISCUSSION The two previous investigations conducted by the Environmental Epidemiology Program in 1995 and 1997 applied Salt Lake County as the comparison population. This investigation applied Utah (minus the population in census tract 10301) as the comparison population in efforts to determine if the incidence of cancer was occurring at a greater rate in Mapleton as compared to the rest of Utah. The results of the 1995 investigation evaluated cancer cases from 1978 - 1993. That investigation found prostate cancer, cancer of the soft tissue, and chronic lymphocytic leukemia to be statistically significantly elevated in at least one of the time periods evaluated. The results of the 1997 evaluated cancer cases from 1978 - 1995. That investigation also identified prostate cancer, cancer of the soft tissue, and chronic lymphocytic leukemia as significantly elevated in at least one period. In addition, that investigation also identified significant increases in cancer for all the sites combined. Chronic lymphocytic leukemia and cancer of the soft tissue were statistically significantly greater than expected in only one period (1988-1992), and both were considered statistical artifacts. Neither the 1995 nor the 1997 investigations could find any evidence that cancers that were significantly elevated were potentially related to chronic nitrate or RDX exposure. This investigation (1978 - 2001) found only cancer of the soft tissue to be significantly elevated (in two of the periods evaluated). Chronic lymphocytic leukemia was combined with Non-Hodgkin’s Lymphoma and, although elevated in some periods, it did not demonstrate a statistically significant increase. Prostate cancer also was not found to be significantly elevated in Mapleton. The SMRs for cancer of all the sites combined increased from 1978 through 1991 from 0.48 to 1.13 then decreased to 0.82 in the final period of 1997-2001 (see Table 1). Historically, cancer rates tend to fluctuate annually, but generally remain fairly stable over time. The differences with this investigation and the two previous investigations could be attributed to the difference in the grouping of the data, using a different comparison population, and different statistical methods. Another possible explanation of the differences found may be from quality assurance efforts and the re-examination of the dataset by the Utah Cancer Registry. This would result in an increased accuracy of case assignment to corresponding census tracts and a subsequently modified dataset, thus yielding greater confidence in the study results. Increases in soft tissue cancer rates were observed in Mapleton during two periods, 1997 - 2001 and during the cumulative period of 1978 - 2001. Zero (0) cases were observed during the period of 1978 - 1982 and less than three+ cases per period were observed during the next three periods (Table 10). Soft tissue cancer is a general category that includes cancer occurring in muscle, heart, subcutaneous tissue, and other related tissues. Because this category includes a number of different types of cancer, it is difficult to define the etiology that is associated with all cancers of
+ When the observed number of cases occur less than three times in any of the time periods evaluated the cases are presented as less than three to protect the confidentiality of the cases.
9
An Investigation of Cancer Incidence In Mapleton, Utah, 1978-2001 January 28, 2004
the soft tissue. It is important to mention that not all risk factors have been established. What has been established is that they occur more frequently in children and young adults (Berkow, 1992). CANCER RISK FACTORS Cancer is a name applied to many diseases with many different causes. Cancers are very common. Nearly half of all men and one-third of all women in the U.S. population will develop cancer at some point in their lives and 22 percent of the population will eventually die of cancer (ACS, 1998). Statistically, it is normal for cancer rates to fluctuate in smaller communities. Some years the rates are higher, other years lower, eventually the rates tend to balance out over time. Characterizing types of cancers, cancer rates and determining causal relationships to environmental exposures without exposure measurements or data is difficult because people live and work in many environments, and are exposed to complex mixtures of toxic pollutants at home, at work, and in the ambient environment. In addition, only a relatively small percentage of cancers can be attributed to environmental factors. A breakdown of the proportion of cancer deaths, attributed to various behavioral and environmental factors, is listed in the following table (Klaassen, 1996): Behavioral & Environmental Factors Percentage Attributed to Cancer Mortality Diet 35% Tobacco 30% Infections 10% Reproductive and sexual behavior 7% Occupation 4% Alcohol 3% Geophysical 3% Pollution 2% Medicine and medical procedures 1% Industrial products <1% Food additives <1% Unknown ?% From the percentages noted above, it can be concluded that of the total cancer mortality attributed to environmental factors, pollution and geophysical factors account for only five percent of the cancer mortality, whereas personal behavior/lifestyle accounts for approximately 75 percent of the cancer mortality The following are risk factors involved in the etiology of the cancers that occurred three or more times in Mapleton from 1978 - 2001.
10
An Investigation of Cancer Incidence In Mapleton, Utah, 1978-2001 January 28, 2004
Cancer of the Oral Cavity/Pharynx Cancer of the oral cavity includes the tongue, gums, salivary glands, floor and other parts of the mouth and the pharynx. Not all of these sites share common etiologies but are simply grouped together for convenience. The most common risk factor associated with the etiology of oral cancer appears to be the use of tobacco (i.e., cigarettes, smokeless tobacco, pipe smokers) and the abuse of alcohol consumption (UCR, 1996). Men develop oral cancer more often than women do. Other risk factors associated with the etiology of oral cancer include diet, precancerous lesions, poor oral hygiene, mouthwash, viruses (human papillomavirus and Epstein-Barr), asbestos, textile (occupation), indoor air pollution (wood stoves), and familial history (Shottenfeld and Fraumeni, 1996). The incidence rate of cancer of the oral cavity is lower in Utah when compared to national rates (UCR, 1996).
Stomach Cancer Stomach cancer is the seventh leading cause of death in the United States. In the past 50 years, the incidence and mortality rates have fallen steadily and the trend is continuing. This decline is believed to be due primarily to improved nutrition. The Utah rates have been consistently lower than the national rates. The incidence of stomach cancer is observed more frequently as age increases. Environmental risk factors associated with stomach cancer include smoking, alcohol abuse, ionizing radiation, nitrate and related compounds (Shottenfeld and Fraumeni, 1996), and coal mining (Ames, 1983 and Ong et al, 1983). Tobacco/smoking is the most important risk factor(s) that has been strongly associated in the etiology of stomach cancer due to the high levels of nitrosamines in cigarettes (Risch et al, 1985, Hu et al, 1988, Forman, 1987, and Hecht and Hoffmann, 1991).
Colorectal Cancer The most important environmental risk factors involved in the etiology of colorectal cancer are genetics (familial history), polyps in the colon, ulcerative colitis, a history of inflammatory bowel disease, and a diet high in fat and low in fiber (ACS, 1991). Rates are consistently higher in males than in females, for unknown reasons. Currently more than three percent of Utahns will be affected in their lifetime (UCR, 1996).
Urinary Bladder Cancer Cigarette smoking is the most important risk factor for urinary bladder cancer. It is possible that an increased consumption of meat will increase the risk of urinary bladder cancer. Other dietary risks may include coffee and tea, as well as the use of Saccharin. Urinary tract infections have
11

An Investigation of Cancer Incidence In Mapleton, Utah, 1978-2001 January 28, 2004
also been reported to increase risk. Exposure to ionizing radiation increases risk. Certain high-risk occupations are the second most important risk factor for urinary bladder cancer and may be responsible for four to 10 percent of cases. Specifically, exposure to aromatic amines and polyaromatic hydrocarbons consistently increase risk. Urinary tract stones and cancer of the renal pelvis are two medical conditions that may increase risk. Certain medications such as analgesics and Cyclophosphamide, used in the treatment of non-Hodgkin’s lymphoma and other diseases, can increase risk. Chlorination by-products and high arsenic contamination of drinking water may increase the risk of urinary bladder cancer (Adami 2002).
Liver Cancer The greatest risk factor for developing cancer of the liver is a persistent infection with Hepatitis B or C Virus. This accounts for over three quarters of the world’s cases. The remaining minority of cases are caused by exposures that damage the liver, such as excessive alcohol consumption, and exposures that may be directly genotoxic, such as dietary aflatoxin (primarily produced by two Aspergillus species of mold) and tobacco use. Exposure to diagnostic thorium dioxide has been strongly associated with an increased risk of liver cancer. Occupational exposure to inorganic arsenic, vinyl chloride, and the organic solvent trichloroethylene are also risk factors. There is a positive association of liver cancer with diabetes mellitus (Adami 2002).
Prostate Cancer Age is most likely the most significant risk factor in the development of prostate cancer. This form of cancer is frequent among older men and its occurrence increases with age. The highest rates in prostate cancer have been recorded among the black population in the U.S. Only in Utah do rates for this largely white population exceed those for a U.S. black population; reasons are unknown (Shottenfeld and Fraumeni, 1996). Prostate cancer is the most common cancer in Utah males. Currently nearly six percent will develop prostate cancer in their lifetimes. Other than age and race, the definitive etiology of prostate cancer remains elusive (UCR, 1996).
Female Breast Cancer Female breast cancer is the most common site of cancer among females (incidence and death) in the state of Utah. Currently more than 10 percent of Utah females will be affected in their lifetime (UCR, 1996). The most important demographic risk factor for female breast cancer is age. Hormones are also a factor in the female breast cancer etiology. Epidemiologic and experimental evidence suggests that estrogen makes an essential contribution to the development of breast cancer. Early age at menarche, familial history, and age at first pregnancy have also been demonstrated as risk factors for breast cancer (Shottenfeld and Fraumeni, 1996).
12

An Investigation of Cancer Incidence In Mapleton, Utah, 1978-2001 January 28, 2004
Cancer of the Lung and Bronchus Smoking is by far the leading risk factor of lung cancer. Passive smoking is also a risk factor. Exposure to radon and asbestos are factors leading to lung cancer, however, smoking in addition to these exposures greatly increases the risk of developing cancer. Cancers of the lung are elevated after radiotherapy for Hodgkin’s disease. Excess lung cancers of all types have been reported from military exposures to atomic and thermonuclear weapons. Smoking and radiation exposure also appear to have an additive effect on lung cancer. Occupational lung cancer may result from exposure to inorganic arsenic compounds (insecticides, pesticides, smelter workers, tin miners). The risk of lung cancer, mesothelioma, and asbestosis is increased in various asbestos industries, including mining, mills, textile, gas mask, friction product, insulation, shipyard, and cement workers. A high risk of lung cancer was reported in workers exposed to bis(chloromethyl)ether . Risk appears to decrease following cessation of exposure, suggesting that the chemical may affect late as well as early stages of carcinogenesis (Schottenfeld and Fraumeni, 1996). An excess of lung cancer has been reported among persons with high dietary intake of foods rich in fat and cholesterol.
Cancer of the Soft Tissue Soft tissue cancer is a general category that includes cancer occurring in muscle, heart, subcutaneous tissue and other related tissues. Because this category includes a number of different types of cancer, it is difficult to define the etiology that is associated with all cancers of the soft tissue. It is important to mention that not all risk factors have been established. What has been established is that they occur more frequently in children and young adults (Berkow, 1992). Workers that were exposed to phenoxyacetic acid in herbicides and chlorophenols in wood preservatives as well as workers exposed to vinyl chloride may have an increased risk. High doses of radiation caused soft tissue sarcomas in some patients. Patients with AIDS (acquired immune deficiency syndrome) often develop Kaposi’s sarcoma, which has different characteristics and is treated differently than typical soft tissue cancer. Certain inherited diseases such as Li-Fraumeni syndrome and von Recklinghausens’s disease are associated with an increased risk (NCI 2002).
Brain Cancer In the United States, 17,000 new primary cancers of the nervous system are diagnosed each year. These are among the most (rapidly) fatal of all cancers and only about half (52 percent) of patients are still alive one year after diagnosis. Brain cancer is the tenth most common type of death from cancer. The etiology of the majority of nervous system tumors remains unknown. Environmental agents, such as ionizing radiation, have been clearly implicated in the etiology of brain tumors. Other physical, chemical, and infectious agents suspected of being risk factors have not yet been established as etiologically relevant. Factors associated/suspected in the
13

An Investigation of Cancer Incidence In Mapleton, Utah, 1978-2001 January 28, 2004
etiology of childhood and adult brain cancer include n-nitroso compounds, exposure to low frequency electromagnetic fields, pesticides, insecticides, radiation exposure, infections, alcohol consumption, lead, hair dye and spray, barbiturates, chemotherapy (in utero), medications, familial history, and race (Shottenfeld and Fraumeni, 1996).
Non-Hodgkin’s Lymphoma The cause of most of the cases of non-Hodgkin’s lymphoma (NHL) remains unknown. The incidence rate of NHL is higher among males than females. There is also some evidence that a major proportion of the cases have a strong genetic basis. Individuals at increased risk of the NHL include those with primary immunodeficiency diseases, acquired immunodeficiency diseases and patients who are immunosuppressed subsequent to transplantation. Increased risk for NHL has been observed for patients with testicular cancer and Hodgkin’s disease. In general, occupations of somewhat higher social class are associated with a higher risk of the disease. Although the data are not entirely consistent, occupations dealing with chemicals and agriculture appear to be associated with NHL in studies of incident cases. Other industries with reported increased risks of NHL are woodworkers, meat workers, and metalworkers (Schottenfeld and Fraumeni, 1996).
Lymphocytic Leukemia Chronic lymphocytic leukemia is a disease of later life, predominantly in the elderly. It is more common in males than females, for unknown reasons. The etiology of chronic lymphocytic leukemia is almost entirely unknown (UCR, 1996). This disorder has not been convincingly linked to any myletoxin agent and sufficient data rule out an association with ionizing radiation. This condition does have a reported association with butadiene, ethylene oxide, non-ionizing radiation, herbicides, asbestos, and solvents (Kipen, 1994). Risk factors such as radiation and chemical exposures commonly linked to other types of leukemia have not been shown to increase the risk of chronic lymphocytic leukemia (UCR, 1996). CONTAMINANTS Nitrates (NO3-) and Nitrites (NO2-) are natural components or inorganic ions that make up part of the nitrogen cycle. There has been no evidence associating nitrate exposure in drinking water with the development of cancer in humans or animals (Preussmann and Tricker, 1988; Forman, 1989). The Environmental Protection Agency has indicated that the information currently available is inconclusive and insufficient in determining whether nitrate causes cancer in humans. However, nitrates are converted to nitrites by bacteria in the gastrointestinal tract. Nitrites can react with secondary amines in acidic environments, such as the stomach, to form carcinogenic nitrosamines (Klaassen, 1996). There is an association of cancers with dietary exposure to n-nitroso compounds. In adults, these cancers include cancers of the stomach, esophagus, nasopharynx, and urinary bladder (Forman, 1987). A reported increase in brain tumors has been observed in children exposed to n-nitroso compounds (Forman, 1987). The
14

An Investigation of Cancer Incidence In Mapleton, Utah, 1978-2001 January 28, 2004
cancers that are mentioned were either not statically significant or did not occur three times during the study period from 1978 through 2001. One epidemiological study, performed in Nebraska, implicated high nitrate ingestion in the etiology of NHL (Wiesenberger, 1990). However, no conclusive evidence was found. The increases in NHL discussed in the Nebraska study are believed to be associated with the high commercial use of fertilizer and other agricultural activities (Wiesenberger, 1990). No other evidence was found associating nitrates or n-nitroso compounds to NHL. The Environmental Protection Agency has set a guidance level for nitrates in public drinking water at 10 mg/L. This level includes a margin of safety to protect human health and should be regarded as a guideline. Water containing nitrate or nitrites at or below this level is acceptable for drinking every day over a course of one's lifetime, and does not pose health concerns (USEPA, 1987). The nitrate levels in the public water supply in Mapleton have remained below 10 mg/L since 1977 (UDOH 1997). Although the Utah Division of Water Quality is not required to test private wells, it estimates that the average nitrate levels for private drinking wells in Mapleton are at approximately 10 mg/L and steadily decreasing in nitrate contamination. When the Utah Division of Water Quality began the testing of private wells it found that the closer the private wells were located to Ensign-Bickford Industries, Inc. the higher the contamination of nitrates (>10mg/L) and RDX. Wells continue to be tested per the Consent Agreement signed in 1991 and as of 1999, and active remediation of the ground water has been ongoing. No private water users are consuming well water for culinary purposes. All constituents are in the process of removal. Nitrate across the area is now below the drinking water MCL of 10 mg/L. RDX was also researched as a potential carcinogenic source in Mapleton. The chemical name for RDX is 1,3,5-trinitro-1,3,5-triazine. It is a white powder used as an explosive and used with other chemical ingredients in explosives. RDX was a product produced by Ensign-Bickford Industries, Inc. located in Spanish Fork, just south of Mapleton. In Mapleton, Ensign-Bickford Industries, Inc. (per 1991 Consent Agreement) has found elevated levels of RDX in the private drinking wells located within three miles (approximately) of Ensign-Bickford Industries, Inc., as reported to the Division of Water Quality. The Utah Division of Water Quality estimates the average level of RDX contamination for private wells (within three miles of Ensign-Bickford Industries, Inc.) at approximately 22 - 24 μg/L. RDX contamination levels have decreased over time through natural reduction/degradation. The public drinking wells in Mapleton have all tested negative for RDX contamination with the exception of Mapleton Well #1. There are no residents who are consuming water from this well. Mapleton Well #1 is currently under remediation. The Environmental Protection Agency's Health Advisory for RDX has set drinking water guidelines of lifetime value of 2 μg/L and 100 μg/L for up to seven years. The Environmental Protection Agency classifies RDX as a possible human carcinogen. However, the most recent studies indicate that there are no human data that associates RDX as a carcinogen for any of the cancers identified in this study. In animals, mice that were fed RDX for a period of three months
15

An Investigation of Cancer Incidence In Mapleton, Utah, 1978-2001 January 28, 2004
developed liver tumors (ATSDR, 1995). There were no cases of liver cancer in Mapleton that were reported to the Utah Cancer Registry from 1978 - 2001. LIMITATIONS OF INVESTIGATION Factors that must be considered in the development and etiology of most cancers, but could not be evaluated in this investigation, include latency period, population migration, personal habits, diet, and familial history. The latency, or induction period, for most adult cancers ranges from 10 to 30 years after initial exposure to a carcinogen. Therefore, ascertaining the place and time of exposure to a carcinogen is difficult. Migration of people into and out of an area of concern presents a problematic issue relative to exposure and latency. Humans live and work in many environments and are exposed to complex mixtures of toxic pollutants at home and at work. Information was not available for individual occupational exposures. Lifestyle factors such as smoking and alcohol consumption were not examined by this investigation. Factors such as latency or induction period, population migration, personal habits, race, diet, and familial history make drawing a conclusion problematic. In most cancer cluster investigations no exposure or potential cause is ever apparent or established (MMWR, 1990). CONCLUSION This investigation found only one cancer that was significantly elevated in Mapleton, Utah. Cancer of the soft tissue appears to be occurring at a greater frequency in Mapleton as compared to the state of Utah. This investigation could not establish any etiologic carcinogenic association with cancer of the soft tissue and chronic nitrate or RDX exposure. In addition, this investigation could not determine the cause for the significant increase in cancer of the soft tissue in Mapleton. Because cancer of the soft tissue is occurring at a greater frequency in Mapleton as compared to the rest of the state of Utah, it is recommended that soft tissue cancer rates be examined again when five additional years of cancer data have been compiled.
16

An Investigation of Cancer Incidence In Mapleton, Utah, 1978-2001 January 28, 2004
REFERENCES ACS, American Cancer Society (1991). Facts on Colorectal Cancer. ACS, American Cancer Society (1998). “What is Cancer.” http://www.cancer.org Adami H, Hunter D, Trichopoulos D. Textbook of Cancer Epidemiology. Oxford and New York,
Oxford University Press, 2002, pp. 535, 557 Aldrich, T. E. and Griffith, J. (1993). Environmental Epidemiology and Risk Assessment. Van
Nostrand Reinhold, New York, New York. Ames R. G., (1983). Gastric Cancer and Coal Mine Dust Exposures: A Case Control Study.
Cancer, 52:1346-1350. ATSDR, Agency for Toxic Substances and Disease Registry (1993). Cluster 3:1 Software
System for Epidemiologic Analysis. U.S. Department of Health & Human Services, Atlanta, Georgia.
ATSDR, Agency for Toxic Substance and Disease Registry (1995). Toxicological Profile for
RDX. U.S. Department of Health & Human Services. Berkow, R. and Fletcher, A.J. (eds) (1992). The Merck Manual, Sixteenth Edition. Merck
Research Laboratories, Merck & Company, Inc., New Jersey. Forman, D. (1987). Dietary Exposure to N-Nitroso Compounds and the Risk of Human Cancer.
Cancer Surveys, 6:719-738, 1987. Forman, D. (1989). Are Nitrates a Significant Risk Factor in Human Cancer? Cancer Surveys.
8:443-458. Frumkin, H., Kantrowitz, W. (1987) Cancer Clusters in the Workplace: An Approach to
Investigation. Journal of Occupational Medicine, Vol. 29 (No. 12):949-952. Kahn, H.A. and Sempos, C.T. (1989). Statistical Methods in Epidemiology. Oxford University
Press, Inc. New York, NY. Pp. 85-116. Kipen, H., and Wartenberg, D. (1994). Lymphohematopoietic Malignancies. Textbook of Clinical
Occupational and Environmental Medicine, 21:555-564. Klaassen, C.D. (1996). Casarett and Doull’s Toxicology: The Basic Science of Poisons, Fifth
Edition. The McGraw-Hill Companies, Inc. New York, 8:201-260. Hecht, S. S., and Hoffmann, D. (1991). N-nitroso Compounds and Tobacco-Induced Cancer in
Man. International Agency for Research on Cancer, Science Publication No. 105:54-61.
17

An Investigation oIn MaJanuar
f Cancer Incidence pleton, Utah, 1978-2001 y 28, 2004
18
Hu J, Zhang S, Jia, E., et al, (1988). Diet and Cancer of the Stomach: A Case Control Study in
China. International Journal of Cancer, 41:331-335. MMWR, Morbidity and Mortality Weekly Report (1990). Guidelines for Investigating Clusters
of Health Events. U.S. Department of Health and Human Services, Vol.39/No. RR-11 NCI, National Cancer Institute (2002). Cancer Facts - Soft Tissue Sarcomas: Questions and
Answers. http://cis.nci.nih.gov/fact/6_12.htm Ong, T. M., Whong, W. Z., and Ames, R. G. (1983). Gastric Cancer in Coal Miners: A
Hypothesis of Coal Mine Dust Causation. Medical Hypothesis, 12:159-165. Preussmann, R., and Tricker, A.R. (1988). Endogenous Nitrosamine Formation and Nitrate
Burden in Relationship to Gastric Cancer Epidemiology. In: Reed Pl. Hill MJ (eds) Gastric Carcinogenesis, Excerpts Medica, Amsterdam, 147-162.
Risch, H. A., Jain, M., Won Choi, N., et al. (1985) Dietary Factors and Incidence of Cancer of
the Stomach. American Journal of Public Health, 122:947-959. Rothman, K.J. (2002) Epidemiology: An Introduction, Oxford University Press, New York, NY Schottenfeld, D. and Fraumeni, J.F. (1996). Cancer Epidemiology and Prevention Second
Edition. New York: Oxford University Press, 10:157. UCR, Utah Cancer Registry (1996). Cancers in Utah. Salt Lake City, UT. UDOH, Utah Department of Health (1997). An Investigation of Cancer Incidence Rates In
Mapleton, Utah, 1978 - 1995. USEPA, United States Environmental Protection Agency (1987). Environmental Protection
Agency's Health Advisory Summary: Nitrate/Nitrite. Weisenburger, D.D. (1990). Environmental Epidemiology of Non-Hodgkin's Lymphoma in
Eastern Nebraska. American Journal Independent Medical, 18: 303-306.

nvestigation of Cancer Incidence n Mapleton, Utah, 1978-2001
y 28, 2004
19
APPENDIX A – Map Mapleton Study Area (2000 Census Tract 10301)
An IIJanuar

An Investigation of Cancer Incidence In Mapleton, Utah, 1978-2001 January 28, 2004
APPENDIX B - Population Estimates
The intercensal population estimates for the community of Mapleton for the years 1970 through 2001. Based on linear estimation with 1970, 1980, 1990, and 2000 Mapleton (Census Tract - 10301) U.S. Census data provided by Geolytics CensusCD products.
Mapleton Population
Utah Population
Year Male Female Total Male Female Total 1970 993 887 1880 523107 536166 1059273 1971 1050 959 2008 543246 556203 1099449 1972 1106 1030 2136 563386 576240 1139626 1973 1163 1102 2264 583525 596277 1179802 1974 1219 1173 2392 603665 616314 1219979 1975 1276 1245 2521 623804 636351 1260155 1976 1333 1316 2649 643943 656388 1300331 1977 1389 1388 2777 664083 676425 1340508 1978 1446 1459 2905 684222 696462 1380684 1979 1502 1531 3033 704362 716499 1420861 1980 1559 1602 3161 724501 736536 1461037 1981 1591 1621 3212 737586 749632 1487218 1982 1624 1639 3263 750671 762728 1513400 1983 1656 1658 3314 763757 775824 1539581 1984 1689 1676 3365 776842 788920 1565762 1985 1721 1695 3416 789927 802017 1591944 1986 1753 1714 3467 803012 815113 1618125 1987 1786 1732 3518 816097 828209 1644306 1988 1818 1751 3569 829183 841305 1670487 1989 1851 1769 3620 842268 854401 1696669 1990 1883 1788 3671 855353 867497 1722850 1991 2022 1933 3955 881721 892161 1773882 1992 2162 2078 4240 908089 916825 1824914 1993 2301 2223 4524 934456 941489 1875946 1994 2441 2368 4809 960824 966153 1926978 1995 2580 2513 5093 987192 990818 1978010 1996 2719 2658 5377 1013560 1015482 2029041 1997 2859 2803 5662 1039928 1040146 2080073 1998 2998 2948 5946 1066295 1064810 2131105 1999 3138 3093 6231 1092663 1089474 2182137 2000 3277 3238 6515 1119031 1114138 2233169 2001 3416 3383 6799 1145399 1138802 2284201
20

An Investigation of Cancer Incidence In Mapleton, Utah, 1978-2001 January 28, 2004
APPENDIX C - Statistical Calculations Age-Adjustment Method (Standardized Morbidity Ratios) Standardized morbidity ratios (SMR) were calculated using a statistical method applicable to both the direct and indirect age-adjustment or standardization methods. This method uses the age distribution of each population group and the age-specific rates for the standard population (state of Utah) to calculate the expected number of cancer cases if the rates of disease were constant as in the standard population. The observed number of incidences is then compared (divided) with the expected number of incidences in the study population of Mapleton (census tract 10301) and a ratio is derived, referred to as the SMR. The formula for this ratio = Σpiania/Σpisnia Where: a = area chosen as the study area (Census Tract 10301)
s = area chosen as a reference standard (state of Utah) nia = number of individuals in ith class of study area (Census Tract 10301) nis = number of individuals in ith class of standard area (state of Utah) xia = number of cases in ith age class of area a (similarly for s) pia = xia/nia = incidence rate in ith age class of area a (similarly for s)
(Harold A. Kahn and Christopher T. Sempos, “Statistical Methods in Epidemiology”, Oxford University Press,
1989, pp 85-136.) The confidence interval for the SMR is the range of values for a calculated SMR with a specified probability (95 percent) of including the true SMR value:
( )[ ]
n 1.96 X 0.5x
±2
Where n is the Number of Observed.
x is the Number of Expected. (Frumkin, H., Kantrowitz, W. (1987) Cancer Clusters in the Workplace: An Approach to Investigation. Journal of
Occupational Medicine, Vol. 29 (No. 12):949-952.) The confidence interval is used as a surrogate test of statistical significance (p-value). Both the p-value function and the spread of the function can be determined from the confidence interval. The difference between the observed versus the expected is considered significant if the confidence interval for the SMR does not include one (1.0) and if the SMR is greater than one (1.0). (Rothman, K.J. (2002) Epidemiology: An Introduction, Oxford University Press, New York, NY)
21

An Investigation of Cancer Incidence In Mapleton, Utah, 1978-2001 January 28, 2004
APPENDIX D - Tables Presented are the number of observed cases, expected number of cases, the Standardized Morbidity Ratios, and 95 percent confidence intervals for cancer in Mapleton, census tract 10301, for each of the periods analyzed. The state of Utah was selected as the comparison population. Cancers presented are: Cancer of All Sites, Oral Cavity and Pharynx, Stomach, Colon, Rectum and Rectosigmoid Junction, Urinary Bladder, Prostate, Female Breast, Lung & Bronchus, Soft Tissue, Brain, and Non-Hodgkin’s lymphoma combined with Chronic Lymphocytic Leukemia. The criteria established for determining significance involved two statistical methods: 1. A Standardized Morbidity Ratio greater than one (1.0). 2. A 95 percent confidence interval with limits that do not include one. -Statistical significance in Tables is denoted by an asterisk (*). -SMR means a Standardized Morbidity Ratio.
22
An Investigation of Cancer Incidence In Mapleton, Utah, 1978-2001 January 28, 2004
All Sites Combined Table 1 Observed cases, expected cases, and standardized morbidity ratios (SMR) with
upper and lower 95 percent confidence limits for Cancer of All Sites Combined in census tract 10301 (Mapleton, Utah) 1978 - 2001.
Years ‘78-81 ‘82-86 ‘87-91 ‘92-96 ‘97-01 ‘78-01 Observed 16 23 61 73 73 246 Expected 33.2 42.3 54.2 72.2 88.7 289.9 SMR 0.48 0.54 1.13 1.01 0.82 0.85 Upper Limit 0.75 0.79 1.43 1.26 1.02 0.96 Lower Limit 0.27 0.34 0.86 0.79 0.64 0.75
Data Source: Utah Cancer Registry, 2001. Observed cases are presented as < 3 when the number of cases are less than three to protect confidentiality of the cases.
Oral Cavity & Pharynx Table 2 Observed cases, expected cases, and standardized morbidity ratios (SMR) with
upper and lower 95 percent confidence limits for Cancer of the Oral Cavity & Pharynx in census tract 10301 (Mapleton, Utah) 1978 - 2001.
Years ‘78-81 ‘82-86 ‘87-91 ‘92-96 ‘97-01 ‘78-01
Observed 0 <3 <3 <3 0 3 Expected 1.5 1.4 1.4 1.7 1.9 8.1
SMR 0.00 0.71 0.71 0.58 0.00 0.37 Upper Limit 0.66 2.78 2.77 2.26 0.51 0.91 Lower Limit 0.00 0.00 0.00 0.00 0.00 0.07
Data Source: Utah Cancer Registry, 2001. Observed cases are presented as < 3 when the number of cases are less than three to protect confidentiality of the cases.
Stomach Table 3 Observed cases, expected cases, and standardized morbidity ratios (SMR) with
upper and lower 95 percent confidence limits for Cancer of the Stomach in census tract 10301 (Mapleton, Utah) 1978 - 2001.
Years ‘78-81 ‘82-86 ‘87-91 ‘92-96 ‘97-01 ‘78-01
Observed 0 0 <3 0 0 <3 Expected 0.7 0.8 0.9 1.0 1.1 4.7
SMR 0.00 0.00 2.18 0.00 0.00 0.43 Upper Limit 1.29 1.21 6.24 0.96 0.85 1.23 Lower Limit 0.00 0.00 0.21 0.00 0.00 0.04
Data Source: Utah Cancer Registry, 2001. Observed cases are presented as < 3 when the number of cases are less than three to protect confidentiality of the cases.
23
An Investigation of Cancer Incidence In Mapleton, Utah, 1978-2001 January 28, 2004
Colon Table 4 Observed cases, expected cases, and standardized morbidity ratios (SMR) with
upper and lower 95 percent confidence limits for Cancer of the Colon in census tract 10301 (Mapleton, Utah) 1978 - 2001.
Years ‘78-81 ‘82-86 ‘87-91 ‘92-96 ‘97-01 ‘78-01
Observed 0 0 4 9 5 18 Expected 2.6 3.7 4.3 5.1 6.1 21.9
SMR 0.00 0.00 0.94 1.77 0.82 0.82 Upper Limit 0.36 0.26 2.09 3.12 1.70 1.24 Lower Limit 0.00 0.00 0.24 0.80 0.26 0.49
Data Source: Utah Cancer Registry, 2001. Observed cases are presented as < 3 when the number of cases are less than three to protect confidentiality of the cases.
Rectum & Rectosigmoid Junction Table 5 Observed cases, expected cases, and standardized morbidity ratios (SMR) with
upper and lower 95 percent confidence limits for Cancer of the Rectum & Rectosigmoid Junction in census tract 10301 (Mapleton, Utah) 1978 - 2001.
Years ‘78-81 ‘82-86 ‘87-91 ‘92-96 ‘97-01 ‘78-01
Observed <3 0 3 <3 <3 7 Expected 1.2 1.5 1.7 2.1 2.7 9.3
SMR 0.83 0.00 1.77 0.48 0.74 0.75 Upper Limit 3.26 0.62 4.33 1.88 2.11 1.41 Lower Limit 0.00 0.00 0.33 0.00 0.07 0.30
Data Source: Utah Cancer Registry, 2001. Observed cases are presented as < 3 when the number of cases are less than three to protect confidentiality of the cases.
Urinary Bladder Table 6 Observed cases, expected cases, and standardized morbidity ratios (SMR) with
upper and lower 95 percent confidence limits for Cancer of the Bladder in census tract 10301 (Mapleton, Utah) 1978 - 2001.
Years ‘78-81 ‘82-86 ‘87-91 ‘92-96 ‘97-01 ‘78-01
Observed 0 0 <3 4 3 8 Expected 1.5 1.7 2.1 2.8 3.6 11.8
SMR 0.00 0.00 0.48 1.41 0.83 0.68 Upper Limit 0.63 0.57 1.88 3.12 2.03 1.23 Lower Limit 0.00 0.00 0.00 0.37 0.16 0.29
Data Source: Utah Cancer Registry, 2001. Observed cases are presented as < 3 when the number of cases are less than three to protect confidentiality of the cases.
24

An Investigation of Cancer Incidence In Mapleton, Utah, 1978-2001 January 28, 2004
Prostate Table 7 Observed cases, expected cases, and standardized morbidity ratios (SMR) with
upper and lower 95 percent confidence limits for Cancer of the Prostate in census tract 10301 (Mapleton, Utah) 1978 - 2001.
Years ‘78-81 ‘82-86 ‘87-91 ‘92-96 ‘97-01 ‘78-01
Observed <3 6 15 23 20 66 Expected 4.5 6.4 10.2 15.6 17.3 52.8
SMR 0.44 0.94 1.48 1.48 1.16 1.25 Upper Limit 1.27 1.84 2.32 2.14 1.72 1.57 Lower Limit 0.04 0.34 0.82 0.94 0.70 0.97
Data Source: Utah Cancer Registry, 2001. Observed cases are presented as < 3 when the number of cases are less than three to protect confidentiality of the cases.
Female Breast Table 8 Observed cases, expected cases, and standardized morbidity ratios (SMR) with
upper and lower 95 percent confidence limits for Female Breast Cancer in census tract 10301 (Mapleton, Utah) 1978 - 2001.
Years ‘78-81 ‘82-86 ‘87-91 ‘92-96 ‘97-01 ‘78-01
Observed <3 <3 10 11 13 38 Expected 4.7 6.5 8.4 10.8 14.4 44.6
SMR 0.42 0.31 1.19 1.01 0.91 0.85 Upper Limit 1.21 0.89 2.04 1.70 1.46 1.15 Lower Limit 0.04 0.03 0.57 0.50 0.48 0.60
Data Source: Utah Cancer Registry, 2001. Observed cases are presented as < 3 when the number of cases are less than three to protect confidentiality of the cases.
Lung & Bronchus Table 9 Observed cases, expected cases, and standardized morbidity ratios (SMR) with
upper and lower 95 percent confidence limits for Cancer of the Lung & Bronchus in census tract 10301 (Mapleton, Utah) 1978 - 2001.
Years ‘78-81 ‘82-86 ‘87-91 ‘92-96 ‘97-01 ‘78-01
Observed 0 <3 4 <3 <3 8 Expected 2.8 3.8 4.4 5.7 6.5 23.4
SMR 0.00 0.26 0.91 0.18 0.31 0.34 Upper Limit 0.34 1.04 2.02 0.69 0.88 0.62 Lower Limit 0.00 0.00 0.24 0.00 0.03 0.15
Data Source: Utah Cancer Registry, 2001. Observed cases are presented as < 3 when the number of cases are less than three to protect confidentiality of the cases.
25

An Investigation of Cancer Incidence In Mapleton, Utah, 1978-2001 January 28, 2004
Soft Tissue Table 10 Observed cases, expected cases, and standardized morbidity ratios (SMR) with
upper and lower 95 percent confidence limits for Cancer of the Soft Tissue in census tract 10301 (Mapleton, Utah) 1978 - 2001.
Years ‘78-81 ‘82-86 ‘87-91 ‘92-96 ‘97-01 ‘78-01
Observed 0 <3 <3 <3 4* 7* Expected 0.2 0.3 0.3 0.6 0.8 2.2
SMR 0.00 2.91 3.15 1.77 4.95 3.13 Upper Limit 4.06 11.42 12.33 6.94 10.98 5.88 Lower Limit 0.00 0.00 0.00 0.00 1.29 1.24
Data Source: Utah Cancer Registry, 2001. *Significance (Statistically significantly different from the expected number of cases.) Observed cases are presented as < 3 when the number of cases are less than three to protect confidentiality of the cases.
Brain Table 11 Observed cases, expected cases, and standardized morbidity ratios (SMR) with
upper and lower 95 percent confidence limits for Cancer of the Brain census tract 10301 (Mapleton, Utah) 1978 - 2001.
Years ‘78-81 ‘82-86 ‘87-91 ‘92-96 ‘97-01 ‘78-01
Observed 0 <3 0 3 <3 6 Expected 0.7 0.8 1.1 1.3 1.7 5.7
SMR 0.00 1.21 0.00 2.26 1.15 1.05 Upper Limit 1.35 4.75 0.87 5.55 3.31 2.06 Lower Limit 0.00 0.00 0.00 0.43 0.11 0.38
Data Source: Utah Cancer Registry, 2001. Observed cases are presented as < 3 when the number of cases are less than three to protect confidentiality of the cases.
Non Hodgkin’s Lymphoma & Chronic Lymphocytic Leukemia Table 12 Observed cases, expected cases, and standardized morbidity ratios (SMR) with
upper and lower 95 percent confidence limits for Non Hodgkin’s lymphoma & Chronic Lymphocytic Leukemia combined in census tract 10301 (Mapleton, Utah) 1978 - 2001.
Years ‘78-81 ‘82-86 ‘87-91 ‘92-96 ‘97-01 ‘78-01
Observed <3 3 6 <3 5 18 Expected 1.2 1.5 2.2 3.1 4.0 11.9
SMR 1.68 1.96 2.71 0.65 1.24 1.51 Upper Limit 4.80 4.81 5.31 1.85 2.57 2.29 Lower Limit 0.16 0.37 0.98 0.06 0.39 0.89
Data Source: Utah Cancer Registry, 2001. Observed cases are presented as < 3 when the number of cases are less than three to protect confidentiality of the cases.
26