an investigation of effectiveness...
TRANSCRIPT

AN INVESTIGATION OF THE RELATIVE EFFECTIVENESSOF THREE METHODS OF UTILIZING LABORATORY ACTIVITIESIN SELECTED TOPICS OF JUNIOR COLLEGE MATHEMATICS
By
JOAN MARIE GOLLIDAY
A DISSERTATION PRESENTED TO THE GRADUATECOUNCIL OF THE UNIVERSITY OF FLORIDA IN PARTIALFULFILLMENT OF THE REQUIREMENTS FOR THE DEGREE OF
DOCTOR OF PHILOSOPHY
UNIVERSITY OF FLORIDA1974

To
Mother, Daddy, and Bruce

ACKNOWLEDGMENTS
At this time, it is my privilege to publicly thank:
the individuals who helped to make the attainment of my
doctorate a reality. I would like to express my deepest
thanks to Dr. Kenneth P. Kidd, chairman of my supervisory
committee, for his guidance and assistance during my gradu-
ate studies. The many suggestions offered during the plan-
ning and organization of the research have been instrumental
in its successful completion. His assistance is sincerely
appreciated
.
My thanks also go to Dr. Elroy J. Eolduc, Jr.,
cochairman of the committee,' for his suggestions on the
writing and rewriting of the manuscript.
To Dr. Charles W. Nelson, I express my appreciation
for serving on the supervisory committee, and for the many
hours spent in reading and criticizing the final manuscript.
To Dr. Vynce A. Hines, I extend my deepest appreci-
ation for his advice regarding the statistical aspects of
the study in both its preliminary and final stages.
Finally, I wish to thank Bruce Walek for his constant
support and encouragement.

TABLE OF CONTENTS
Page
ACKNOWLEDGEMENTS iii
LIST OF TABLES vi
ABSTRACT x
Chapter
I. INTRODUCTION 1
General Background of the Problem 1
Statement of the Problem 3Definition of Terms 6
Need for the Study 7Organization of the Study 9
II . REVIEW OF RELATED RESEARCH 11
Inductive-Deductive Studies 11Laboratory Studies 15Summary 19
III . THE EXPERIMENTAL DESIGN 21
Statement of Hypotheses 21Description of Procedures and Design ...... 26Instrumentation 31
Myers -Briggs Type Indicator 31Pretest-Posttest 33Experiment Materials 34
Statistical Treatment 3^
IV. ANALYSIS OF DATA 35
V. SUMMARY, CONCLUSIONS, LIMITATIONS, ANDIMPLICATIONS 61
Summary 6lConclusions 63Limitations 66Implications 67

TABLE OF CONTENTS --- Continued
Page
APPENDIX A Performance Objectives andPretest-Posttest 69
APPENDIX B --- Experiments 76
BI BLI OGRAPHY 118
BIOGRAPHICAL SKETCH 121

LIST OF TABLES
Table Page
I Subject Distribution by Treatment andAchievement Level 30
II Subject Distribution by Treatment andPersonality Type 31
III Subject Distribution by Achievement Leveland Personality Type Jl
IV Mean Error Scores for Subjects in theExploratory-Discovery Group, theVerification-Application Group andCombination Group on the Pretest andPosttest 35
V Analysis of Covariance 36
VI 95 Percent Confidence Intervals forComparisons Among the Exploratory-DiscoveryGroup, the Verification-Application Groupand the Combination Group 38
VII Mean Error Scores of Sensing Subjects andIntuitive Subjects on the Pretest andPosttest 38
VIII Mean Error Scores for High-Achievers in theExploratory-Discovery Group, theVerification-Application Group and theCombination Group on the Pretest andPosttest
'
39
IX Mean Error Scores for Average -Achievers inthe Exploratory-Discovery Group, theVerification-Application Group and theCombination Group on the Pretest andPosttest 40

LIST OF TABLES -- (Continued)
Table Page
X Mean Error Scores for Low-Achievers in theExploratory-Discovery Group, theVerification-Application Group and theCombination Group on the Pretest andPosttest 40
XI 95 Percent Confidence Intervals forComparisons Among the Ave rage -Achievers inthe Exploratory-Discovery Group, theVerification-Application Group and theCombination Group 43
XII 95 Percent Confidence Intervals forComparisons Among the Low-Achievers in theExploratory-Discovery Group, theVerification-Application Group and theCombination Group 43
XIII Mean Error Scores for Sensing Subjects inthe Exploratory-Discovery Group, theVerification-Application Group and theCombination Group on the Pretest andPosttest 44
XIV Mean Error Scores for Intuitive Subjectsin the Exploratory-Discovery Group, theVerification-Application Group and theCombination Group on the Pretest andPosttest
L
45
XV 95 Percent Confidence Intervals forComparisons Among the Sensing Subjects inthe Exploratory-Discovery Group, theVerification-Application Group and theCombination Group 4?
XVI Mean Error Scores for Sensing High-Achievers in the Exploratory-DiscoveryGroup, the Verification-Application Groupand the Combination Group on the Pretestand Posttest 4?
XVII Mean Error Scores for Sensing Average-Achievers in the Exploratory-DiscoveryGroup, the Verification-Application Groupand the Combination Group on the Pretestand Posttest 48

LIST OF TABLES -- (Continued)
Table Page
XVIII Mean Error Scores for Sensing Low-Achieversin the Exploratory -Discovery Group, theVerification-Application Group and theCombination Group on the Pretest andPosttest ^8
XIX Mean Error Scores for Intuitive High-Achievers in the Exploratory -DiscoveryGroup, the Verification-Application Groupand the Combination Group on the Pretestand Posttest ^9
XX Mean Error Scores for Intuitive Average-Achievers in the Exploratory-DiscoveryGroup, the Verification-Application Groupand the Combination Group on the Pretestand Posttest ^9
XXI Mean Error Scores for Intuitive Low-Achievers in the Exploratory-DiscoveryGroup, the Verification-Application Groupand the Combination Group on the Pretestand Posttest 50
XXII 95 Percent Confidence Intervals forComparisons Among the Sensing High-Achievers in the Exploratory-DiscoveryGroup, the Verification-Application Groupand the Combination Group 5^
XXIII 95 Percent Confidence Intervals forComparisons Among the Sensing Average-Achievers in the Exploratory-DiscoveryGroup, the Verification-Application Groupand the Combination Group 5^
XXIV Questionnaire Summary for the Exploratory-Discovery Group 57
XXV Questionnaire Summary for the Verification-Application Group 58
XXVI Questionnaire Summary for the CombinationGroup 59
XXVII Summary of Comments for the Exploratory-Discovery Group 60

LIST OF TABLES — (Continued)
Table Page
XXVIII Summary of Comments for the Verification-Application Group 60
XXIX Summary of Comments for the CombinationGroup 60

Abstract of Dissertation Presented to the Graduate Councilof the University of Florida in Partial Fulfillment of the
Requirements for the Degree of Doctor of Philosophy
AN INVESTIGATION OF THE RELATIVE EFFECTIVENESSOF THREE METHODS OF UTILIZING LABORATORY ACTIVITIESIN SELECTED TOPICS OF JUNIOR COLLEGE MATHEMATICS
By
Joan Marie Golliday
August, 1974
Chairman: Dr. Kenneth P. KiddCochairman: Dr. Elroy J. EolducMajor Department: Curriculum and Instruction
Purpose of the Study
The purpose of the study was to investigate the
relative effectiveness of the mathematics laboratory when
used in three different ways in conjunction with a tradi-
tional lecture-discussion approach to teach community college
freshmen enrolled in a required mathematics course.
Procedures
The sample population for the study consisted of
seven sections of a required mathematics course at Santa Fe
Junior College, Gainesville, Florida. On the basis of their
scores on the Myers -Briggs Type Indicator the subjects were
classified as sensing or intuitive. They v/ere also classi-
fied as high, average, or low achievers on the basis of
their college grade point average. One group, known as the

exploratory-discovery group, received sixty minutes of labo-
ratory experiences followed by thirty minutes of discussion.
The second group, known as the verification-application
group, received thirty minutes of lecture followed by sixty
minutes of laboratory. The third group, known as the combi-
nation group, received thirty minutes of laboratory exper-
ience both before and after the thirty minutes of lecture-
discussion. All groups studied the topic of ratio and simi-
larity for tv/o and one half weeks. They were given both a
pretest and a posttest. The resulting mean error scores
of the 94 subjects were compared in a 3*3x2 factorial design
using analysis of covariance. The pretest error scores were
used as a covariate. Scheffe's Method was used to determine
the significance of the reductions in mean error score for
the various subcategories.
Conc lusions
In comparisons of sensing and intuitive subjects
without regard to achievement level or method, the sensing
subjects did significantly better than the intuitive
subjects. Comparisons for all other main effects and
interactions were nonsignificant.
The investigation of reductions in mean error scores
indicated that the exploratory-discovery group attained a
significantly greater reduction than the other two groups.
Within the categories of average -achievers and sensing
students, the exploratory-discovery group also achieved a
XI

significantly greater reduction than the other two groups.
Low-achievers in the combination group achieved a signifi-
cantly greater reduction in mean error score than those in
the exploratory-discovery group. Finally, sensing high-
achievers in the combination group achieved a significantly
greater reduction in mean error score than those in the
verification-application group.

CHAPTER I
INTRODUCTION
General Ba c kground of the Problem
In recent years, the general concern over the educa-
tive process has produced a number of innovative teaching
techniques. Some of these innovations are genuinely new
while others are old techniques which have merely been reno-
vated, energized, and' generally modernized. Regardless of
which technique one chooses to investigate, it soon becomes
apparent that all have suffered from the same malady
namely, little or no experimental documentation of their
worth and validity.
At the present time the concept of a mathematics
laboratory is again appearing upon the educational horizon.
This particular teaching technique has had periods of popu-
larity at least twice within the last century. The initial
appearance of this teaching approach is generally associated
with the English mathematician John Perry. Perry first
promulgated his revolutionary ideas in 1901 in a report on
the "Teaching of Mathematics" which he presented to the
British Association for the Advancement of Science. His main
concern was that toe much emphasis was being placed on the

theoretical aspects of mathematics. He proposed that a more
meaningful approach would be to teach a combined physics and
mathematics course putting the physical or applied aspects
first. "Perry favored a laboratory approach, including
greater emphasis on experimental geometry, practical mensu-
ration, the use of squared paper to plot statistics, inter-
polate, discuss slope, and find maximum and minimum values,
easy vector algebra, more solid geometry, and the utilitarian
parts of geometry" (Mock 1 963 , p. 1 31 ) . Apparently, the vast
majority of the mathematics teachers in England agreed with
Professor Perry and the Perry Movement was soon spreading
across England and to America. During the next couple of
years, articles dealing with the pros and cons of the labo-
ratory approach abounded. It seemed that the laboratory
concept was here to stay. But Perry and his followers had
not reckoned with the rigid, unchanging testing system of
England's school system. As student scores fell so did
support for the Perry Movement. Its popularity lasted less
than ten years
.
The second emergence of a laboratory-type of instruc-
tion came in the early 19^0's. This was an era of multi-
sensory aids. Topics were taught using movies, film strips,
slides, and overhead and opaque projectors. The major
shortcoming in this approach was the passive role of the
student. All these multi-sensory aids were used by the
teachers to demonstrate principles which they expounded
rather than as a means of hands-on discovery by the student.

After approximately five years, the novelty of this approach
began to subside and the teachers gradually returned to
their traditional methods of instruction.
The most recent reemergence of the mathematics labo-
ratory began in the early 1960's. Its spread across the
United States has been more gradual than in the past and
this in itself may be a healthy sign. The bandwagon approach
which has meant disaster in the past has been avoided. Today
the mathematics laboratory is viewed as an adjunct to rather
than a replacement for the more traditional forms of
instruction. Past studies have dealt with the question of
whether or not the laboratory method is better than the tra-
ditional lecture-discussion technique. The results of most
of these studies have been inconclusive, what is needed, in
view of today's educational philosophy, are studies to deter-
mine how the laboratory may be most effectively used in con-
junction with the traditional lecture-discussion method. It
was with this in mind that the present study was undertaken.
Statement of the Problem
The purpose of this study is to investigate the rel-
ative effectiveness of the mathematics laboratory when used
in three different ways in conjunction with a traditional
lecture-discussion approach to teach community college
freshmen enrolled in a required mathematics course. The
laboratory experience will be used as an introduction to a

k
topic, as a reinforcer, or as both. All subjects are clas-
sified by achievement level and personality type, as deter-
mined by the Myers-Briggs Type Indicator, so that the in-
teraction of these factors with the various laboratory ap-
proaches may be assessed. In particular, as a prelude to
the formal null hypotheses found in Chapter III, the
following research questions are of interest:
1 . Do college freshmen studying ratio and similarity under
one sequencing pattern of laboratory experiences and
discussion do significantly better than those studying
the same topics under different sequencing arrangements?
2. Do high-achieving college freshmen studying ratio and
similarity perform significantly better under any one of
the three sequencing arrangements?
3. Do average -achieving college freshmen studying ratio and
similarity perform significantly better under any one of
the three sequencing arrangements?
h. Do low-achieving college freshmen studying ratio and
similarity perform significantly better under any one of
the three sequencing arrangements?
5. Do college freshmen who have been identified as sensing
personality types on the basis of the Myers-Briggs Type
Indicator perform significantly better under any one of
the three sequencing arrangements when studying ratio
and similarity?
6. Do college freshmen who have been identified as intui-
tive personality types on the basis of the Myers-Briggs

Type Indicator perform significantly better under any
one of the three sequencing arrangements when studying
ratio and similarity?
7. Do high-achieving college freshmen who have been iden-
tified as sensing personality types perform significantly
better under any one of the three sequencing arrangements
when studying ratio and similarity?
8. Do high-achieving college freshmen who have been iden-
tified as intuitive personality types perform signifi-
cantly better under any one of the three sequencing
arrangements when studying ratio and similarity?
9. Do average -achieving college freshmen who have been
identified as sensing personality types perform signif-
icantly better under any one of the three sequencing
arrangements when studying ratio and similarity?
10. Do average-achieving college freshmen who have been
identified as intuitive personality types perform sig-
nificantly better under any one of the three sequencing
arrangements when studying ratio and similarity?
11. Do low-achieving college freshmen who have been iden-
tified as sensing personality types perform signifi-
cantly better under any one of the three sequencing
arrangements when studying ratio and similarity?
12. Do low-achieving college freshmen who have been iden-
tified as intuitive personality types perform signif-
icantly better under any one of the three sequencing
arrangements when studying ratio and similarity?

In order to test the series of null hypotheses gen-
erated by these research questions, 9^ college freshmen en-
rolled in an introductory mathematics course at a Florida
community college were identified as sensing high-achievers,
sensing average -achievers, sensing low-achievers, intuitive
high-achievers, intuitive average -achievers, or intuitive
low-achievers on the basis of their college grade point
average and the Myers-Briggs Type Indicator. Each student
was administered a pretest and a posttest on ratio and
similarity. The resulting mean error scores of the eighteen
groups were compared in a 3*3*2 factorial design using the
methods of multiple linear regression with the pretest
scores as a covariate.
Definition of Terms
The following terms will be used throughout the
study:
Sensing Subject: a subject who has been classified as asensing personality on the basis of his Myers-Briggs TypeIndicator score.
Intuitive Subject : a subject who has been classified as anintuitive personality on the basis of his Myers-Briggs TypeIndicator score
.
High-Achiever : a subject whose grade point average at hiscurrent community college is greater than or equal to 3 • 35
•
Ave rage -Ac hi e ve r : a subject whose grade point average athis current community college is between 2.65 and 3 • 35
•
Low-Achiever : a subject whose grade point average at hiscurrent community college is less than or equal to 2.65.
Exploratory -Pi scovery Method : a method of using the

mathematics laboratory as an introduction to a new topicfollowed by class discussion of what was observed in thelaboratory.
Verification-Application Method : a method of using themathematics laboratory to illustrate and verify topics whichhave been taught in the classroom.
Combination Method ; a method of using the mathematicslaboratory both before and after class discussion so that itboth introduces and verifies the classroom material.
Mathematics Laboratory : a mode of instruction which usesexperiments to aid students in the discovery and/orverification of mathematical concepts.
Need for the Study
An area of concern for teachers of mathematics has
been that of helping the student to obtain a better under-
standing of the mathematics he is studying. It was this
concern which produced modern mathematics. With the advent
of modern mathematics there were many teaching innovations
such as team-teaching, modular scheduling, discovery learn-
ing, and the mathematics laboratory. At first these were
advocated as replacements for the traditional modes of
instruction. But as researchers found, students did not do
significantly better, or worse for that matter, under the
new methods of instruction. The unfortunate part is that
many of these innovations were abandoned because they did
not produce better results than the traditional methods.
The fact that they were at least as good as the old
techniques was completely overlooked.
There have been several studies in which the

mathematics laboratory has been compared to traditional
methods of instruction. See Wilkinson (1970), Cohen (1970),
Phillips (1970) and Bluman (1971). In all four of these
studies there were no significant differences between the two
methods of instruction; that is, they were equally effective.
Since the laboratory approach appears to be as good
as the traditional lecture-discussion method, it seems rea-
sonable to use both. It was with this premise in mind that
this study was conceived. The questions which immediately
came to mind v/ere as follows:
1. Is there a best sequence for using both the mathematics
laboratory and the lecture-discussion?
2. If there is a best sequencing pattern will it be the
same for all achievement levels?
3. Would the best sequencing pattern be related to
personality type?
A search of the literature found only two studies
which had considered this question of sequencing. See
Reuss (1970) and Emslie (1971). Reuss did his work in
biology while Emslie did his in physics. There was no exper-
imental research into these questions using mathematics as
the vehicle of study.
Since many school systems are committing themselves
to the operation of mathematics laboratories, it is essen-
tial that the above questions be answered. This study is
designed to investigate the role of the mathematics labora-
tory at the community college level. It is hoped that this

study will stimulate the further research at the elementary,
middle, and secondary school levels which is needed.
Organization of the Study
Chapter I has been an introduction to the study,
including some general background information, a statement
of the problem, definitions, and an explanation of the need
for the study. Chapter II is devoted to a review of related
research. The results from five studies comparing the
inductive method of instruction to the deductive method are
reported in the first section of the chapter. In the second
section, the results from five studies comparing the mathe-
matics laboratory to traditional methods of instruction are
examined, along with two studies that dealt with the
sequencing of a laboratory experience with traditional
lecture-discussion instruction. The final section is a
summary of the first two sections. Chapter III contains the
formal null hypotheses, along with a description of the
design, the sample population, and the procedures involved
in gathering the data. Information about the pretest, the
posttest, the experiments used and the Myers -Briggs Type
Indicator is presented along with an explanation of the
statistical treatment. Chapter IV is devoted to a presen-
tation and analysis of the data. It also includes the
results of a questionnaire completed by the subjects in the
study. Chapter V contains a brief summary of the study

10
together with a list of the conclusions reached. Several
limitations are cited, and some implications for instruction
and future research are discussed.

CHAPTER II
REVIEW OF RELATED RESEARCH
For nearly twenty years, educators and mathemati-
cians have been concerned with the question of whether the
traditional deductive method of instruction is better than
the inductive approach. There have been studies which found
the deductive method to be better, while others found the
inductive approach to be significantly better. The vast
majority of the research into this area, however, found no
significant differences. Most recently, this question has
reemerged with reference to the mathematics laboratory. For
this reason, this chapter has been divided into three parts.
The first section contains a few representative samples of
the research done on the inductive-deductive question. The
second section deals strictly with research relating to the
laboratory approach to instruction, while the final section
will be a summary of the results reported herein.
Inductive-Deduc tive Studies
One of the earliest studies to investigate the rela-
tive effectiveness of the inductive and deductive methods of
instruction was conducted by Dr. Max Sobel (1956). In this
11

12
study, Dr. Sobel investigated the effectiveness of the in-
ductive method of teaching algebra as compared to the tradi-
tional deductive method. In order to do this he used four-
teen ninth-grade algebra classes in Newark and Patterson,
New Jersey. Seven classes were taught by each method and
every class except two had a different instructor. The
teachers using the inductive approach were given a manual of
instruction, an explanation of the study, and numerous il-
lustrative examples to be used. The deductive group used
the normal textbook. At the end of four weeks the students
were given a test which had been developed by the researcher.
A review of I.Q. scores for all students indicated that sub-
grouping by intelligence level was also possible. An anal-
ysis of the data found that bright students learned and
retained skills better when taught by the inductive method.
For the average intelligence level, there were no significant
differences
.
In 1965. Krumboltz and Yabroff conducted a study to
determine the teaching efficiency of inductive and deductive
sequences of instruction with varying frequencies of alter-
nation between problem-solving and rule-stating frames.
They also investigated the interaction of these factors with
intelligence levels. The experimental sample consisted of
272 students enrolled in an introductory education course at
the University of Minnesota. Each student was given the
Miller Analogies Test and was categorized as high or low in
intelligence on the basis of his score. Four forms of

13
programmed materials on elementary statistics and test in-
terpretation were randomly distributed to all students. Two
forms were inductive with different frequencies of alterna-
tion while the other two were deductive with differing
frequencies of alternation.
Each student was given a test two weeks after the
end of the instructional period. An analysis of the data
using analysis of variance found the following results:
1. The high-intelligence group completed their work in
significantly less time than the low-intelligence group.
2. The inductive group made significantly more errors than
the deductive group.
A similar study to that of Krumboltz and Yabroff was
conducted by Koran (1971). Her sample population consisted
of 167 students enrolled in an introductory education course
at the University of Texas. Each student was given selected
measures from the Kit of Reference Tests for Cognitive
Factors. Koran also used programmed materials dealing with
selected areas of elementary statistics and test
interpretation. There were four forms of the programmed
material two inductive and two deductive with differing
frequencies of alternation. These were distributed randomly
to the students.
Each student was given a test two weeks after the
completion of the programmed material. An analysis of the
data showed no significant differences in the time required
to complete the material. However, subjects in the inductive
14
treatment made significantly more errors than those in the
deductive treatment.
Becker (1967) investigated the interaction of two
instructional treatments with two aptitude variables. His
subjects were students enrolled in an Algebra I class in
San Carlos, California. All students were given multiple
choice tests to determine their mathematical and verbal
aptitude. On the basis of these tests 35 matched pairs were
obtained. Subjects in each matched pair were randomly-
assigned to treatments. The two treatments were programmed
instruction one inductive and the other deductive in
arrangement. The data collected were subjected to a multi-
ple regression analysis. There were no significant
differences
.
Tanner (1968) studied the relative effectiveness of
an expository treatment as compared to a discovery approach
to teaching physical science. The experimental population
consisted of 389 ninth-grade students enrolled in a general
science course. These subjects were randomly assigned to
three groups. One group received materials programmed in
an expository-deductive format. The second group received
materials programmed in a discovery-inductive format. The
third group received materials containing the same program
frames but in a random order. An analysis of posttest
scores found no significant differences among the three
groups
.

15
Laboratory^ Studies
In the last five years, nearly all research of an
experimental nature dealing with the laboratory approach to
instruction has been undertaken by doctoral students. The
intent of the studies has varied v/idely as have the popula-
tions sampled. Wilkinson (1970) was interested in deter-
mining whether the laboratory approach to teaching geometry
to sixth graders would be more effective than the traditional
teacher-textbook approach. He used two experimental groups
and one control group. One experimental group used manipu-
lative materials and worksheets to guide them in collecting
and generalizing their data. The second experimental group
received verbal instructions, by means of tape cassettes, in
addition to the written worksheets. All three groups were
given pretests and posttests dealing with their attitude
toward mathematics, achievement in geometry, and nonverbal
intelligence. An analysis of the data showed no significant
differences for the three groups in any of these areas.
In another study,' Cohen (1970) investigated the rel-
ative effectiveness of the mathematics laboratory on under-
achieving seventh and eighth grade boys. Two groups of four-
teen boys each with average or above-average ability, but
with below-average achievement were used . One group was
taught fraction concepts and computation with fractions
using the traditional textbook-discussion approach. The

16
second group was taught the same material in a laboratory
setting using manipulative devices and multi-sensory
materials. A comparison of achievement scores, computa-
tional skills scores, and attitude scores for the two groups
showed no significant differences.
Three studies dealt with the use of the laboratory
approach at the college level. Phillips (1970) conducted a
study at Oakland City College, Oakland City, Indiana, to
determine the effect of the laboratory approach on the
achievement and attitude of low-achiever mathematics students
enrolled in a developmental mathematics course. All subjects
were given a pretest and two posttests to determine attitude
and achievement. One posttest was given at the end of the
course while the second was given at the end of a second re-
quired mathematics course. The experimental group was taught
the developmental mathematics by means of a mathematics
laboratory. The control group received the traditional lec-
ture type of instruction. Both groups received the tradi-
tional approach in the sequential course. An analysis of the
data showed no significant difference in achievement for the
two groups. The laboratory group did show a significant im-
provement in their attitude immediately following the labo-
ratory experience but this gain was no longer apparent fol-
lowing their re-encounter with the traditional approach.
In the second study, Smith (1970) investigated the
effectiveness of the laboratory in teaching abstract algebra
to college students. He used two classes of college students

17
enrolled in a required course in abstract algebra. Each
class was halved so that there were four groups with twelve
students in each. The control group received four lecture
sessions with no laboratory. The other three groups re-
ceived varying laboratory sessions. One group had one lec-
ture session and three laboratory sessions; the second had
two lecture sessions and two laboratory sessions; the third
group had three lecture sessions and one laboratory session.
The laboratory experience dealt with the manipulation of
concrete models relating to the materials taught in the lec-
ture sessions. The material dealt with systems of numeration
and bases other than ten. The analysis of the data indicated
that those receiving laboratory experience scored signifi-
cantly higher than the control group in both comprehension
and retention.
The third study, conducted by Bluman (1971), was to
determine whether the laboratory method of instruction in
mathematics would be more effective than the traditional
approach. For the purposes of this study, four intact
classes of freshmen enrolled in a college-level introductory
mathematics course were selected. Two classes acted as con-
trol groups and received the traditional instruction. The
other two classes received their instruction by means of
filmstrips, experiments, demonstrations, overhead projector,
and problem sessions. Two teachers were used to teach these
four classes. Each teacher had an experimental and a control
group. The analysis of the data indicated that there was no

significant difference between the two treatments in either
attitude or achievement. There was, however, a significant
interaction between teacher and method.
In all of the above studies, the general purpose was
to determine whether the laboratory approach should be used
in place of the traditional approach. As stated in Chapter I
this either-or approach is inappropriate in view of today's
educational philosophy. Instead, we need to ascertain in
what way the laboratory can best be employed to complement
the traditional approach. It is this question which needs
to be answered.
In researching the literature, two studies were
found which closely resemble the present study. The first
study was conducted by Reuss (1970). Reuss used three
groups of biology students all receiving laboratory
experiences. The control group used experiments employing
the traditional deductive approach. One experimental group
used experiments which were of the guided inductive type,
while the other group used materials written in the open
inductive style. All students were pretested on attitude
and basic knowledge of the topic to be studied. Posttests
were given. The data were analyzed with the class as the
basic statistical unit and again taking ability into
consideration. In all cases, there were no significant
differences among the three approaches.
In the second study, Emslie (1971) sought to deter-
mine the relative effectiveness of two sequencing procedures

19
in the teaching of a unit on molecules and the atom.
Method I was a laboratory-theory sequence while Method II
was a theory-laboratory sequence. Method I was used with a
sample of 99 fourth and sixth graders in one school while
Method II was used with a sample of 158 fourth and sixth
graders in a school in another district. The criterion
variable was the score on a standardized test designed for
use with a sixth grade science textbook. The data were
analyzed using analysis of covariance with I. Q. and general
science achievement scores as covariates. This analysis re-
sulted in no significant differences for the two methods
although the fourth graders appeared to score higher under
the laboratory-theory approach.
Summary
In general the studies comparing the inductive with
the deductive approach have been inconclusive. Both
approaches seem to have merit and would lead one to believe
that the mathematics laboratory could logically precede or
follow a lecture-discussion presentation. Experimental
testing of this assumption is needed, however.
The studies dealing with the laboratory approach
generally found it to be as effective as more traditional
approaches. These results should guarantee the laboratory
method a slot in every educator's repertoire. The issue
which has not been answered, at least for the mathematics

20
laboratory, is how most effectively to combine the laboratory
approach with the traditional lecture-discussion approach.
The studies by Reuss (1970) and Emslie (1971) illustrate that
this concern is shared by other sciences. Although their
studies found no significant differences for different
sequencing patterns, they have served to make us aware of the
need for further research in other areas and at other grade
levels. In the present study, the role of the mathematics
laboratory at the college level has been investigated. It
is hoped that this study will contribute additional informa-
tion about the mathematics laboratory and its relation to
more traditional modes of instruction.
CHAPTER III
THE EXPERIMENTAL DESIGN
Statement of Hypotheses
As the preceding chapter shows, there is a dearth of
research dealing with the laboratory as an adjunct to more
traditional modes of instruction. Although the two studies
that dealt with this question had no significant results,
there were trends within intelligence levels which indicate
that further research might be informative.
A factor which was not considered in either of these
studies was personality type. It is conceivable that the
inductive nature of a laboratory experience might cause cog-
nitive dissidence with certain personality types and hence
have an effect on the results of the study.
In the present study, personality type and achieve-
ment level will both be taken into consideration and their
effects, if any, determined. In order to do this, the
following null hypotheses will be investigated:
HI . There is no significant difference between themean posttest score of students in theexploratory-discovery group and the mean posttestscore of students in the verification-applicationgroup
.
21

22
H2 . There is no significant difference between themean posttest score of students in theexploratory-discovery group and the mean posttestscore of students in the combination group.
H3. There is no significant difference between themean posttest score of students in theverification-application group and the mean post-test score of students in the combination group.
H4. There is no significant difference between themean posttest score of sensing students and themean posttest score of intuitive students.
H5« There is no significant difference between themean posttest score of high-achieving students inthe exploratory-discovery group and the mean post-test score of high-achieving students in theverification-application group.
H6. There is no significant difference between themean posttest score of high-achieving students inthe exploratory-discovery group and the mean post-test score of high-achieving students in thecombination group.
H7, There is no significant difference between themean posttest score of high-achieving students inthe verification-application group and the meanposttest score of high-achieving students in thecombination group.
H8. There is no significant difference between themean posttest score of average-achieving studentsin the exploratory-discovery group and the meanposttest score of average-achieving students inthe verification-application group.
H9. There is no significant difference between themean posttest score of average -achieving studentsin the exploratory-discovery group and the meanposttest score of average-achieving students inthe combination group.
H10. There is no significant difference between themean posttest score of average -achieving studentsin the verification-application group and themean posttest score of average-achieving studentsin the combination group.
Hll. There is no significant difference between themean posttest score of low-achieving students inthe exploratory-discovery group and the mean

23
posttest score of low-achieving students in theverification-application group.
H12. There is no significant difference between themean posttest score of low-achieving students inthe exploratory-discovery group and the meanposttest score of low-achieving students in thecombination group.
H13. There is no significant difference between themean posttest score of low-achieving students inthe verification-application group and the meanposttest score of low-achieving students in thecombination group.
Hl4. There is no significant difference between themean posttest score of sensing students in theexploratory-discovery group and the mean posttestscore of sensing students in the verification-application group.
HI 5. There is no significant difference between themean posttest score of sensing students in theexploratory-discovery group and the mean posttestscore of sensing students in the combinationgroup.
HI 6. There is no significant difference between themean posttest score of sensing students in theverification-application group and the mean post-test score of sensing students in the combinationgroup.
HI 7. There is no significant difference between themean posttest score of intuitive students in theexploratory-discovery group and the mean posttestscore of intuitive students in the verification-application group.
HI 8. There is no significant difference between themean posttest score of intuitive students in theexploratory-discovery group and the mean posttestscore of intuitive students in the combinationgroup
.
H19. There is no significant difference between themean posttest score of intuitive students in theverification-application group and the mean post-test score of intuitive students in thecombination group.
H20. There is no significant difference between themean posttest score of high-achieving sensing

2k
students in the exploratory-discovery group andthe mean posttest score of high-achieving sensingstudents in the verification-application group.
H21 . There is no significant difference between themean posttest score of high-achieving sensingstudents in the exploratory-discovery group andthe mean posttest score of high-achieving sensingstudents in the combination group.
H22. There is no significant difference between themean posttest score of high-achieving sensingstudents in the verification-application groupand the mean posttest score of high-achievingsensing students in the combination group.
H23. There is no significant difference between themean posttest score of average-achieving sensingstudents in the exploratory-discovery group andthe mean posttest score of average-achievingsensing students in the verification-applicationgroup.
H24. There is no significant difference between themean posttest score of average-achieving sensingstudents in the exploratory-discovery group andthe mean posttest score of average-achievingsensing students in the combination group.
H25. There is no significant difference between themean posttest score of average-achieving sensingstudents in the verification-application groupand the mean posttest score of average-achievingsensing students in the combination group.
H26. There is no significant difference between themean posttest score of low-achieving sensingstudents in the exploratory-discovery group andthe mean posttest score of low-achieving sensingstudents in the verification-application group.
H27. There is no significant difference between themean posttest score of low-achieving sensingstudents in the exploratory-discovery group andthe mean posttest score of low-achieving sensingstudents in the combination group.
H28. There is no significant difference between themean posttest score of low-achieving sensingstudents in the verification-application groupand the mean posttest score of low-achievingsensing students in the combination group.
25
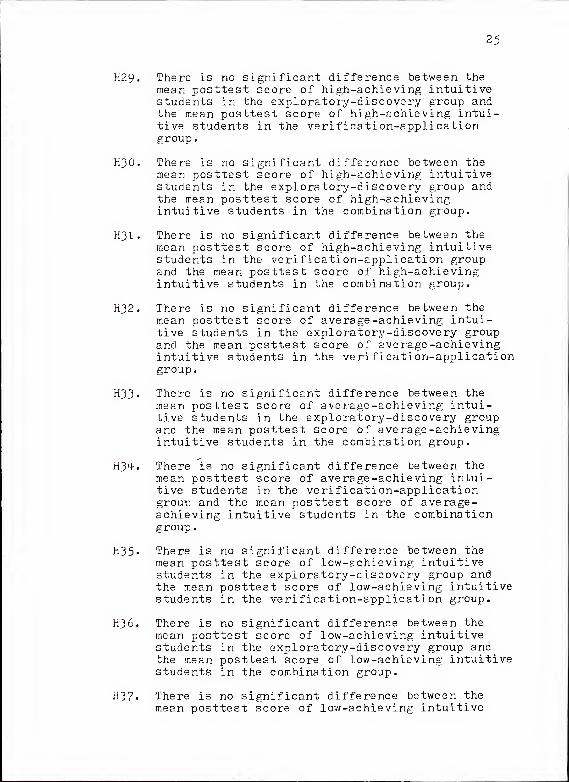
H29. There is no significant difference between themean posttest score of high-achieving intuitivestudents in the exploratory-discovery group andthe mean posttest score of high-achieving intui-tive students in the verification-applicationgroup.
H30. There is no significant difference between themean posttest score of high-achieving intuitivestudents in the exploratory-discovery group andthe mean posttest score of high-achievingintuitive students in the combination group.
H31 . There is no significant difference between themean posttest score of high-achieving intuitivestudents in the verification-application groupand the mean posttest score of high-achievingintuitive students in the combination group.
H32 . There is no significant difference between themean posttest score of average-achieving intui-tive students in the exploratory-discovery groupand the mean posttest score of average-achievingintuitive students in the verification-applicationgroup.
H33« There is no significant difference between themean posttest score of average-achieving intui-tive students in the exploratory-discovery groupand the mean posttest score of average-achievingintuitive students in the combination group.
H3^. There is no significant difference between themean posttest score of average-achieving intui-tive students in the verification-applicationgroup and the mean posttest score of average-achieving intuitive students in the combinationgroup
.
H35* There is no significant difference between themean posttest score of low-achieving intuitivestudents in the exploratory-discovery group andthe mean posttest score of low-achieving intuitivestudents in the verification-application group.
H36. There is no significant difference between themean posttest score of low-achieving intuitivestudents in the exploratory-discovery group andthe mean posttest score of low-achieving intuitivestudents in the combination group.
H37. There is no significant difference between themean posttest score of low-achieving intuitive

26
students in the verification-application groupand the mean posttest score of low-achievingintuitive students in the combination group.
Description of Procedures and Design
The design of the present study can best be classi-
fied as the nonequivalent control group design as described
by Campbell and Stanley (1963). There is not, however, a
control group as such since all groups involved received a
treatment. More specifically, the study is a 3x3x2 factorial
experiment. The three experimental factors are the sequencing
pattern (exploratory-discovery, verification-application,
combination), achievement status (high, average, low) and per-
sonality type (sensing, intuitive). The criterion measure is
the error score on a posttest on ratio and similarity with
the error score on a pretest on ratio and similarity as a
covariate
.
For the purposes of this study, seven classes of
freshmen students enrolled in a required mathematics course
at Santa Fe Junior College were selected and constituted the
experimental population. These seven classes were selected
on the basis of the willingness of the instructors to parti-
cipate in the study and the fact that each instructor had at
least two classes at approximately the same time of day.
There were three instructors involved in the study two
instructors had two classes apiece while the third had three
classes. Five of the classes were during the day and met

27
for 95 minutes at each session. The remaining two classes
were at night and met for two hours at a time.
Since it was not possible to assign students randomly
to these seven classes, the classes were randomly assigned to
treatments. The two instructors with two classes each had
two of the three treatments but not the same two. The third
instructor had all three treatments. Diagrammatically, the
design would, look something like the following:
TEACHER
I XXII X X
III XXXEach of the seven classes received laboratory exper-
iences in conjunction with their study of ratio and
similarity. The variable was in the sequencing of the lab-
oratory experience with the class discussion. The one
treatment group received their laboratory experiences before
the classroom instruction, hereafter referred to as the
exploratory-discovery method. The laboratory experience
consisted of a series of guided experiments on ratio and
similarity. The exploratory-discovery group received sixty
minutes of laboratory experience followed immediately by
thirty minutes of class presentation on the principles
observed in the experiments.

28
The second treatment group, hereafter referred to as
the verification-application group, received thirty minutes
of class presentation followed immediately by sixty minutes
of laboratory experience.
The third group, hereafter referred to as the com-
bination group, received thirty minutes of laboratory exper-
iences followed by thirty minutes of discussion, which was
followed by another thirty minutes of laboratory experiences,
In August, 1972, before undertaking their study of
ratio and similarity, all three groups were administered the
Myers -Briggs Type Indicator and a pretest on ratio and simi-
larity to determine their background knowledge on this topic,
(The pretest-posttest was designed by the author and will be
described in the next section.) They were also given the
opportunity to perform some laboratory experiments dealing
with area of a circle and the calculation of pi so that they
would be familiar with this method of instruction. After
the unit on ratio and similarity was completed, each group
was given a brief questionnaire dealing with their personal
reaction to the laboratory experience and a posttest.
The seven classes used had a total enrollment of 129
students. For a student to be included in the study it was
necessary to have four pieces of data on him. They were a
pretest score, a posttest score, a Myers-Briggs Type
Indicator classification, and an overall grade point average
for his work at Santa Fe Junior College. Deletion of those
subjects with incomplete data left a sample population of 9^

29
subjects. These 9^ subjects were categorized by treatment,
achievement level, and personality type.
The basis for determining a student's achievement
level was his overall grade point average (GPA) at Santa Fe
Junior College. At this junior college only four letter
grades were in use A, B, C, and W. A grade of A was
worth four points per semester hour of credit earned; a
grade of B was worth three points per semester hour of credit
earned; a grade of C was worth two points per semester hour
of credit earned; and a grade of W, which normally is not
used in the calculation of the GPA, was assigned one point
per semester hour of credit attempted. If a student's GPA
was greater than or equal to 3«35> be was termed a high-
achiever. If the GPA was between 2.65 and 3-35» be was
termed an average-achiever. If the GPA was less than or
equal to 2.65, he was classified a low-achiever. The dis-
tribution of the subjects taking into account treatment and
achievement level is shown in Table I.

30
TABLE I: Subject Distribution by Treatment andAchievement Level
High Average Low TotalAchievers Achievers Achievers
Exploratory- ^ 1Q , 2 qDiscovery
Verification-Application 8 k 9 21
Combination 31 9 l\, kk
Total 53 23 18 9^
In order to divide the students into two broad per-
sonality types, all subjects were administered the Myers-
Briggs Type Indicator. This test measures four dichotomous
dimensions of the personality. They are: judgment-
perception, thinking-feeling, sensing-intuition, and
extraversion-introversion. For the purposes of this study,
only the sensing-intuition dimension was used. (This test
will be described in detail in the next section.) On the
basis of this test, students were classified as sensing,
that is, using data perceived through the senses to draw
conclusions or make decisions; or as intuitive, that is,
tending to rely upon imagination and inspiration for
decisions. The distribution of the subjects taking into
account treatment and personality type is shown in Table II,
while Table III gives the distribution using the factors of
achievement level and personality type.

31
TABLE II: Subject Distribution by Treatment andPersonality Type
Sensing Intuitive Total
Exploratory-Discovery

32
forced choice, self-report inventory consisting of 166 ques-
tions and is designed to be used with normal subjects. It
is administered in a group setting and requires approximately
fifty-five minutes to complete.
The test purports to measure the following four
dichotomous dimensions: judgment-perception, thinking-
feeling, sensing-intuition, and extraversion-introversion.
Each student's answer sheet must be graded eight times to
obtain a preference for each of these dimensions. An
adjusted score is determined through the use of prepared
tables found in the Myers-Briggs Type Indicator Manual
.
This adjusted score gives not only a preference but also
an indication of the strength of that preference. Since the
present study dealt principally with a student's reasoning
ability, it was decided to use only the sensing-intuition
dimension. This dimension has been characterized in the
following way. "When people prefer sensing, they find too
much of interest in the actuality around them to spend much
energy listening for ideas out of nowhere. When people pre-
fer intuition, they are too much interested in all the
possibilities that occur to them to give a whole lot of
notice to the actualities" (Myers 1962, p. 51 )
.
The Myers-Briggs Type Indicator has been developed
over a twenty year period. The developers assert that it is
based on the Jungian theory of type, but the true dichotomy
of the dimensions has been questioned by a number of
psychologists. To determine content validity, split-half

33
reliability coefficients, corrected by the Spearman-Brown
prophecy formula, were calculated for each dimension at dif-
ferent grade levels. The sensing-intuition scale had a
reliability coefficient of 0.87 for college students.
Pretest-Posttest
In June 1972, twenty behavioral objectives on the
topic of ratio and similarity were developed. These were
submitted to a panel of judges consisting of three junior
college mathematics teachers. The panel assessed the objec-
tives and found them to be appropriate for both the topic of
study and the grade level. From these objectives a pretest-
posttest designed to assess the subjects' knowledge of ratio
and similarity was developed. One question was prepared for
each objective. The test was submitted to the same panel
and adjudged to be appropriate for the stated objectives.
The test was administered to the students in a sec-
tion of the required mathematics course which was not to be
involved in the study. There were twenty students in the
class. The results of this trial run were subjected to a
difficulty test using the following criterion: If X repre-
sents the number of correct responses to a particular ques-
tion, then the question is judged to be acceptable only if
.ION < X < ,90N, where N represents the total number of
students taking the test. According to this formula, all
questions were acceptable.
The test was then administered to all subjects in

3^
the seven experimental classes at the beginning and end of
the unit on ratio and similarity. Copies of the performance
objectives and pretest-posttest may be found in Appendix A.
Experiment Materials
All of the experiments used in this study were taken
from The Laboratory Approach to Mathematics by Kidd, Myers
and Cilley or from unpublished materials developed by
Kenneth P. Kidd. Some modifications in the materials used
were made. Copies of the experiments may be found in
Appendix B.
Statistical Treatment
The data gathered in the present study were analyzed
using the system of multiple linear regression. A computer
program called MANOVA was employed to compute the error sum
of squares and F-statistics for all main effects and
interactions. The criterion variable was the posttest error
scores while the pretest error scores were used as a
covariate. The calculated F-values were used to determine
whether to accept or reject the null hypotheses at a prede-
termined level of confidence. Scheffe's Method was also
used to determine whether reductions in error scores were
significant.

CHAPTER IV
ANALYSIS OF DATA
The first three hypotheses involve a comparison of
the exploratory-discovery method, the verification-
application method and the combination method without regard
to achievement level or personality type. The mean error
scores on the pretest and posttest for these hypotheses are
found in Table IV. Table V is the analysis of covariance
table for the entire study.
TABLE IV: Mean Error Scores for Subjects in theExploratory-Discovery Group, the Verification-Application Group and Combination Group on thePretest and Posttest
Exploratory-Discovery
Verification-Application
Combination
Hi . There is no significant difference between the meanposttest score of students in the exploratory-discovery group and the mean posttest score ofstudents in the verification-application group.
Pretest

36
«H
CO
Hcd
c<
oC,
O CD
•H >tH CD
•H hHCU'
•HDO
cd
3D<00
cco
Q)
S
cd
CO
o-
rH

37
H2. There is no significant difference between the meanposttest score of students in the exploratory-discovery group and the mean posttest score ofstudents in the combination group.
H3. There is no significant difference between the meanposttest score of students in the verification-application group and the mean posttest score ofstudents in the combination group.
Hypotheses H1-H3 state that there are no differences
among the mean error scores of subjects in the exploratory-
discovery group, the verification-application group and the
combination group. If these hypotheses are in fact true,
then differences as large or larger than those observed
could occur by chance 1^.1 percent of the time. The F-ratio
for method in Table V is less than that required for signif-
icance at the 0.05 confidence level, and hence none of the
null hypotheses H1-H3 can be rejected. This indicates that
there is no significant difference among the mean error
scores for the three methods. However, use of Scheffe''s
Method to compare the differences between the posttest and
pretest mean error scores indicates that the exploratory-
discovery group achieved a significantly greater reduction
in mean error score than either of the other methods. This
is shown by the 95 percent confidence intervals found in
Table VI.

38
TABLE VI: 95 Percent Confidence Intervals for Comparisons-Among the Exploratory-Discovery Group, theVerification-Application Group and theCombination Group
Method Contrasts ConfidenceInterval
Exploratory-Discovery minus66 0.63 2 to 2.Verification-Application J
Exploratory-Discoveryminus Combination 1<223 °' 257 to 2 * 189
Verification-Application ,R
, .
minus Combination -0.437 -1.508 to 0.634
Hypothesis H4 involves a comparison of sensing sub-
jects and intuitive subjects. The mean error scores for this
hypothesis are given in Table VII.
TABLE VII: Mean Error Scores of Sensing Subjects andIntuitive Subjects on the Pretest and Posttest
Pretest Posttest Difference
Sensing Subjects 8.700 5.420 3.280
Intuitive Subjects 8.114 4.205 3-909
H4. There is no significant difference between the meanposttest score of sensing students and the meanposttest score of intuitive students.
Hypothesis H4 states that there are no differences
between the mean error scores of subjects who have been
categorized as sensing and those who have been categorized
as intuitive. If this hypothesis is in fact true, then

39
differences as large or larger than those observed could
occur by chance 2.k percent of the time. The F-ratio for
personality in Table V exceeds that required for significance
at the 0.05 confidence level, and hence the null hypothesis
H4 can be rejected. This means that the sensing students did
significantly better on the posttest than the intuitive
students. This would imply that laboratory experiences are
more meaningful for those students who rely upon their senses
than for those who rely upon their feelings and imagination.
Hypotheses H5-H13 involve the comparison of the three
methods of instruction within achievement levels. Table VIII
shows the mean pretest scores and mean posttest scores for
high-achievers in the exploratory-discovery group, the
verification-application group and the combination group.
TABLE Villi Mean Error Scores for High-Achievers in theExploratory-Discovery Group, theVerification-Application Group and theCombination Group on the Pretest and Posttest
Pretest Posttest Difference
""SisS^ST 8 " 214 5 - 000 ^Verification-Application 6.000 3.750 2.250
Combination 7.000 3.77^ 3.226
The mean pretest scores and mea.n posttest scores for average-
achievers in the exploratory-discovery group, the verification-
application group and the combination group may be found in
Table IX.

40
TABLE IX: Mean Error Scores for Average-Achievers in theExploratory-Discovery Group, the Verification-Application Group and the Combination Group onthe Pretest and Posttest
Pretest Posttest Difference
^Ei^ovoT 12 '^ 5.800 6.800
MpuS 8.250 6.250
Combination 8.556 6.000 2.556
Table X displays the mean pretest scores and mean posttest
scores for low-achievers in the exploratory-discovery group,
the verification-application group and the combination group
TABLE X: Mean Error Scores for Low-Achievers in theExploratory-Discovery Group, the Verification-Application Group and the Combination Group onthe Pretest and Posttest
Pretest Posttest Difference
^iscoleT 9- 200 5.600 2.600
Verification-Application 9.778 6.000 3.778
Combination 10. 500 5. 000 5. 500
H5» There is no significant difference between the meanposttest score of high-achieving students in theexploratory-discovery group and the mean posttestscore of high-achieving students in the verification-application group.
H6. There is no significant difference between the meanposttest score of high-achieving students in the

An
exploratory-discovery group and the mean posttestscore of high-achieving students in the combinationgroup
.
H7. There is no significant difference between the meanposttest score of high-achieving students in theverification-application group and the mean posttestscore of high-achieving students in the combinationgroup.
H8. There is no significant difference between the meanposttest score of average-achieving students in theexploratory-discovery group and the mean posttestscore of average-achieving students in theverification-application group
.
H9. There is no significant difference between the meanposttest score of average-achieving students in theexploratory-discovery group and the mean posttestscore of average-achieving students in thecombination group.
H10. There is no significant difference between the meanposttest score of average-achieving students in theverification-application group and the mean posttestscore of average-achieving students in thecombination group.
Hll. There is no significant difference between the meanposttest score of low-achieving students in theexploratory-discovery group and the mean posttestscore of low-achieving students in the verification-application group.
H12. There is no significant difference between the meanposttest score of low-achieving students in theexploratory-discovery group and the mean posttestscore of low-achieving students in the combinationgroup,
H13. There is no significant difference between the meanposttest score of low-achieving students in theverification-application group and the mean posttestscore of low-achieving students in the combinationgroup
.
Hypotheses H5-H? state that there are no significant
differences among the mean error scores on the posttest of
high-achievers in the three laboratory sequencing treatments.
Hypotheses H8-H10 state that there are no significant

42
differences among the mean error scores on the posttest of
average -achievers in the three treatment groups. Hypotheses
HI 1 -HI 3 state that there are no significant differences
among the mean error scores on the posttest of low-achievers
in the three treatment groups. The F-values found in
Table V indicate that both main effects are not significant
at the 0.0.5 level of confidence. The F-ratio of 1.501 for
method-achievement interaction also is less than that required
for significance at the 0.05 confidence level. Therefore, we
cannot reject the hypothesis of no interaction. This also
means that we can reject none of the hypotheses H5-H13*
Use of Scheffe's Method to compare the differences
between the posttest and pretest mean error scores for
average-achievers indicates that the exploratory-discovery
group achieved a significantly greater reduction in mean
error scores than either of the other methods. This is
shown by the 95 percent confidence intervals found in
Table XI.

43
TABLE XI: 95 Percent Confidence Intervals for ComparisonsAmong the Ave rage -Ac hie vers in the Exploratory-Discovery Group, the Verification-ApplicationGroup and the Combination Group
Method
Exploratory-Discovery minusVerification-Application
Exploratory-Discoveryminus Combination
Verification-Applicationminus Combination
Use of Scheffe's Method to compare the differences
between the posttest and pretest mean error scores for low-
achievers indicates that the combination group achieved a
significantly greater reduction in mean error scores than
the exploratory-discovery group. This is shown by the 95
percent confidence intervals found in Table XII.
TABLE XII: 95 Percent Confidence Intervals forComparisons Among the Low-Achievers in theExploratory-Discovery Group, the Verification-Application Group and the Combination Group
Contrasts

Hypotheses HI 4 -HI 9 involve the comparison of the
three methods of instruction within personality types.
Table XIII shows the mean pretest scores and mean posttest
scores for sensing students in the exploratory-discovery
group, the verification-application group and the combination
group.
TABLE XIII: Mean Error Scores for Sensing Subjects inthe Exploratory-Discovery Group, theVerification-Application Group and theCombination Group on the Pretest and Posttest
Pretest Posttest Difference
BX^°sTTe7i «' 6" S.l« ».<*4
Verification-Application 7.15^ 5.07? 2.077
Combination 7.9^+7 4. 9^7 3.000
The mean pretest scores and mean posttest scores for intuitive
students in the exploratory-discovery group, the
verification-application group and the combination group may
be found in Table XIV.

Pretest

46
Hypotheses H14-H16 state that there are no signifi-
cant differences among the mean error scores on the posttest
of sensing subjects in the three laboratory sequencing
treatments. Hypotheses H17-H19 state that there are no sig-
nificant differences among the mean error scores on the
posttest of intuitive subjects in the three treatment groups
The F-ratios found in Table V indicate that only the main
effect of personality is significant at the 0.05 level of
confidence. The F-ratio of 0.578 for method-personality
interaction is less than that needed for significance at the
0.05 confidence level. Therefore, we cannot reject the
hypothesis of no interaction. This also means that we can
reject none of the hypotheses HI 4 -HI 9.
Use of Scheffe's Method to compare the difference
between the posttest and pretest mean error scores for
sensing students indicates that the exploratory-discovery
group achieved a significantly greater reduction in mean
error scores than either of the other methods. This is
shown by the 95 percent confidence intervals given in
Table XV.

47
TABLE XV: 95 Percent Confidence Intervals for ComparisonsAmong the Sensing Subjects in the Exploratory-Discovery Group, the Verification-ApplicationGroup and the Combination Group
Method Contrasts ConfidenceInterval
Exploratory-Discovery minus6 66 4 ^Verification-Application J
Exploratory-Discovery ^ 6minus Combination
Verification-Application6minus Combination »•?<-; j < ^ <^ »-jjv
Hypotheses H20-H37 involve the comparison of the
three methods of instruction within achievement levels taking
personality type into account. Table XVI shows the mean pre-
test scores and mean posttest scores for sensing high-
achievers in the exploratory-discovery group, the
verification-application group and the combination group.
TABLE XVI: Mean Error Scores for Sensing High-Achieversin the Exploratory-Discovery Group, theVerification-Application Group and theCombination Group on the Pretest and Posttest
Pretest Posttest Difference
Exploratory-Discovery
Verification-Application
Combination
7.143

48
The mean pretest scores and mean posttest scores for sensing
average -achievers in the exploratory-discovery group, the
verification-application group and the combination group may
be found in Table XVII.
TABLE XVII: Mean Error Scores for Sensing Average
-
Achievers in the Exploratory-Discovery Group,the Verification-Application Group, and theCombination Group on the Pretest and Posttest

49
Table XIX shows the mean pretest scores and mean posttest
scores for intuitive high-achievers in the exploratory-
discovery group, the verification-application group and the
combination group.
TABLE XIX: Mean Error Scores for Intuitive High-Achieversin the Exploratory-Discovery Group, theVerification-Application Group and theCombination Group on the Pretest and Posttest
Pretest Posttest Difference
Exploratory-6 ^ ,
Discovery y.^oo h-.+^v h-.o}/
Verification-Application 8.333 3*333 5.000
Combination 7. 118 3. 529 3. 589
The mean pretest scores and mean posttest scores for intui-
tive average-achievers in the exploratory-discovery group,
the verification-application group and the combination group
may be found in Table XX.
TABLE XX: Mean Error Scores for Intuitive Average-Achievers in the Exploratory-Discovery Group,the Verification-Application Group and theCombination Group on the Pretest and Posttest
Pretest Posttest Difference
Exploratory-Discovery 9.000 4.000 5.000
Verification-Application 13.000 7.500 5.500
Combination 7.667 4.667 3. 000

50
Table XXI displays the mean pretest scores and mean posttest
scores of intuitive low-achievers in the exploratory-
discovery group, the verification-application group and the
combination group.
TABLE XXI: Mean Error Scores for Intuitive Low-Achieversin the Exploratory-Discovery Group, theVerification-Application Group and theCombination Group on the Pretest and Posttest
Exploratory-Discovery
Verification-Application
Combination
H20. There is no significant difference between the meanposttest score of high-achieving sensing studentsin the exploratory-discovery group and the meanposttest score of high-achieving sensing studentsin the verification-application group.
H21 . There is no significant difference between the meanposttest score of high-achieving sensing studentsin the exploratory-discovery group and the meanposttest score of high-achieving sensing studentsin the combination group.
H22. There is no significant difference between the meanposttest score of high-achieving sensing studentsin the verification-application group and the meanposttest score of high-achieving sensing studentsin the combination group.
H23. There is no significant difference between the meanposttest score of average-achieving sensing studentsin the exploratory-discovery group and the meanposttest score of average-achieving sensing studentsin the verification-application group.
H24. There is no significant difference betv/een the mean
Pretest

51
posttest score of average-achieving sensing studentsin the exploratory-discovery group and the meanposttest score of average -achieving sensing studentsin the combination group.
H25. There is no significant difference between the meanposttest score of average-achieving sensing studentsin the verification-application group and the meanposttest score of average-achieving sensing studentsin the combination group.
H26. There is no significant difference between the meanposttest score of low-achieving sensing students inthe exploratory-discovery group and the mean post-test score of low-achieving sensing students in theverification-application group.
H27. There is no significant difference between the meanposttest score of low-achieving sensing students inthe exploratory-discovery group and the mean post-test score of low-achieving sensing students in thecombination group.
H28. There is no significant difference between the meanposttest score of low-achieving sensing students inthe verification-application group and the meanposttest score of low-achieving sensing students inthe combination group.
H29. There is no significant difference between the meanposttest score of high-achieving intuitive studentsin the exploratory-discovery group and the meanposttest score of high-achieving intuitive studentsin the verification-application group.
H30. There is no significant difference between the meanposttest score of high-achieving intuitive studentsin the exploratory-discovery group and the meanposttest score of high-achieving intuitive studentsin the combination group.
H31 • There is no significant difference between the meanposttest score of high-achieving intuitive studentsin the verification-application group and the meanposttest score of high-achieving intuitive studentsin the combination group.
H32. There is no significant difference between the meanposttest score of average -achieving intuitive stu-dents in the exploratory-discovery group and themean posttest score of average -achieving intuitivestudents in the verification-application group.

52
H33« There is no significant difference between the meanposttest score of average-achieving intuitive stu-dents in the exploratory-discovery group and themean posttest score of average-achieving intuitivestudents in the combination group.
H3^. There is no significant difference between the meanposttest score of average -achieving intuitive stu-dents in the verification-application group and themean posttest score of average -achieving intuitivestudents in the combination group.
H35. There is no significant difference between the meanposttest score of low-achieving intuitive studentsin the exploratory-discovery group and the meanposttest score of low-achieving intuitive studentsin the verification-application group.
H36. There is no significant difference between the meanposttest score of low-achieving intuitive studentsin the exploratory-discovery group and the meanposttest score of low-achieving intuitive studentsin the combination group.
H37. There is no significant difference between the meanposttest score of low-achieving intuitive studentsin the verification-application group and the meanposttest score of low-achieving intuitive studentsin the combination group.
Hypotheses H20-H22 state that there are no signifi-
cant differences among the mean error scores on the posttest
of high-achieving sensing subjects in the three laboratory
sequencing treatments. Hypotheses H23-H25 assert that there
are no significant differences among the mean error scores
on the posttest of average-achieving sensing subjects in the
three treatment groups. Hypotheses H26-H28 state that there
are no significant differences among the mean error scores
on the posttest of low-achieving sensing subjects in the
three treatment groups.
Hypotheses H29-H31 state that there are no signifi-
cant differences among the mean error scores on the posttest

53
of high-achieving intuitive subjects in the three laboratory
sequencing treatments. Hypotheses H32-H3^- assert that there
are no significant differences among the mean error scores
on the posttest of average-achieving intuitive subjects in
the three treatment groups. Hypotheses H35-H37 state that
there are no significant differences among the mean error
scores on the posttest of low-achieving intuitive subjects
in the three treatment groups.
The F-ratios found in Table V indicate that the main
effect of personality is the only one which is significant
at the 0.05 level of confidence. The F-ratio of O.982 for
method-achievement-personality interaction is less than that
required for significance at the 0.05 level of confidence.
Therefore, we cannot reject the hypothesis of no interaction.
In addition, ncne of the hypotheses H20-H37 can be rejected.
Use of Scheffe's Method to compare the differences
between the posttest and pretest mean error scores for
sensing high-achievers, indicates that the combination group
achieved a significantly greater reduction in mean error
scores than the verification-application group. This is
shown by the 95 percent confidence intervals found in
Table XXII.

5^
TABLE XXII t 95 Percent Confidence Intervals forComparisons Among the Sensing High-Achieversin the Exploratory-Discovery Group, theVerification-Application Group and theCombination Group
Method Contrasts ConfidenceInterval
Exploratory-Discovery minus n nno - ,n0 .„ a „/Verification-Application °' 972 -1
* 392 to 3 ' 336
Exploratory-Discovery4 g 6minus Combination J J JJ
Verification-Applicationg6 _ ; gminus Combination y
Use of Scheffe's Method to compare the differences
between the posttest and pretest mean error scores for sensing
average -achievers indicates that the exploratory-discovery
group achieved a significantly greater reduction in mean
error scores than either of the other groups. This is shown
by the 95 percent confidence intervals found in Table XXIII.
TABLE XXIII s 95 Percent Confidence Intervals forComparisons Among the Sensing Average-Achievers in the Exploratory-DiscoveryGroup, the Verification-Application Groupand the Combination Group
Method Contrasts ConfidenceInterval
Exploratory-Discovery minus 9.0?2 5. 575 to 12. 569Verification-Application
Exploratory-Discoveryfi 6minus Combination J 7 ^.x^w ,^ 7
Verification-Application ^ _6#g.
minus Combination J ^

55
At the conclusion of the study each student was
asked to complete a questionnaire designed to measure his
reactions to the laboratory experience. These questionnaires
have been tabulated according to instructional treatment. In
Table XXIV is the tabulation for the exploratory-discovery
group. In Table XXV, is the tabulation for the verification-
application group while the tabulation for the combination
group is given in Table XXVI. A few selected comments by
students in each of these groups will be found in the next
three sections. The comments were also tabulated by instruc-
tional treatment to give an indication of the frequency of
the various comments. These will be found in Tables XXVII,
XXVIII and XXIX. All three methods received both favorable
and unfavorable comments but the combination group seemed to
be the most popular.
Comments from the Exploratory-Disc oye_ry__Grqup
1. "I really enjoyed the experiment because you see thingsdifferent after you learn it especially the ratios andthings like that . ..."
2. "Excellent for students who have difficulty with theory."
3. "If someone is slow to grasp concepts, this method is
really hard to grasp. This method is fine for someonewho has a good background in something similar."
4. "Not enough time to complete all experiments."
5. "The experiments would have been good for a fourth gradeclass. As a college course they were terribly BORING."
6. "When I don't understand I quit."
7. "I think I could have learnt more with the aid of aninstructor previewing the work."

56
C omments from the Verification-Application Group
1. "The experiments were fun. It was like a learning game.Took the boredom out of the classroom."
2. "I found doing the experiments fun, and learned a greatdeal from doing them."
3. "It seems to be a pretty good method for teaching thissubject matter. It still could use some refinement."
4. "Experiments were well thought-out. They seemed a littlelengthy, though and I feel like there didn't need to beso many of them."
5« "I felt the experiments were too easy and the same thingcould have been taught quicker in a classroom lecture."
Comments for the Combination Group
1 . "It seems to visualize math and make it more understandingEasier to handle and appreciate. It also gives thestudent a chance to do work and exercise without fearof failing a test, trying. We need this approach more."
2. "Very good. I wish I could of done this type learningall the way through the math course."
3. "It beats listening to lectures type classes all periodand its easy to figure somethings out better on yourown.
"
4. "It all seemed too easy, more like a game than like math,although it did get the point across rather well."
5. "I feel being able to 'stick your hands into it' teachesyou more than watching someone else 'have all the fun'by being shown. I was very enthusiastic about it 1
1
"
6. "Try something else."
7. "Most people were confused and turned off by theexperiments ."

57
p,poPa
p
>>P.
opol
UorHPhXM0)
HPOtH
>iucd
£
CD
au
><
3-
to

58
ft

59
ftpopoCo
•HPaC•hX?Eoo0)
x:puoOn
>;PXeeP10
-aooo
PCD
><
tu
ON O-
c

60
TABLE XXVII: Summary of Comments for the Exploratory-Discovery Group
Frequency

CHAPTER V
SUMMARY, CONCLUSIONS, LIMITATIONS,AND IMPLICATIONS
Summary
The purpose of this study was to investigate the
relative effectiveness of the mathematics laboratory when
used in three different ways in conjunction with a tradi-
tional lecture-discussion approach to teach community
college freshmen enrolled in a required mathematics course.
The laboratory experience v/as used as an introduction to a
topic, as a reinforcer, or as both. All subjects were
classified by achievement level and personality type, as
determined by the Myers-Briggs Type Indicator, so that the
interaction of these factors with the various laboratory
approaches could be assessed. Previous research in scien-
tific fields other than mathematics had studied the question
of sequencing the laboratory experience with traditional
teaching techniques but had found no significant results.
These studies had not, however, taken achievement and/or
personality into account. Because of the current popularity
of the laboratory approach to teaching mathematics at all
grade levels, it was decided to examine the issue of
sequencing at the college level.
61

62
Ratio and similarity was selected as the unit to be
taught using the combination of laboratory experiments and
class discussion. This topic was selected for two reasons.
First, several years of teaching had shown it to be a topic
which was not familiar to the vast majority of college
freshmen. Second, twenty tested and refined experiments on
this topic were available.
A pretest-posttest was developed to determine a
subject's knowledge of ratio and similarity. This test was
submitted to a panel of judges for evaluation as to content
validity and appropriateness for the grade level. It was
also pilot tested on a class of freshmen mathematics stu-
dents at Santa Fe Junior College. Subsequently, the pretest
and Myers-Briggs Type Indicator were administered to seven
mathematics classes of college freshmen who had been
selected to participate in the study. These seven classes
were randomly assigned to one of three laboratory sequencing
patterns. Some groups received their laboratory experiences
before the class discussion; some received their laboratory
experience after the class discussion; and some received
laboratory experiences both before and after the class
discussion. All groups had the same length of time in the
laboratory. At the end of the unit, the test on ratio and
similarity was again administered. The error scores on the
pretest were used as a covariate while the posttest scores
served as the criterion variable. Prior to analyzing the
data, a college grade point average v/as determined for each

63
subject and used to classify him as a high-achiever,
average-achiever, or low-achiever. Only those students who
had taken the pretest, posttest and Myers-Briggs Type
Indicator were actually used in the study. There were 9^-
such students and these formed the sample for the study.
Each student was classified according to the method of in-
struction he received, his achievement level and his per-
sonality type as determined by the sensing-intuition scale
of the Myers-Briggs Type Indicator. This divided the sample
population into eighteen subcategories varying in size from
one to seventeen members.
The mean error scores for the eighteen groups were
compared in a 3*3x2 factorial design using multiple linear
regression techniques. A computer program called MAIMOVA was
used to perform an analysis of covariance. The calculated
F-ratios were used in testing the 37 null hypotheses.
Scheffe's Method was used to determine the significance of
reductions in mean error scores.
Conclusions
The following conclusions may be drawn from the
study:
1. In a comparison of the exploratory-discovery group, the
verification-application group and the combination group
there were no significant differences among the mean
posttest error scores. However, the exploratory-discovery

6k
group achieved a significantly greater reduction in mean
error score than either of the other groups.
2. In a comparison of sensing subjects to intuitive sub-
jects, without regard to achievement level or method,
the sensing subjects did significantly better than the
intuitive students. This would imply that laboratory
experiences are more meaningful to sensing students than
to intuitive students.
3. In a comparison of the three methods of instruction
within the high-achiever category without regard to
personality type, there were no significant differences
among the mean posttest error scores.
4. In a comparison of the three methods of instruction
within the average-achiever category without regard to
personality type, there were no significant differences
among the mean posttest error scores. The subjects in
the exploratory-discovery group did, however, achieve
a significantly greater reduction in mean error score
than either of the other groups.
5. In a comparison of the three methods of instruction
within the low-achiever category without regard to per-
sonality type, there were no significant differences
among the mean posttest error scores but the combination
group did attain a significantly greater reduction in
mean error score than the exploratory-discovery group.
6. In a comparison of the three methods of instruction for
sensing subjects, there were no significant differences

65
among the mean posttest error scores. However, subjects
in the exploratory-discovery group achieved a signifi-
cantly greater reduction in mean error score than either
of the other groups.
7. In a comparison of the three methods of instruction for
intuitive subjects, there were no significant
differences among the mean posttest error scores.
8. The interaction of method, achievement level and person-
ality type did not make a statistically significant dif-
ference in error scores on the posttest. The sensing
high-achievers in the combination group achieved a sig-
nificantly greater reduction in mean error score than
the verification-application group. The sensing average-
achievers in the exploratory-discovery group achieved
a significantly greater reduction in mean error score
than either of the other groups.
In general, the results of the present study support
the findings of Heuss (1970) and Emslie (1971). Although
there were no significant differences among the posttest
error scores for the three sequencing patterns, the signifi-
cant reductions in mean error scores do have some educational
implications. Significant reductions in the mean error score
were most frequently attained by the exploratory-discovery
group with the combination group a near second. The higher
percentage of favorable comments for the combination group
would suggest it is the better method in most situations.
In addition, this method allows for the greatest diversity

66
among the students in the class. Those students who learn
well on their own have an opportunity to discover new con-
cepts for themselves and to receive almost immediate confir-
mation from the teacher. The additional laboratory exper-
iences give further support to their findings. For those
students who have difficulty abstracting or generalizing, the
first laboratory experience may be frustrating and of limited
value. The laboratory experience after the class discussion
does, however, provide the opportunity to physically verify
what has been taught in the classroom.
Limitations
Some of the limitations of the study are as follows:
1. Each teacher did not use all three methods of
instruction. This means that teacher-method interaction
could not be checked. It was assumed in the present
study that the teacher effect would be nonsignificant.
2. The unit on ratio and similarity lasted for only two and
a half weeks. This may have effected the mean error
scores of low-achievers who possibly were slov/er in
adjusting to the new technique and in performing the
experiments
.
3. The concentration of the research on a single unit of
study may mean that the results are not valid for a
different topic and/or longer periods of study.
4. The unusual grading system of the junior college used in

67
the study may have skewed the achievement level cate-
gories so that some low-achievers were called average-
achievers and some average-achievers were called high-
achievers. This skewing may have affected the results
of the study within achievement levels.
5. The size of the sample population was smaller than
originally anticipated. This resulted in some mean
error scores being based on as few as one observation.
The results obtained cannot be safely generalized to
larger populations.
Implications
The present study contributes to the growing body of
information about the effectiveness of the mathematics labo-
ratory as a mode of instruction. Although none of the
sequencing patterns was found to be more effective than the
others, the significant difference between the two person-
ality types does have some implications for further research.
A study of personality interaction with a laboratory exper-
ience using all sixteen categories obtained from the Myers -
Briggs Type Indicator might prove informative. Further
research into the laboratory effectiveness within achieve-
ment levels also should be undertaken with greater rigor,
than v/as possible in this study, on the definitions of high-
achiever, average-achiever and low-achiever. As noted
earlier the combination method would seem to be the best

68
approach at present for all achievement levels and all
personality types.
Finally, it is hoped that this study will encourage
other studies dealing with the mathematics laboratory as an
adjunct to traditional modes of instruction at all levels of
education.

APPENDIX A
PERFORMANCE OBJECTIVES ANDPRETEST -POSTTEST

70
PERFORMANCE OBJECTIVES FOR RATIO AND SIMILARITY
1
.
The student should be able to write a ratio in the form
(a:b) to compare the cardinalities of two sets.
2. The student should be able to write a ratio in the form
(a:b) to compare the lengths of two line segments.
3. The student should be able to write an extended ratio
in the form (a:b:c) to compare the cardinality of three
sets .
4. The student should be able to write an extended ratio
in the form (a:b:c) to compare the lengths of three
line segments.
5. The student should be able to give two sets to illustrate
a particular ratio.
6. The student should be able to give two line segments to
illustrate a particular ratio.
7. The student should be able to give three sets to illus-
trate a particular extended ratio.
8. The student should be able to give three line segments
to illustrate a particular extended ratio.
9. The student should be able to partition two sets and
write the resulting equivalent ratio.
10. The student should be able to divide two line segments
into a specified number of congruent pieces and write
the resulting equivalent ratio.
11. The student should be able to translate verbal ratios
into symbolic ratios of the form (a:b).

71
12. The student should be able to determine when two ratios
are equivalent.
13. The student should be able to write (aib) = (c:d) in the
product form a x d = b x c.
14. The student should be able to supply the missing part
of a ratio needed to make two ratios equal.
Example: (a: ) = (c:d)
15* The student should be able to translate word problems
involving ratios into equations and solve them.
16. The student should be able to determine whether or not
two triangles are similar.
17. The student should be able to determine whether or not
two rectangles are similar.
18. The student should be able to construct a triangle which
is similar to a given triangle.
19. Given two similar figures, the student should be able to
find the constant of proportionality.
20. The student should be able to determine whether polygons
of more than four sides are similar or not.

72
PRETEST-POSTTEST
1
.
Write a ratio comparing the cardinality of the set
A = {"1,4,9,10} to the cardinality of set B = {2,5,6,?,ll}
in that order. Answer
2. Write a ratio comparing the length of line segment AB to
line segment CD, in that order.
_ T375 § C 1 DAnswer
3. Write a ratio comparing the cardinality of A = 12,3,5,7}
B = {1,4,6,9,10} and G = (l , 3,4, 5, 8, 9} , in that order.
Answer
4. Write a ratio comparing the lengths of line segments AB,
CD and EF, in that order.
A 1 B C 1 1/2 D E 2
Answer
5. Give an example of two sets whose cardinalities are in
the ratio ?:5- Answer
6. Draw two line segments whose lengths are in the ratio
2:3« Answer
7. Give an example of three sets whose cardinalities are in
the ratio 2:3:5.
Answer A = B = C =
8. Draw three line segments whose lengths are in the ratio
1:2:3. Answer
9- Divide each of the following sets into equal subsets and
express the resulting equivalent ratio.#
Answer
10. Divide each of the line segments in half and express the
resulting ratio.Answer
A 1 B C 2 D

73
11. Write a ratio to represent "for every two sweaters there
are three skirts." Answer
12. Which of the following ratios is equivalent to 3:4?
6:5 4:3 6:8 6:7 Answer
13. Express the statement (5 ! 7) = (10:14) as a product.
Answer
14. Fill in the blank to make the statement (3:5) =( :15)
true. Answer
15. If a bicycle wheel makes 10 revolutions in going 33 feet
how far does it travel in making 13 1/3 revolutions?
Answer
16. Which of the following triangles is similar to
triangle A?
Answer
1?. Which of the following rectangles is similar to
rectangle A?
15
Answer

19
74
Construct a triangle similar to the one at the left
with the indicated base line.
1 1/2
Given that the following two figures are similar, what
is the constant of proportionality when comparing the
left figure to the right figure?
9
Answer
20. Determine which of the following figures is similar to
figure A?

75
E
Answer

APPENDIX B
EXPERIMENTS

77
EXPERIMENT 1
Problem! How do you use ratios to compare the numbers ofobjects in two sets?
Material s i Envelope containing 15 paper clips, 18 nails,24 match sticks, 6 beans, 9 triangles, 24 square:
Procedures
:
Example: Refer to Figure 1. The two sets are comparedelement to element. You can see that there are
more hexagons than squares
.
Fig. 1
Refer to Figure 2. The two sets are compared setto set. There are squares andhexagons. We can write the comparison in the form(4:6). We call this comparison a rati o.
Fig.
Refer to Figure 3« Each set is separated into twoequivalent subsets. They are compared subset tosubset. The ratio (4:6) describes the comparisonby sets. The ratio (2: ) describes thecomparison by subsets.
Fig- 3

78
1. Complete each ratio. Watch the direction of the arrowto see which set comes first.
a) (3:
b) ( i5!
c) (
d)
In exercise 1 we compared (circle one)
a) the shapes of objects in two sets;b) the sizes of objects in two sets;c) the colors of objects in two sets;d) the numbers of objects in two sets.
3. Write three ratios to compare the number of triangleswith the number of squares in three different ways.
(12 ilO)

79
The first ratio means there are twelve triangles fore ve r
y
square s
.
The second ratio means there are triangles forevery ten squares.This ratio can also be written (3*5) » and it means
4. Refer to the envelope of paper clips, nails, matchsticks, and beans. Write a ratio for each of thefollowing:
a) The number of paper clips to the number of nails
b) The number of match sticks to the number of beans
c) The number of squares to the number of triangles
5. Here is how one group of students worked exercise 4.
a) Tom wrote (15*18) to describe the ratio of the numberof paper clips to the number of nails.Ma re i a wrote the ratio (5 s 6).Paul wrote (18:15) .
Which were right?
b) David wrote (6:24) to describe the ratio of thenumber of match sticks to the number of beans.Dana wrote the ratio (12:3) to describe the sameratio
.
Diane wrote (24:6).Which were right?
c) Three students wrote (3»8) to show the ratio of thenumber of squares to the number of triangles. Werethey right?
Write two more ratios that show this comparison.and
6. Write a ratio to compare the number of boys with thenumber of girls in your class.
7. Write a ratio to represent each of the following:
a) There are eighteen bicycles and thirty students.
b) There are two bicycles for every three students.
c) There are twice as many students as there arebicycles.
From THE LABORATORY APPROACH TO MATHEMATICS byKenneth P. Kidd, Shirley Myers, and David M. Cilley.
copyright 1970, Science Research Associates, Inc.Reproduced by permission of the publisher.

80
EXPERIMENT 2
Problem ; How do you use ratios to compare lengths ofobjects?
Materials ; 12-inch ruler, 1 red, 1 green, 1 yellow and1 black stick, nail, clothespin, centimeter ruler
Procedures ;
Example: Measure the red stick and the green stick ininches. The red stick is inches long. Thegreen stick is inches long.
The ratio ( :6) can be used to compare thelength of the red stick with that of the greenstick. The ratio (1: _) could also be used.This means "one for every two." The red stickhas a length of 1 inch for every inches ofthe green stick.
1. Measure each object and record the length.
a) red stick in.b) green stick in.c) yellow stick in.d) black stick in.e) nail in.f) clothespin in.
2. Write a ratio for each of the following:
a) The length of the yellow stick to the length of theblack stick.
b) The length of the nail to the length of theclothespin.
c) The length of a table to its width.d) Your height (inches) to your weight (pounds )
. _____e) The length of the red stick to the length of the
yellow stick.f) The length of the green stick to the length of the
black stick.g) The length of the yellow stick to the length of the
green stick.h) The length of the classroom to the width of the
classroom.
3. Pat's desk is 12 ice-cream sticks long and 8 ice-creamsticks wide. Circle the ratios that can be used tocompare its length with its width.
a) (8:12) c) (6:4) e) (2:3)b) (12:8) d) (3:2) f) (4:1)

81
4-. Yirite a ratio for each statement.
a) A wall had 5 feet of width for every 2 feet ofheight.
b) A dog was winning a tug-of-war with a boy, sincethere were 10 pounds of dog for every 8 pounds ofboy.
c) A very thin man v/eighs 130 pounds and is ?4 inchestall.
5. Refer to the line segments below. Measure each segmentusing the centimeter ruler. Let each letter representthe measure of the line segment. Complete the followingto indicate the ratios of these measures.
a.) (2:3) = (f:b) (5:2) = f
c) (1:3) =(
d) (7:5) =
)
From THE LABORATORY APPROACH TO MATHEMATICS byKenneth P. Kidd, Shirley Myers, and David M. Cilley.
copyright 19?0, Science Research Associates, Inc.Reproduced by permission of the publisher.

82
EXPERIMENT 3
Problem ; How do you illustrate a given ratio?
Materials : 10 red cubes, 20 blue cubes, 5 beans, 25 matchsticks, and 12-inch ruler
Procedures ;
1 . Suppose we wish to illustrate a matching of a set oftriangles with a set of squares that are in the ratio(3'^) • To do this, we might draw the following:
Complete the following drawing to illustrate the samerat i o
:
2.
3.
4.
A ratio for the number of tables to the number ofstudents is (1:4). How many tables are there for 28students? Therefore (1:4) =
( :28).
Place three red cubes and five blue cubes on the table.A ratio for the number of red cubes to the number ofblue cubes is
( : ) .
Add six red cubes for a total of nine. How many bluecubes must you have so that there are three red cubes forevery five blue cubes? A ratio for the numberof red cubes to the number of blue cubes is (9: ).We can say that (3:5) = (9: ).
Place four beans on the table . Place enough matchsticks on the table so that the ratio of the number ofbeans to the number of match sticks is (1:6) =
.

83
5. Draw line segments AB and CD so that a ratio for thelength of segment AB to the length of segment CD is(2:3). If segment AB is four inches long, how longwould CD be?
6. Draw segment GH so that a ratio of the length ofsegment EF (below) to the length of segment GH is (1:2)
Segment EF must have one unit of length for everyunits of length of segment GH.
7. Draw segment JK so that a ratio for the length ofsegment JK to the length of segment L1V] (below) is (2:3)
From THE LABORATORY APPROACH T_0 MATHEMATICS byKenneth P. Kidd, Shirley Myers, and David M. Cilley.
copyright 1970, Science Research Associates, Inc.Reproduced by permission of the publisher.

84
EXPERIMENT 4
Problem : How are ratios used to make comparisons?
Materials : Envelope containing 8 red squares and 12 bluesquares, egg beater
Procedures :
1. In the envelope there are eight red squares andblue squares. The ratio of the number of red squares tothe number of blue squares can be written as (8:12).
Red Blue
One student shows that there are four red squares forevery six blue squares. He uses the ratio (4:6). Asecond student prefers to match two red squares with
blue squares. His ratio is (2: ). The setof red squares can be compared with the set of bluesquares by any of these ratios: (8:12), (4: ),
( O).
First student's comparison
Second student's comparison

85
The ratio (2:3) means
a) There are red squares for every bluesquares
.
b) There are two-thirds as many red squares assquares.
c) For every red squares there are _ __ bluesquares.
Turn the handle of the egg beater. While the handlemakes one turn, the beater makes turns. Whilethe handle makes two turns, the beater makesturns. We can use the ratio to show that forevery turn of the handle the beater makesturns. The ratio (2: ) could also be used.
From THE LABORATORY APPROACH TO MATHEMATI CS byKenneth P. Kidd, Shirley Myers, and David M. Cilley.
copyright 19?0, Science Research Associates, Inc.Reproduced by permission of the publisher.

86
EXPERIMENT 5
Problem : How do you use extended ratios to compare thenumbers of objects in three sets or to comparethree measures?
Materials ; 3 green sticks, 3 blue sticks, 9 red cubes,15 green cubes, 21 blue cubes, 12-inch ruler,and masking tape
Proce dures
:
1. An extended ratio for the number of triangles to thenumber of squares to the number of circles, as picturedbelow, is (2:3:5).
OOOO O
Finish this drawing so that the number of triangles inthe first rectangle is to the number of squares in thesecond rectangle is to the number of circles in thethird rectangle as (2:3:5).
A AA A
Finish this drawing so that it also shows the extendedratio (2:3:5).
AAAAAA
In each of the drawings above, for every two trianglesthere are three squares and five circles. Make anotherdrawing, different from the first three, in which thecomparison of triangles with squares with circles is
(2:3:5).
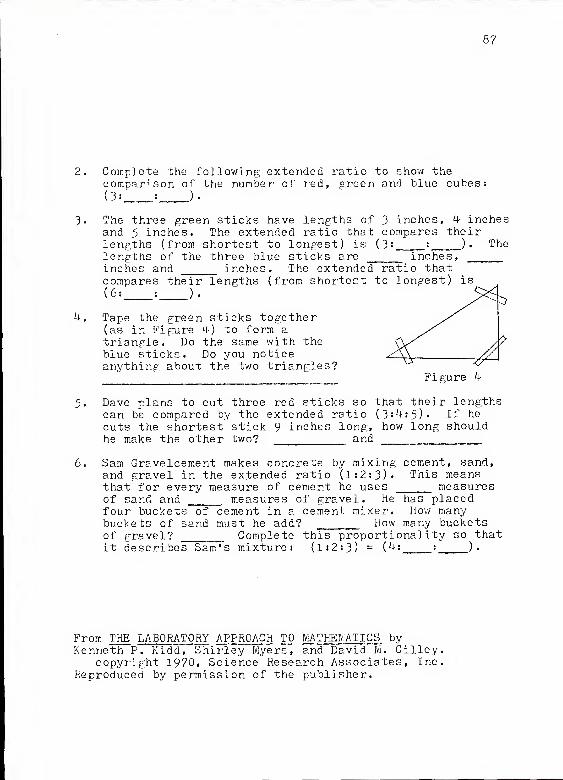
87
2. Complete the following extended ratio to show thecomparison of the number of red, green and blue cubes:(3i • )•
3. The three green sticks have lengths of 3 inches, 4 inchesand 5 inches. The extended ratio that compares theirlengths (from shortest to longest) is (3 '
'• )• Thelengths of the three blue sticks are inches,inches and inches. The extended ratio thatcompares their lengths (from shortest to longest) is
(6: : ).
4. Tape the green sticks together(as in Figure 4) to form atriangle. Do the same with theblue sticks. Do you noticeanything about the two triangles?
Figure 4
5. Dave plans to cut three red sticks so that their lengthscan be compared by the extended ratio (3 '4: 5) • If he
cuts the shortest stick 9 inches long, how long shouldhe make the other two? and
6. Sam Gravelcement makes concrete by mixing cement, sand,and gravel in the extended ratio (1:2:3). This meansthat for every measure of cement he uses measuresof sand and measures of gravel. He has placedfour buckets of cement in a cement mixer. How manybuckets of sand must he add? How many bucketsof gravel? Complete this proportionality so thatit describes Sam's mixture: (1:2:3) = (4: : ).
From THE LABORATORY APPROACH TO MATHEMATICS byKenneth P. Kidd, Shirley Myers," and David M. Cilley.
copyright 1970, Science Research Associates, Inc.Reproduced by permission of the publisher.

EXPERIMENT 6
Problem ; How do you write equal ratios and extended ratios?
Materials : 18 triangles, 12 small squares, 16 large squares,4 beans, and 24 match sticks
Procedure s
1
.
Place eight triangles and twelve small squares on thetable. What is the ratio of the number of triangles tothe number of squares?
2. Place the eight triangles and twelve squares in twoequal piles on the table. (One pile should contain thesame number of squares and the same number of trianglesas the other pile.) For every four triangles there are
squares. This ratio can be written __.
3. Next make four equal piles of the eight triangles andtwelve squares. In each pile place two triangles and
squares. For every two triangles there aresquares. This ratio can be written .
4. You should have written three different ratios. Eachratio represents the same comparison of the number oftriangles with the number of squares. Therefore theseratios are equal. That is, (8: ) = ( ;6) =
.
An equation relating two ratios is called a proportion.
5. Place sixteen large squares on the table. Pretend theyare sandv/iches to be divided among four hungry students.A ratio for the number of sandwiches to the number ofstudents is . Divide the sandwiches evenlyamong the four students. There are sandwichesfor each student. This ratio can be written ( «l).So, (16:4) = (_:1).
6. Place one bean and six match sticks on the table. Sixmatch sticks are needed for each bean. The ratio of thenumber of match sticks to the number of beans must be
(6: ). Place three more beans on the table with asmany match sticks as are needed. Since we will need
match sticks for the four beans, ( 6 : 1 ) = ( :4).
7. Place eight triangles, twelve small squares and sixteenlarge squares in a pile on the table. The extendedratio that compares triangles with small squares withlarge squares is ( :12: ).
Now make two equal piles. Place four triangles,small squares, and eight large squares in each pile

89
The extended ratio that compares the numbers of triangles,small squares, and large squares in each pile is
( = 18).
Finally make four equal piles. Place triangles,small squares, and large squares in each
pile. The extended ratio representing the comparison oftriangles with small squares with large squares in eachpile is .
You should have written three different extended ratios.They all represent the same comparison, so they are equalto one another. That is, = =
An equation relating a pair of extended ratios is aproportionality.
Supply the numbers missing from each ratio (or extendedratio) .
a) (7:3) = (,
»9)b) ( :2) =^T0:4)c) (1:12) = (5: )
d) (1:2:3) = ( i t 21 )
e) ( i15»17) = (foT Q4)f) ( :1) = (10:2)g) (8:24:26) = ( :12:
)
From THE LABORATORY APPROACH TO MATHEMATICS by Kenneth P. Kidd,Shirley Myers, and David M. Cilley.
copyright 1970, Science Research Associates, Inc.Reproduced by permission of the publisher.

90
EXPERIMENT 7
Problem : When are two ratios equal?
Mate rials : 12-inch ruler with mm markings
Procedures :
1. Measure segments AB, CD, and EF in inches (to the nearesthalf inch) and in centimeters (to the nearest millimeter)Record these measurements in the following table.Predict the length of segment GH in centimeters.
RATIO
AB

91
Def

92
EXPERIMENT 8
Problem : Do equal ratios have any special properties?
Materials : None
Procedures :
1. Fill in the missing numbers to make pairs of equal ratios:
a) (8:6) = (4: )
b) (4|r:2) = ( ~T4)c) (6:4) = ( il)d) (2.54:1) ^T 1 10)e ) (9*5) = ( T2Tf) (2:8) = ( il)
2. Suppose we start with any ratio (a:b), where a,b ^ 0.
How can we write a different ratio that is equal to (aib)?
3. A proportion is a statement that 2 ratios are equal. Aproportion has 4 terms. The outside ones are called theextremes . The inside ones are the means . In (9:2) =
(18:4) , the 9 and the 4 are the extremes and the 2 andthe 18 are the means.
For (9:2) = (18:4), find the product of the extremes.For (9:2) = (18:4), find the product of the means.How do the product of the extremes and the product of themeans compare?
4. Find the product of the extremes and the product of themeans for each of the following proportions.
ProportionProduct of the
Extremes
(6:4) = din)(4|:2) = (9:4)(5:12.7) = (10:25.4)
How do the two products compare in each case?
Product of theMeans
Product rule : In a true proportion the product of theextremes equals the product of themeans
.

93
5. Follow the rule to write each proportion as an equationinvolving products.
a) (2:3) = (8il2)b) (4:2) = (2:1)c) (2:3) = (111*)d) (3:8) = (6:16)e) (4:10) = (10:25)f) (54:10) = ( il)
g) (32i )= (6^:4)
6. Solve each proportion for
a) (4:) = (2:6)b) (4:127 = (10: )
c) (I20s2§) = ( il)d ) (3:5) = ( ,72?)ej
( :24) ^T3:4)f) (50:7.39) = ( :23.42)
2 x 12 = 3 x

94
EXPERIMENT 9
Problem ; How do you use a measuring wheel?
Materials ; 50-foot tape, measuring wheel and two stakes.
Procedure ;
1. Roll the measuring wheel through two turns. Measure thedistance the wheel traveled in making two full turns.Write a ratio for the number of turns of the wheel tothe number of feet it traveled.
2. Now roll the wheel in a straight line for twelve turns.The ratio of the number of turns to the number of feettraveled is (12; ). Find a number to replace .
Your ratio in the first problem v/as . So= (12; ). What must replace ?
3. Use the tape to measure the distance for twelve turns ofthe wheel. feet. How does this compare with youranswer in exercise 2?
4. How many turns must you roll the wheel to measure 100feet? (2:5) = ( ;100) In each ratio the first numberis the number of . The second number is thenumber of . What is your replacement for
?. ..
5. Measure a distance of 100 feet. Roll your wheel. Howmany turns did it take? How does your answercompare with your replacement for _____ in exercise 4?
6. Using your measuring wheel, place two stakes in theground 50 yards apart. These are the starting andfinishing positions for the 50-yard dash. Measure thedistance between the stakes with the tape.How does this answer compare with the ansv/er you got inexercise 5?
7. Roll the wheel for twenty-five turns. V/hat should thedistance be? Check the distance withthe tape
.
8. Measure a distance (say, 75 feet) along some curved patharound the school. Ask another member of your team tomeasure the same path. Compare your results.

95
9. How many turns will the wheel make in going a mile?
From THE LABORATORY APPROACH TO MATHEMATICS byKenneth P. Kidd, Shirley Myers, and David M. Cilley.
copyright 1970, Science Research Associates, Inc.Reproduced by permission of the publisher.

96
EXPERIMENT 10
Problem : How can you use ratios to measure speed?
Materials : 50-foot tape, measuring wheel, stop watch
Procedures :
1. Measure the distance you can walk in ten seconds. Writea ratio for the number of feet walked to the number ofseconds of walking. ( :10)
2. If you continued walking at this rate, you would be goingfeet every 10 seconds. How far would you go in
60 seconds? ( : 10) =( :60) (Find a replacement
for the .) In these ratios the first term is thenumber of feet and the second term is the number of
3. Walk in a straight line at normal speed for 60 seconds.Use the measuring wheel to measure the distance youwalked.
4. Wally Walker walked 50 feet in 10 seconds. His ratio ofthe number of feet traveled to the number of seconds oftraveling is (50:10) or (5:1). We say that Wally'swalking speed is 5 feet per second, or 5fps . How manyseconds would it take Wally to walk one mile (5280 feet)at this speed? This is the same as minutes and
seconds.
5. Ratios are frequently used to show speed. The secondterm of the ratio is usually 1
.
When comparing the number of feet traveled with thenumber of seconds of travelinga) the ratio (4:1) means 4 feet per second;b) the ratio (6:1) means ; andc) the ratio means 9 feet per second.
6. Roger Bannister was the first person to run one mile inless than four minutes. If he could have run for onehour at the rate of four minutes per mile, how many milescould he have run? His average speed was miles perhour (mph) . One mile is feet. Four minutes is
seconds. Therefore the ratio of the number offeet traveled to the number of seconds of traveling is(5280:240). (5280:240) =
( :l). What is the correctreplacement for ? Therefore we know that fpsis the same as 15 mph.
From THE LABORATORY APPROACH TO MATHSMATICS byKenneth P. Kidd, Shirley Myers, and David M. Cilley.
copyright 1970, Science Research Associates, Inc.Reproduced by permission of the publisher.

97
EXPERIMENT 11
Problem ; What is a ratio compass and how do you use it?
Materials : Ratio compass, centimeter ruler, worksheet 11
Procedures :
1. Place the bolt in the hole marked (2:3) on the ratiocompass and tighten the nut on the bolt. The compassnow has two short arms and two long arms. Open thecompass until the ends of the short arms are 10 centi-meters apart. Measure the distance between the ends ofthe longer arms. cm. Draw line segments AB andCD and complete the following: (length of segment AB:length of segment CD) = (2:3) = (10:_ ).
2. Complete the following chart for the (2:3) setting.
3.
Length of segment AB (cm.)

98
4. On the poster board is a triangle KLM such that side KLis 18cm. long, side LM is 24 cm. long, and side MK is30 cm. long. There is a 90° angle betv/een sides KL andLM. With the ratio compass set at (2?3), adjust thelarger opening to match side LM. Draw a line segmentequal in length to the distance between the points atthe smaller opening of the compass. Label it EF. Nowadjust the larger opening of the ratio compass to. sideKL. Draw a line segment equal in length to the distancebetween the points at the smaller opening of the compass.Draw this segment at point E so that if forms a 90° anglewith segment EF. Label it EG. Adjust the larger openingof the ratio compass to side MK . Compare the smalleropening with the distance betv/een points F and G.
5. Use proportions and the lengths of the sides of thelarger triangle to predict the lengths of the sides ofthe smaller triangle.
Measure the sides of the smaller triangle. How do theselengths compare with the results you got usingproportions?
From THE LABORATORY APPROACH TO MATHEMATICS byKenneth P. Kidd, Shirley Myers, and David M. Cilley.
copyright 1970, Science Research Associates, Inc.Reproduced by permission of the publisher.

99
WORKSHEET 11
pq
<

100
Problem:
EXPERIMENT 12
How can ratios help to predict events?
Materials : Thumbtack, solid with 4 colored faces (each facean equilateral triangle), and a pair of dice
Procedures :
1. When you toss a thumbtack, it will land in either of twoways. Toss a thumbtack twenty times. How many timesdid it land in position A (point up)? in position B?Guess the number of times it will land each way if youtoss it forty times. Toss the tack twenty more timesand total your results for forty tosses.

101

102
EXPERIMENT 13
Problem : How can you use a bicycle wheel to measure distance?
Materials ; 50-foot tape, bicycle wheel mounted on a fork,chalk, and string
Procedures :
1. Fix a mark on the ground. Starting at the mark, roll thewheel in a straight line. Measure (to the nearest tenthof a foot, 1 inch = .08 foot) the distance the wheeltraveled in making ten turns. feet What isthe ratio of the number of turns of the wheel to thenumber of feet traveled?
2. Fix two marks (A and B) on the ground about 70 pacesapart. Use the bicycle wheel and a proportion to findthe distance from A to B. (Remember: roll the wheel ina straight line.) Do this twice to check for accuracy.Then set up the following proportion:
(10: ) =( : )
distance number oftraveled turns from
in making A to Bten turns
Find the correct replacement for the last blank. Whatdoes this represent?
Use the tape to measure the distance from A to B.
feet How do your answers compare?(If your
answers differ by more than i foot, try again.
)
3. Now mark off 100 paces with two stakes. Measure thedistance, using the bicycle wheel and complete thefollowing proportion.
(10: ) =( . )
distance number oftraveled turns between
in making the marksten turns
4. Take the piece of string which is 5 feet long and use itto draw a circle with a radius of 5 feet. Make sure thestring is taut and straight at all times. Measure thedistance around this circle, using your bicycle wheel.Distance
:

103
5. Measure the distance along some path. Make the measure-ment twice. Compare your results with those of yourclassmates
.
From THE LABORATORY APPROACH TO MATHEMATICS byKenneth P. Kidd, Shirley Myers, and David M. Cilley.
copyright 1970, Science Research Associates, Inc.Reproduced by permission of the publisher.

104
EXPERIMENT 14
Problem ; How do you measure distances on a globe?
Materials : Globe of the earth, string
Procedures :
1. Locate the equator on the globe. The earth's equator is
25,000 miles long and contains 360 arc degrees. Thecurved lines that come together at the poles are calledmeridians. Find the meridian through Greenwich, England(near London). Locate the point where this meridiancrosses the equator. This will be our zero point. Fromhere we will measure distances along the equator. Theequator is marked off (in each direction) in arc degrees.Find where the equator passes through the Isle of Celebes(in the East Indies). It is arc degrees from ourzero point. Therefore ( : )
=
(360:25,000). So, the distance in miles from our zeropoint to the Isle of Celebes is .
2. How far is it from Chicago, Illinois, to Cairo, Egypt?The shortest path can be found by stretching a stringfrom Chicago to Cairo on the globe. Can you think of away of finding the number of arc degrees in the path?This path contains arc degrees. Complete thisproportion. Then solve it to find the distance fromChicago to Cairo. (360:25,000) = ( : )
3. Jacksonville, Florida, and Shanghai, China, are at aboutthe same latitude (31° N). Find the shortest path fromJacksonville to Shanghai. If you flew along this path,would you go east or west of St. Louis, Missouri?Would your flight take you north of the Arctic Circle?
What would be the length of your flight in arcdegrees? in miles? How farwould you fly if you traveled westward along the 31° N
latitude line from Jacksonville to Shanghai?
4. How far is it from Buenos Aires, Argentina to Paris,France? arc degrees; miles
From THE LABORATORY APPROACH TO MATHEMATICS byKenneth P. Kidd, Shirley Myers, and David M. Cilley.
copyright 1970, Science Research Associates, Inc.Reproduced by permission of the publisher.

105
EXPERIMENT 15
Problem ; What do ratios have to do with the enlargement offigures?
Materials : Cardboard polygons (ABCD and PQRS), centimeterstick, drawing of a dog, and a sheet of tracingpaper
Procedures :
1 . Do the cardboard polygons have the same shape? Compareeach angle of polygon ABCD with each angle of polygonPQRS. Draw lines to show the pairs of angles that havethe same measure
.
[_ DAB /_ SPQ
Z_ CBA Z_ pQ R
/__ DCB /__ SRQ
Z_ CDA Z_ PSR
2. Draw lines to show the pairs of corresponding sides anddiagonals. Measure each side and each diagonal, andcomplete the following table.
First polygon Second polygon
AB PQBC QRCD RSDA SPAC PRBD QS
Segment LengthABBCCDDAACBDPQQRRSSPPRQ3
3. Using the measurements from the table above, complete thefollowing ratios.
(length of AB : length of SP) = (18:12) = (3:2)(length of BC : length of PQ) = =
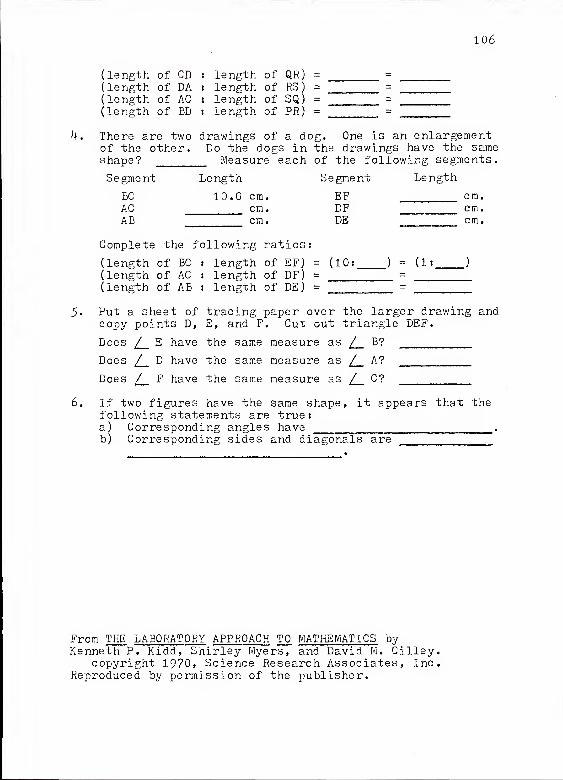
4.
5-
6.
106
(length of CD : length of QR) =
(length of DA : length of RS
)
=
(length of AC : length of SQ) =
(length of BD : length of PR) =
There are two drawings of a dog. One is an enlargementof the other. Do the dogs in the drawings have the sameshape? Measure each of the following segments.
LengthSegment
BCACAB
Length
10.0 cm.cm.cm.
Complete the following ratios:
(length of BC : length of EF)(length of AC : length of DF)(length of AB : length of D£)
Segment
EFDFDE
= (10:
cm.cm.cm.
) = (1:
Put a sheet of tracing paper over the larger drawing andcopy points D, E, and F. Cut out triangle DEF.
Does /__ E have the same measure as [__ B?
Does /__ D have the same measure as [__ A?
Does /__ F have the same measure as /__ C?
If two figures have the same shape, it appears that thefollowing statements are true:a) Corresponding angles have .
b) Corresponding sides and diagonals are
From THE LABORATORY APPROACH TO MATHEMATICS byKenneth P. Kidd, Shirley Myers, and David M. Cilley.
copyright 1970, Science Research Associates, Inc.Reproduced by permission of the publisher.

107
EXPERIMENT l6
Proble m: If two figures have the same shape, how do thelengths of their sides compare?
Materials ; Envelope containing 2 cardboard triangles and2 cardboard quadrilaterals, 12-inch ruler-cmscale, protractor
Procedure s
;
1. Refer to the triangles in the envelope. What do younotice about their shapes?
The triangles should be matchedin the following way:
Vert ices
Measure the sides of the triangles
PQ cm.QR cm.RP
mcm.
Write the ratios of the pairs of matching sides:
(length of side PQ : length of side BK ) =
(length of side QR : length of side BZ ) =
(length of side RP : length of side ZK) =

108
Definition : If two triangles are the same shape, thefollowing are true:a) Matching pairs of angles are the
same size.b) The ratios of the measures of the
matching sides are equal.
4. Refer to the cardboard figures KLIViN and CRSA. Thematching vertices are:
KL

109
EXPERIMENT 17
Problem : How do you use a mirror to find the height of anobject?
Materials ; Mirror, marble for leveling the mirror, string~
" " and weight, felt-tip pen, yardstick
Procedures :
1. Select an object whose height you would like to find.(The area around its base must be level.) Mark a pointin the middle of the mirror with the felt-tip pen.Label the point M. Lay the mirror flat of the floor andlevel it.
2. Stand where you can do both of the following (see thefigure )
.
a) Lean slightly forward and hold a plumb line to youreye (E) so that it touches the floor at a point (A).
b) See the top of the object at M on the mirror.
3. Have a partner mark point A and point B at the base ofthe object you are measuring.
Measure segment EAMeasure segment MAMeasure segment MB
1 inch = .08 ft.

110
4. How are triangle EAM and triangle CBI'.'l related? Use aproportion and the results of exercise 3 to find thelength of BC.
5. Repeat the experiment, placing the mirror a differentdistance from the foot of the object. How do your tworesults compare?
From THE LABORATORY APPROACH TO MATHEMATICS byKenneth P. Kidd, Shirley Myers, and David M. Cilley.
copyright 19?0, Science Research Associate, Inc.Reproduced by permission of the publisher.

Ill
EXPERIMENT 18
Purpose ; To introduce the student to the idea of similarityfor triangles and quadrilaterals.
Materials : Envelope containing red, blue and white triangles,and red, blue and white quadrilaterals.
Procedures :
1 . The red cardboard triangles are alike in some way otherthan color. The blue triangles are not like the redtriangles in this v/ay. In what way are the red trianglesalike?Which of the white cardboard triangles are like the redtriangles in this way?
The red quadrilaterals are alike in some way other thancolor. The blue quadrilaterals are not like the redquadrilaterals in this way. In what way are the redquadrilaterals alike?
Which of the whitequadrilaterals are like the red quadrilaterals?
3. From this we see that two triangles are alike if theyhave the same . Likewise, twoquadrilaterals are alike if they have the same
4. Two triangles which have the same shape are said to besimilar . Not all triangles are .
5. Two quadrilaterals which have the same shape are said tobe similar . Not all quadrilaterals are .

112
EXPERIMENT 19
Purpose : To illustrate the one-to-one correspondence betweenvertices and sides of similar triangles andquadrilaterals
.
Materials ; Red triangle, white triangle, yellow quadrilateraland white quadrilateral
Procedures :
1 . The red triangle ABC has the same shape as the whitetriangle DEF. Establish a one-to-one correspondencebetween the corresponding vertices of the two trianglesand the corresponding sides. Draw lines connecting thecorresponding parts.
Vertices Sides
A D
B E
C F
2. The yellow quadrilateral LNKM has the same shape as thewhite quadrilateral RPTS . Establish a one-to-onecorrespondence between the corresponding vertices andsides of the two quadrilaterals. Draw lines connectingthe corresponding parts.
Vertices Sides
AB

113
EXPERIMENT 20
Purpose : To show how one triangle may be used to constructa similar triangle.
Materials ; Yellow cardboard triangle, ruler
Procedures :
1. The yellow cardboard triangle ABC has a side AB which is
15 inches long. Use only the yellow cardboard triangleand a pencil to draw triangle A'B'C which is similar to
ABC, on line A'B' which is 5 inches long.
Measure B'CHow long do you think BC is? [Do not measure.)Measure BC
Measure A'CHow long do you think AC is? (Do not measure.)Measure AC
i
2. Write a ratio comparing BC to B'CWrite a ratio comparing AC to A'CWhat is the relationship between these two ratios?
This ratio could also be expressed as ( ;1 )
.
3. To change triangle ABC into triangle A'B'C, it would be
necessary to multiply the length of each side byThis number is called the constant of proportionality .

114
EXPERIMENT 21
Purpose : To show that two angles and one side are sufficientto construct a similar triangle.
Materials ! Yellow triangle that has been cut apart, ruler.
Procedures ;
If two triangles are similar, then the ratio of the
three pairs of corresponding sides is equal. The yellowtriangle has been cut apart. Leave the top of the yellowtriangle folded under. Make a small triangle that is similarto the larger triangle. You may use any ratio of
corresponding sides that you care to use. With this informa-tion compute the length of AC and BC of the large yellowtriangle without actually measuring.
Length of AC isLength of AC using a ruler is
Length of BC isLength of BC using a ruler is
Choose a different ratio and repeat the above procedure
Length of AC isLength of AC using a ruler is
Length of BC isLength of BC using a ruler is
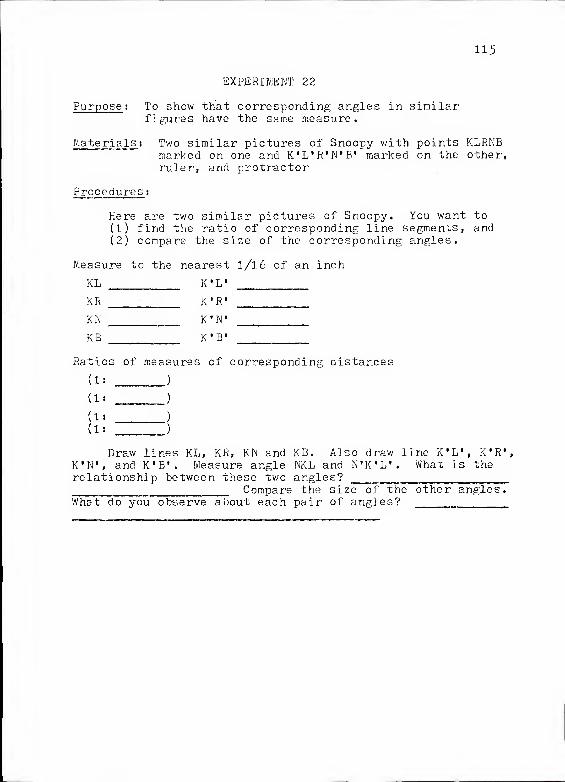
115
EXPERIMENT 22
Purpose ; To show that corresponding angles in similarfigures have the same measure.
Materials; Two similar pictures of Snoopy with points KLRNBmarked on one and K'L'R'N'B* marked on the other,ruler, and protractor
Procedures
:
Here are two similar pictures of Snoopy. You want to(1) find the ratio of corresponding line segments, and(2) compare the size of the corresponding angles.
Measure to the nearest l/l6 of an inch
KL K'L*
KR K*R'
KN K'N*
KB K'B»
Ratios of measures of corresponding distances
(1: )
(n )
(l: )
(H )
Draw lines KL, KR, KN and KB. Also draw line K'L', K'R',K'N*, and K'B'. Measure angle NKL and N'K'L*. What is therelationship between these two angles?
_
Compare the size of the other angles.What do you observe about each pair of angles?

116
EXPERIMENT 23
Proble m: To stress the importance of establishing all three"
conditions needed to show similarity between twopolygons if the polygons are of more than threesides .
Materials ; Ruler
Proce dures
:
Look at the two hexagons on the next page
.
1. If possible, draw lines showing one-to-one correspond-ences between corresponding vertices and correspondingsides .
VERTICES SIDES
A B' AB E'F'
B E* BG A'B'
G D' GD D'E'
D A* DE F'A'
E C' EF B'G*
F F* FA CD"
2. Are the corresponding sides proportional? Ifso, what is the ratio of proportionality?
3. What can be said about the measure of correspondingangles?
ABG A'B'C DEF D'E'F'
BCD B'C'D' EFA E'F' A'
CDE C'D'E' FAB F'A'B'
k. Are the hexagons similar?
5. Vvrhat three things must be true for figures of more thanthree sides to be similar?

11?

BIBLIOGRAPHY
Becker, Jerry P. "An Attempt to Design InstructionalTechniques in Mathematics to Accommodate DifferentPatterns of Mental Ability" (Stanford University, 1967)Dissertation Abstracts, 28A:957, September 196?.
Begle, Edward G. ed. Mathematics Education. Sixty-ninthYearbook of the National Society for the Study ofEducation. Chicago: The University of Chicago Press,1970.
Bluman, Allan George. "Development of a Laboratory Methodof Instruction in Mathematics at the Community College"(University of Pittsburgh, 1971) DissertationAbstracts, 32A:1970, October 1971.
Buffie, Edward, Welch, Ronald C. and Paige, Donald.Mathematics : Strategies of Teaching . Englewood Cliffs,N. J.: Prentice-hall, Inc., 1968.
Campbell, Donald T. and Stanley, Julian C. Experimentaland Quasi -Experimental Designs for Research . Chicago:Rand McNally and Company^ 19 63
•
Cobb, H. E. "The Need of a Perry Movement in MathematicalTeaching in America," Mathematical Supplement of SchoolScience ,' III (October, 1903), 1 21-121+, 15^-158.
Cohen, Martin Seymour. "A Comparison of Effects ofLaboratory and Conventional Mathematics Teaching UponUnderachieving Middle School Boys" (Temple University,1970) Dissertation Abstracts , 31A:5026, April 1971.
Dunning, James E. "Values and Humanities Study: AnOperational Analysis of the Humanities Using the Myers-Briggs Type Indicator" (Claremont Graduate School andUniversity Center, 1970) Dissertation Abstracts ,
32A:785, August 1971. "" ~
Emslie, Charles Milne. "Teaching Fourth and Sixth GradeScience Using Laboratory-Theory and Theory-LaboratorySequence Methods of Instruction" (University ofMichigan, 1971) Dissertation Abstracts, 32A:6237,May 1972.
118

119
Glass, Gene V and Stanley, Julian C. Statis tical Methodsin Education and Psychology . Englewood Cliffs, N. J.:Prentice -Hall, Inc., 1970.
Howes, Virgil. Ind i vidualizing Instruction in Scie nce andMathematics . 'New York: Macmillan, 1970.
Kidd, Kenneth P., Myers, Shirley S. and Cilley, David M.The Laboratory Approach to Mathemati cs_. Chicago!Science Research Associates, Inc., 1970.
Kieren, Thomas E. "Activity Learning," Review of EducationalResearch, XXXIX (October, 1969), 509-522.
Koran, Mary Lou. "Differential Response to Inductive andDeductive Instructional Procedures," Journal of_
Educational Psyc hology, LXII (August, 1971), 300-307.
Krumboltz, John D. and Yabroff, William W. "The ComparativeEffects of Inductive and Deductive Sequences inProgrammed Instruction," American Educational ResearchJournal , II (November, 1965), 223-235*
Mendelsohn, Gerald A. "Myers-Briggs Type Indicator," inSixth Mental Measurements Yearbook . Ed. Oscar Buros
.
Highland Park, N. J.: The Gryphon Press, 1970,1126-1127.
Mock, Gordon D. "The Perry Movement, " The MathematicsTeacher , LVI (March, 1963), 130-133.
Myers, Isabel Briggs. The Myers-Briggs Type Indicator .
Princeton, N. J.: Educational Testing Service, 1962.
Peterson, John Charles. "Effect of Exploratory HomeworkExercises Upon Achievement in Eighth Grade Mathematics"(Ohio State, 1969) Dissertation Abstracts , 30A:4339,April 1970.
Phillips, Jerry Wayne. "Small Group Laboratory Experiencesas an Alternative to Total Group Instruction forCollege Low Achievers in Mathematics" (IndianaUniversity, 1970) Dissertation Abstracts, 31A:59^5.May 1971 .
~~
Reuss, Ronald Merl. "A Comparison of the Effectiveness ofThree Different Laboratory Approaches on Students ofHigh School Biology" (State University of New York atBuffalo, 1970) Dissertation Abstracts , 31A:2264,November 1970.

120
Smith, Jerry Miller. "A Study of the Effect of LaboratoryExperience in a Mathematics Glass" (West VirginiaUniversity, 1970) Dissertation Abstracts , 31A:2023,November 1970. ""
~ "' "
"
Snedecor, George W. and Cochran, William G. StatisticalMethod s, 6th ed. Ames, Iowa: The Iowa State UniversityPress, 1967.
Sobel, Max A. "Concept Learning in Algebra," The MathematicsTeacher, XLIX (October, 1956), 425-430.
"""" """
Strieker, Lawrence J., and Ross, John. "Some Correlates of
a Jungian Personality Inventory," Psychology Rep. , XIV(April, 1964), 623-643.
'
Tanner, Richard T. "Expository-Deductive VS Discovery-Inductive Programming of Physical Science Principles"(Stanford University, 1968) Dissertation Abstracts ,
29A:l480, November 1968.
Wilkinson, Jack Dale. "A Laboratory Method to Teach Geometryin Selected Sixth Grade Mathematics Classes" (Iowa StateUniversity, 1970) Dissertation Abstracts, 31A:4637,March 1971 .
"™"'
Young, J. W. A. "What is the Laboratory Method?"Mathematical Supplement of School Science , III (June,
1903), 50-56.

BIOGRAPHICAL SKETCH
Joan Marie Golliday was born July 28, 19^2, in
Woodbine, Maryland. At a few months of age, she moved with
her parents to Sykesville, Maryland, where she attended public
school. She graduated from Sykesville High School in June,
i960, and in September of that same year, enrolled at Florida
Southern College in Lakeland, Florida. While there, she
pursued an undergraduate program in mathematics and received
the degree of Bachelor of Science, summa cum laude , in May of
1964. For the next two years, she held the position of
Graduate Teaching Assistant in the mathematics department of
the University of Florida. In August, 1966, she received the
degree of Master of Arts in mathematics. From September,
1966, until June, 1968, she taught mathematics at Santa Fe
Community College while continuing as a part-time graduate
student in the College of Education at the University of
Florida. In June of 1968, she was awarded a one-year
Graduate School Fellowship which enabled her to attain the
degree of Specialist in Education in August 1969 • Since
September of 1969* she has been employed at Santa Fe
Community College while completing the requirements for the
degree of Doctor of Philosophy with specialization in
mathematics education.
121

122
Joan Marie Golliday is a member of Phi Kappa Phi,
Pi Lambda Theta, Kappa Delta Pi, the Florida Council of
Teachers of Mathematics, the Florida Junior College Council
of Teachers of Mathematics, and the National Council of
Teachers of Mathematics.

I certify that I have read this study and that inmy opinion it conforms to acceptable standards of scholarlypresentation and is fully adequate, in scope and quality,as a dissertation for the degree of Doctor of Philosophy.
Dr. Kenneth P. Kidd, ChairmanProfessor of Education
I certify that I have read this study and that inmy opinion it conforms to acceptable standards of scholarlypresentation end is fully adequate, in scope and quality,as a dissertation for the degree of Doctor of Philosophy.
PCM&Zl
Dr. Slroy JAssociate Pro]
'm, C-)lduc, Gochairman;sor of Education
I certify that I have read this study and that inmy opinion it conforms to acceptable standards of scholarlypresentation and is fully adequate, in scope and quality,as a dissertation for the degree of Doctor of Philosophy.
Dr. /Vynce A. HiresProfessor of Education

I certify that I have read this study and that inmy opinion it conforms to acceptable standards of scholarlypresentation and is fully adequate, in scope and quality,as a dissertation for the degree of Doctor of Philosophy.
JL> V ttsJ~Dr. Charles Warren NelsonAssociate Professor of
Mathematics and Education
This dissertation was submitted to the Dean of the Collegeof Education and to the Graduate Council, and v/as acceptedas partial fulfillment of the requirements for the degreeof Doctor of Philosophy.
August, 19?4
Dean, Colleger/of Education
Dean, Graduate School

UNIVERSITY OF FLORIDA
3 1262 08553 0912