an investigation of service quality in the healthcare …/media/worktribe/output-176946/... · web...
TRANSCRIPT

An Investigation of Service Quality in the Healthcare Sector
A Study of an Independent Private Physiotherapy Practice
Audrey Helen Gow
A thesis submitted in partial fulfilment of the requirements of Edinburgh Napier University, for the award of Doctor
of Business Administration
Submitted May 2014

Declaration
I declare that this thesis is my own work and that all critical and other sources
(literary and electronic) have been specifically and properly acknowledged, as and
when they occur in the body of the text.
Signed: Audrey Gow
Date: 29 May 2014
i

Acknowledgements
I would like to thank the following people for my academic journey:
My supervisory team, Professor Anne Munro for her guidance, ‘funnelling’, scribbles,
(I knew what they meant), her words of comfort when the going got tough, her calm
exterior and leadership of the whole process – thank you very much Anne, I couldn’t
have achieved this without you!
To Dr. Shuna Marr who is a stickler for detail (and I am not, or I wasn’t, but I am now),
thank you Shuna. For the formatting and editing of this document that would not have
been possible if Shuna had not spent time with me on that learning process – thank you
very much Shuna.
To Dr. Ahmed Hassanien for ensuring that I ‘dug deep’ into the literature where real
‘nuggets’ were found. Thank you Ahmed for all your support and guidance on a thesis
that you came late to, but contributed fully to – thank you Ahmed.
To the Directors and staff of The Practice for their kind permission for allowing me to
carry out this study on their premises.
To my research buddies Noreen and Christine, who kept me going, reflecting and
‘trucking’, thank you Noreen and Christine.
To my wonderful husband John for editing and for picking me up when I hit those
‘brick walls’. For pushing me through those ‘brick walls’ and for keeping me motivated
- thank you Johnny!
And finally to my two sons, Archie and George who are still in further education. They
have supported me throughout this process and have been proud of me every step of the
way. I hope that one day they may perhaps undertake a similar journey. I dedicate this
thesis to Archie and George – with much love, Mum xx.
ii

Abstract
This study was concerned with an investigation into the service quality of an
independent private physiotherapy practice using a mixed method approach. The
Directors of the private physiotherapy practice (the practice) required an understanding
of their customer services; however, this did not include the services of the treatment. It
was anticipated that the findings of the study would enhance the service quality of the
practice in order that it may remain competitive.
A review of the literature revealed a gap for the independent private practice and, in
particular, a gap in service quality.
The two main debates in the literature pertained to the instrument of measurement for
service quality and the appropriate conceptual model. The literature review suggested
that the SERVQUAL Instrument was the most suitable method to meet one of the
objectives of this study. It also revealed that there were two main models of service
quality (American and Nordic) and that the American model was the conceptual model
most related to services and therefore suited to the objectives of this study.
The study comprised of two phases, phase one was the more dominant phase and was
accomplished utilising the SERVQUAL Instrument with a sample of 62 practice
customers. The analysis in phase one informed the basis for the semi-structured
interviews for the second phase. Phase two specifically investigated areas of the service
quality where customers had rated their perceptions lower than their expectations. Nine
interviews were conducted for phase two.
The key findings for phase one identified, that overall, the service quality of the practice
was positive. This was in contrast to other healthcare studies that were in the UK public
healthcare sector. On further analysis it was revealed that there were areas of service
quality that the customers had rated with a negative perception, in particular the
reliability factor. Further, phase one identified that previous experience of
physiotherapy services significantly influenced the customers’ expectations of services.
In addition the study was in accord with previous literature that suggested that
expectations were also culture and socio economic dependent.
The key findings for phase two identified that an investigation into negative perceived
service quality was crucial to understanding the ‘why’ of the customers’ perception of iii

the service quality of the practice. Phase two revealed that not only were customers’
expectations formed through experiences, but also that perceptions were formed through
other people’s experiences i.e. relatives. Another key finding in phase two was, that
despite the customers being informed on several occasions that the study was in relation
to service quality and not the treatment, they could not distinguish between the two
constructs.
Finally, the study concluded that the SERVQUAL Instrument was suitable for the
independent private practice and should be slightly amended to fit the context and
culture of the study. In addition, it was concluded that it was of academic and
managerial benefit to measure both the expectations and the perceptions of service
quality. The core service (service quality and treatment) is required to be taken into
consideration in any future healthcare study. Face to face interviews sequentially
following the analysis of the SERVQUAL questionnaire provided deeper and perhaps
more meaningful information. The data and information gathered could be translated
into staff training to maintain the competiveness of the service quality of the practice.
iv

Contents
Declaration..................................................................................................i
Acknowledgements....................................................................................ii
Abstract.....................................................................................................iii
List of Figures............................................................................................5
List of Tables.............................................................................................5
List of Graphs.............................................................................................6
Chapter One – The Introduction....................................................................7
1 Introduction.............................................................................................7
1.1 The Aim..........................................................................................................................9
1.2 The Objectives................................................................................................................9
1.3 The Study......................................................................................................................10
1.4 The Structure of the Thesis...........................................................................................11
Chapter Two – A Review of the Service Quality Literature.......................12
2 Introduction...........................................................................................12
2.1 The Nature of the Service Industry...............................................................................12
2.2 The Nature of Customer Satisfaction and Service Quality............................................14
2.3 The Service Quality Concept.............................................................15
2.4 The American Approach to Service Quality..................................................................15
2.4.1 The Gaps Model of Service Quality............................................................................19
2.5 The Nordic Approach to Service Quality.......................................................................21
2.6 Other Models...............................................................................................................24
2.7 Service Quality Models in the Healthcare Setting.........................................................24
2.8 Service Quality Instruments.........................................................................................26
2.8.1 Why Measure Expectations and Perceptions?..........................................................261

2.8.2 SERVQUAL and its Characteristics.............................................................................27
2.8.3 Criticisms of the SERVQUAL Instrument....................................................................28
2.8.4 The SERVPERF Instrument.........................................................................................30
2.8.5 The SERVPEX Instrument...........................................................................................31
2.8.6 A Comparison of SERVQUAL, SERVPERF and SERVPEX..............................................31
2.8.7 SERVQUAL Vs SERVPERF............................................................................................32
2.9 Service Quality in the Healthcare Sector...........................................34
2.9.1 SERVQUAL and the Healthcare Sector.......................................................................34
2.10 A Review of Studies in the Healthcare Industry..........................................................44
2.10.1 Healthcare Sector Studies.......................................................................................45
2.11 Service Quality in the Physiotherapy Industry................................54
2.11.1 A Review of Studies in the Physiotherapy Industry.................................................57
2.12 Conclusion of the Literature Review...............................................60
2.12.1 The Gaps from the Literature Review, Research Questions and Conceptual Model...........................................................................................................................................62
2.12.2 The Conceptual Model for the Study.......................................................................63
Chapter Three – Methodology...................................................................65
3 Introduction...........................................................................................65
3.1 Theoretical Perspective................................................................................................66
3.2 Post Positivism..............................................................................................................67
3.3 Critical Realism.............................................................................................................68
3.4 Research Approach.......................................................................................................69
3.5 Research Design, Phase One..............................................................71
3.5.1 The Sample and Pilot Study.......................................................................................73
3.5.2 The Distribution Process Tested in the Pilot Study....................................................73
3.6 Phase One of the Main Study.............................................................74
3.6.1 Validity and Reliability of the SERVQUAL Instrument for the Main Study.................75
2

3.6.2 Data Analysis for the Main Study..............................................................................75
3.7 Phase Two of the Main Study............................................................76
3.7.1 Research Design Phase Two......................................................................................76
3.7.2 The Interview Sample................................................................................................77
3.7.3 The Interview Design.................................................................................................78
3.7.4 The Interview conducted in the Phase One Pilot Study.............................................78
3.7.5 Data Analysis.............................................................................................................79
3.8 Ethics of the Study........................................................................................................80
3.9 Reflections on the Methodology of Phase One and Phase Two...................................82
Chapter Four – Phase One: The Results of the SERVQUAL Questionnaires.............................................................................................84
4 Introduction...........................................................................................84
4.1 Overview of the Responses for The Practice................................................................84
4.2 Analysis of the SERVQUAL Questions (as amended).....................................................87
4.3 Highest Mean Gap Score for Each Determinant...........................................................92
4.3.1 Reliability...................................................................................................................95
4.3.2 Empathy....................................................................................................................98
4.4.4 Tangibles...................................................................................................................99
4.4.5 Responsiveness.......................................................................................................101
4.4.6 Assurance................................................................................................................103
4.4.7 Servicescape............................................................................................................105
4.5 Conclusion of Phase One.................................................................106
Chapter Five- Phase Two: The Results of the Face to Face Interviews....110
5 Introduction.........................................................................................110
5.1 Negative Perceived Service Quality............................................................................111
5.1.1 Reliability.................................................................................................................111
5.1.2 Empathy..................................................................................................................113
3

5.1.3 Responsiveness.......................................................................................................114
5.1.4 Assurance................................................................................................................115
5.1.5 Tangibles.................................................................................................................117
5.1.6 Servicescape............................................................................................................119
5.2 General Comments in Relation to Previous Experiences of Physiotherapy Services. .121
5.2.1 Comments in Relation to Previous Experience of the NHS......................................121
5.2.2 Previous Experience and Comparisons to The Practice...........................................122
5.3 Comments in Relation to the Treatment....................................................................124
5.4 Reflections of Phase Two................................................................125
Chapter Six: Conclusion, Future Research and Recommendations..........127
6. Introduction........................................................................................127
6.1 The Objectives............................................................................................................127
6.1.2 To What Extent were the Aim and Objectives of the Thesis met?...........................128
6.2 Key Findings of Phase one...............................................................128
6.3 Key Findings of Phase Two.............................................................130
6.4 Summary of Key Findings...........................................................................................131
6.5 Managerial Implications.............................................................................................133
6.5.1 Areas for Celebration, Areas for Concern and Areas for Training for The Practice. .134
6.6 Contribution to Theory...............................................................................................137
6.7 Future Research.........................................................................................................138
Appendix 1: Ten Dimensions of Service Quality...............................................................139
Appendix 2: SERVQUAL and its Application.....................................................................141
Appendix 3: The SERVQUAL Questionnaire (as amended)...............................................143
Appendix 4: Memo to The Therapists of The Practice......................................................149
Appendix 5: Memo Regarding the Pilot Questionnaire....................................................150
Appendix 6: Outline of the Semi-Structured Face to Face Interview................................151
Appendix 7: The Ethical Guidelines..................................................................................152
4

Appendix 8: Reliability Data and Overall Mean Gap Scores..............................................153
Appendix 9: Empathy Data..............................................................................................155
Appendix 10: Tangibles Data............................................................................................157
Appendix 11: The Responsiveness Data...........................................................................159
Appendix 12: Assurance Data...........................................................................................161
Appendix 13: Servicescape Data.......................................................................................163
Appendix 14: Pictures of The Practice..............................................................................165
Appendix 15: Phase Two-Negative Gap Scores................................................................168
References........................................................................................................................174
List of FiguresFigure 1: The Gaps Model of Service Quality............................................................................19
Figure 2: Grönroos, (1984) Service Quality Model.....................................................................22
Figure 3: The Determinants of the Original SERVQUAL Instrument........................................62
Figure 4: The Conceptual Model for the Study and the amended SERVQUAL Instrument.......63
Figure 5: Continuum of Theoretical perspectives (Adapted from Collis and Hussey, 2009)......66
Figure 6: The Mean Scores of the Expectations and the Perceptions of the Total Sample for The Practice for all six determinants.................................................................................................86
Figure 7: Mean Gap Scores between Perceptions and Expectations for the Total Sample of The Practice......................................................................................................................................90
List of TablesTable 1: The Five Determinants and their Definition.................................................................17
Table 2: The Difference between Services and Physical Goods.................................................21
Table 3: Reliability Factors of SERVQUAL, SERVPERF and SERVPEX...............................32
Table 4: Application of the SERVQUAL Instrument in Healthcare Studies..............................37
Table 5: Other Healthcare Studies and the SERVQUAL Instrument.........................................41
Table 6: Rank Order of the Different Service Quality Groups (Camilleri and O‘Callaghan, 1998)..........................................................................................................................................47
Table 7: Physiotherapy Studies..................................................................................................56
Table 8: Findings of Physiotherapy Study (Curry and Sinclair, 2002).......................................58
5

Table 9: The Gaps from the Literature Review and Research Questions...................................62
Table 10: Positivism and Interpretivism Paradigms...................................................................67
Table 11: Mixed Method Design................................................................................................70
Table 12: The Research Questions and the Methods for the Study............................................71
Table 13: : Demographics of the Main Study for the Total Sample...........................................75
Table 14: The Demographics of the Face to Face Interviews.....................................................78
Table 15: Mean Scores for the Total Perceptions and Expectations scores for the Sample (n=62) and the Mean Gap Score............................................................................................................85
Table 16: Overall Analysis of the 50 SERVQUAL Questions (as amended).............................88
Table 17: The Mean Gap Scores for all Six Determinants in order of Descent..........................90
Table 18: The Question with the Highest Mean Gap Scores in relation to each Determinant. . .92
Table 19: The Questions with the Lowest Mean Gap Scores in relation to each Determinants. 93
Table 20: Mean Gap Scores for the Reliability Determinant......................................................95
Table 21: Mean Gap Scores for the Empathy Determinant........................................................98
Table 22: Mean Gap Scores for the Tangibles Determinant.......................................................99
Table 23: Mean Gap Scores for the Responsiveness Determinant............................................101
Table 24: Mean Gap Scores for the Assurance Determinant....................................................103
Table 25: Mean Gap Scores for the Servicescape Determinant................................................105
Table 26: Correlation between Expectations and the Gap Score with Experience of Physiotherapy Services and without Experience of Physiotherapy Services............................123
Table 27: Areas to Share and Celebrate for The Practice.........................................................134
Table 28: Areas for Concern for The Practice..........................................................................135
Table 29: Areas of Training for The Practice...........................................................................136
List of GraphsGraph 1: A Comparison of Patient Expectations for Public and Private Hospital Care Service Quality in Maltese Hospitals (Camilleri and O’Callaghan, 1998)..............................................48
Graph 2: Pakistani Hospitals, Private and Public.......................................................................49
6

Chapter One – The Introduction
1 Introduction
The purpose of this study was to investigate service quality in the healthcare industry, in
particular an independent private physiotherapy practice (the practice). Service quality
is a complex concept and is described in detail in the next chapter. The physiotherapy
sector like many private industries is competitive and competing on service quality is an
area over which management can have control. Research has highlighted that service
quality is a key factor in maintaining competitive advantage (Jabnoun and Rassai,
2005). Spreng et al., (1996) identified service quality to be highly important for
retaining and satisfying customers. The term ‘service quality’ is not new to the
healthcare industry. Since the creation of the UK National Health Service (the NHS) in
1948, the notion of improving or measuring quality has increased decade upon decade.
There have been several trends for service quality; Total Quality Management (TQM),
involving business innovation in relation to reductions in costs and increased
productivity, Continuous Improvement Programmes, refining TQM and ensuring
company-wide improvements on costs and productivity (Sewell, 1997). Davies et al.,
(2000) articulated the changes to the healthcare sector as a cultural link to the market
reforms in the 1990s. The functions of purchasers and providers were separated to
develop more of a business culture. The central theme became the quality strategy set
out in the white paper The New NHS: modern, dependable (1998). The white paper
detailed three factors, defining appropriate quality standards, delivering healthcare
congruent with these standards and monitoring to ensure that uniformly high quality of
care is achieved. Quality of care is not to be confused with quantity of care (Hopkins et
al., 1994), in other-words a series of medical tests on a patient does not equal quality of
care. Quality of care is a concept that is applied to the individual user of healthcare
(Campbell et al., 2000).
Over the last two decades the legislation pertaining to service quality in the healthcare
industry has increased two fold. One of the main UK white papers ‘Working for
Patients’ (1989) described how patients should no longer be passive about the quality of
their care and that services should be more customer focussed. Other legislation around
service quality in the healthcare sector included the 1991 ‘Framework for Action’ which
sought to identify people’s wishes and needs. The Patients’ Charter (1991) set out the 7

guidelines and standards that patients should expect. ‘Designed to Care’ (1997) further
impressed the need to consult with consumers of healthcare and ‘A First Class Service:
Quality in the New NHS’ (1998) set out a 10 year framework for setting quality
standards, delivery and monitoring of those standards. More recently the white paper
‘Caring for our Future’ (2012) has shifted the focus from general quality to quality in
care. This move towards quality in care is, according to the Chartered Society of
Physiotherapy, due to rising patient expectations, the development of improved
information, advances in treatment, concerns around patient safety and the emergence
of evidence-based guidelines within the healthcare sector. Service providers are
increasingly having to report on all aspects of the patients’ experience. Robledo (2001)
argued for the importance of encompassing customers’ experiences into any service
quality research and presented the notion that expectations are formed from experiences.
There is no universal definition for quality in the healthcare sector, as quality is linked
to individual values and expectations (Sewell, 1997). Sewell goes on to say that unless
an organisation has a thorough understanding of its customers’ expectations, then any
quality programme will have serious deficiencies. Whilst the NHS is expected to
include in their quality framework, improvements in the quality in care and support
(Care for our Future, 2012) this includes the whole experience of the patient not just the
customer services.
Previous UK healthcare studies regarding service quality have in the main, concentrated
on the public sector (Youseff et al., 1996; Curry and Pagouni, 1997; Curry et al., 1999,
Curry and Sinclair, 2002; Resnick and Griffiths, 2011). Other global studies on service
quality in the healthcare sector have resulted in researching service quality through a
mix of public and private healthcare service providers (Ahmed and Samreen 2011; Butt
and Cyril de Run, 2010; Chakravarty, 2010; Petrovici and Philips 2009; McGorry,
1999; Camilleri and O’Callaghan, 1998). Many of the service quality studies have
involved the measurement of service quality utilising popular instruments such as
SERVQUAL (Parasuraman et al., 1988) and SERVPERF (Cronin and Taylor, 1992);
both instruments have been used universally to determine service quality in particular
settings.
The physiotherapy industry sits within the UK healthcare sector which is split between
the public sector (the NHS) and the private sector. The private sector is further divided
8

between private hospitals and independent practices all of which provide physiotherapy
services to the public. Physiotherapy is the largest of the Allied Health Professions
(AHPS’s) with more than 50,000 practitioners. AHP’s are an essential part of the NHS
and the private practice workforce.
There has been one study on service quality for the physiotherapy industry (Curry and
Sinclair, 2002) and several other physiotherapy studies around customer satisfaction,
behaviours and treatment (Goldstein et al., 2000; Potter, Gordon and Hammer, 2003 (a)
and 2003 (b); May, 2007).
To improve customer services and therefore service quality, management must first
know and benchmark what their customers expect and then what the customers perceive
the service quality to be. Thus, the rationale for the study was twofold: (1) The practical
management desire to benchmark the quality of the services of the practice in order to
compete in the current market; The practice desired to know what their customers
thought of their services. (2) To add to the existing theory of service quality where there
was a gap.
1.1 The Aim
To assess the service quality of an independent private physiotherapy practice.
1.2 The Objectives
1. To establish and apply an appropriate conceptual framework to assess service
quality within the private physiotherapy practice.
2. To explore customers’ insights of service quality of a private physiotherapy
practice.
3. To provide recommendations to the practice in relation to service quality.
4. To contribute to the development of service quality debates through the example
of the practice.
9

Throughout the literature the terminology for service quality is intertwined with the
term customer satisfaction and some authors refer to the measurement of both as one
entity. For the purposes of this study, service quality and customer satisfaction are
separate entities, the reasons are discussed in chapter two.
1.3 The Study
The independent physiotherapy practice (the practice) in this study is located in
Edinburgh. It has several satellite units based in gyms throughout the East of Scotland
where the therapists also attend. The practice has a turnover of £500,000 and is
privately owned by two directors referred to as Director A and Director B. The practice
is serviced by 8 self-employed physiotherapists and two receptionists. The monthly
average number of customers at the practice is 450. The practice is governed by the
Health and Care Profession Councils (hpc-uk.org).
The researcher had direct access to both Director A and B through a previous
assignment. Permission was therefore sought from both directors for the study. The
Directors had two initial concerns with the research; firstly, that the study would not
involve the quality of the treatment that the therapists provided and secondly, that the
ethics of the patients would not be compromised by the research. In relation to the
research of any treatment, the directors stated their reasons as (1) the researcher was not
a qualified physiotherapist and (2) that both director A and B realised from their
professional experience that it is difficult to measure both customer service and
treatment from the same questionnaire. This was echoed by Vinagre and Neaves (2008)
who found a link between a patient’s emotional state and their satisfaction with the
healthcare service they received. As a result it would be a more complex approach, to
take into account, both the service quality of the practice and the treatment they
received. Measuring both the service quality of the treatment of patients and the service
quality of the business unit would have involved additional questions in relation to their
treatment that would include the patient’s psychological state, social backgrounds and
tangible and intangible aspects of treatment outcomes (Hudak et al., 2002). For this
reason, this study refers to patients as customers throughout the thesis and has
investigated only service quality of the services of the practice and not the treatment
from the therapists. The ethics of the study followed the Edinburgh Napier University
Guidelines and the directors were assured that the confidentiality of the patients would
not be compromised.10

1.4 The Structure of the Thesis
The thesis is structured over five further chapters. Chapter two examines the service
quality literature in relation to the healthcare sector and determines the gaps in the
literature and the research questions from the theory. The chapter concludes by
identifying the final conceptual framework. Chapter three provides details of the
research philosophy, research design, research justification for a two phased approach to
this study. Chapter four reports the analysis, discussion and key findings of the first
phase of the study and chapter five reports the analysis, discussion and key findings for
the second stage of the study. The overall conclusion, recommendations, including areas
for future research development and contribution to practice are provided in chapter six.
11

Chapter Two – A Review of the Service Quality Literature
2 Introduction
This chapter reviews service quality from both the marketing and the healthcare
literature. The first section contextualises the nature of services, service quality and
customer satisfaction. The second section introduces the concept of service quality
including the models associated with service quality. It focusses on the two main service
quality models, the American and the Nordic model. That section includes an outline of
the instruments utilised for the measurement of service quality and the section debates
those main instruments. The next section discusses how the instruments were applied to
the healthcare sector, the research that has resulted using the SERVQUAL instrument
and its application. The last section details service quality in the physiotherapy sector
and the research to date. The chapter concludes with the gaps in the literature and the
recommended conceptual model for the study.
2.1 The Nature of the Service Industry
In the UK, the service industries have replaced the manufacturing industries and the
measurement and monitoring of service quality has become an essential feature of many
businesses in order to remain competitive (Jabnoun and Rasasi, 2005). Sureshchandar et
al., (2002) stated that delivering excellent customer service was the key to sustainable
competitive advantage and this included service quality.
Historically goods were for buying and selling and termed commodities, they were
intrinsically linked with ownership, implying that they were a possession and therefore
tangible. Services that could not be touched, smelt or heard were termed intangibles and
there was a notion of inseparability between the two variables. Lovelock and Wirtz
(2007) described a definition of services as:
Services are economic activities offered by one party to another, most commonly
employing time-based performances to bring about desired results in recipients
themselves or in objects or other assets for which purchasers have responsibility. In
exchange for their money, time and effort, service customers expect to obtain value
from access to goods, labour, professional skills, facilities, networks and systems;
12

but they do not normally take ownership of any of the physical elements involved
(Lovelock and Wirtz 2007: 15)
Kotler et al., (2008) further defined service characteristics as: (1) Service Intangibility
(services that cannot easily be seen, heard or touched before purchase); (2)
Inseparability (services that cannot be separated from the people they are servicing; (3)
Variability (the quality of services depends on the person giving the service) and (4)
Perishability (the services cannot be sold or stored at a later date).
The typology of services has derived from the marketing literature. The type of services
the healthcare sector offers is a combination of what Kotler et al., (2008) described as
intangible, inseparable, variable and perishable. Grönroos (1984) termed this
collection of services as heterogeneous (diverse in character). Quality is often therefore
seen through a perceived lens rather a more objective viewpoint, termed by Grönroos
(1984) as homogeneous (of the same kind). Much of the service literature from the
marketing perspective was in relation to the type of services offered and the vertical and
horizontal integration of those services between the consumer and the organisation
(Kotler et al., 2008). This study investigated services that are heterogeneous.
13

2.2 The Nature of Customer Satisfaction and Service Quality
The marketing and the healthcare literature included many articles on customer
satisfaction, however the terms service quality and customer satisfaction are intertwined
within the literature. Dabholkar (2000) argued that customer satisfaction is an
antecedent of service quality. Miller (1976) described customer satisfaction as
disconfirmation and later disconfirmation was described by Oliver (1981) as an
antecedent of satisfaction. Westbrook (1983) described satisfaction as a construct
equated with emotion, further Oliver and Westbrook (1991) then described emotion as
an antecedent of satisfaction. Dabholkar (2000) described service quality as a construct
of various dimensions. Baker and Taylor (1994); Gotlieb, Grewal and Brown (1994);
Dabholkar (1995a) and Bansal and Taylor (1997) examined the difference of customer
behaviour between customer satisfaction and service quality.
Different studies produced alternative data and Dabholkar (2000) stated that more
research was required in order to investigate the relationship between service quality,
satisfaction and customer behaviours and to question whether it does in fact lead to
more business recommendations or loyalty. Nicholls et al., (1998) stated that customer
satisfaction is important to organisations that deliver products rather than services, and
claimed that satisfaction lies with a product, whether the product is fit for purpose or
not. Satisfaction with services is intangible, it is an experience, it is about the perception
of performance (Nicholls et al., 1998). A study undertaken by Shemwell et al., (1998)
in healthcare facilities in Turkey found that there was a link between satisfaction in
service quality that led to overall customer satisfaction. Kim et al., (2009) found a link
between positive word of mouth recommendations, satisfaction with the service quality
and overall customer satisfaction in restaurants in Taiwan and the US. Customer
satisfaction is a complicated multi-dimensional construct that is intertwined with service
quality. Customer satisfaction is commonly referred to by both suppliers of services and
consumers of services without fully realising the implications of the terms. For the
purposes of this study, only the service quality was investigated as the two variables
(service quality and customer satisfaction) are appreciated as two separate constructs.
14

2.3 The Service Quality Concept
Parasuraman et al., (1990: 19) described Service Quality as:
The extent of discrepancy between customers’ expectations or desires and their perceptions.
In other words, there were two variables to service quality: expectations and
perceptions. Parasuraman et al., (1985) were the academic pioneers of service quality.
Their extensive empirical and qualitative study into service quality in America in the
1980s was ground-breaking and their instrument for measuring service quality is still
used extensively today, the tool is discussed later in the chapter. Parasuraman et al.,
(1985; 1988; 1991; 1994) identified that nearly all organisations compete with each
other in terms of service, they believed that excellent customer service pays off in the
long run and that customers will continue to return to an organisation where the service
is excellent.
Grönroos, (1984; 1990; 2000; 2001) was the Nordic pioneer of the other main approach
and described service quality as perceived service quality as:
The outcome of an evaluation process (whereby) the consumer compares his
expectations with the service he perceives he has received i.e. he puts the
perceived service against the expected service. The result of this process will be
the perceived quality of service (Grönroos 1984: 37).
There is no real consensus in the literature around the definition of the term perceived
service quality, however Parasuraman et al., (1985; 1988); Cronin and Taylor, (1992);
Boulding et al., (1993) agreed that it is a consumer’s evaluative judgement following
the service performed.
2.4 The American Approach to Service Quality
Parasuraman et al., (1985); Berry et al., (1988) and Zeithaml et al., (1996) were the
main contributors to the American school of service quality. The increase in the services
industries brought about an idea that service quality was as important as the services
that an organisation was offering. Many well-known companies in the 1980s were
convinced that superior service quality was the winning formula (McDonald’s, Federal 15

Express, Nodstrum, American Airlines, American Express, L.L. Bean, Domino’s Pizza.
Disney World, Club Med, Marriott and IBM). Setting out what to measure as part of the
service quality was becoming increasingly more important to distinguish.
From a large groundbreaking study into service quality within service industries
(appliance repair, credit cards, insurance, long-distance telephone, retail banking and
securities brokerage) Parasuraman et al., (1985) proposed an initial ten determinants of
service quality as described in Appendix 1. They further consolidated the ten categories
into five determinants (Tangibles, Reliability, Responsiveness, Assurance and
Empathy) described in table 1 overleaf. When considering the concept of service
quality, these determinants have been referred to globally in many service quality
studies.
16

Table 1: The Five Determinants and their Definition
Determinant Definition
TANGIBLES The appearance of physical facilities, equipment, personnel and communication materials.
RELIABILITY The ability to perform the promised service dependably and accurately.
RESPONSIVENESS Willingness to help customers and to provide prompt service.
ASSURANCE The knowledge and courtesy of employees and their ability to convey trust and confidence.
EMPATHY Caring individualised attention the firm provides its customers.
Source: Parasuraman et al., (1985)
Table 1 describes services as five determinants and explains how they are categorised.
The main components relate to the appearance (tangibles), the ability (reliability), the
willingness (responsiveness), the knowledge (assurance) and the caring (empathy) of
the organisation when providing services to the customer. The five dimensions were
systematically analysed as the core criteria that customers employ in evaluating service
quality and therefore cite as important to service quality (Zeithaml et al., 1990).
Zeithaml et al., (1990) ranked the five determinants in different industries and found
that all five were critical to the determination of service quality. It was found in the
research that reliability, responsiveness, assurance and empathy were 9 out of 10 on a
10 point scale from 1 (not all important) to 10 (extremely important). By comparison,
tangibles ranked lower and ranged from 7.14 to 8.56. Across banking, repair and
maintenance, telephone and credit card companies, customers ranked reliability as the
most important factor. From four different industries, most of the customers wanted the
suppliers to be reliable, in other words, do what they say they are going to do.
Zeithaml et al., (1990) further applied those determinants to measure a gap between
customers’ expectations of any service and customers perceptions of a particular
service following the service performed. This gap between customers’ expectations and 17

customers’ perceptions is known as Gap 5 of The Gaps Model of Service Quality
Parasuraman et al., (1985), as described in figure 1.
18

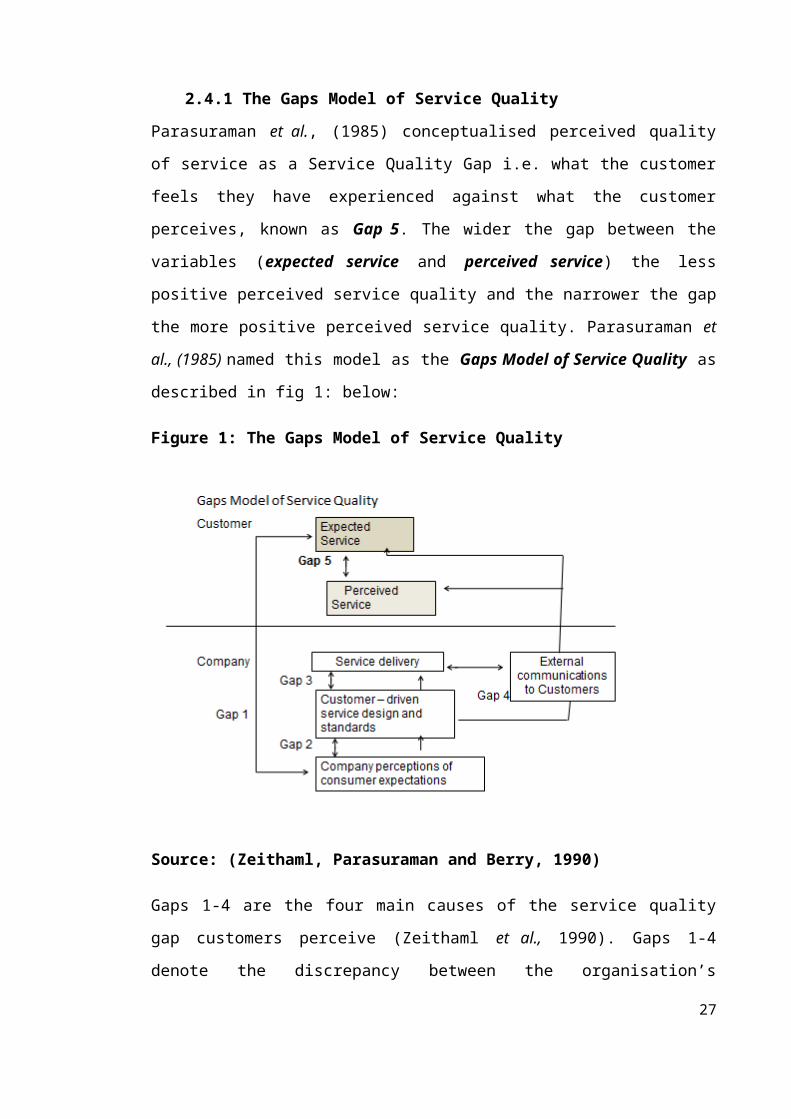
2.4.1 The Gaps Model of Service Quality
Parasuraman et al., (1985) conceptualised perceived quality of service as a Service
Quality Gap i.e. what the customer feels they have experienced against what the
customer perceives, known as Gap 5. The wider the gap between the variables
(expected service and perceived service) the less positive perceived service quality and
the narrower the gap the more positive perceived service quality. Parasuraman et al.,
(1985) named this model as the Gaps Model of Service Quality as described in fig 1:
below:
Figure 1: The Gaps Model of Service Quality
Source: (Zeithaml, Parasuraman and Berry, 1990)
Gaps 1-4 are the four main causes of the service quality gap customers perceive
(Zeithaml et al., 1990). Gaps 1-4 denote the discrepancy between the organisation’s
shortfalls, in other-words areas in the business where service improvements could be
made between the organisation and the customer. Key determinants of the service
expected by customers include: word of mouth communications, personal needs, past
experience and external communications from the service provider.
Gap 1 – is concerned with what the customers expect and what the managers of the
company perceive the customers expect. The gap is the discrepancy between the two 19

variables. The issues are concerned with insufficient marketing research, inadequate use
of marketing research findings, lack of interaction between management and customers,
insufficient upward communication from contact employees to managers and too many
managerial levels between contact personnel and top management.
Gap 2 – is the difference between management’s perceptions of customers’ expectations
and the standards they set to fulfil these expectations. Gap 2 includes: inadequate
management commitment to service quality, lack of perception of feasibility, inadequate
task standardisation and absence of goal setting.
Gap 3 – this is termed the service performance gap, and factors that contribute to this
gap are: role ambiguity, role conflict, poor employee-job fit, poor technology job-fit,
inappropriate supervisory control systems leading to an inappropriate evaluation/reward
system, lack of perceived control on the part of the employees and lack of teamwork.
Gap 4 – when there is a discrepancy between service delivery and external
communications. The factors include: inadequate horizontal communication among
operations, marketing and human resources as well as across branches and propensity to
overpromise in communications.
Gap 5 - is only concerned with the customer; it is the gap between the customers’
expectations of any similar service and the perceptions formed following the service
provided by the organisation.
Gap 5 is the service quality gap that Zeithaml, Parasuraman and Berry, (1990) are
renowned for. The main advantage of this model is the measurement instrument,
SERVQUAL, developed to measure gap 5, and is discussed later in the chapter. The
remaining four gaps are part of the conceptual model that serves as a framework for
understanding, measuring and improving service quality.
20

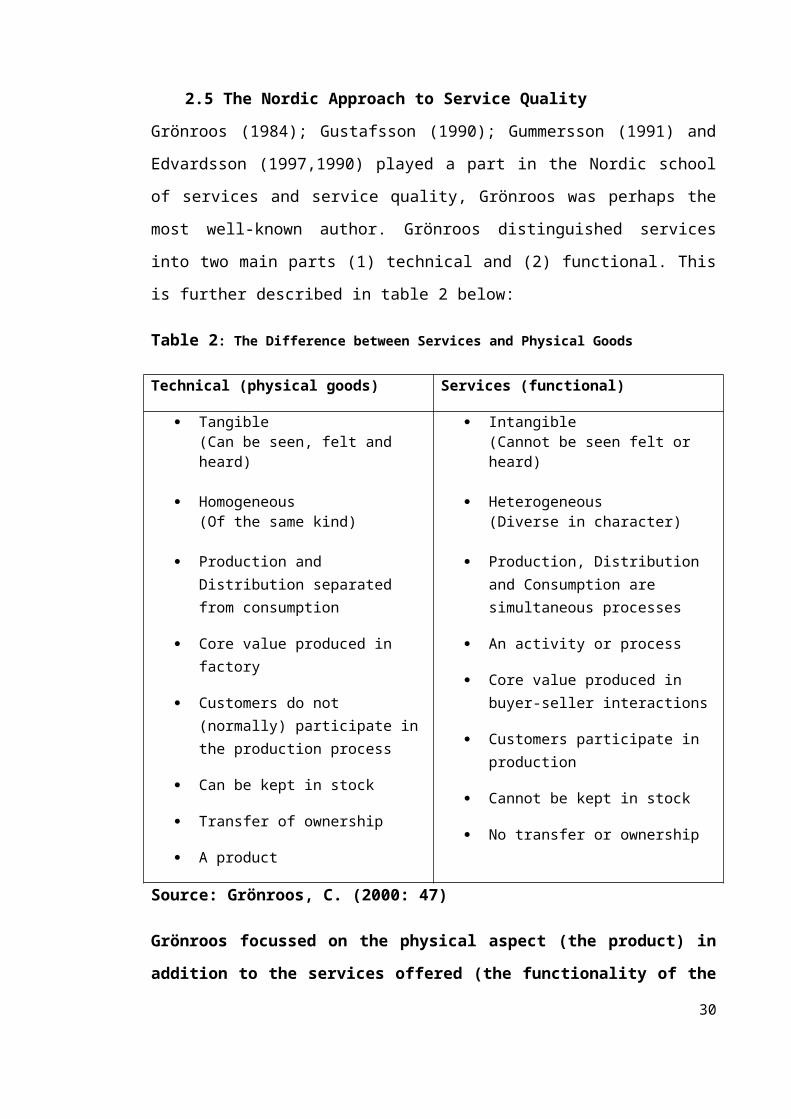
2.5 The Nordic Approach to Service Quality
Grönroos (1984); Gustafsson (1990); Gummersson (1991) and Edvardsson (1997,1990)
played a part in the Nordic school of services and service quality, Grönroos was perhaps
the most well-known author. Grönroos distinguished services into two main parts (1)
technical and (2) functional. This is further described in table 2 below:
Table 2: The Difference between Services and Physical Goods
Technical (physical goods) Services (functional)
Tangible(Can be seen, felt and heard)
Homogeneous(Of the same kind)
Production and Distribution separated from consumption
Core value produced in factory
Customers do not (normally) participate in the production process
Can be kept in stock
Transfer of ownership
A product
Intangible(Cannot be seen felt or heard)
Heterogeneous(Diverse in character)
Production, Distribution and Consumption are simultaneous processes
An activity or process
Core value produced in buyer-seller interactions
Customers participate in production
Cannot be kept in stock
No transfer or ownership
Source: Grönroos, C. (2000: 47)
Grönroos focussed on the physical aspect (the product) in addition to the services
offered (the functionality of the services). Grönroos emphasised two aspects to
buying and selling a product. Grönroo’s research into service quality was different
to the American research, it was service and product led as opposed to just
services. The division between the technical (the product) and the function
(services) was the difference between what customers thought and expected of the
product and what they thought and expected of the services. This is described
overleaf in the model in figure 2. This model is more suited to organisations that
are driven by the quality of the product, in addition to the service provided.
21

Figure 2: Grönroos, (1984) Service Quality Model
Expected Service Perceived Service Perceived Service Quality
Marketing Word of Mouth Image Prior Experience
Technical Quality(The product)
Functional Quality(The Services)
Source: Grönroos (1984: 40)
Grönroos (1984) introduced the quality dimension, image. The corporate image
depended on technical and functional quality, price, external communications, physical
location, appearance of the site and the competence and behaviours of the service firm’s
employees. Martinez and Martinez (2010) were of the opinion that image can act as
another service quality dimension but in reality it is another variable in the relationship
between technical and functional and perceived quality.
In contrast to Parasuraman et al., (1985), Grönroos (1984) purported that customers
distinguish services through two variables: (1) technical quality and (2) functional
quality rather than a gap that can be narrowed or widened by management through the
control of service quality in their organisation.
The advantage of the Grönroos model, is that it does distinguish between the quality of
the product and the quality of the services, however both constructs may need a
different set of variables for measurement. The disadvantage to this model is that there
is no defined tool for the measurement of the variables and the two constructs (technical
and functional) are not clearly defined. This is in contrast to the Gaps Model where the
SERVQUAL Instrument can provide management with information of where the 22

perceived service quality gaps lie in relation to the two variables, expectations and
perceptions.
23

2.6 Other Models
In addition to the two aforementioned models, there are further references to other
models within the literature: Rust and Oliver (1994), a tri-component model of service
quality; Teas (1993, 1994) developed the Evaluated Performance Model that measured
the gap between perceived performance and the feature of the study rather than
expectations; Dabholkar et al., (1996) developed a hierarchical model for the retail
industry offering the Retail Service Quality Scale and Brady and Cronin (2001)
proposed a multi-dimensional and hierarchical model combining the work of Rust and
Oliver and Dabolkhar. These models suited the objectives of the research of those
studies. There have been many contributors to the concept of service quality and the
main distinction between the American and the Nordic approach is the technical aspect
to the service. The American approach is less technically orientated than the Nordic
approach which is more centred around the product or core service. The current study
was concerned with the service of the practice not the service quality of a product or the
core product (the physiotherapy treatment).
The American view of service quality was therefore more suited to the current study.
The concept for this study therefore became a disconfirmation concept, identified by
Robledo (2001) as the gap between customers’ expectations and the actual performance
of the service provider. The model that completes this concept is the Gaps Model of
Service Quality as described in figure 1.
2.7 Service Quality Models in the Healthcare Setting
Many healthcare studies have utilised the Gaps Model of Service Quality (Parasuraman
et al., 1990) and the SERVQUAL Instrument in which to measure that service quality
gap. Some studies have adapted the instrument to suit the context of the research. This
is discussed in more detail later in the chapter. Choi et al., (2005), Bopp (1990),
Babaskus and Mangold (1992) argued that patients could not distinguish between
functional and technical quality adequately, however Ruyter et al., (1998) pointed out
that both factors are an integral part of the overall service offering.
24

Grönroos (1984) adapted the model for the healthcare industry as outlined below:
Functional Quality – How a patient receives a service (food quality, access to care)
Technical Quality - The quality of the delivery of care (competence and outcome)
Whether to measure functional and or technical quality is an ongoing debate within the
healthcare literature as the measurement of quality in a healthcare setting is unique, in
so much as part of the service is provided by professionals and frequently no tangible
output is measured (Karassavidou et al., 2009).
25

2.8 Service Quality Instruments
This section details the instruments that are commonly used to measure service quality.
There is a continuing debate in the literature as to whether expectations and perceptions
should be measured (Parasuraman et al., 1985, 1990) or whether perceptions only
should be measured (Cronin and Taylor, 1992, 1994).
2.8.1 Why Measure Expectations and Perceptions?
Expectations have been defined as an experience an individual may have that would
affect their anticipated future performance of a provider and perceptions as an opinion
of a service after they have attended the organisation (Camilleri and O’Callaghan,
1998). As an example, many people in the UK can identify with the services of the NHS
through experience and will have formed an expectation for future visits. Their
perception may change with each visit but if an individual has never attended a private
hospital or a private practice both their expectations and perceptions may be new.
Depending on the culture of the country, Butt and Cyril de Run (2010) stated that
customer expectations could be manipulated by marketing and advertising materials.
This for example could happen if a private hospital was marketing itself as the best
private hospital in the city/country and customers would therefore have a pre-existing
expectation as a result of the publicity. However, it was suggested by Chaniotakis and
Lymperopoulos (2009) that word of mouth is critical to the success of the service
provider. Carman (1990) suggested that word of mouth and media played a key role in
developing an individual’s expectation of a service. McGorry (1999) researched service
quality of healthcare services in a Latino population and found that the low income of
the population may have affected their lower expectations and perceptions of the
healthcare services they received.
Carman (1990) stated that customers naturally expect more from a five star
establishment than a two star and it is therefore reasonable to expect their experiences
will both influence their expectations and their perceptions of a service and that
measuring expectations is important. Holmlund and Kock (1996) stated that if
customers are to stay with the service provider, then the service quality that they
experience must meet their expectations.
Robledo (2001) found that if expectations were not met, dissatisfaction occurred.
Robledo (2001) considered past experience, reputation, corporate image, formal 26

recommendations, informal recommendations, personal needs, promotions and price as
variables that all affected customers’ experiences that in turn formed their expectations.
These variables can play a large part in the customers’ expectations particularly in the
UK between the private and public healthcare services where experiences of the private
and public sector can be widely different (Camilleri and O’Callaghan, 1998).
Boulding et al., (1993) argued that taking the consumers’ expectations into account has
a unique effect on the customers’ perceptions of service quality. Robledo (2001)
declared that understanding customers’ expectations is vital to the delivery of excellent
service quality since customers evaluate a service by comparing their perceptions of a
current service with their past experiences and thus forming an expectation. Robledo
(2001) further discussed the fact that the inclusion of expectations or not has led to two
differing paradigms (1) The perception paradigm that supports the fact that expectations
are irrelevant (the SERVPERF Instrument) and (2) The disconfirmation paradigm that
includes perceptions and expectations (the SERVQUAL Instrument).
Robledo’s (2001) research demonstrated that customers’ expectations are formed
through a variety of factors including their past experience. It is therefore important to
ask customers of their past experiences to gain a better understanding of their
expectations. This is important where services are commonplace with customers, i.e.
Hotels, Healthcare and Restaurants and therefore it is even more important that
management understand what the customers are actually expecting from a particular
service offering. Much of the service quality literature pertains to expectations and little
has been written about the subject of perceptions other than the view that it is an
outcome of an evaluation of service provided (Grönroos, 1984). When the service
quality gap is negative, that is when customer perceptions do not meet the expectations
of a service, there is little reference to why customers or patients rated their perception
lower than their expectations of a service. The literature revealed a gap with regard to
the ‘why’ when referring to a negative perception of service quality and one that this
study sought to address.
2.8.2 SERVQUAL and its Characteristics
The SERVQUAL instrument devised by Parasuraman et al., (1985) was a result of their
research into service quality in the US in the 1980s. Parasuraman et al., (1985) focussed
their research on what formed customers’ expectations of a service and what formed
27

their perceptions of the actual service. SERVQUAL is a 22 paired item questionnaire
split over five determinants: tangibles (questions 1-4), reliability (questions 5-9),
responsiveness (questions 10-13), assurance (questions 14-17) and empathy (questions
18–22). The expectations questions are set around the customers’ expectations of any
service (the context related to the services in the study) and the perceptions questions
were related to the perceptions of the organisation that the customers have received the
services from. The instrument measured the Service Quality Gap (SQG) between
perceptions (P) (22 questions) and expectations (E) (22 questions) of service quality.
The formula for the service quality gap: perceptions minus expectations = service
quality gap i.e. [P-E= SQG]. The scale of the questionnaire sat alongside a 7 point
Likert scale ranging from 1 (strongly disagree) to 7 (strongly agree). Appendix 2
provides an example of the questionnaire used in the study.
2.8.3 Criticisms of the SERVQUAL Instrument
There have been many critiques of the SERVQUAL Instrument. Carman (1990) raised a
concern about the psychometric differences between expectations and perceptions,
further endorsed by Babakus and Boller (1992). Cronin and Taylor (1992; 1994) have
criticised the instrument heavily stating that perceptions of service performance need
only be measured and not expectations.
Sureschandar et al. (2002) criticised SERVQUAL for not covering fully the areas such
as servicescape (physical location and external/internal buildings) in the questionnaire.
Babaskus and Boller (1992) felt that the gap scores i.e. P-E=SQG did not provide any
additional contribution to the overall understanding of service quality. Teas (1994)
argued that the gap scores were not a clear indication of the actual gap as expectations
scores and perceptions scores could have the same gap but different scores e.g. using P-
E = SQG; example 1: P score =6 and E score = 5, P-E = 1 and in example 2: P score =4
and E score =3 = 1, in other-words different scores gave the same gap. Lee and Yom
(2007) reported that when the perceived performance is higher than the customers’
expectations, it is positive in terms of service quality and the reverse indicates the
opposite, that is, a negative perception of service quality. Parasuraman et al. (1990)
argued that it is the difference between expectations and perceptions that is important
not the scores of the two variables and therefore the mean score is a good indication of a
positive or negative perception. Positive mean gap scores suggest that overall customers
have a positive perception of service quality whilst the reverse is a negative perception. 28

Chowdhary and Prakash (2005) suggested that a different approach was needed to
measure service quality and that each variable should be considered independently.
Caro and Garcia (2007) also challenged the use of SERVQUAL and supported the use
of different instruments for different sectors.
Ladhari (2008) confirmed that different industries need different measurements and that
SERVQUAL was not a universal tool for all industries. Ladhari (2008: 78):
It is apparent that the criteria used to evaluate service quality differ among customer
groups and circumstances.
Ladhari (2008: 191) reported that there were several empirical and theoretical problems
associated with the SERVQUAL model
The use of difference scores
The reliability of the model
The convergent validity
The discriminant validity
The predictive validity
Its emphasis on process (rather than outcome)
The hierarchical nature of service-quality constructs
The use of reflective (rather than formative) scales
The applicability of a generic scale for measuring service quality in all service
settings
The applicability of SERVQUAL to the online environment
Applicability to different cultural contexts
Despite the critics of SERVQUAL, it is undoubtedly a well- known global instrument
used throughout many industries including the healthcare industry.
Ladhari (2008) did agree that despite the shortcomings of SERVQUAL, many
researchers found the SERVQUAL questionnaire an appropriate tool for measuring
29

service quality. Ladhari (2008) went on to suggest that the SERVQUAL instrument
could be adapted to be industry specific to fit the context of the study. As the
SERVQUAL instrument was developed for the US market, caution was required when
using SERVQUAL in other countries or cultures (Ladhari, 2008). Diamantopoulos et al,
(2006) stated that there were cultural differences in relation to response scales (such as
the use of the mid-point) that could threaten the validity of the scales. Van Herk et al.
(2005) found problems in the translation of the SERVQUAL questionnaire and reported
that it can result in higher measurement error.
Sultan and Simpson (2000), in the research of an airline industry, found that the
reliability factor was the most important of SERVQUAL’s five determinants, however
they also found that the expectations and perceptions varied between nationalities.
Martinez and Martinez (2010) found that the findings were culture and/or country
specific and this important element should be taken into consideration when comparing
SERVQUAL in a global setting. Chand (2010) in a study into Indian tourism suggested
that consumers’ perceptions of the importance of the different factors were influenced
by national and cultural differences.
2.8.4 The SERVPERF Instrument
Cronin and Taylor (1992) claimed that the conceptualization of the service quality
construct was better measured by only perceptions, this they called a performance
measurement and named the instrument SERVPERF. Cronin and Taylor (1994: 125)
stated:
Our results suggest that the performance minus expectations is an inappropriate
basis for use in the measurement of service quality.
SERVPERF, a 22 item scale questionnaire of perceptions (often referred to in the
literature as a measure of performance) was devised by Cronin and Taylor (1992).
Cronin and Taylor (1992) further argued that the gap theory of service quality
(Zeithaml, Parasuraman and Berry, 1990) was supported by little empirical and
theoretical evidence. They felt that a customer’s attitude to a service was best
established through perceptions of the service provided.
According to Buttle (1996), there is little evidence to suggest that customers assess
service quality in terms of expectations and perceptions. Cronin and Taylor (1992)
30
investigated the conceptualisation of the measurement of service quality and their
results suggest that a perception only measurement (that they termed the performance
measurement) was an alternative and more improved version of the SERVQUAL
Instrument, namely their instrument SERVPERF. They claimed that organisations
should care more about the performance aspect of service quality rather than the
expectations of customers and that perceived service quality leads to consumer
satisfaction.
2.8.5 The SERVPEX Instrument
Robledo (2001: 22) stated:
Understanding customer expectations is a prerequisite for delivering superior
service, since customers evaluate service quality by comparing their perceptions
of the service with their expectations.
Robledo (2001) developed SERVPEX that measured expectations and perceptions on a
single scale from “Much worse than expected” to “Much better than expected”.
Customers devolve their expectations through their own experiences (Robledo 2001), in
addition Robledo stated that this was an area in the literature that required further and
deeper understanding.
2.8.6 A Comparison of SERVQUAL, SERVPERF and SERVPEX
Robledo (2001) undertook research into three commercial airlines and distributed
questionnaires to a sample of 1152 passengers; the response rate was 35.4%. The
questionnaires were a combination of all three instruments (SERVQUAL, SERVPERF
and SERVPEX). The reliability factors of the three questionnaires using Cronbach’s
Alpha coefficient ≥ 0.70 are show in table 3 below.
Table 3: Reliability Factors of SERVQUAL, SERVPERF and SERVPEX
31

Instrument Factor
SERVPERF 0.9635
SERVPEX 0.9593
SERVQUAL 0.9548
Source: Robledo (2001: 24)
All three instruments demonstrated similar results, there was no significant difference
between them. Robledo (2001) observed that airline passengers had uniformly high
expectations. This could be linked to price in return for an expected service. This is a
very interesting comment as customers may have different expectations depending on
the establishment, the price, environment or culture. McGorry (1999) found in a study
of a Latino population in a healthcare setting, that they had lower expectations than
expected possibly due to culture and socio-economic factors. Curry and Sinclair (2002)
found there were lower expectations and lower perceptions of certain elements of
physiotherapy services and this was possibly due to the context of the services provided;
both these studies are further explained in the next section.
Parasuraman et al., (1991) argued that the measurement of expectations served as a
diagnostic function for managers and therefore SERVQUAL offered more information
than the other instruments. Despite the fact that SERVPEX operates from one scale, it is
not a widely used instrument. The main debates within the literature are the advantages
and disadvantages that centre around the usability of SERVQUAL and SERVPERF as
discussed below. There is no conclusion to this on-going debate.
2.8.7 SERVQUAL Vs SERVPERF
According to Jungki (2007) the psychometric properties of SERVPERF are slightly
more sound than SERVQUAL in terms of reliability, however SERVQUAL
outperformed SERVPERF in validity. They also stated that the inclusion of customers’
expectations impacts on culture and therefore would decrease the precision of the
measurement. SERVPERF has been used extensively in many industries to measure
service quality in the following industries: airline; air cargo; hotels; retail; public
transportation and tourism. SERVQUAL has also been used extensively to measure
service quality: airlines, (Chou et al., 2011; Pakdil and Aydin, 2007); Higher
Education, (Smith et al., 2007); Police Service, (Donnelly et al., 2006); Retail,
32

(Carman, 1990); (Gagliano and Hathcote, 1994); Tourism, (Hokey and Hyesung, 1997);
Travel, (Urdang and Howey, 2000); Banking, (Kumar et al., 2009); Healthcare
(Babakus and Mangold, 1992; Yousseff, 1996; Camilleri and O’Callaghan, 1998; Curry
et al., 1999; McGorry, 1999; Curry and Sinclair, 2002; Chaniotakis and Lymperopoulos
2009; Resnick and Griffiths, 2011).
Ladhari (2008) suggested that SERVQUAL could be adapted to various industries
depending on their context. It is evident from the list of industries above that both
SERVQUAL and SERPERF have been used extensively to measure service quality in a
variety of industries. Moreover the lack of agreement on whether a service quality study
should be conducted using SERVQUAL or SERVPERF continues to be a main debate
within the literature.
From the evidence, it appears that the SERVQUAL tool is a valid and reliable
instrument and can be applied to many settings. Parasuraman et al. (1991) stated that
there was much academic support for using the SERVQUAL instrument in its entirety
as much as possible as deletion of items could affect the integrity of the scale. The
literature has indicated that the SERVQUAL Instrument is appropriate for a healthcare
setting; it also measures both expectations and perceptions. The measurement of both
variables is consistent with the study’s aim and objectives that allows for a deeper
investigation of service quality.
There is a convincing opinion in the literature (Robledo, 2001) that both expectations
and perceptions should be measured and that benchmarking customers’ expectations
against their perceptions can help management understand what their service quality
strengths and weaknesses are in relation to positive or negative gaps. This study
therefore sought to measure both expectations and perceptions of the service quality of
the practice utilising the SERVQUAL instrument.
33
2.9 Service Quality in the Healthcare Sector
The UK National Health Service (the NHS) is a public service that deals with over 1
million patients every 36 hours. The measurement and provision of service quality has
become an increasing parameter for the NHS and other regulated healthcare services
including the physiotherapy sector. Despite the regulatory framework, there is an
expanding difference between the UK private and the public healthcare sectors and the
cost of the service is one of the main differentiators. The cost of the service also brings
an expectation of service quality (Robledo, 2001, Camilleri and O’Callaghan, 1998).
The UK Government legislation has influenced the growing requirement for the
healthcare sector to identify service quality determinants and to find and adapt tools for
measurement. 1991 ‘Framework for Action’ sought to identify people’s wishes and
needs whilst the Patients’ Charter (1991) set out the guidelines and standards that
patients should expect. ‘Designed to Care’ (1997) has further impressed the need to
consult with consumers of healthcare and ‘A First Class Service: Quality in the New
NHS’ (1998) set out a 10 year framework for setting quality standards, delivery and
monitoring of those standards. The Clinical Governance: Quality in the NHS (1999)
set out a model for pulling together previous approaches to service quality and more
recently the white paper ‘Caring for our Future’ (2012) has shifted the focus from
general service quality to quality in care. Quality in care considers the care for the
patients, the way they are looked after within the NHS system. This has been further
highlighted with the implemented NHS complaint system; patients are encouraged to
utilise the complaints system and indeed, any claim of negligence is required first to be
lodged with the NHS complaint system. Much of the legislation was centred on the
quality of the treatment, care, feedback and complaint system as opposed to consistency
of components that should or should not be included in the measurement of service
quality. This section of the chapter outlines a selection of healthcare studies that
demonstrate the range of variables included in healthcare studies in the measurement of
service quality.
2.9.1 SERVQUAL and the Healthcare Sector
Many previous studies in the healthcare sector have predominantly used SERVQUAL
despite comments from Bowers et al., (1994) who declared that SERVQUAL was
devised for other industries and not the healthcare sector because of the treatment
34

elements to the service. Buttle (1996) disputed the use of SERVQUAL as a global tool.
Butt and Cyril de Run (2010) expressed that SERVQUAL was an instrument that was
highly valid and reliable in the healthcare sector and was therefore an excellent tool for
measuring service quality. Carman (1990) stated that it was an excellent tool that is
extremely stable. Petrovici and Phillips (2009) suggested that the debate between the
two main instruments still continues and claimed that SERVQUAL is of more use to
practitioners because of its diagnostic value and validity.
Some studies have amended the SERVQUAL questionnaire and included factors such
as cost, competence and demeanour (Andaleed, 1998), other studies have included
security, performance and aesthetics (Raduan et al., 2004). Sureshchandar et al., (2002)
were adamant that social factors and servicescape were absent from the SERVQUAL
questionnaire and that the questionnaire therefore did not capture all the relevant
customer information. Lovelock (1998) described servicescape as the internal and
external décor relating to the organisation. Many of the healthcare studies have changed
the wording to fit with the terminology of the hospital services.
Bowers et al., (1994) stated that the treatment and the caring were two separate
constructs and that SERVQUAL was not intended to capture both sets of data. They
conveyed that treatment involved a relationship with the therapist or doctor and
outcomes of the treatment will instil different expectations and perceptions of an overall
performance rather than the services only. In contrast Hassanien et al., (2010) termed
the whole service offering as the core service and that customers would evaluate the
core service (the treatment) along with the services (facilities, location, reception,
appointments, servicescape etc.) and that customers would have expectations and
perceptions of the overall service. Sureshchandar et al., (2002) stated that the core
service is the essence of any service. In the healthcare industry their primary objective
was to provide quality care in an effort to improve the individual’s health (Hudak et al.,
2002). Vandamme and Leunis (1993) felt that patients were unable to evaluate the
quality of the treatment offered by hospitals or doctors and therefore relied more on
experience. Despite the critics of separating both the services and the treatment,
previous studies within the healthcare sector have involved the measurement of both the
treatment and the services of that provider in one questionnaire. The measurement of
both services and treatment continues to be a debate in the literature.
35

The question of which components should or should not be included in a study of
service quality depends on the aim and objectives of the study and the context therein.
The healthcare studies in table 4 below have adapted the SERVQUAL instrument to the
context of the study, in addition, the mean gap score has been utilised as the method of
calculating the SERVQUAL data which is similar to the current study. The healthcare
studies in table 5 have also adapted the SERVQUAL instrument to the context of the
study but statistically tested the SERVQUAL instrument in addition to calculating the
output of the questionnaire. Appendix 3 further describes the amended SERVQUAL
instrument in studies other than the healthcare sector.
36

Table 4: Application of the SERVQUAL Instrument in Healthcare Studies
Table 4 outlines the healthcare studies that have calculated the SERVQUAL analysis as a mean gap score. The table also describes the adaptions to the SERVQUAL questionnaire. The physiotherapy studies are detailed later in the chapter.
AUTHOR(S)
ORGANISATION APPLICATION OF SERVQUAL SAMPLE METHOD FOR SERVQUAL ANALYSIS
Butt and Cyril de Run (2008)
Private healthcare quality: applying a SERVQUAL model to Malaysian hospitals.
Adapted SERVQUAL to 17 item questionnaire.
Sample 400. Respondents 340 participants from a healthcare facility in Malaysia.
Mean Gap Scores
Camilleri and O’Callaghan (1998)
Healthcare-comparison of Maltese Public and Private Hospitals.
The application of both SERVQUAL and Donabedian Framework. Two paired questionnaires developed.
No sample figures available. 76.5% of the sample responded (patients).
Mean gap scores and weighted gap scores
Chakravarty (2010)
A hospital outpatient department in India.
Original SERVQUAL questionnaire. 50 patients. Mean Gap Scores.
Curry, Stark and Summerhill (1999)
Patient and stakeholder consultation in healthcare; 88 care homes in Scotland.
Minor changes to SERVQUAL 22 item questionnaire and the Nominal Interview Technique.
Sample 153 (78 residents and 75 relatives).
Mean Gap Scores
37

AUTHOR(S) ORGANISATION APPLICATION OF SERVQUAL SAMPLE METHOD FOR SERVQUAL ANALYSIS
Karassavidou (2009)
Aimed to identify the service quality dimensions aimed at patients of Greek public hospitals
A 26 item SERVQUAL questionnaire was utilised.
A sample of 137 patients in 6 hospitals located in Northern Greece.
Mean Gap Scores
Lee and Yom (2006)
A comparative study of patients’ and nurses’ perceptions of the quality of nursing services.
Adapted SERVQUAL, 20 item questionnaire and translated into Korean; 5 point Likert scale.
Sample 300 patients and 300 nurses of 6 Korean hospitals. Respondents: 272 patients and 282 nurses.
Mean Gap Scores
McGorry (1999) An investigation of expectations and perceptions of healthcare services with Latino population.
Adapted SERVQUAL to 5 point Likert scale. 22 item questionnaire.
106 patients of an obstetrics/gynecology clinic in urban USA with large Latino population. 105 respondents.
Mean Gap Scores
Resnick and Griffiths (2011)
A study of privately funded alcohol treatment services in the UK.
SERVQUAL was used as a tool to capture the information in an interview setting.
Two groups: one group of 32 patients and a second group of 15 clinical staff.
Mean Gap Scores
Youseff et al., (1996)
Healthcare quality in NHS hospitals
Adapted words on SERVQUAL to suit the hospital environment. Retained 22 item questionnaire.
Sample 300, respondents 174 patients in the UK West Midland region.
Mean gap Scores
38

From the studies in table 4, there is a mixture of private and public sector studies with
one comparison study of both the public and the private sectors. Camilleri and
O’Callaghan (1998) conducted their comparison study of private and public hospitals in
Malta. Higher expectations in the private healthcare sector were found for price,
environment, catering and accessibility. Many of the studies have adapted the
SERVQUAL instrument with minor changes to the wording to fit the context of the
study. The results are study specific but one common theme was the negative
perceptions in all five determinants for four of the studies (Chakravarty, 2010;
Karassavidou, 2009; Butt and Cyril de Run, 2008; Youseff et al., 1996). The customers
of those hospitals perceived all the services that they were questioned on to have a
negative service quality score. Three of the hospitals were in the public sector
(Chakravarty, 2010; Karassavidou, 2009; Youseff et al., 1996) and one was a study of
private Malaysian hospital facilities (Butt and Cyril de Run, 2008). The three studies in
the public sector were conducted in India, Greece, and the UK. Many countries have
funding issues for the public healthcare sector and this was highlighted in those three
studies as having affected the service quality of the hospitals. From a hospital
management perspective, the studies have demonstrated a serious service quality
problem in those hospitals. The funding issue for the public healthcare sector is a global
problem and with a growing population it will continue to affect the public healthcare
sector in many countries (Irfan and Ijaz, 2011). There was one study of the private
healthcare sector (Butt and Cyril de Run, 2008) that found negative perceptions in all
five determinants. Service reliability and responsiveness received the highest negative
scores which indicated to the researchers that the patients did not trust the service
providers and this could have been one of the main reasons for the negative perceptions.
Butt and Cyril de Run (2008) stated that the private healthcare providers in Malaysia
were required to emphasise employee training to reduce response times and introduce a
genuine urgency when responding to their customers.
There were two studies that compared the results of two groups of respondents within
the same study (Lee and Yom, 2006) who compared the responses of patients and
nurses and Curry et al., (1999) who compared the responses of residents and relatives of
the nursing home service. Both studies found different results for each group of
respondents. Discovering different results for groups that are affected by the same
services are very interesting findings for the management of these service providers.
39

The findings can act as a strategic management tool to improve the service quality of
the healthcare services.
Culture also forms an aspect of any study as was the case in the study by McGorry
(1999). The study was in relation to healthcare of a Latino population who were of low
income. The study found that the respondents had low expectations of the healthcare
services and this was attributed to the culture of the respondents. The perceptions were
greater than the expectations in 12 areas of a 22 item questionnaire. McGorry (1999)
stated that this was a relatively strange finding and that socioeconomics were a strong
factor in this study.
There are similarities in the studies in terms of outcomes for the public sector in so
much that the lack of government funding has affected the service quality of the public
hospitals globally in addition to being country specific.
40

Table 5: Other Healthcare Studies and the SERVQUAL Instrument
Table 5 illustrates studies that have tested the validity and reliability of the SERVQUAL Instrument in addition to other statistical calculations.
AUTHOR(S) ORGANISATION APPLICATION OF SERVQUAL
SAMPLE METHOD FOR SERVQUAL ANALYSIS
Ahmed and Samreen (2011)
Karachi Hospitals 26 item questionnaire to include accessibility and affordability. Translated into Urdu.
5 point Likert scale.
Private Hospital 96. Semi- public Hospital 90Public Hospital 66Total sample= 252
Factor Analysis
Regression model linked to patient satisfaction.
Alrubaiee (2011) Investigated the relationship between service quality and satisfaction in public and private Jordanian Hospitals.
Refined and modified the SERVQUAL scale. 32 item questionnaire on a 5 point Likert scale.
330 questionnaires given to patients in 4 private and public hospitals. 290 useable questionnaires returned.
Factor Analysis.
Multiple regression model linked to patient satisfaction.
Babaskus and Mangold (1992)
Assessed Patient’s perceptions of service quality in a multi-hospital corporation in the US.
A modified SERVQUAL scale 15 item questionnaire.
2036 patients discharged within 13 months. 443 responses.
Factor Analysis and correlation used to assess the validity and reliability of the Instrument. All five dimensions were found to be greater than 0.5.
41

Table 5 continued
AUTHOR(S) ORGANISATION APPLICATION OF SERVQUAL
SAMPLE METHOD FOR SERVQUAL ANALYSIS
Chaniotakis and Lymperopoulus (2009)
Service quality on satisfaction and word of mouth in the healthcare industry in Greece.
Adapted SERVQUAL, 5 point Likert scale and 20 item questionnaire
Population 25,000, Sample 1000, Respondents 1000.
T-test
Cronbach Alpha
Irfan and Ijaz (2011)
A comparison of a private and public hospital in Lahore, Pakistan.
Modified the 22 item scale to a 5 point Likert scale. Changed the wording to suit the study. Kept 22 questions.
500 questionnaires, 320 useable questionnaires. The sample had all attended both hospitals.
Cronbach Alpha. Mean Score, standard deviation.
T-test.
Kim and Han (2012)
Improving service quality in long term care hospitals.
Adapted SERVQUAL to 18 item questionnaire and linked the questionnaire to job satisfaction.
230 hospital employees in 18 long term care hospitals. 198 responses.
Multivariate Analysis
Lim and Tang (2000)
Examined patients’ expectations and perceptions of hospital service quality in Singapore.
25 item SERVQUAL adapted questionnaire adding affordability and accessibility.
A sample of 252 surveys were collected.
Mean standard deviation and the Mann Whitney-test.
42

Manaf and Nooi (2009)
Out-patients and in-patients on the basis of the SERVQUAL model in public Malaysian hospitals.
SERVQUAL 22 item questionnaire used.
A sample of 646 inpatients and 570 outpatients
Factor analysis
Mostafa (2005) Tested perceptions of service quality in 12 private and public Egyptian hospitals.
SERVQUAL 22 item questionnaire, 5 point Likert scale.
500 questionnaires distributed, 332 successfully collected from 12 hospitals.
A statistically significant difference in terms of service quality between public and private hospitals.
Petrovici and Philips (2009)
Used the basis of SERVQUAL to develop SERVHOSP, an instrument designed for use in a private hospital in Romania.
SERVHOSP had eight determinants, tangibles, responsiveness, empathy, ambience, communication, credibility and risk management over 31 item paired questions.
Two studies.
Study one: 30 in-depth interviews with patients, doctors and nurses to develop the SERVHOSP instrument.
Study two: Sample of 384 patients
Cronbach Alpha.
T-Test
Vandamme and Leunis (1993)
Development of a multi-item scale for a general hospital in Brussels healthcare sector.
Adapted SERVQUAL to 28 item questionnaire (extended tangibles and responsiveness questions).
Conducted in Brussels hospitals. Sample 90, 70 respondents.
Cronbach Alpha (range: 0.58-0.75)
Factor Analysis
43

Two studies in table 5 have linked service quality with patient satisfaction (Ahmed and
Samreen, 20011; Alrubaiee, 2011) A study linked service quality and word of mouth
(Chaniotakis and Lymperopoulus, 2011) and a third study linked service quality with
job satisfaction (Kim and Han, 2012) . Five studies were conducted in the public sector,
two in the private sector and four in the public and private sector. The studies were
more difficult to compare than the studies in table 4 as different statistical calculations
were conducted for each of them.
Lim and Tang (2000) found in their study of public Singapore hospitals that two of the
highest expectations were in the reliability dimension and responsiveness dimension.
Lim and Tang suggested that hospital management required to be responsive, friendly,
courteous, treat patients with dignity and respect and most of all, explain to patients
their medical condition thoroughly. The largest difference between expectations and
perceptions was in the waiting times (responsiveness dimension); patients were unhappy
with the long waiting time of more than one hour for services. The study did indicate to
management where customers were least happy and this was valuable information.
Irfan and Ijaz (2011) in the comparison study of private and public hospitals in Pakistan
found similar results to Camilleri and O’Callaghan (1998) in the comparison study of
Maltese private and public hospitals; that the customer expectations were greater for the
private hospitals. Mostafa (2005) found a statistically significant difference in the
service quality between private and public hospitals.
The results of some of the studies in table 5 indicated that that there was a difference in
expectations and perceptions between the private and the public sector. Private
healthcare owners should be aware of the expectations and perceptions that customers
have of private healthcare services. Babaskus and Mangold (1992) stated that the
measurement of patient expectations in addition to perceptions provided a valuable
insight into business processes for service quality of a private hospital corporation in the
USA.
2.10 A Review of Studies in the Healthcare IndustrySpecifically in the UK, the private sector consists of private hospitals (who often have
the same medical personnel as the public NHS sector but provide different services e.g.
free coffee in reception, free car parking) and other ancillary medical services such as
44

physiotherapy, podiatry, dentistry, cosmetic treatment, fertility etc. operating from
regulated private practices. Lafond (1995) stated that the growth in the UK private
practice for healthcare, is mainly due to the perception that the quality is poorer in the
public sector alongside lengthier waiting times for appointments. The studies outlined
below are in the main from table 3 as they are studies that have utilised the
SERVQUAL instrument in a similar method to the current study. There are also two
studies from table 4 that are relevant.
2.10.1 Healthcare Sector Studies
Ahmed and Samreen (2011) explored the dimensions of the SERVQUAL model and
patient satisfaction in three selected hospitals in Karachi (public, private and semi-
public). They compared the service quality gaps between the three hospitals. They
added Feedback and Guidance (informative brochures were available, patients
explained their condition thoroughly and doctors and staff understood the specific needs
of the patient). Also added was Affordability (consistency of charges and charges for
the services rendered were affordable). In the public hospital, they found Reliability,
Responsiveness, Tangibility, Professionalism and Empathy as the statistically
significant predictors of patient satisfaction. They noted for management that more
attention was needed in the cleanliness of the hospital, waiting times and feedback on
the medical condition. In the private hospitals Reliability, Responsiveness, Feedback,
Guidance and Affordability were found to be statistically significant determinants of
patient satisfaction. They mentioned that management needed to concentrate on
reducing waiting times to ensure that the doctors were available at the allocated times.
The semi-public hospitals resulted in factors Reliability, Responsiveness, Tangibility,
Professionalism and Empathy as statistically significant in patient satisfaction. In
particular they noted that management had to take more notice of the record keeping
(making it error free), the cleanliness of the hospital and for staff to be more courteous.
Ahmed and Samreen (2011) provided service quality information to the management of
the hospitals and compared the three hospitals in terms of service quality and customer
satisfaction. They found that the service quality determinants reliability and
responsiveness featured as a significant link to customer satisfaction in all three
hospitals.
Butt and Cyril de Run (2010) argued that customers’ perception of quality in the private
healthcare service formed part of their decision to select a particular private provider. 45

They conducted a study into 340 randomly selected participants visiting a private
Malaysian healthcare facility during a three month data collection period. Butt and Cyril
de Run (2010) kept the five determinants of the SERVQUAL scale but reduced the
questions from a 22 item scale to a 17 item scale. The analysis of the mean gap scores
were of a negative perception of service quality in all of the five areas (Tangibles,
Reliability, Responsiveness, Assurance and Empathy). The conclusion drawn from the
negative perceived service quality was that it was an unimpressive assessment of the
private Malaysian healthcare facility. The findings represented a good example of when
the perception is negative, the reasons why are limited and therefore are unable to
provide adequate management information with which to make strategic business
decisions.
A further study by Camilleri and O’Callaghan (1998) compared Service Quality in both
Public and Private Hospitals in Malta. The service quality issues in Malta were
primarily as a result of the economics of the country; the decrease in public hospitals to
an increase in private hospitals. This led to a requirement to look at service quality in a
different light due to the competitiveness between the private hospitals. Camilleri and
O’Callaghan (1998) compared the expected and perceived service quality in the private
and public healthcare sector in Malta using an adapted SERVQUAL questionnaire.
They conducted the research using two frameworks (Donabedian, 1980 and
Parasuraman et al., 1990). The first questionnaire measured the patients’ expectations of
service quality for private and public hospitals and the second questionnaire measured
the perceptions of the particular hospital they attended. Camilleri and O’Callaghan’s
(1998) questionnaire measured: Catering, Hospital Environment, Professional and
Technical Quality, Patient Amenities, Service Personalisation and Accessibility. The
results and comparison of both the private and public hospitals is displayed in table 6
and graph 1 below.
46

Table 6: Rank Order of the Different Service Quality Groups (Camilleri and O‘Callaghan, 1998)
Rank Public Sector Private Sector
1 Professional and technical care
Professional and technical care
2 Service personalisation Service personalisation
3 Price Environment
4 Environment Accessibility
5 Patient amenities Patient Amenities
6 Accessibility Catering
7 Catering Price
The table demonstrates the different ranking for the private hospital compared to the
public hospital. There are two factors that rank the same at the top of the list
(Professional and technical care and Service personalisation).The other factors are not
too dissimilar in the ranking apart from one that stands out (price). Price is also a clear
differentiator in the UK between the public and the private sectors as the public sector is
funded from public money. The second part that is interesting in this study was the
patients’ expectations in both the public and the private hospitals as displayed in graph
1.
47

Graph 1: A Comparison of Patient Expectations for Public and Private Hospital
Care Service Quality in Maltese Hospitals (Camilleri and O’Callaghan, 1998)
The graph shows that whilst the patients’ rankings in table 6 were not too dissimilar, the
expectations of the two hospitals are quite different. The expectations of the private
hospitals were higher than the public hospitals with the exception of accessibility.
Camilleri and O’Callaghan (1998) stated that the price factor may have played a
significant role in the difference between the private and public hospitals. Interestingly,
they note that because of limited professional resources, often the public and private
sectors employ the same personnel, however the expectations of both those services
remain different. Perhaps the marketing of the private hospital had a greater impact on
the expectations of the patients for the private sector (Camilleri and O’Callaghan, 1998).
Graph 1 demonstrates that customers do have different expectations of private services
and this is essential information for any services provider. In order to meet the
expectations, the provider needs to know what they are. Hart (1996) argued that by
ignoring customer expectations, deep rooted problems in service quality can surface.
Irfan and Ijaz (2011) conducted research into both a public and private hospital in
Lahore, Pakistan. The sample consisted of 320 patients that had attended both hospitals.
Irfan and Ijaz changed the wording of SERVQUAL to suit the study and changed the
term responsiveness to timeliness. Patients’ perceptions were measured in both hospitals
and graph 2 below demonstrates the difference in perceptions between the two
hospitals.
48

Graph 2: Pakistani Hospitals, Private and Public
Source: Irfan and Ijaz (2011: 15)
The perception following the visit to the hospital was that the private hospitals were
perceived to have better service quality. Comparing the two hospitals, the assurance
dimension was higher than the other dimensions, this was as a result of the hospital
being a training hospital where top medical professionals train. It was thought that the
doctors at the training hospital assured the patients nearly as much as in the private
hospital giving the higher assurance response factor for both the private and the public
hospitals.
Like many countries, the private hospitals in Pakistan depend on customers to meet their
financial budgets and constraints. The results of the study above show that the private
hospital is focussing on aspects around the patient experience. The public hospital relies
on government funding, government interest and the development of the public
healthcare sector. Due to the rapid growth in population, the public hospitals have found
themselves increasingly underfunded and this has affected the service quality of the
49

public hospitals (Irfan and Ijaz, 2011). This is similar to other findings of comparisons
of public and private healthcare (Camilleri and O’Callaghan, 1998; Mostafa, 2005).
Chakravarty (2010) conducted research at a peripheral military hospital outpatient
department. The sample consisted of 50 patients. The research was conducted using the
original SERVQUAL 22 item questionnaire with only minor word changes to fit the
context of the hospital outpatient services. They found that there were negative
perceptions of the service quality in all five determinants in the following order:
Responsiveness -0.65, Tangibles -0.55, Assurance -0.28, Empathy -0.11 and
Reliability -0.04. From a management perspective, it was important to note where some
of the largest negative service quality gaps were. Two included: question 1 in
Tangibles: Excellent outpatient services should have modern equipment (-1.50) and
question 11 in Responsiveness: Excellent outpatient services should give prompt service
(-1.14). This may have indicated to management that there was unhappiness around the
equipment used and the service provided at the reception desk or when the patient called
to make an appointment. It was difficult to know precisely what the issues were with
both of those negative service quality gap scores and a deeper investigation would in
this instance have been helpful. It was noted from the discussion in this paper that
further analysis as to the reasons behind the negative perceptions would have been of
benefit to the management of the hospital services. There was a negative score for
waiting times (-0.16) in the Tangibles determinant. Chakravarty (2010) thought that this
was because of the location of the outpatient services; being a military hospital, the
services were on the military campus and not always easy to access. With all five areas
having a negative service quality gap, Chakravarty (2010) indicated that the analysis
was a significant prompt to management to re-structure the outpatient services. There
were only two questions that had a positive service quality gap and they were both in
the Empathy determinant including, giving individual attention to patients and readiness
for personal attention. Overall Empathy had the least negative service quality gap score
-0.11 but responsiveness had the most negative service quality gap -0.65 indicating that
the patients’ expectations of the services were not quite met for the Empathy
determinant but the expectations for responsiveness were not met at all. Responsiveness
was concerned with the ease of appointments, prompt service, willing staff and prompt
response to any request. This is one of the areas that management could identify as an
area for improvement.
50

Curry et al., (1999) researched service quality in care homes and compared the
SERVQUAL results between the residents of the care home and the relatives of the
residents. Further they used a mixed method approach of the SERVQUAL instrument
and the nominal group technique for three key stakeholders (patients, general
practitioners and clinical staff). Their SERVQUAL research from residents found that
highest expectations came from the assurance and responsiveness determinants.
Tangibles were the lowest priority. For the relatives, the highest expectations came
from assurance and reliability dimensions whilst responsiveness and reliability
received the most positive gap scores. Comparison of both sets of data, residents rated
assurance more highly than the relatives; relatives rated empathy more highly than the
residents and tangibles were more important to the residents. This data was also
valuable information for the management of the care homes. Training could be provided
to the staff to improve the areas of concern where there where service quality gaps.
Karassavidou et al. (2009) conducted research into service quality in Greek public
hospitals using an adapted SERVQUAL questionnaire similar to Ahmed and Samreen
(2011). Karassavidou et al. (2009) added accessibility and affordability as a sixth
determinant. Karassavidou et al. (2009) split the questionnaire into three factors: Factor
1 Human Aspect, Factor 2 Physical Environment and Infrastructure and Factor 3
Accessibility, all factors had a negative service quality gap. The least positive gap (-
2.08) fell under factor 2: physical environment and infrastructure and was for question
23: informative brochures about the provided service are available to patients; followed
by question 17: the hospital’s equipment is up-to-date and well maintained (-1.88). The
highest score, although still a negative mean gap score was in factor 3: accessibility,
question 24: (-0.85) the hospital is easy to access (e.g. parking facilities), followed by
question 20: Doctors and staff are always neat (-1.08).
The study articulated that the Greek hospitals were seriously underfunded and this may
have accounted for such a negative perception compared to the patient’s expectations.
Karassavidou et al. (2009) suggested that their research did not fully cover the reasons
for the negative perception and recommended that qualitative methods employed
alongside quantitative methods would provide a better understanding of the complex
issue of service quality in the healthcare sector.
51

Lee and Yom (2006) investigated service quality in Korean hospitals with a sample of
272 patients and 282 nurses, using the SERVQUAL 22 item paired questionnaire on a 5
Likert scale. The study compared the patients’ mean service quality gap score and the
nurses’ mean service quality gap score. The highest expectations for both groups were
for the reliability factor whilst tangibility received the lowest expectations for both
groups. Their findings contrasted with Lim and Tang (2000) whose research of
Singapore hospitals placed assurance as the highest expectation. The nurses had
consistently higher expectations than the patients. Lee and Yom (2006) stated that the
nurses should discover what the patients’ expectations are and not just simply assume
that they are equal or the same. The overall mean gap score was negative and most
statements had a negative perception for the patients apart from question 3 under
tangibles: provide a good feeling because of appearance and question 12 under
responsiveness: provide medication and treatment at the correct time. The nurses’
perception of the service quality of the hospitals was negative for all 22 questions and
again further information would have been beneficial for the hospital management.
McGorry (1999) conducted a study with a Latino population in a public healthcare
setting (obstetrics/gynecology unit) in an urban area of the north-eastern USA with a
large Puerto-Rican population. SERVQUAL was adapted to a 5 point Likert scale but
the original SERVQUAL determinants were utilised in the study and the wording
moderately adapted for the environment. 106 patients were asked to complete the
survey and 105 questionnaires were returned. Perceptions were higher than expectations
in: staff/doctor showing sympathy, the unit providing prompt service, the unit
responding to requests promptly, trusting the staff, feeling safe in transactions, staff
being polite, given personal attention, staff knowing the needs of the patient and
convenient hours of the unit. McGorry (1999) noted that 13 expectations were higher
than the perceptions and that Brown et al. (1993) stated that this was unusual. McGorry
(1999) presented that this phenomenon could be a result of the socio-economic factors
of the population i.e. low income and therefore the sample had lower expectations of
service standards.
Petrovici and Philips (2009) used the basis of SERVQUAL to develop SERVHOSP, an
instrument designed for use in a private hospital in Romania that encompassed 6
determinants: Tangibles (standards of appearance, equipment and consumables)
Empathy of personnel (comfort and availability of employees); Responsiveness to 52

patient needs (to be seen promptly and convenient visiting hours), Reliability (keep
appointments and to receive a good service); Ambience (of reception) and Risk
Management (competent doctors, feel safe from risks and clean hospital). One of their
main findings was that perceived security from risks (risk management) from
malpractice was one of the main components of patient assurance. The Romanian study
may have implications for the context and culture in which it was set. Further studies
are required using SERVHOSP to determine the applicability for UK hospitals. The
study further endorsed the requirement for the need to use a method that suits the
purpose, culture and context.
Resnick and Griffiths (2011) undertook a study into privately funded alcohol treatment
services in the UK. Data was gathered via interviews with two groups of participants
using the SERVQUAL questionnaire as the tool from which to capture the information.
The first group comprised 32 patients and the second group comprised 15 clinic staff.
The original SERVQUAL instrument was utilised with no adaptations other than
demographic questions. From the patient group, there was one category (reliability) that
had a negative service quality gap score -0.2. For the clinical staff group, there were
four categories that were negative (Reliability-0.6, Assurance -0.5, Responsiveness -0.2
and Empathy -0.1). Resnick and Griffiths (2011) concluded that achieving consistent
service quality and improving empathy between staff and patients would benefit the
overall service quality perceptions. This was an interesting conclusion as the patient
group had a positive empathy score of 0.1. It may however indicate that empathy
between the staff and management was the problem and not between the patients.
Further information on this matter would have given management a very valuable
insight into why the empathy factor was lower with the staff group than with the patient
group.
Youseff et al. (1996) found a negative perception of service quality when they
conducted a study into West Midlands Hospitals. 300 questionnaires were distributed to
patients chosen from West Midlands Hospitals who had attended surgical, orthopaedic,
spinal injury, medicinal, dental and other specialities. The total response rate was 174
(29% from mailed questionnaires, 80% from questionnaires handed to patients and 36%
distributed by GPs). A 9 point Likert scale was utilised throughout the questionnaire
from strongly agree (9) to strongly disagree. The researchers adapted the original
SERVQUAL questionnaire with minor wording relating to hospital services i.e. 53
question 14 Assurance: Patients would feel secure at receiving medical care at excellent
NHS hospitals for all five determinants (Tangibles, Reliability, Responsiveness,
Assurance and Empathy). Youseff et al. (1996) found that the patients’ highest
expectation dimension was reliability, followed by empathy, responsiveness, assurance
and tangibility and yet their lowest perception of the service quality (in order of
descent) was reliability, empathy, responsiveness, assurance and tangibility. Their study
therefore resulted in an overall negative perception of the West Midlands NHS
hospitals. This represented a serious finding for the management and staff of the
hospitals. It was difficult to interpret why those patients had negative perception scores
other than pinpointing that reliability was a major factor. Included in reliability was:
question 5: providing services at a time they said they would, question 6: when a patient
has a problem, NHS shows a sincere interest in solving it, question 7: excellent NHS
hospitals will carry out the services right the first time, question 8: excellent NHS
hospitals will provide error free records and question 9: hospital staff in excellent NHS
hospitals would carry out services right the first time. For management information, it is
useful to note the gaps between the perceptions and expectations for each determinant
but again it is difficult to know the deeper reason for the negative perceptions of the
service quality within the hospitals.
Many of the service quality studies on the healthcare sector are empirical studies based
around the SERVQUAL questionnaire or an adapted version of SERVQUAL as
described in tables 4 and 5. The studies analysed the service quality gap but they did not
describe the reasons for the positive or negative perceptions, in particular the negative
perceptions when the customers’ expectations have not been met.
2.11 Service Quality in the Physiotherapy Industry
Predominantly in the UK, the physiotherapy industry sits under the umbrella of the
NHS or within the Private Hospitals e.g. (BUPA and The SPIRE) or operates as an
independent regulated Private Practice. All physiotherapists are covered under the
Chartered Society of Physiotherapy. It is the largest of the Allied Health Professions
(AHPs) with more than 50,000 practitioners in the UK. AHPs are an essential part of the
NHS and Private workforce, delivering services across health and social care services
(csp.org.uk)
54

Through the Health Care Professions Council (HCPC), the call for service quality in the
physiotherapy industry has increased in line with Government legislation and as a result
increased pressure on the private independent practice. Quality Assurance Standards for
physiotherapy service delivery appear under the Chartered Society of Physiotherapy
guidelines (csp.org.uk/standards). The concept of delivering a quality service falls under
category nine of the guidelines (9) Evaluation of clinical care and services. This is
further broken down into four parts: (1) that effective quality improvement processes
are in place; (2) that a clinical audit programme ensures continuous improvement; (3)
that there is a clear and responsive procedure for making and dealing with complaints;
and (4) any treatment plan is evaluated to ensure that it is effective and relevant to the
goals (http:www.csp.org.uk/professional-union/professionalism/what-professionalism).
In the physiotherapy industry, the Quality Assurance Framework (csp.org.uk/standards)
does expect a quality improvement process to be in place. Quality of services in the
private practice remains a very important strategic element of a physiotherapy business.
The private practice competes not only on the core service (the physiotherapy treatment)
but very much on the services element of the practice (the reception area, appointment
system process, staff behaviour, the manner in which customers feel they have been
dealt with and the fee they pay for that service). Camillerri and O’Callaghan (1998) and
Ahmed and Samreen (2011) suggested that both expectations and perceptions of the
private sector were higher than the public sector. Price did play a factor in the study of
Camillerri and O’Callaghan (1998) where it was ranked much higher in the private
sector as a consideration. Table 7 overleaf describes studies in the physiotherapy sector,
the type of hospital or service, the methods utilised, the sample, and the analysis of the
data or information.
55

Table 7: Physiotherapy Studies
AUTHOR(S) STUDY METHOD SAMPLE ANALYSIS OF DATA OR INFORMATION
Curry and Sinclair (2002)
Assessed the quality of physiotherapy services in 3 NHS physiotherapy providers using the SERVQUAL questionnaire.
Minor changes to SERVQUAL,
22 item questionnaire.
Sampled three units that offered physiotherapy services. Sample 450. Respondents 134.
Mean Service Quality Gap Scores.
Rankings and weightings.
Goldstein et al., (2000)
Assessed patient satisfaction and physiotherapy.
A 20 item questionnaire on a 6 point Likert Scale.
Data was collected from 12 physiotherapy practices including a hospital outpatient clinic and a private practice. 289 completed questionnaires.
Factor Analysis
Cronbach Alpha
Potter, Gordon and Hammer (2003 a)
A qualitative study investigating the difficult patient in private practice physiotherapy.
Qualitative interviews over two phases.
Phase one: The sample was 20 physiotherapists working in private practice in Perth, western Australian.
Phase two: The sample was 17 physiotherapists working in private practice in Perth, western Australian with up to five years’ experience.
Nominal Group Technique to identify the typology of the difficult patient over two phases.
Potter, Gordon and Hammer (2003 b)
Identified the qualities of a ‘good’ physiotherapist and to ascertain the characteristics of good and bad experiences.
Structured two hour interviews
A purposive sample of 26 former patients recruited from private practices in western Australia.
Nominal group technique.
56

Table 7 describes the main physiotherapy studies. Only one study (Curry and Sinclair,
2002) has utilised the SERVQUAL instrument in the physiotherapy sector to measure
service quality. The other studies are concerned with the satisfaction with the treatment
or the behaviours of the patients or the therapists. Little has been previously written
with regard to service quality and the physiotherapy sector. There is therefore a gap
between what the legislation requires and what the physiotherapy sector have in place to
meet the legislation requirements.
2.11.1 A Review of Studies in the Physiotherapy Industry
The main comparison study is Curry and Sinclair (2002), referred to in table 8 overleaf.
Curry and Sinclair (2002) looked specifically at expectations and perceptions of service
quality in three physiotherapy units under the NHS umbrella: outpatient physiotherapy,
a community rehabilitation team (CRT) and services offered at a GP’s surgery. They
adapted the SERVQUAL questionnaire with minor wording to fit the context of each of
the three physiotherapy providers. They distributed 450 questionnaires and 134 were
deemed useable. They found the following results in the table overleaf:
57

Table 8: Findings of Physiotherapy Study (Curry and Sinclair, 2002)
Type of Provider
Expectations
Highest Mean
Expectations
Lowest Mean
Perceptions
Highest Mean
Perceptions
Lowest Mean
Community Rehabilitation Team (CRT)
Assurance
Empathy
Responsiveness
Tangibles
Empathy
Assurance
Empathy
Reliability
Tangibles
Empathy
Outpatient Physiotherapy
Services
Assurance Tangibles Assurance
Tangibles
Responsiveness
Tangibles
Services offered at GPs Services
Empathy
Reliability
Responsiveness
Tangibles Empathy
Assurance
Responsiveness
Tangibles
Empathy
Table 8 shows the highest and lowest mean gap scores for all three physiotherapy
providers.
Curry and Sinclair (2002) found patients had low expectations and low perceptions of
the materials, equipment, physical environment and operating hours, this did not mean
that they had negative perceived service quality, it meant that both expectations and
perceptions were low and therefore the service quality gap was small between those
variables but not negative. These findings were different to many other healthcare
studies. It may have been due to the fact that much of the treatment was home based as
opposed to hospital based and this factor therefore changed the respondents’ views of
expectations and perceptions of the physiotherapy services provided.
Curry and Sinclair (2002) found that the most positive service quality gap between
expectations and perceptions was the empathy determinant followed by reliability,
assurance, responsiveness and finally tangibles.
Curry and Sinclair (2002) found difficulties with the administration of the
questionnaire; mainly older patients’ understanding of the questionnaire and many
58

patients found the questionnaire too long. In their questionnaire, Curry and Sinclair
(2002) considered both the services and the treatment in the study.
Goldstein et al. (2000) researched patient satisfaction and physical therapy with a
specific 20 item questionnaire on a 6 point Likert scale. They found that satisfaction
was always relative to the patients’ expectations. They further stated that patients who
are satisfied with the overall service remain loyal to their therapist. The dimensions
described in the research were: Access ( physical location, operating hours, appointment
times and waiting times); Administrative Technical Management (ambience of
facility, parking payments/claims processing, quality assurance programmes); Clinical
Technical Management (qualifications of staff including clinical skills of
physiotherapists and technical skills of other staff); Interpersonal Management
(responses to complaints or suggestions, warmth/friendliness of the therapists and other
members of staff, appropriate amount of time spent with each patient and respect for
patient privacy) and Continuity of Care (intent to continue to have condition managed
by provider, knowledge of patients’ history, patients’ recommendations to others and
general satisfaction with the intervention received. This study did include some service
questions: question 9: all other staff members were courteous, question 10: the clinic
scheduled appointments at convenient times, question 13: it was easy to schedule visits
after my first appointment, question 14: I was seen promptly when I arrived for
treatment, question 16: my bills were accurate and question 18: parking was available
for me. Other questions were centred around the satisfaction with the therapist and the
treatment and the cost of the service.
Potter, Gordon and Hamer (2003a) conducted a qualitative study into the ‘difficult
patient’ in private physiotherapy practice in Australia but only patients’ behaviours
were considered. The study included Physiotherapist communication, Behaviour
Modification, Referral or Involvement of others. In relation to patients’ expectations
they found that there were two problems raised by the study. They found that patients
had unrealistic expectations of what a physiotherapist could do for them and secondly
they wanted their ‘injuries’ fixed immediately.
The study conducted by Potter Gordon and Hamer (2003b) was to ascertain the
characteristics of ‘good’ and ‘bad’ experiences in the private physiotherapy practice
with a sample of 26 patients. Their qualitative data (nominal group technique) found
59

communication ability, professional behaviour and organisation ability were the
main qualities of a ‘good’ physiotherapist compared to their ‘bad’ experiences that was
related to dissatisfaction with the service followed by poor physiotherapist
communication. Their main communication finding helped the therapist to see that
involving patients in the management of their care was a benefit.
In an exploratory study into physiotherapy and patients’ satisfaction, May (2007)
interviewed 34 patients who had back pain and had been treated at an outpatients centre.
May identified five important factors: a professional approach, communication to
patients regarding the problem and prognosis, collaborative consultation, the
appointment structure and flexibility of appointments as good treatment outcomes.
The physiotherapy studies described have been concerned with satisfaction of the
outcome of the treatment apart from Curry and Sinclair (2002) who were concerned
with the patient’s expectations and perceptions of the service quality of the
physiotherapy service providers. Other physiotherapy studies reported in the literature,
were mainly of a qualitative nature but did not investigate expectations and perceptions,
only behaviours, satisfaction and treatment outcomes. Lees (2011) indicated that patient
stories that support survey research give an important insight into patients’ experiences
of the services provided. Stories form a narrative account which offers an exciting
opportunity to learn from patients and gain a deeper understanding of their experience
(Launer, 2002). Lees (2011) added that nursing research needed to move away from a
healthcare environment that is built on logic and statistical information to a more
empathetic and interpretative approach.
2.12 Conclusion of the Literature Review
The aim of the study was to assess the service quality of an independent private
physiotherapy practice. The literature review was therefore concerned with a review of
service quality in the healthcare sector. The literature revealed that there were two main
models for service quality, the American model and the Nordic model. The review
highlighted that the model that was most appropriate for this study was the American
model known as the Gaps Model of Service Quality (Parasuraman et al., 1985). This
model was suitable more to measuring services and it measured the gap between two
service quality variables (expectations and perceptions). There was a clear argument in
the literature for measuring both expectations and perceptions as it was thought that this
60

provided management with a deeper understanding of service quality within an
organisation. One of the benefits of the Gaps model is that the SERVQUAL Instrument
was designed specifically to measure expectations and perceptions of service quality
and this was to fulfil gap 5 of the gaps model.
From the review of the healthcare studies, it was evident that many researchers had
analysed the SERVQUAL data as a mean gap score. This was also relevant to this study
as it was the service quality gap that the study was concerned with not the testing of the
validity and reliability of the instrument. The review of the healthcare studies also
highlighted that amendments had been made to the SERVQUAL instrument but the
originators of the tool suggested that only minor changes should be made to the
questionnaire to ensure validity and reliability. This study determined to investigate
service quality with the SERVQUAL instrument including the five determinants as
outlined by Parasuraman et al. (1985). In addition, the healthcare studies outlined the
service quality as a positive or negative score but there was little justification as to the
gap in particular when the perceived service quality gap was negative, in other words
when the customers’ perceptions of the service did not meet their expectations.
From the review of the physiotherapy studies, it was revealed that there was a limited
amount of research in the field of service quality in the physiotherapy sector and no
previous service quality research into the private independent physiotherapy practice.
The literature review also highlighted that the quality assurance framework pertaining to
the physiotherapy sector was not supported by research in the field of service quality
and that this was also a gap in the physiotherapy service quality literature.
61

2.12.1 The Gaps from the Literature Review, Research Questions and
Conceptual Model
Table 9: The Gaps from the Literature Review and Research Questions
Literature Gaps Research Questions
1. The identification of an appropriate conceptual framework for investigating service quality in an independent private physiotherapy practice which will extend the theory and contribute to practice.
1. How will the conceptual framework add to the service quality theory and contribute to practice for the independent private physiotherapy practice?
2. To undertake a more meaningful investigation of perceived service quality in an independent private physiotherapy practice.
2. Can the perceived service quality of an independent private physiotherapy be explored?
For research question one, the original SERVQUAL framework is first described in
figure 3 followed by the amended SERVQUAL Instrument and the conceptual model
for this study.
Figure 3: The Determinants of the Original SERVQUAL Instrument
Figure 3 outlines the original five determinants of the SERVQUAL Instrument. This
was adapted for the study as next described in figure 4.
62
Reliability
Responsiveness
Assurance
Empathy
Reliability
Tangibles
Responsiveness
Assurance
Empathy
Tangibles

2.12.2 The Conceptual Model for the Study
The conceptual model utilised for the study was the Gaps Model of Service Quality
(Parasuraman et al., 1985) and the gap for measurement was gap 5. The SERVQUAL
Instrument was chosen as the Instrument to measure this gap. Questions regarding the
interior and exterior of the practice building were added to the SERVQUAL Instrument.
Sureshchandar et al. (2002) and Lovelock and Wirtz (2007) termed this aspect of
services servicescape. The amended SERVQUAL determinants are shown in figure 4
below as part of the conceptual model for the study.
Figure 4: The Conceptual Model for the Study and the amended SERVQUAL Instrument
63
Tangibles
Assurance
Empathy
Reliability
Responsiveness
Assurance
Empathy
Tangibles
Servicescape
Expected Service
Gap 5
Servicescape
Perceived Service
Reliability
Responsiveness

Figure 4 shows expectations and perceptions as two equal sections that form an
adapted 25 paired item comparison questionnaire (SERVQUAL) that measured gap 5 of
the Gaps Model. Sureschandar et al. (2002) refer to servicescape as the physical man
made aspects of the business environment. For this study, this was the outside décor of
the buildings, the décor of the reception and the treatment rooms. Sureschandar et al.,
(2002) argued that servicescape was missing from the original SERVQUAL
questionnaire and that it was an area that was important to customers. The
SERVQUAL questionnaire measured the service quality gap between the expectations
of any physiotherapy service and the perceptions of the practice. The formula is
Perceptions (P) – Expectations (E) = Service Quality Gap (SQG). Appendix 3 shows the
amended questionnaire for the study.
64

Chapter Three – Methodology
3 Introduction
The purpose of this chapter was to outline the methodology and methods of this study
which was a mixed method study in two sequential phases. The nature of the primary
research was to resolve the research questions. The literature review was core to the
research questions and two central questions arose from the literature review:
1. How will the conceptual framework add to the service quality theory and
contribute to practice for the private independent physiotherapy practice?
2. Can the perceived service quality of an independent private physiotherapy
practice be explored?
This chapter was concerned with applying the conceptual model to the research
questions. The chapter first introduces the philosophical paradigms of the researcher and
how the paradigms relate to the study. The research approach to the study and research
design for phase one follows, including details on the pilot study, the sample and the
distribution. The chapter then describes details of the main study in phase one. Phase
two is explained next concerning the research design and the pilot interview. Lastly the
chapter discusses the ethics and the impact on the study followed by reflection of the
methodology of phase one and two.
The research questions provide a platform on which to build the research design and
research design relies heavily on philosophical assumptions about knowledge (Collis
and Hussey, 2009). Before decisions about which methods can generate the knowledge
which best addresses the research questions, an understanding of philosophy is
fundamental. The philosophical approaches that are available to the researcher follow a
continuum of paradigms. In discussing the philosophical approaches the chapter first
introduces two opposing paradigms, positivism and interpretivism as shown in figure 5
overleaf. Next the chapter explains the post-positivist philosophical approach and the
critical realist framework that the study has adopted. The chapter next describes the
methods employed to answer the research questions from a post-positivist ontological
perspective and a critical realist epistemology.
65

3.1 Theoretical Perspective
The philosophical approach to social science can be embodied by a set of basic beliefs
which the researcher brings to the study. Each research design has its own ontology (the
reality), epistemology (the knowledge of that reality between the reality and the
researcher). The methodology are the techniques used by the researcher to discover the
reality indicating the important issues surrounding a discipline and assisting the
researcher in developing a framework to answer the research questions (Easterby-Smith
et al., 2004). Figure 5 shows the continuum of positivism and interpretivism as two
contrasting ends of a philosophical spectrum and where post-positivism and critical
realism sit within that continuum.
POSITIVISM INTERPRETIVISM
Post-Positivism Critical Realism Social Constructionism
Figure 5: Continuum of Theoretical perspectives (Adapted from Collis and
Hussey, 2009)
The two contrasting paradigms (positivism and interpretivism). Table 10 below shows
the characteristics of both of these two very different paradigms:
66

Table 10: Positivism and Interpretivism Paradigms
Element Positivism Interpretivism
Ontology Reality is real and exists independently of the subjects being studied.
Reality is individually constructed, dynamic and changing. An output of social and cognitive processes.
Epistemology Findings constitute observable material things i.e. experiments and validation of findings.
Knowledge is socially constructed and accessed only through social actors using language and shared meaning.
Methodology DeductiveCause and Effect /Hypothesis
InductivePatterns, theories develop
Common Methods Quantitative methods. Experiments verification of hypothesis.
Qualitative methods such as in-depth interviews, case studies, participant observations.
Source: Easterby-Smith et al., (2008)
The table shows the ontological and epistemological elements of both those paradigms,
the methodology associated with them and the common methods utilised. Many of the
previous service quality healthcare studies have been undertaken from a positive
perspective using quantitative methods and very few healthcare studies have adopted a
purely interpretivist approach. This study sought to investigate service quality through a
mixed method approach that encompassed a post-positivist paradigm that included a
quantitative method (a survey questionnaire) and a critical realist paradigm that
provided a qualitative method and some depth (semi-structured interviews) but not the
depth a pure interpretivist would possess.
3.2 Post Positivism
Post-positivism was a movement following positivism. Positivism was a paradigm that
was applied to many natural science experiments. The post-positivist ontology allowed
the researcher to see the world from a paradigm that is both objective and subjective.
Post-positivism represented a more subtle scientific form, one that is free from absolute
truths and validity (Crotty, 1998). Further, Crotty (1998) subscribed to the thoughts that
a post-positivist researcher would significantly temper the claims they make in their
findings, making them sound less absolute and certain. Given that this study is 67

investigating service quality through a survey instrument and through a face to face
interview, a post-positivism ontology is both subjective and objective. Zammito (2004:
12) described the distinction between positivism and post positivism as the difference
between the context of discovery and the context of justification. The thrust of post-
positivism would be to pursue the notion of discovery as well as the notion of
justification, in other-words a mixed method approach would suit a post-positivist
ontology.
This current study was not concerned with statistical relationships between the two
variables (expectations and perceptions) but a more subtle form of measurement known
as the mean gap score. The gap between the expectation variable and the perception
variable that forms the calculation (P-E= Service Quality Gap Score) (Parasuraman et
al., 1985). The post-positivist ontology allowed the researcher to consider and justify
the service quality gap through measurement but not as extreme as the measurement
would be from a positivist paradigm. The study did not include a consideration of the
validity and reliability of the SERVQUAL Instrument but focused on what the service
quality gap meant for the practice in the study and the implications therein.
3.3 Critical Realism
To meet the overall aim of the study, it required an in-depth insight into service quality.
The knowledge that is within this world view is a view that looks at more than one level
of reality (Collis and Hussey, 2009). Bhaskar (1998) explained that within the
philosophical paradigm named realism lies the term critical realism as a natural
approach to science. Critical realism is sometimes known as a ‘depth’ realism, it looks
at more than one level of reality.
Critical realism is neither positivist nor interpretivist; it looks deeper than one level of
reality and permits the researcher to take a critical realist epistemological approach. It
allows the research to be layered or stratified and to consider more than one method to
meet the research aim and objectives and therefore suits a mixed method approach
where the overall aim is to consider a more meaningful analysis of the subject matter.
For the purposes of this study, the critical realist epistemological paradigm is based on
an understanding that the world is not as simple as one level of reality but that it is
indeed metaphorically based on layers or strata. It is through these different lenses that
68

the researcher sought to answer the research questions and the overall aim and
objectives of the study.
3.4 Research Approach‘Mixed methods’ is viewed by some as “the third methodological movement” (Doyle et
al., 2009) and has become the preferred term to stand for research that integrates
qualitative and quantitative research in a single study. Other terms which have been
used to describe the approach are: integrating; synthesis; multi-method; mixed
methodology and pluralism (Tashakkori and Teddlie, 2003; Bryman, 2006; Creswell,
2009). This research was undertaken with both quantitative and qualitative methods.
The increased level of acceptance of the mixed method approach is reflected in the
publication of recent texts (Creswell et al., 2003; 2009; Teddlie and Tashakkori, 2003;
Creswell and Clark, 2007).
Brewer and Hunter (2005) indicated that there was no best method but the combination
of different methods allows the researcher to investigate a research problem with a
range of methods that have overlapping weaknesses in addition to their complementary
strengths. Abrahamson (1983) supported this by stating that the approach prevents the
research becoming method bound. In other words the strength of every measure is
flawed in some way and therefore research designs and strategies can be constructed to
counterbalance the strengths and weaknesses of various methods. Creswell et al. (2003)
described mixed method design in which the researcher would mix aspects of the two
methods at several stages of the research process.
Table 11 below demonstrates how a sequential mixed method approach broadens
understanding by using both qualitative and quantitative methods building on the results
from one approach as well as using another. Creswell et al. (2003) and Brannen (2005)
suggested that it was necessary to prioritise the qualitative and quantitative element of
the research design. Methods that are carried out sequentially Creswell et al. (2003)
termed a ‘two phase study’.
69

Table 11: Mixed Method Design
Design Options
Equivalent Status Design In this form of research, the researcher conducts a study using both quantitative and qualitative approaches equally to understand the phenomena under the study.
Sequential: QUAL →QUAN and
QUAN→QUAL
Parallel/Simultaneous:
QUAL + QUAN and QUAN +QUAL
Dominant-Less Dominant Designs
This form of research design is dominated by one paradigm and its methods, whilst a small component of the study is drawn from another paradigm.
Sequential: QUAL→quan and
QUAN→qual
Parallel/Simultaneous: QUAL+ quan and QUAN + qual
Multi-Level Designs These are studies in which the data from more than one level of the organisation or groups are used to reach more comprehensive inferences regarding behaviours and/or events.
Any
Note: QUAL: Dominant Qualitative methods: qual: Less Qualitative methods
QUAN: Dominant Quantitative Methods: quan: Less Quantitative Methods
Source: adapted from (Miller and Crabtree, 1994; Creswell et al., 2003; Tashakkori and
Teddlie, 2003; Brannen, 2005)
In sequential methods, the researcher constructs a quantitative phase then a separate
qualitative phase or vice versa. The two stages are distinct and several phases of the
process may be implemented. For this study the quantitative research was the more
dominant stage and QUAN→qual was adopted.
Whilst a mixed method approach is widely supported it also has attracted some critics.
Bryman and Bell (2007) emphasised a concern that the development of the mixed
method paradigm has led to a belief that this paradigm is always superior to studies
70

based on a single method. Brannen (1995) concurred with this view and determined that
the researcher should rely on the research problem to determine the optimum method.
Table 12 describes the research questions with the methods for this study.
Table 12: The Research Questions and the Methods for the Study
Research Questions Methods
1. How will the conceptual framework add to the service quality theory and contribute to practice for the independent practice?
1 To apply the conceptual framework: The SERVQUAL Instrument – Phase One.
2. Can the perceived service quality of an independent private physiotherapy practice be explored?
2 To Explore Perceived Service Quality: Semi-structured Interviews – Phase two.
The table above shows the outline and rationale for the whole study, the methods
employed and the research questions investigated. The table outlines a mixed method
sequential approach over two phases.
3.5 Research Design, Phase One
Phase one was the dominant phase and was concerned with the quantitative aspect,
specifically the application of the SERVQUAL questionnaire to a sample of customers
at the practice. The instrument measured the service quality gap (SQG) between two
variables, expectations of service quality of any physiotherapy practice and the
perceptions of the service quality of the practice. The gap is referred to as the service
quality gap score and is expressed as a positive gap score or a negative gap score. A
positive gap score potentially indicates that the customers are positive about the service
quality and a negative score potentially would indicate the reverse (Babakus and
Mangold 1992).
A requirement of the first stage of the research was to consider the only other
physiotherapy study into service quality utilising the SERVQUAL Instrument (Curry
and Sinclair, 2002); this was the main comparison study for this research. Some
difficulties in the questionnaire with signposting and rankings allocation were recorded
by Curry and Sinclair (2002) from elderly patients in addition to comments about the
length of the questionnaire. Other authors had commented on the length of the
questionnaire (Franceschini and Cignetti, 1998; Dalrymple et al., 1995). Given the
71

previous feedback as to the length of the questionnaire, it was decided that the rankings
section would not be added to the questionnaire for this study.
The next step of the research design for phase one was to ask the directors of the
practice and the research supervisors for input and feedback. Further work was required
for the signage including clearer signposting on which part of the questionnaire referred
to expectations and which part referred to perceptions, this was echoed by Curry and
Sinclair (2002) and Franceschini and Cignetti (1998). In addition, the directors
requested that the questionnaire only measure service quality of the practice and not
service quality of the treatment. The rationale for this decision was that the researcher
was not a physiotherapist and therefore not qualified to interpret any data that concerned
the treatment. Both Hudak (2002) and Vandamme and Leunis (1993) felt that patients
were unable to evaluate the quality of the treatment offered by doctors and therefore
relied more on experience.
The instructions for the questionnaire clearly stipulated that the questionnaire was only
concerned with the service quality, the term was adapted for the customers and service
quality was referred to as customer service:
The questionnaire is ONLY enquiring about customer service, it is NOT
asking about the physiotherapy treatment you receive or have received.
The directors of the practice were also interested to know what their customers thought
of the internal and external décor of the building. The directors of the practice requested
that the SERVQUAL questionnaire be amended to include questions around the décor
of the outside and inside of the building; this is referred to in the literature as
servicescape (Lovelock, 1981; Sureschandar et al., 2002). The service quality model for
the research thus became the amended service quality model with the addition of the
servicescape determinant creating a 25 item paired questionnaire as previously
described in chapter two.
72

3.5.1 The Sample and Pilot Study
The focus centred on obtaining a sample from a customer population of 450 customers
of the practice. For sampling, it is first necessary to understand the population that the
research is aimed at “population is the set that contains all members of the social unit
you want to study” Maylor and Blackmon (2005:195). A prerequisite of the
questionnaire was that the perceptions part of the questionnaire was required to be
completed after a visit to the service provider (Youseff et al., 1996 and Robledo, 2001).
As the questionnaire was in two parts; part one asked about the expectations of
customer service for ANY physiotherapy service and part two asked about perceptions
of the practice. It therefore became necessary to choose customers who had prior
experience of the service who were not new customers to the practice. Establishing that
new customers were not to be included in the sample led the researcher to choose a
convenience sample for the pilot study and the main study. A convenience sample
selects haphazardly those people that are easiest to obtain (Saunders, 2007). Saunders
(2007) identified that convenience sampling is prone to bias with the ease to which the
sample is reached, however for this study, a convenience sample appeared to be the
most practical. New customers were identified by the receptionists as they were
required to attend for a one hour appointment as opposed to existing customers who
were only required to attend for a half hour appointment. The researcher attended the
practice at varying times (the opening hours of the practice are Monday – Wednesday
9.00am – 5pm, Thursday 9.00am – 7pm, Friday 9.00am – 5pm and Saturday 9am-12
noon) to ensure that customers were chosen at random for the convenience sample.
3.5.2 The Distribution Process Tested in the Pilot Study
It was agreed that the receptionists would hand out the questionnaires in the waiting
area and ask the customers to place the completed questionnaire in the sealed box on the
reception table where they would be collected by the researcher. Customers were
assured in the questionnaire of their anonymity and confidentiality and their informed
consent was gathered (see Appendix 7).
After two weeks, ten questionnaires were collected from the sealed box and after a
further week three more questionnaires were collected. The rate for the completed
questionnaires was slower than expected. Given that the questionnaires were being
73

slowly returned the researcher decided to observe what was happening in the practice
and was stationed at the practice reception at random times for three weeks.
The first day of observation in the practice was a realisation that this exercise had not
been easy for the receptionists. They were simply too busy to hand out the
questionnaires.
Other observations were noted; customers were anxious when they arrived for their
appointment and were therefore not best placed to complete a questionnaire. A few
people said that “the questionnaire was too long”. One customer wanted to take the
questionnaire away and complete it at home (an envelope was provided).
On reflection of the observations, there was a realisation that this was going to be a long
process of data collection, one that was not possible for the receptionists to perform who
were already working in a busy environment. It was also established that it was more
difficult to ask the customers to complete the questionnaire after their treatment; they
were often in pain, wanted to pay and leave. This added another dimension to handing
out the questionnaires. The customer had to arrive for their appointment at least ten
minutes in advance. There were other issues too, one customer had arthritic hands and
the questionnaire was completed for her, another said “this questionnaire is
complicated”.
The pilot study demonstrated more about the distribution than issues with the
questionnaire itself. The researcher felt more comfortable with the questionnaire
instructions when handing it to the customers when further instructions could be
verbally given. The researcher was also able to reiterate to the customers that the
questionnaire was only concerned with customer service and not the treatment. It was
therefore decided for the main study, that the researcher would hand out the
questionnaires in the practice at random times of the day in what became a three month
period.
3.6 Phase One of the Main Study
The amended questionnaire measured responses to six determinants as previously
described. In total, the 25 paired item questionnaire was adapted for use at the practice.
This paired item questionnaire is consistent with past research (Parasuraman et al.,
1985, 1988). A seven point Likert scale was used from 1 (strongly disagree) to 7
74

(strongly agree). The questionnaire also included questions regarding respondents’
demographics and this is shown in table 13 below. Questionnaires were distributed to
those customers who had previously attended the practice. The questionnaires were
handed to customers as they waited for their appointment and over a three month
period, 65 questionnaires were collected, 62 were useable. The sample was therefore,
n=62.
Table 13: Demographics of the Main Study for the Total Sample
N= 62
GENDER Male
23
Female
39
AGE Under 21
2
21 - 35
13
36 – 50
22
51 – 64
16
65 and over
9
3.6.1 Validity and Reliability of the SERVQUAL Instrument for the
Main Study
The pioneers of the SERVQUAL Instrument, (Parasuraman et al., 1985) were of the
opinion that to retain validity and reliability, the questionnaire should be utilised in as
close to its original format as possible. For this study minor wording to fit the context of
the practice and the amended questions to the questionnaire were the only changes that
the SERVQUAL questionnaire underwent. Butt and Cyril de Run (2010) stated that
SERVQUAL was generally a robust scale in which to measure service quality across a
variety of sectors. Previous healthcare studies have suggested that SERVQUAL is a
valid and reliable instrument for the healthcare sector (Sewell, 1997; Youseff et al.,
1996 and Curry and Sinclair, 2002). This study did not intend to measure the reliability
and validity of the instrument but to measure the service quality gap between two
variables using the formula (Perceptions (P) – Expectations (E) = Service Quality Gap
Score.
3.6.2 Data Analysis for the Main Study
Data was analysed using an Excel spreadsheet. The 25 expectation questions were
coded 1-25 as per the questionnaire as they were the first questions the customers were
asked to complete. The second set of questions, the 25 perception questions, were coded 75

26-50 and the demographics were coded 1 = yes or 0 = no. The mean was first
calculated for the overall practice for each of the six determinants between the two
variables, perceptions and expectations (Appendix 14). This method of calculation was
similar to other healthcare studies (Curry and Sinclair, 2002 and Youseff et al., 1996).
The mean (also known as average), is obtained by dividing the sum of observed values
by the number of observations, n. For this study, the sample was 62, n=62. Although
data points fall above, below, or on the mean, it can be considered a good estimate for
predicting subsequent data points. In addition, standard deviations were calculated for
each of the six determinants, (Appendices 8-13). Standard deviations are a measure of
variability of spread of the measurement of the mean. A correlation between those
customers who had previous experience with other physiotherapy services and those
who did not was calculated. This was to determine if previous experience of
physiotherapy services was significant or not. The results and analysis for phase one
and two are described in chapters four and five.
3.7 Phase Two of the Main Study
3.7.1 Research Design Phase Two
Phase two was the less dominant qualitative stage and was concerned with the second
research question: Can the perceived service quality of an independent private
physiotherapy practice be explored? No previous studies regarding physiotherapy
services have investigated the ‘why’ following the analysis of the SERVQUAL
questionnaires. A positive service quality gap score occurs when the perception scores
are higher than the expectation scores and a negative service quality gap occurs when
perception scores are lower than the expectation scores, this has been termed negative
perceived service quality for the purposes of this study. In addition to the findings in
phase one, phase two was concerned with exploring a deeper meaning to service quality
within the practice. The analysis from phase one showed areas within the practice
where the perception scores were lower than expectation scores, in other words a
negative service quality gap for the practice in some areas. Following the analyses of
phase one, it was decided that those customers who had a negative service quality gap
score in any of the six determinants were to be chosen as a convenience sample for a
potential face to face interview. Semi-structured interviews allow the researcher to vary
the sequence of the questions that are in general an interview guide (Bryman and Bell,
76
2007). According to Perry (1998) one of the most important and essential sources of
research information is the interview.
3.7.2 The Interview Sample
Respondents were asked in the questionnaire in phase one if they would be prepared to
take part in a face to face interview. Twenty people indicated that they would take part
in a face to face interview. Following the analysis in phase one, it was decided to
contact those customers with negative perception scores to determine the ‘why’ of the
negative perceived service quality. This narrowed the convenience sample to twelve
customers. All twelve customers were contacted and nine replied answering that they
would take part in a face to face interview. Table 14 below describes the demographic
and socio economic factors of the study for the face to face interviews.
77

Table 14: The Demographics of the Face to Face Interviews
N=9
GENDER Male
4
Female
5
AGE Under 21
0
21 – 35
0
36 – 50
2
51 – 64
5
65 and over
2
3.7.3 The Interview Design
Gullick and Shimadry (2008) suggested that we need to listen to patients’ comments to
appreciate the importance and experiences that patients attach to the healthcare sector.
Interviews are a popular method favoured by qualitative researchers due to the variety
of ways an interview may be conducted (Denzin and Lincoln, 1998). Semi structured
interviews allow the interview to vary, with sensitivity, the path the customer takes and
open ended questions maximise the potential for personal stories (Burgess, 1982).
Previous qualitative studies in the physiotherapy industry (Potter et al., 2003(a) and (b);
May, 2001; Goldstein, 2000) were in the main exploratory studies into patients’
behaviours, good or bad experiences with the practice or satisfaction with the treatment.
Following the analysis in phase one of this study, phase two was concerned with an
exploration of service quality in a private practice, in particular aspects of service
quality where the service quality gap was negative. The semi-structured interview was
therefore developed with the focus on any negative service quality gaps. The interview
was structured around the questions from the respondent’s questionnaire that
demonstrated negative perception scores but the pilot study demonstrated that opening
questions were important before introducing the subject of the completed questionnaire
that was necessary for the interview.
3.7.4 The Interview conducted in the Phase One Pilot Study
One interview was conducted during the phase one pilot study. The interview
highlighted that it was important to lead the respondent to the discussion around the
negative perception scores. It was therefore necessary to have an opening question and
this was in connection with the person’s previous experience with physiotherapy
services. The importance of taking account of customers’ past experiences contributed
overall to an investigation of service quality (Cadotte et al., 1987; Robledo, 2001). 78

Further it was noted that past experiences with a service provider and competitors
influenced the customers’ expectations.
As a result of the interview in the pilot study, it was structured in two steps: (1) an
opening question in relation to the customer’s previous experience of physiotherapy
services, and (2) a question on why the customer scored the practice on some questions
with lower perception scores than expectation scores? The structure of the questions
became as follows:
Question One: Have you any previous experience of physiotherapy services?
Question Two: Can you explain to me why you scored this question with a more
negative score than this question (the candidate was shown their original completed
questionnaire and they were referred to their questions where the perception score was
lower than their expectation score). Appendix 6 outlines the interview guide for the face
to face interview.
3.7.5 Data Analysis
There are many qualitative research approaches with different strategies (Miles and
Huberman, 1994; Coffey and Atkinson, 1996). The interviews were recorded verbatim
and were approximately 25 minutes long. The information from the nine interviews was
processed using the software package NVivo 10 to identify the themes. Yin (2003)
stated that when devising a theoretical framework, there is a need to identify the main
variables, components, themes and issues with the research objective and the predicted
or presumed relationship between them. The interactive nature of the data allows
important themes, patterns and relationships to be recognised as the data is collected
(Strauss and Corbin, 1998).
The themes were first distilled into the six determinants of the SERVQUAL
questionnaire (assurance, tangibles, reliability, responsiveness, empathy and
servicescape). Commencing the analysis from a theoretical perspective has a number of
advantages. It links the research to the existing body of knowledge and provides a good
starting point towards data analysis (Saunders et al., 2007). The themes that were
identified from the interviews are discussed in the results chapter. The analysis initially
adopted a deductive approach followed by an inductive approach to allow emerging
themes. The nine candidates were alphabetically coded and the interviews transcripts 79

were written up directly after each interview. The data was collected over a three month
period when time allowed for candidates to be contacted and appointments to be made.
3.8 Ethics of the Study This study followed the Edinburgh Napier Ethics and Governance Code of Practice and
respondents completed an ethical consent form shown in Appendix 7. For this study
there were concerns about the ethics between the customer and the therapist, in so much
that the relationship between therapist and patient can be linked to the treatment
outcomes (Gosselink, 2008). The directors of the practice were concerned that the
relationship could be compromised if the customers were asked about the services that
the therapists provided. Ethics refers to the appropriateness of behaviour in relation to
the rights to those who become the subjects of your work, or are affected by it. It was
also agreed that the study would only be concerned with the service quality of the
practice and not the service quality of the treatment. Confidentiality was specified to the
customers and to the therapists re-iterating that the study was only researching the
service quality of the practice and not the treatment elements. This was also re-
emphasised in the questionnaire and in the face to face semi-structured interviews.
Saunders (2007: 178) outlined some basic ethical principles:
Whether there is harm to the participants. For the practice, the research had to
be totally confidential so that the therapists could not identify the customer as
this could change the patient/therapist relationship.
Whether there is a lack of informed consent. For this study, it was stipulated in
the consent form that the customer was under no obligation to take part in the
study and could withdraw at any point (Appendix 7).
Whether there is an invasion of privacy. When the questionnaire was handed to
the customer in this study, it was made clear that no personal records had been
discussed in relation to them or the study.
80

Whether deception is involved. When the questionnaire was handed to the
customers in this study, the customers were assured that the study was for the
benefit of the practice in understanding their customer services and that the
information would not be used for any other purpose other than the academic
study.
In addition to retaining the sensitive relationship between the customer and the therapist
there was also the relationship between the customer and the practice. This is known as
reactivity – the reaction on the part of those being investigated to the investigator and
his or her research instruments (Bryman, 1988: 112). Difficult or awkward questions
could make the customer feel uncomfortable or even make them feel disloyal to the
practice, this had to be avoided. All customers were assured of the confidentiality of the
data which was stored and used in this research. Saunders (2007) stated that individuals
have a right to privacy and they should not feel pressurised or coerced in participating in
any study. Once promises of confidentiality and anonymity were given it was
imperative that they were maintained. Anonymity was mentioned on the questionnaires
and in addition in the consent form. No ethical issues arose from the customers in regard
to this study.
81

3.9 Reflections on the Methodology of Phase One and Phase Two
With research design, a number of choices and decisions are made which place
limitations on a study. It is inevitable for any study, that time restrictions, budget, the
nature of the organisation or the sample will have issues pertaining to the research
(Bryman and Bell, 2007). The reflections for the methodology for this study were
mainly as follows:
That the study was based on a single entity however some of the findings can be
generalised to the healthcare sector.
That the sample was n=62 and this was a relatively small sample compared to
other healthcare studies. Other healthcare studies were in the public sector with a
larger population from which to draw from. The length of time the data
collection took was a significant factor and all customers who completed a
questionnaire had to attend the practice at least ten minutes prior to their
appointment.
That the sample was a convenience sample. The customers were chosen at
random and at random times of the day. A specific category was chosen as the
perception part of the questionnaire was required to be completed from
customers who had attended the service and were not attending for the first time.
The study only examined negative perceived service quality in the semi
structured face to face interviews. Whilst this provided a valuable insight into
why customers rated their perceptions lower than their expectations, it perhaps
could have been counterbalanced with comments also on positive perceived
service quality.
That the Directors of the practice only wanted the questionnaire to cover service
quality of the practice and not of the treatment and so the treatment was not part
of the evaluation.
That the statistical validity and reliability of the SERVQUAL Instrument was
not tested. Many previous studies in the literature have tested the SERVQUAL
Instrument; it was thought therefore that testing the instrument was not
necessary to meet the aim and objectives of the study.
82

Despite the above limitations, this was a very beneficial study into service quality for
the independent private physiotherapy practice. The study has researched service quality
in a sector that has had very little previous research afforded to it. In addition the study
has contributed to theory by investigating service quality as a mixed method approach; a
first study of its kind in the private physiotherapy practice determined by the
SERVQUAL questionnaire and semi-structured interviews. The mixed method
approach allowed the researcher to look deeper into service quality at the practice by
exploring negative perceived quality through semi-structured interviews which followed
the analysis of the questionnaire.
83

Chapter Four – Phase One: The Results of the SERVQUAL Questionnaires
4 Introduction
This chapter reports the findings and analysis of phase one of the data collection. The
chapter first considers the overall service quality gap of the practice. This is described
as a total mean gap score for all the respondents. The next section outlines the mean
score for the expectation and perception questions and the mean gap score for the fifty
SERVQUAL questions. The chapter then describes the mean gap score for the six
determinants tangibles, reliability, responsiveness, assurance, empathy and
servicescape in descending order beginning with the factor that has the most positive
service quality gap. The next section in the chapter describes each question that has the
highest and lowest mean gap score for each of the six determinants. It then further
describes the mean gap score for each question. Finally, the results are discussed for the
practice and compared and contrasted to the literature. The chapter concludes with
reflections on the analysis of phase one.
4.1 Overview of the Responses for The Practice
The amended SERVQUAL questionnaire asked customers to rate service quality on a
Likert scale of 1 (strongly disagree) to 7 (strongly agree) in regard to expectations of
any physiotherapy services and their perceptions of the service quality of the practice.
The questionnaires were analysed using an Excel spreadsheet. The mean scores for the
expectations and perceptions questions for all six determinants for the practice are
shown in table 15 below. The raw data is shown in Appendices 8-13 and the overall
mean gap scores for the practice are shown in Appendix 8.
84

Table 15: Mean Scores for the Total Perceptions and Expectations scores for the
Sample (n=62) and the Mean Gap Score.
Determinant Mean Perception Scores
Mean Expectation Scores
Mean Gap Score
Servicescape 401 367 34
Tangibles 371 344 27
Responsiveness 404 384 24
Assurance 415 395 20
Empathy 407 392 15
Reliability 397 395 2
The table illustrates that customers perceived Servicescape to be the area that most
exceeded their expectations and Reliability as the area that just met their expectations.
This is further demonstrated in figure 6.
85

Figure 6: The Mean Scores of the Expectations and the Perceptions of the
Total Sample for The Practice for all six determinants.
Figure 6 shows that customers’ perceptions exceeded their expectations for the
practice. The gap is a positive gap, that is, the customers rated the practice with a
positive perception of service quality. Although the customers were positive overall
about the service quality of the practice, their perceptions just exceeded their
expectations for the reliability determinant with only a positive mean gap score of 2.
An overall positive perception of the practice is a desired outcome, this demonstrates
that customers’ expectations have been met. This analysis provides the directors with an
understanding of what their customers expect followed by what their customers
perceive the service quality to be. This signifies that it is important for the directors of
the practice to have measured both the expectations and the perceptions of service
quality so that the gap between the two variables can be measured and the service
quality gap can be identified as positive or negative. The directors of the practice can
understand what the customers expect in relation to their perceptions of the practice.
Measuring both expectations and perceptions is supported by these findings. This is
important management information when focussing on what service areas to improve
upon. In this instance, the directors may want to investigate areas where the gap
between the expectations and the perceptions was small, as it was for the reliability
factor.
86

4.2 Analysis of the SERVQUAL Questions (as amended)Many of the healthcare studies are compared by their mean gap scores for each
determinant. For management information, the mean gap score can be used as a
management tool to discover the gaps between each of the questions in each
determinant to uncover problem areas. Table 16 sets out the mean gap scores for each of
the twenty five paired questions for both perceptions and expectations. The initial
analysis showed that reliability had the smallest service quality gap score. Further
analysis revealed that three of the questions in the reliability determinant were negative.
This indicated that customers rated those questions with a more negative perception, in
other words, their expectations were not met for three of the reliability questions. Table
16 shows the mean gap scores for all 25 paired questions as a mean gap score, that is the
gap between customers’ perceptions and expectations.
87
Table 16: Overall Analysis of the 50 SERVQUAL Questions (as amended)
SERVQUAL QuestionnairePerception Expectation Gap
Mean Score Mean ScoreMean Score
TANGIBLES1. Excellent physiotherapy practices will havemodern looking equipment 5.94 5.85 0.092. The physical facilities at excellent physiotherapy practices will be visually appealing 5.95 5.29 0.663. Employees at excellent physiotherapy practiceswill be neat-appearing 6.37 5.76 0.614.Materials associated with the services shall bevisually appealing in excellent physiotherapy practices 5.71 5.2 0.51OVERALL MEAN 5.99 5.55 0.44RELIABILITY5. When excellent physiotherapy practices promiseto do something by a certain time, they do 6.35 6.39 -0.046. When a customer has a problem, excellent physiotherapy practices will show a sincere interest insolving it 6.58 6.6 -0.027. Excellent physiotherapy services perform the service right the first time 6.4 5.94 0.468. Excellent physiotherapy practices will providetheir services at the time they promise to do so 6.45 6.32 0.139. Excellent physiotherapy services will insist onaccurate records 6.21 6.61 -0.4OVERALL MEAN 6.4 6.37 0.03RESPONSIVENESS10. Employees in excellent physiotherapy practiceswill tell customers exactly when services are performed 6.52 6.37 0.1511. Employees in excellent physiotherapy practiceswill give prompt service to customers 6.45 6.29 0.1612. Employees in excellent physiotherapy practiceswill always be willing to help customers 6.63 6.52 0.1113. Employees in excellent physiotherapy practiceswill never be too busy to respond to customers 6.47 5.63 0.84OVERALL MEAN 6.52 6.2 0.32
88

ASSURANCE Perception Expectation Gap
14.The behaviour of employees in excellent Mean Score Mean Score
Mean Score
physiotherapy practices will instil confidence 6.68 6.45 0.2315. Customers of excellent physiotherapypractices will feel safe in their transactions 6.63 6.48 0.1516. Employees in excellent physiotherapyPractices will be consistently courteous 6.77 6.31 0.4617. Employees in excellent physiotherapypractices will have the knowledge to answer questions 6.68 6.26 0.42OVERALL MEAN 6.69 6.37 0.32
EMPATHY18. Excellent physiotherapy practices will givecustomers individual attention 6.68 6.37 0.3119.Excellent physiotherapy practices will haveoperating hours convenient for their customers 6.24 6.18 0.0620. Excellent physiotherapy practices will have employees who give customers personal attention 6.69 6.19 0.521. Excellent physiotherapy practices will have the customers' best interests at heart 6.52 6.45 0.07
22.The employees of excellent physiotherapy practiceswill understand the specific needs of their customers 6.71 6.4 0.31OVERALL MEAN 6.57 6.32 0.25SERVICESCAPE23. The external décor of an excellent physiotherapypractice will be neat and tidy 6.4 5.56 0.8424. The treatment rooms of an excellent physiotherapypractice will be clean and tidy 6.55 6.27 0.2825. The reception area of an excellent physiotherapypractice will be clean and tidy 6.45 5.92 0.53OVERALL MEAN 6.47 5.92 0.55
Table 16 reveals the mean gap scores between each paired question and the mean gap
score for each separate determinant. This is expressed below in table 17 in descending
order and as a bar chart in figure 7.
89

Table 17: The Mean Gap Scores for all Six Determinants in order of Descent
Table 17 illustrates the mean gap scores in descending order for each question in all six
determinants. The mean gap score was calculated by subtracting the mean perception
score from the mean expectation score. Servicescape has the most positive service
quality gap score of 0.55 compared to reliability which has the least positive service
quality gap score of 0.03. This analysis demonstrates that whilst the overall mean gap
score for the practice is positive, the determinants have varying degrees of positive
perceived service quality for the practice.
Determinant Overall Mean Gap Score
Perception Mean Gap Score
Expectation Mean Gap Score
Servicescape 0.55 6.47 5.92Tangibles 0.44 5.99 5.55Responsiveness 0.32 6.45 6.29Assurance 0.32 6.69 6.37Empathy 0.25 6.57 6.32Reliability 0.03 6.40 6.37
Figure 7: Mean Gap Scores between Perceptions and Expectations for the Total Sample of The Practice
Figure 7 represents the mean gap scores as a bar chart showing the varying service
quality mean gaps scores in order of descent for the practice. The graph clearly
identifies servicescape as having the most positive mean gap score and reliability as the
least. It is also interesting to note that both assurance and empathy have the fourth and
fifth smallest gap. Both the assurance and the empathy factors are cited in the literature
as being important in a healthcare setting. The graph also indicates that if the reliability
90

factor is not given some attention, the reliability factor may become negative and this
could affect the service quality of the practice.
91

4.3 Highest Mean Gap Score for Each DeterminantTable 18: The Question with the Highest Mean Gap Scores in relation to each
Determinant
The table outlines the question with the highest mean gap score for each determinant
Determinant Question Highest Mean Gap ScoreServicescape Q48 & Q23 The external
décor of the practice will be neat and tidy
0.84
Responsiveness Q38 & Q13 Employees in the practice will never be too busy to respond to customers’ requests
0.84
Tangibles Q27 & Q2The facilities at the practice will be visually appealing
0.66
Empathy Q45 & Q20 The practice will have employees who give customers personal attention
0.50
Assurance Q41 & Q16 Employees in the practice will be consistently courteous with customers
0.46
Reliability Q32 & Q7 The practice will perform the service right first time
0.46
Table 18 displays the paired item questions with the highest mean gap score. The
highest mean gap score was for the gap between questions 48 and 23 in the servicescape
determinant. The customers of the practice rated the external décor of the practice with
the highest perception for service quality. The external window display of the practice
is included in this question; the window display is always topical, i.e. if it is Christmas
then there is a Santa and toys in the window.
The gap between questions 38 and 13 was the second highest gap and refers to the
statement that the practice is never too busy to respond to the customers. It is a busy
practice and when you enter the practice, the customer encounters the reception desk
first, and is then warmly greeted by the receptionsists. This could account for the high
positive gap score.
The gap beteen the tangibles questions, 27 and 2 was 0.66 and refers to the facilities
within the practice. The practice is fairly small but there is a large gym area, this is
92

perhaps what the customers perceive as being a positive service offering. Questions 45
and 20 refer to the empathy factor and how customers receive personal attention from
the employees of the practice. Many of the customers are repeat customers and the
receptionists know them by their first name. This may give the perception of personal
attention.
Questions 41 and 16 are in regard to the practice personnel being consistently
courteous. The practice is run by two directors who are at the practice every day, this
could encourage the courteous service. The customers perceive that the practice will
perform the service right the first time, whether that is phoning for an appointment or
ordering the customer a taxi, their percpeption is that it is right first time. This
information is very valuable to the directors of the practice. These are the areas with the
most positive perception and the directors should share this information with their
employees so that they may continue with this positve element of service quality.
Table 19: The Questions with the Lowest Mean Gap Scores in relation to each
Determinant.
The table outlines the question with the lowest mean gap score for each determinant
Determinant Question Lowest Mean Gap ScoreReliability Q34 – Q9 The Practice will
insist on acccurate records.-0.40
Empathy Q44 &Q19 The practice will have operating hours convenient to all their customers
0.06
Tangibles Q26 & Q1 The practice will have modern equipment
0.09
Responsiveness Q37 & Q12 Employees in the practice will always be willing to help customers
0.11
Assurance Q40 & Q15 Customers of the practice will feel safe in their transactions
0.15
Servicescape Q49 & Q24 The treatment rooms of the practice will be clean and tidy
0.28
93
Table 19 displays the paired item questions with the lowest mean gap score. The
service quality gap with the lowest perception score was between questions 34 and 9 in
the reliability determinant, the practice will insist on accurate records. The negative
service quality gap may indicate that the administration in the practice is not as accurate
as it should be and that it is affecting the customer perception of the service quality.
This is an area that management require to give immediate attention to.
The second lowest gap was in the empathy determinant for questions 44 and 19 and was
concerned with the operating hours of the practice. When the research was conducted
the practice was open Monday – Wednesday 9.00am – 5pm, Thursday 9.00am – 7pm,
Friday 9.00am – 5pm and Saturday 9am-12 noon. The fact that this is the second lowest
question indicates that there is a problem with the opening hours of the practice in so
much as they do not suit the customers’ needs and is affecting the perception of the
service quality.
The tangibles service quality gap was between questions 26 and 1 (0.09), the third
lowest perception overall. The question was concerned with the practice having modern
looking equipment. Whilst the gym looks neat and tidy with up to date equipment the
treatment rooms look stark, perhaps the customers are relating the lack of modern
looking equipment to the treatment rooms.
The gap between questions 40 and 15 in the assurance determinant was in relation to the
customers feeling safe in their transactions. It is difficult to know why the customers
rated this question with a low perception, it would have been useful to have had more
information on the reasons why. The gap between questions 37 and 12 for
responsiveness was in relation to the practice staff being always willing to help. This
question was the lowest in the responsiveness category. It is also difficult to know why
the customers rated this question with a low perception when compared to their
expectations in this area.
Questions 49 and 24 were in relation to the treatment rooms being clean and tidy. There
is a daily cleaner at the practice but the treatment rooms are bland, in need of paint and
without any natural light. It is likely that this is where the low perceived service quality
arises. This is another area that management have direct control over and could change. 94

4.3.1 ReliabilityFurther analysis of the determinants revealed that there were three negative gap scores
in the reliability determinant. This indicated that the customers rated some of the
perception questions of the reliability determinant for the practice lower than their
expectations. Table 20 below outlines the mean gap scores for each question pertaining
to reliability.
Table 20: Mean Gap Scores for the Reliability Determinant
The table represents the first question as the perception question (P) followed by the
paired expectation question (E); P-E = gap score and this is displayed as a mean gap
score. The raw data is shown in Appendix 8.
RELIABILITY
Question Mean Gap Score Perceptions Mean Gap Score
Expectations Mean Gap Score
Q34 - Q9 The practice will insist on accurate records
-0.40 6.21 6.61
Q30 - Q5 When the practice promises to do something by a certain time, they will do so
-0.04 6.35 6.39
Q31 - Q6 When a customer has a problem the practice will show a sincere interest in solving it
-0.02 6.58 6.6
Q32 - Q7 The practice will perform the service right first time
0.46 6.40 5.94
Q33 - Q8 The practice will provide their services right first time
0.13 6.45 6.32
Overall Mean 0.03 6.40 6.37
The question with the most positive mean gap score was Question 32 and Question 7
“The practice will perform the service right the first time”. This could be related to any
service that the practice offers. The positive score may have indicated that the
customers’ perception of this element of the practice was higher than their expectations.
The other positive score was questions 33 and 8, “The practice will provide their
services right the first time” is perhaps linked to the overall services that the practice
95

provides.
The most negative perceived service quality gap is between questions 34 and 9 “The
practice will insist on accurate records”. The practice deals with third party insurance
providers such as BUPA and The Spire and this entails a heavy administrative load.
Many of the customers are referred by their GPs, others refer themselves. There is
therefore a greater risk of inaccuracy with such a volume of paperwork. It may be that a
sample of customers experienced inaccurate records.
The second most negative perceived service quality gap was between questions 30 and
5 “When the practice promises to do something by a certain time, they will do so”.
There is an intangible angle to this question and therefore it is difficult to understand
without asking the customers why they scored this question lower than their
expectations.
The third most negative perceived service quality gap is between questions 31 and 6
“When a customer has a problem, the practice will show a sincere interest in solving it”.
Showing sincerity is individualised, that is, the level of sincerity for each customer will
be different. Again this aspect of reliability is less tangible and it is more difficult to
understand why the customers rated it lower than their expectations. It could be drawn
from this analysis that customers value sincerity and this could be a training issue for
the receptionists.
Three questions had a negative perception of service quality when compared to their
expectations, (questions 30 & 5, questions 31 & 6 and questions 34 & 9). Youseff et al.
(1996) found that reliability had the highest expectation and the lowest perception mean
gap score. Resnick and Griffiths (2011); Butt and Cyril de Run (2010); Chakravarty
(2010); Lee and Yom (2006) found their patients had a high expectation and lower
perception for reliability. The findings in this study for reliability are therefore similar
to other healthcare studies that found a negative perception with the reliability
determinant. This was in contrast to Curry and Sinclair (2002) who in their study, found
reliability to be one of the highest mean gap scores for the community physiotherapy
rehabilitation team.
96

This information demonstrates to the directors of the practice that one of their most
negative areas in the reliability factor is the administration of their records. The
administration area is an area that they have direct control of, that is, they could
strengthen the processes to ensure that the administration was more accurate, which will
in turn raise the perception of a particular part of the reliability determinant and improve
their service quality.
97

4.3.2 EmpathyTable 21: Mean Gap Scores for the Empathy Determinant
The table represents the first question as the perception question (P) followed by the
paired expectation question (E); P-E = gap score and this is displayed as a mean gap
score. The raw data is shown in Appendix 9.
Empathy
Question Mean Gap Score
Perception Mean Gap Score
ExpectationMean Gap Score
Q45 - Q20 The practice will have employees who give customers personal attention
0.50 6.69 6.19
Q43 - Q18 The practice will give customers individual attention
0.31 6.68 6.37
Q47 - Q22 The employees of the practice will understand the specific needs of their customers
0.31 6.71 6.40
Q46 - Q21 The practice will have the customers’ best interests at heart
0.07 6.52 6.45
Q44 -Q19 The practice will have operating hours convenient to all their customers
0.06 6.24 6.18
Mean 0.25 6.57 6.32
For the practice empathy had the second lowest mean gap score of all six determinants.
The most positive mean gap scores were between questions 45 and 20 “The practice
will have employees who give customers personal attention”, however one of the lowest
gap scores is between questions 46 and 21 “ The practice will have the customers best
interests at heart”. It is interesting to note that one is less positive than the other so the
perception may be that the practice staff give personal attention to the customers but do
not necessarily have their best interests at heart.
Questions 44 and 19 also had a small gap (0.06) “the practice will have operating hours
convenient to their customers”. The sample of customers had high expectations of the
operating hours and their perception just met their expectation by 0.25. This is valuable
management information as the practice opening hours are in the direct control of the
directors. The operating hours could potentially be changed and possibly lead to an
improved customer perception of the service quality of the practice.
98

The mean gap score for empathy ranged from 0.06 to 0.50 with an overall gap of 0.25,
the second lowest mean gap score. Previous research had shown that empathy was
important to customers of healthcare services. Empathy is an area that the practice
directors should focus on. The information in relation to the individual questions could
act as a training session for the staff in demonstrating how the customers have scored
the practice in relation to their expectations. Empathy is an area that does require
attention from the directors.
Overall the mean gap score for empathy had a positive mean gap score of 0.25; it had
the second least positive gap score between perceptions and expectations. Empathy in
the healthcare sector is a determinant that patients value. Youseff et al. (1996), found
empathy to be the second highest expectation and the second lowest perception of
service quality of hospitals in the West Midlands. Curry and Sinclair (2002) found
empathy to have the largest gap between expectations and perceptions. Resnick and
Griffiths (2011); Butt and Cyril de Run (2010); Chakravarty (2010); Lee and Yom
(2006) found empathy to have a negative perception for all questions in their studies.
Although the empathy determinant was not negative in the current study, it was the
second least positive determinant.
It is difficult to know where the practice are failing in relation to empathy; it would be
beneficial for the practice management to specifically ask the customers why the
customers perceived the empathy factor so negatively in relation to their expectations.
4.4.4 Tangibles
Table 22: Mean Gap Scores for the Tangibles Determinant
The table represents the first question as the perception question (P) followed by the
paired expectation question (E); P-E = gap score and this is displayed as a mean gap
score. The raw data is shown in Appendix 10.
99

TangiblesQuestion Mean
Gap Score
Perception Mean Gap Score
Expectation Mean Gap Score
Q27 - Q2 The facilities at the practice will be visually appealing
0.66 5.95 5.29
Q28 - Q3 Employees at the practice will be neat-appearing
0.61 6.37 5.76
Q29 - Q4 Materials associated with the practice will be visually appealing
0.51 5.71 5.20
Q26 - Q1 The practice will have modern equipment
0.09 5.94 5.85
Overall Mean 0.44 5.99 5.55
For this study the tangibles determinant was the second most positive perceived
determinant; it had an overall mean gap score of 0.44. Tangibles included the gym
within the practice, the equipment that is stored within the reception area, the
pamphlets, and the appearance of the staff. The most positive gap is between questions
27 and 2 “The facilities at the practice will be visually appealing”. This is most likely
related to the gym in the practice. The practice is fairly small to medium in size and
when you walk into the practice you would not be expecting to see a gym. The gym is
the same size as the reception and it is very neat and tidy.
The second most positive mean gap score was between questions 28 and 3, “Employees
at the practice will be neat-appearing”. The therapists all wear a uniform that is branded
with the company colours. The receptionists can wear their own clothes but must look
smart. The customers therefore perceive the staff to be of good appearance.
The third most positive question was between questions 29 and 4, “Materials associated
with the practice will be visually appealing”. There are a series of pamphlets that sit on
a desk in the waiting area. They describe some of the conditions that the therapists work
with, for example back pain or pains associated with sports injuries. There are also
relevant books and a daily paper on the same table. The materials are all very relevant
and up to date but it would have been interesting to know what the customers actually
think of the information on the pamphlets. These are the kind of facts that the directors
may find useful if ever re-designing the leaflets. This information could be gleaned from
a face to face interview.
100

The least positive mean gap score is between questions 26 and 1 “The practice will have
modern equipment”. The reception area can seem a bit cluttered and this was echoed by
some of the customers in the face to face interviews. There are skeleton drawings on the
walls, dried flowers, rugby shirts in frames on the walls and other physiotherapy
equipment literally lying on shelves. It may be that the reception area looks a bit dated
with the mix of memorabilia. Again it would be useful to ask the customers why they
rated this question with the lowest perception score for tangibles.
Curry and Sinclair (2002) found that tangibles had the lowest expectations and the
lowest perceptions, this was in part, they thought, because the services were offsite and
therefore tangibles such as equipment and materials did not feature heavily with the
service offering. Chakravarty (2010) found in the study of an outpatient department that
there was a negative perception of tangibles. No reasons were given other than the
scores were lower than the expectations scores. Resnick and Griffiths, (2011) found in
their study of alcohol services that tangibles had the lowest expectations. This
demonstrates that what patients or customers expect and perceive for each study is
different and specific to the context of the healthcare services. It is interesting to note
that the expectations and perceptions for tangibles are lower for studies in the public
sector. This could be due to lower customer expectations for equipment and materials in
the public sector when funding and budgets are perceived to be lower than the private
sector. This was found in studies by (Camilleri and O’Callaghan, 1998) in Maltese
hospitals where expectations were higher in the private sector for all variables and in
the study including the tangibles. Irfan and Ijaz (2011) found that the perceptions of
tangibles in the private hospital in Lahore, Pakistan were almost double the perceptions
for the public hospital. The current study had high expectations and perceptions for
tangibles. This is a positive outcome for the practice but one that must be maintained
for the practice to remain competitive.
4.4.5 Responsiveness
Table 23: Mean Gap Scores for the Responsiveness Determinant
The table represents the first question as the perception question (P) followed by the
paired expectation question (E); P-E = gap score and this is displayed as a mean gap
score. The raw data is shown in Appendix 11.
101
Responsiveness
Questions Mean Gap Score
Perception Mean Gap Score
Expectation Mean Gap Score
Q38 - Q13 The practice will never be too busy to respond to customers’ requests
0.84 6.47 5.63
Q36 - Q11 The practice will give prompt service to customers
0.16 6.45 6.29
Q35 - Q10 The practice will tell customers when services will be performed
0.15 6.52 6.37
Q37 - Q12 The practice will always be willing to help customers
0.11 6.63 6.52
Mean 0.32 6.52 6.20
Responsiveness is concerned with responding to the customers’ needs and requests. The
most positive mean gap score is between questions 38 and 13 “The practice will never
be too busy to respond to customers’ requests”. This is a very encouraging outcome for
the practice as it is extremely busy. This customer perception should be celebrated and
shared with all the practice staff, particularly the receptionists.
The other three questions were by comparison, not as positive as questions 38 and 13.
Questions 36 and 11 also related to responding to the customer “The practice will give
prompt service to customers”, the customers perceived that the staff were never too
busy to respond but they did not perceive that the service was as prompt as they
expected. There was only a difference of 0.16 between what the customers expected and
what they perceived. This is not a large gap in relation to the other determinants
however it is an area that may need further investigation and could be information that
could be of benefit in staff training.
The least positive gap for responsiveness was involved with helping customers:
questions 37 and 12 “The practice will always be willing to help customers”. The mean
gap score remained positive (0.11), however it is the lowest positive mean gap score for
responsiveness. Management need to ask why customers rated this question with the
lowest perception scores. The customers may have thought that whilst the staff are
never too busy to respond and give them prompt service the customers perceived that
they didn’t always get the help they desired. It would be advantageous for the directors
102

to have additional facts from the customers that would aid the service quality in
responsiveness.
Finally questions 35 and 10 “The practice will tell customers when services will be
performed” had a means gap score of 0.15, this was the second least positive gap
between expectations and perceptions. It is difficult to fully understand what each
customer perceived this question to be concerned with. It does relate to all services
offered from the practice and this may have been interpreted as treatment appointments.
This is useful information for the directors, the receptionists could be more specific with
the customers’ requests when making an appointment and this could help improve the
mean gap score between questions 35 and 10.
Resnick and Griffiths (2011) rated responsiveness as the second highest expectation for
patients and the third lowest for perception. Chakravarty (2010) found negative
perceptions in all five of the measured determinants with responsiveness as the most
negative. For this study, from six determinants, responsiveness is the third most
positive.
4.4.6 Assurance
Table 24: Mean Gap Scores for the Assurance Determinant
The table represents the first question as the perception question (P) followed by the
paired expectation question (E); P-E = gap score and this is displayed as a mean gap
score. The raw data is shown in Appendix 12.
Assurance
Questions Mean Gap Score
Perception Mean Gap Score
Expectation Mean Gap Score
Q41 - Q16 Employees in the practice will be consistently courteous with customers
0.46 6.77 6.31
Q42 - Q17 Employees in the practice will have the knowledge to answer customers’ questions
0.42 6.68 6.26
Q39 - Q14 The behaviour of employees in the practice will instil confidence in customers
0.23 6.68 6.45
Q40 - Q15 Customers of the practice will feel safe in their transactions
0.15 6.63 6.48
Mean 0.32 6.69 6.37
103

Assurance is another factor that is important in the healthcare sector and is the third
lowest determinant for the practice. The gap between perceptions and expectations for
assurance is relatively small, that is the customers’ perception for assurance just met
their expectation.
The most positive gap was between questions 41 and 16, “Employees in the practice
will be consistently courteous with customers”. The sample of customers felt that the
staff were courteous with them, however the lowest gap is 0.15 between questions 40
and 15 “ Customer of the practice will feel safe in their transactions”. Safe in their
transactions may be interpreted differently for individuals, the meaning behind the
statement is that they should trust and feel assured by the staff at the practice. This may
have demonstrated that the sample of customers perceived the staff to be polite but did
not necessarily trust them or feel assured. Overall it is a positive gap score for assurance
but as it is a small gap, this is an area that the directors should monitor.
The second most positive gap score was between questions 42 and 17 “Employees in
the practice will have the knowledge to answer customers’ questions”. The sample of
customers felt assured that the staff of the practice knew the answers to their questions.
Their perceptions exceeded their expectations by 0.42.
Finally the third lowest mean gap score was between questions 39 and 14, “The
behaviour of employees in the practice will instil confidence in customers”, this
question had a mean gap score of 0.23. The customers perceived that the knowledge of
the staff was more positive than the confidence the practice staff instilled. Information
gleaned from the assurance analysis is another area that could be incorporated into staff
training to improve the service quality at the practice.
The assurance determinant encompasses feelings of being safe and being treated well.
Youseff et al. (1996) found assurance to be the fourth highest expectation and the fourth
lowest perception. Resnick and Griffiths (2011) found that four of the determinants had
negative perceptions and assurance was the second most negative. Chakravarty (2010)
also found assurance to have the third most negative perception whilst Curry and
Sinclair (2002) found assurance to be amongst the highest perception scores. This does
indicate there is a quite a difference in expectation and perception scores for every 104

research area for assurance.
4.4.7 Servicescape
This was the amended determinant; it was concerned with the interior and exterior of
the organisation, it is what Lovelock and Wirtz (2007) and Sureshchandar (2002)
termed servicescape. Sureshchandar (2002) felt it was one of the constructs missing
from the SERVQUAL Instrument.
Table 25: Mean Gap Scores for the Servicescape Determinant
The table represents the first question as the perception question (P) followed by the
paired expectation question (E); P-E = gap score and this is displayed as a mean gap
score. The raw data is shown in Appendix 13.
Servicescape
Question Mean Gap Score
Perception Mean Gap Score
Expectation Mean Gap Score
Q48 - Q23 The external décor of the practice will be neat and tidy
0.84 6.40 5.56
Q50 - Q25 The reception area of the practice will be clean and tidy
0.53 6.45 5.92
Q49 - Q24 The treatment rooms of the practice will be clean and tidy
0.28 6.55 6.27
Overall Mean 0.55 6.47 5.92
The most positive mean gap score is between questions 48 and 23, “The external décor
of the practice will be neat appearing”. The window display is one of the most talked
about aspects of the practice. It has won awards and has been in the local newspapers
for its displays. The window display changes regularly and has themes, such as
Christmas, Skiing, Halloween (Appendix 14 displays pictures of the practice). It is
unusual to see such grand displays in a physiotherapy window; the customers often
comment about the window and it has featured in local newspapers. This positive gap
score is excellent news for the directors of the practice.
The second largest gap was between questions 50 and 25, “The reception area of the
practice will be clean and tidy”. As discussed previously, the reception area can be a bit
105

untidy. The reception area displays many physiotherapy artefacts and equipment that is
visible to the customer. Cleaners are employed daily, it could therefore be presumed
that the perception was intended for the untidiness rather than the cleanliness of the
reception area. This is interesting information for the directors and is an area that could
be easily transformed. Comments on the reception are further highlighted in phase two.
Finally, questions 49 and 24, “The treatment rooms of the practice will be clean and
tidy”. The treatment rooms are small with no natural light. They contain a treatment
table and a small equipment stand, they require painting. This is an area that the
directors have direct control over. They could paint the treatment rooms and brighten
them up. The lighting is also bad in the treatment rooms and this is something that the
directors could also change. The means gap score (0.28) is positive but it only just
meets the expectations of the customers and if this is not addressed then the perception
may soon be less positive and possibly lower than the customer expectations. The décor
of the treatment rooms is an important area. All customers attend the treatment rooms
and if their perception is poor for this area then it may ultimately affect the service
quality as a whole and this could be detrimental to the business.
There were only three questions in this determinant and they were at the request of the
directors of the practice. It is the determinant with the most positive gap score and the
mean gap scores range between 0.84 and 0.28, the widest range of mean gap scores
among the determinants. There are no other studies to make a direct comparison for
servicescape as this was an amendment specific to this study. Goldstein et al. (2000) in
their qualitative study with the physiotherapy sector asked about Access (physical
location, operating hours, appointment times and waiting times) and Petrovici and
Philips (2009) in their study into Romanian hospitals asked about the Ambience of the
reception area.
4.5 Conclusion of Phase One
Key findings from the phase one analysis suggested that there were many aspects and
improvements of service quality that could contribute to management information and
training within the practice. Improvements in the service quality areas may change the
perception of the practice and help the organisation compete in a very competitive
market. The analysis highlighted that every study depends on the context of the industry
and that culture has a large part to play in expectations and perceptions of a service.
106

This is particularly relevant in the healthcare sector where there are expectations of both
the public and the private sector. The literature review revealed that in a global setting
the lack of Government funding affected the service quality of the public sector but it
was country specific for the private sector depending on how that healthcare system was
viewed. What is revealing for researchers is that whilst SERVQUAL provided a sound
analysis of service quality it did not offer the overview required to fully understand the
root of the customers’ expectations or perceptions nor the ‘why’ from the customers
and this was addressed in phase two of this study.
The analysis of the total scores for the practice demonstrated that all six determinants
had higher perception scores than expectation scores. This is an unusual finding
compared to other healthcare studies (Irfan and Ijaz, 2011; Karassavidou, 2009; Butt
and Cyril De Run, 2010; Chakravarty, 2010; Lee and Yom, 2006; McGorry, 1999;
Camilleri and O’Callaghan, 1998; Youseff et al., 1996). Most of those studies were
conducted in the public sector and the perception scores were almost lower or equal to
the expectations scores. Butt and Cyril De Run (2010) conducted their study in private
Malaysian hospitals and negative perceptions were found in all five areas (tangible,
reliability, responsiveness, assurance and empathy). Irfan and Ijaz (2011) conducted
their study in a private and public hospital in Pakistan and found lower perceptions for
all five determinants for the public hospital. Youseff (1996) and Karassavidou (2009)
found in their study of public hospitals in the UK and Greece respectively that the
perceived service quality was also negative in all five determinants. In contrast, a study
in the UK NHS and in the physiotherapy sector (Curry and Sinclair, 2002) found mixed
expectations and perceptions gap scores for three physiotherapy services, in other
words some had a low expectation score and a low perception score but not a negative
service quality gap. It could be that customers/patients have different expectations and
perceptions of hospital services compared to physiotherapy services and this could be a
key finding for the physiotherapy sector. More specific research is therefore required in
regard to what customers expect and perceive of specific physiotherapy services rather
than comparisons with other healthcare studies.
In the current study customers had both high expectations and high perceptions for all
six areas. The customers’ perceptions of the service quality of the practice exceeded
their expectations. This was a very positive result for service quality at the practice and
107

one that the directors should publicise both to their staff and to their customers. Below
summarises the findings of phase one:
The perception of the service quality of the practice was positive overall.
That the customers’ perceptions of the practice exceeded their expectations.
There were varying amounts of perceived service quality in relation to all six
deteminants, with reliability showing some negative perceived service quality
in three of the questions.
Reliability had the least positive perception of service quality with a gap
between expectations and perceptions of 0.03. The reliability factor is an area
that requires management attention as it had the lowest service quality gap.
There were two service quality gaps that had equal (0.84) highest mean gap
scores. Questions 38 and 13 in the responsiveness determinant which were in
relation to the practice being never too busy to respond and between questions
48 and 23 for the servicescape determinant in relation to the décor (external and
internal) of the practice. These are key findings for the practice and are areas
that management need to maintain in order to keep the high standard. These
findings need to be shared with the practice staff.
The lowest service quality gap (-0.40) was in the reliability determinant between
questions 34 and 9 and was was concerned with the practice providing accurate
records to the customers. This is an area where management need to take action
to improve the service quality.
The empathy determinant was the second least positive service quality gap in
relation to the operating hours of the practice. This is another area where
management have direct control and can change the opening hours to more suit
the needs of the customers and improve the perception of the service quality.
Having a positive perception score for all six determinants is an unusual finding
when compared to other healthcare studies for both the private and the public
sector.
Very useful management information arose from phase one of the analysis; it did pose
the question ‘why’. Why did the sample of customers rate some of the determinants
higher than others and in particular why did customers rate the perceptions lower than
the expectations in three of the reliability questions? These questions were explored in 108

phase two in the next chapter.
109

Chapter Five- Phase Two: The Results of the Face to Face Interviews
5 Introduction
This chapter reports the findings of phase two of the second stage of the analysis. Stage
two was concerned with exploring customer insights into service quality of an
independent private physiotherapy practice. Following the analysis in phase one, it was
decided to investigate further the elements of negative perception in the customer
questionnaire, that is, where the service quality gap was negative. Phase one had
identified which customers had negative service quality gap scores of the practice and
the areas therein (Appendix 15). There were nine face to face interviews conducted in
phase two. The customers were alphabetically coded in phase one that remained
throughout phase two. There were two questions in the semi-structured face to face
interview. The first question was an opening question in regard to the customers past
experiences of physiotherapy services. The second question was in relation to the
negative perceived service quality that was analysed in phase one from their
questionnaire. The information from the face to face interviews was analysed using the
six determinants as the framework. In addition, there were two themes that emerged
from the first question in relation to past experiences with the NHS and then
comparisons of those experiences with the practice. The second theme that arose from
the interviews were comments in relation to the treatment provided at the practice. Each
section compares the findings of the analysis in phase two with the literature.
The chapter first considers the second question of the interview in relation to the
negative perceived quality that was expressed in specific parts of the six determinants.
Secondly, the chapter considers question one of the interview regarding general
comments relating to previous experiences of physiotherapy services. The chapter then
discusses the comments in relation to the treatment and finally, the chapter concludes
with reflections on phase two.
110

5.1 Negative Perceived Service Quality
5.1.1 Reliability
Reliability is concerned with ability to perform the service dependably and reliably. For
the practice the reliability determinant had the lowest mean service quality gap score of
0.03, signifying that there was only a 0.03 gap between the expectation scores and the
perception scores. In other words, the customers’ perceptions of the reliability
determinant for the practice were just met. A deeper analysis in phase one did reveal
three questions to have a negative score for reliability. Customer perception of the
reliability determinant could have implications for the service quality for the practice,
they may lose customers if the perception gap for reliability becomes negative overall.
The interviews sought to investigate why customers rated their perceptions of the
reliability determinant less positively than their expectations. Respondent KK gave
reliability a negative perception score of -1.0 in relation to the service quality gap
between questions 31 and 6. Respondent KK’s comments were in regard to the accurate
records of the practice. This was the question with the lowest perception score in phase
one. Respondent KK said:
“One thing I noticed was that they have a blank piece of paper that they write on
(referring to what the therapists write on). My other physio that I go to has the
same but it isn’t blank, it has lines on it and it looks more professional.”
This is interesting as it was assumed in phase one that the inaccurate records were in
relation to the administration of the billing of the practice however this respondent said
her negative perception was in regard to the lack of professionalism with the note
taking. This gave her the perception that the accuracy of the records was not as
professional as it could have been. This answer has provided the management with
deeper reasons as to why this aspect of the practice had the lowest service quality gap
and was a key finding for phase two. Respondent KK also compared the service that she
received from the practice with the service she received from her other physiotherapy
provider, this is also an interesting finding. It is known in the literature that customers
do compare services with other services and that expectations are formed through
111

experiences (Cadotte et al., 1983; Grönroos, 1984, Camilleri and O’Callaghan, 1998;
Robledo, 2001), however little has been written about how perceptions are formed. This
finding demonstrates that perceptions are also formed through experiences when
comparing like for like services.
Another respondent, respondent D gave a negative service quality gap score for the gap
between questions 30 and 5, in relation to the practice promising to do something by a
certain time. This question had the second lowest service quality gap in phase one.
Respondent D explained that her negative perception was with the lack of quick
appointments with the therapists and said:
“My only time issue with the practice is failure to get an appointment quickly
and that’s not because they promised, they are actually saying no, we can’t do
it.”
Respondent D’s perception is negative because she could not receive an appointment
when she wanted it. This area did have a negative perception score in phase one (-0.04)
and the comments confirm that this is a problem area for the practice.
Reliability is a determinant that patients have cited in other healthcare studies as being
very important to them (Resnick and Griffiths, 2011; Alrubaiee, 2011; Ahmed and
Samreen, 2011). Curry and Sinclair (2002) cited reliability as of critical importance in a
healthcare setting. Reliability is concerned with expectations around service providers
carrying out their promises, showing a sincere interest in the customer and in any
problem they have, performing the service right the first time and having error free
records.
The overall perception of the reliability factor in phase one highlighted that reliability
had a positive service quality score of 0.03. However, on deeper analysis in phase one,
three of the five reliability questions had a negative service quality gap score and the
comments in the interviews have confirmed some of the reasons why. Reliability is an
area that requires attention from management before all five areas for reliability become
negative. A negative perception of the reliability factors could impact on the business if
customers perceive it to be unreliable and unprofessional.
112

5.1.2 Empathy
Empathy is concerned with caring and individualised attention, empathy ensures that the
service provider will have the customers’ best interests at heart and provide operating
hours that suit the individual’s needs, they will also understand the specific needs of the
customer.
For the practice, empathy had the second lowest service quality gap score with a gap
score of 0.25 between the customers’ expectations and their perceptions. Considering
that empathy is such an important determinant in a healthcare setting, it is interesting to
note that for the practice it was the second lowest determinant.
The interview sought to ask the reasons why this was the case. Of the nine people
interviewed, only one person had a negative comment in regard to empathy. Respondent
PP scored the perception of the operating hours of the practice two points lower than
their expectations. The interview revealed that it wasn’t precisely the operating hours
that the candidate was scoring the practice lower on but the fact that the therapist that he
attends only works part time and was not always available, he said the following:
“The physiotherapist that I see only works two days a week at the practice and
that is not perfect.”
Respondent PP had a negative perception of the service quality in relation to empathy
because of the lack of availability of the therapists. Some of the therapists work part
time elsewhere and are not available to work at the practice for all the operating hours.
This may also be a problem for other customers who were not interviewed but did score
this question lower in phase one. The question specifically related to the operating hours
and had the second lowest mean gap score (0.06), the service quality gap for this
question just meets the customers’ expectations. This is a key finding for the practice as
the operating hours are clearly an issue for the customers and one where the
management require to take action.
Similarly to reliability, empathy has been shown in previous healthcare studies to be
important to patients. Curry and Sinclair (2002) found that empathy had one of the most
positive gap scores in their study. Ahmed and Samreen (2011) found in their study of
Karachi hospitals that the empathy factor was statistically significant in patient 113

satisfaction. Conversely, Youseff et al. (1996); Resnick and Griffiths (2011) found that
empathy had a negative service quality gap score in their studies. Resnick and Griffiths
who undertook their study into alcohol services found that if they improved empathy
between staff and patients it would benefit the overall perception of the service quality
of their services. The service quality of the practice in this study would also improve if
the operating hours were changed to meet the needs of the customers.
5.1.3 Responsiveness
Responsiveness is concerned with willingness to help customers and provide prompt
service. For this study responsiveness had an equal service quality gap score alongside
assurance (0.32). Of the nine interviews, there were two relevant comments from
respondents QQ and C who had negative perceptions of the responsiveness factor.
Responsiveness is concerned with telling customers exactly when services are likely to
be performed, giving prompt service to customers, always being willing to help
customers and never too busy to respond to customers’ requests. Respondent QQ
marked the practice lower on their prompt service and commented:
“It depends on who is on at the reception. It is the same with the therapists, if
you get two different ones you get two different types of service and that is not
always good.”
This is what the services literature refers to as inseparability (Kotler et al., 2008), when
the services are different depending on who performs them. Respondent QQ was not
only comparing the service of the receptionists but also the service they received from
the therapists. This is a training area for the practice, where consistency of service
wherever possible contributes to the overall service offering. Respondent C also made a
similar link about the service provided by the therapist when commenting on question
12, the practice is always willing to help you. Respondent C gave question 12 a
negative perception score of -1.0 and commented:
“They didn’t ask you anything other than how are you this week and that was it.
I would have liked them (referring to the therapist) to ask “what does your work
consist of this week?” as I was trying to explain to her what had happened
originally when I had my accident at work.”
114

The comments from respondent QQ and C are interesting findings in relation to
comments on the responsiveness of the service quality of the practice and the service
quality of the therapists. The findings would suggest that comparisons are constantly
being made by the customers. These comparisons are a result of experiences with the
personnel within the practice.
Responsiveness is recorded in some other healthcare studies as having a negative
service quality gap (Chakravarty, 2010; Resnick and Griffiths, 2011; Butt and Cyril de
Run, 2010; Youseff et al., 1996). Chakravraty (2010) found that responsiveness had the
lowest service quality gap score (-0.65) compared to the other five determinants in their
study. Resnick and Griffiths (2011) found responsiveness to have the third lowest
negative service quality gap score for their clinical staff group. Butt and Cyril de Run
(2010) and Youseff et al. (1996) also found responsiveness to be the third most negative
determinant in their healthcare studies. In contrast Curry and Sinclair (2002) had found
both high expectations and perceptions of responsiveness in their study of three
physiotherapy services. They found that responsiveness had one of the highest mean
gap scores for expectations and perceptions in two of the physiotherapy services. Curry
and Stark (2000) indicated a very positive score for the responsiveness determinant in
their study of nursing homes. Previous healthcare studies do show different results for
different studies, however the information from the face to face interviews does give an
explanation of where the negative perception may be stemming from and this is
valuable management information. It should be regularly communicated to all staff that
customers are judging and making comparisons on the service quality of all the
personnel of the practice and that consistent and excellent customer service should be
strived for.
5.1.4 Assurance
Assurance is concerned with knowledge and courtesy of employees and their ability to
convey trust and confidence. For this study assurance had an equal service quality gap
score alongside responsiveness (0.32). This signifies a 0.32 gap between customers’
expectations and perceptions of the assurance factor. Of the nine interviews, two
respondents (E and RR) gave assurance a negative perception score. When asked,
candidate RR did not understand the question. One question was around feeling safe in
115

the transactions with the practice and the other concerned the behaviour of the
employees and the fact that they instil confidence. Respondent E did answer the
question about feeling safe in the transactions with a negative perception and said:
“I feel perfectly safe from the physical perspective but I came though BUPA and
the paperwork sometimes goes awry but if the environment was unsafe I would
score it a four or a five (out of seven).”
In other words Candidate E marked the practice lower on the perception score because
of the paperwork transaction but commented that if he had felt physically unsafe he
would have given the practice an even lower score. The customer was prioritising his
scoring against his personal safety versus his non-physical safety. This is also an
interesting finding as through the interviews it can be recognised that customers
prioritise their scoring as was in this case in relation to personal safety.
Patients (customers) require to be assured in a healthcare setting. Assurance had a
negative perception in studies by Youseff et al. (1996), Resnick and Griffiths (2011);
Chakravarty (2010). Youseff et al. (1996) reported a negative perceived service quality
gap of -0.75. Resnick and Griffiths (2011) reported a negative service quality gap of -
0.5 whilst Chakravarty, (2010) noted -0.28. In contrast Curry and Stark (2000) found in
their study of nursing homes that the residents rated assurance more highly than the
relatives in the study. Curry and Sinclair (2002) recorded high mean expectations and
perceptions for the assurance factor for all three of the physiotherapy service areas, this
could in part be due to the nature of the outsourced physiotherapy services and the
positive relationship between the patient and the therapist where more assurance occurs
face to face. Irfan and Ijaz (2011) found that patients’ perception of assurance was
higher in a public training hospital where patients were given assurance more than they
would have normally been given in a public hospital.
116

5.1.5 Tangibles
Tangibles are concerned with the appearance of physical facilities, equipment and
appearance of personnel and materials. For this study, tangibles generated the second
highest gap, of 0.43, this signified that the customers had an overall very positive
perception of the tangibles of the practice. The tangibles at the practice include the
equipment on display i.e. skeletons and includes the gym and the gym area, the
appearance of the staff and materials associated with the practice i.e. leaflets and
pamphlets.
Of the nine face to face interviews, two candidates (QQ and KKK) had negative gap
scores for tangibles where they scored the perceptions lower than their expectations.
The questions were in regard to the practice having modern looking equipment and the
pamphlets situated in the practice. Respondent QQ gave the practice a negative
perception score of the modern looking equipment, in other words her perception of the
modern looking equipment was not what she was expecting, she said
“Well I have only ever been to a Doctor’s surgery and it wasn’t quite what I was
expecting (referring to the practice). I thought it was going to be different
looking to what I thought, it was nice and clean but the toilets! All you see is
skeletons on the wall and what was a hockey ball to do with the practice, do they
sponsor a hockey team?”
The practice is clean but there is only one toilet and it is very small; customers also
have to walk through the gym to get to the toilet. The skeletons are on the wall in the
reception area as is the hockey ball (in a glass case). This customer did not like the
designs on the wall or the toilet hence the reason why she marked the practice with
lower perceptions for this question. Perhaps other customers were thinking the same but
tangibles had the second most positive service quality gap and is one of the most
positive areas of service quality for the practice.
The second respondent (KKK) scored the pamphlets that sit in the reception area of the
practice with a lower perception score than her expectation score and said:
117

“I thought the pamphlets were not produced particularly well. I think that they
are quite busy. I don’t know how useful pamphlets are nowadays. I think
someone needs to come in here and take something away. You would need a
phone number or something like that but you don’t need all that blurb that’s on
the pamphlets. I think you have to think through very carefully your marketing
strategy and your communication plans. You need easy to follow messages like
“are you in pain?” “Contact us …”
Despite tangibles being the second most positive gap, both candidates KKK and QQ had
quite strong views as to why they scored the practice with a negative perception score
and candidate KKK went a step further describing how the practice should change their
pamphlets. These insights are very valuable. The directors should take account of the
comments if re-designing the pamphlets or the reception area.
In previous healthcare studies, tangibles had a mixed response. Curry and Sinclair
(2002) found that tangibles had low expectation and low perception scores in all three of
their physiotherapy service areas. Curry and Sinclair (2002) indicated that this could be
due to the nature of the outsourced services for physiotherapy. Curry and Stark (2000)
found that tangibles carried the lowest priority for both sets of customers (residents and
relatives) in their care home study. Youseff et al. (1996) stated that tangibles had the
highest expectation but the lowest perception, giving an overall negative perception
score for tangibles of -0.44. They also found that when customers were asked to rate the
following statement: “excellent NHS hospitals would have up to date-facilities”, the
mean gap score was -1.039, the most negative perceived gap for tangibles. This is an
important aspect to comment on because this study was for West Midlands NHS public
hospitals and perhaps the wording of excellent in the expectation questions induced too
great an expectation for the UK NHS public sector. This was also a comment in the
study of Curry and Sinclair (2002) who commented that the wording of the
questionnaire has to be more carefully considered to the environment if the gap between
the two variables (perceptions and expectations) is to be realistically compared.
Camilleri and O’Callaghan (1998) compared the Maltese private healthcare sector with
the Maltese public healthcare sector and the ‘environment’ was rated higher in the 118

private sector than the public sector. Two UK public healthcare studies in the NHS
(Resnick and Griffiths, 2011; Youseff et al., 1996) had negative expectations and
perceptions of the tangibles determinant, in other-words, they were not expecting much
and that is what they perceived. For the current study, it is very interesting to note the
strength of the comments in relation to the equipment and materials and it is an
indicator that the directors of the practice should ask their customers regularly what
they think of the materials and equipment in the practice.
5.1.6 Servicescape
Sureschandar (2002) and Lovelock and Wirtz (2007) termed servicescape as the outside
environment and décor of the internal building. Servicescape was the amended sixth
determinant and covered the external appearance of the building, the internal décor of
the treatment rooms and the cleanliness and tidiness of the reception area. Servicescape
had the most positive service quality gap (0.63) signifying that customers’ perceptions
of the servicescape were (0.55) greater than their expectations.
Of the nine people interviewed only one person had a negative perception score in
regard to all three servicescape questions. Respondent D scored the reception area and
the treatment rooms with a service quality gap of -0.3. Respondent DD commented:
“Bit of a muddled look about the reception area, not as professional as other
physiotherapy practices that I attend. There was a mixture of sports relics and
dried flowers.”
This was another comparison with another practice that she attends, she was comparing
the reception area of the practice with the reception area of another unrelated practice
that she clearly felt was more professional. This comment reinforces the fact that
customers do compare the décor with other service providers. Respondent DD also
created a comparison with the treatment rooms with a service quality gap of -1.0.
Respondent DD said:
“They again are not as good as others I have attended – the rooms (referring to
the practice) appear to have been cobbled out of a large Victorian building piece
meal. Ramps have been added at a later date but give an unfinished look and the
treatment rooms are quite small.”
119

The comments from candidate DD are very interesting findings as not only are past
experiences with other physiotherapy providers relevant and form expectations, their
perceptions are also formed through comparisons with other service providers.
Goldstein et al. (2000) considered access as an element to measure and that included
the physical location, operating times, appointment times and waiting times, whilst
Petrovici and Philips (2009) in their research of the SERVHOSP tool included
ambience (the reception area) as a determinant in their study of service in Romanian
hospitals.
It has been documented in the literature that experiences help form expectations
(Grönroos, 1990; Robledo, 2001). This was evident from the information gathered
during the interviews. Customers compared all the detail including the toilets of other
service providers. Little has been documented as to how perceptions are formed other
than they are formed after a visit to a service provider (Parasuraman et al., 1990). The
interviews have revealed however that perceptions are formed in one sense through
comparisons of other service providers too. This is one of the main general findings
from the interviews. For the directors, this is an important finding as they may want to
visit other service providers themselves and assess the décor and treatment rooms to
keep abreast of what the competition is offering.
120

5.2 General Comments in Relation to Previous Experiences of
Physiotherapy Services
The opening question of the face to face interview asked “if they had previous
experience of any physiotherapy services?” This question provoked statements of
physiotherapy experiences within the NHS and the private sector and comparisons with
the practice. The experiences were categorised into the public sector (The NHS) and the
(Private Sector) and further distilled into comparisons with the practice. Robeldo (2001)
and Cadotte et al. (1983) stated that customers not only compared expectations with
past experiences, they also compared companies of other sectors, in this instance the
public sector. Camilleri and O’Callaghan (1998) defined expectations as being a
phenomenon influenced by personal experiences. The following are general comments
from the face to face interviews in regard to previous experiences and comparisons with
other physiotherapy providers.
5.2.1 Comments in Relation to Previous Experience of the NHS
Six of the nine customers interviewed had previous experiences with physiotherapy
services in the NHS. There were three customers who recalled negative customer care
experiences with the NHS. One customer recounted his wife’s experience with the NHS
physiotherapy services and what she had been through and said:
“My perception of the NHS is based not on my personal experience but of my
wife’s experience, that I think a lot of the customer care and the quality that is
on offer at the NHS has gone downhill particularly in relation to sports injury.”
It was interesting to note that this customer’s perception was formed not through his
own experience but his wife’s, this adds another dimension to perception, in that they
can be formed through other people’s experiences and this is another worthy finding
from the interviews. Healthcare customers/patients are concerned with the level of care
they receive but also the level of care that others close to them receive. Healthcare is
different in this respect to an airline or a restaurant where the care is perhaps not so
intimate or personal. Understanding that customers perceive a service through someone
close to them is also an interesting finding for healthcare practitioners/owners of private
practices. Curry and Stark (2000) found differences between relatives and residents in
their study of care homes but also some similarities of priorities.
121

Expectations of healthcare services very much depend on how the public and private
sector are set up within each particular country and culture. In the UK, many people
have attended the NHS not only for physiotherapy services but for other services,
hospital treatment or other ancillary services and have therefore formed an opinion of
the service quality of the NHS based on their previous experience. The UK private
sector is readily available to individuals who are prepared to pay for the service or
through a third party (BUPA or the SPIRE) and expectations and perceptions are
different as a result of the price for the service. Teboul (1991) stated that the price a
customer has to pay for a service determines the level of quality to be demanded.
For the current study the expectations were high in all six determinants, this was in
contrast to the study of Curry and Sinclair (2002) who conducted their physiotherapy
study in the public sector and had low expectations of the facilities and equipment used
by the therapists. McGorry (1999) in her public healthcare study with a Latino
population found unusually that 13 expectations were lower than perceptions which
may have been due to socio economic factors, i.e. low income and therefore lower
expectations. It could be argued therefore that expectations are not only formed through
experiences but are also culture, country and socio economic dependent. The current
study has shown that for the private physiotherapy sector expectations were high for all
factors and this may be a result of comparisons largely to the NHS or because of price.
5.2.2 Previous Experience and Comparisons to The Practice
Previous experience is a factor that determines expectations and this is demonstrated in
table 26 below. There was a strong correlation between expectations scores and those
customers who had previous experience of physiotherapy services and no correlation
between expectation scores and those customers with no previous experience of
physiotherapy services. This is an extremely interesting finding and does re-iterate the
findings of Robledo (2001) who along with other factors linked experiences and
expectations. This study has highlighted the importance of previous experiences as
potential indicators of expectations.
122

Table 26: Correlation between Expectations and the Gap Score with Experience of
Physiotherapy Services and without Experience of Physiotherapy Services
Correlation between expectation scores and the Gap Score
0.3
Correlation between expectation scores and the difference for those with previous experience of physiotherapy services
0.37 *
Correlation between expectations scores and the difference for those with no previous experience of other physiotherapy services
-0.06**
*45 customers had previous experience of physiotherapy services
** 17 customers had no previous experience of physiotherapy services
Table 26 shows that there is significant correlation (0.37) between those people who
have previous experience of physiotherapy services and their overall expectation,
however there is no relation (-0.06) to those people who have had no previous
experience of physiotherapy services and their expectation. Their expectation is not
linked to their comparison of their experiences. Previous experience of physiotherapy
services is a significant factor in determining expectations and this can be both from the
public and private sector.
The interviews have also highlighted how customers compared physiotherapy services
with other services as one respondent commented
“The only comparison is a silly one really, the Chiropractors had the latest
equipment and were clean and efficient, almost Germanic but there wasn’t this
feeling of we are in this together (referring to the practice).”
The respondent initially compared the equipment of the Chiropractor with the
equipment at the practice but quickly said that despite the better equipment she prefers
the ‘feel good factor’ at the practice. This is also an interesting finding where the
customer is weighing up the importance of one factor against another and the emotional
factor was preferred over the tangible factor. This does re-iterate the importance of the
emotional factors, assurance and empathy in a healthcare setting. This is also
constructive management information for practitioners particularly for this study where
those factors were not the top two service quality gaps, therefore improvements in
assurance and empathy should be considered.
123

5.3 Comments in Relation to the Treatment
The questionnaire in phase one outlined and highlighted in bold that the survey
questions were in relation to customer service of the practice only and not the treatment.
The researcher re-iterated this to the customer when handing out the questionnaire and
the researcher explained this again at the start of the face to face interviews. What
became very evident throughout the interviews was the inseparability for the customer
between the treatment they had received at the practice and the customer service.
Vandame and Leunis (1993) commented that often patients were unable to judge the
care that they receive however, of the nine interviews, five customers commented on the
treatment. One pertinent comment by respondent KKK was in relation to the service
quality of the treatment:
“The reason I have come to this practice I suppose are two keys things. I think
the quality of the diagnosis and the quality of the treatment.”
Respondent KKK directly linked the service quality of the practice with the diagnosis
and treatment they had received. Another candidate candidly said:
“To be honest, I am not fussed about the building, it is the treatment that I am
concerned with.”
In other words they were not interested in the décor or the facilities but whether the
treatment was going to ‘cure’ them. Authors will testify that it is difficult for patients to
assess the treatment in relation to their illness. This study deliberately sought to have the
treatment aspect separate from the service quality of the practice, however, whilst this
was in the main possible, it was still very evident that the customers linked the service
quality of the practice with the treatment they had received.
Despite the on-going debate in the literature of whether to measure both the treatment
and the services together or separately, it is an important finding to note that it is
difficult for customers to separate the service quality with the treatment they receive.
Hassanien et al. (2010) called this combination of services (the physiotherapy services
and the customer service) the core service. It should be remembered that clinical
treatment is a separate construct to other core services such as cleaning as it entails an 124

emotional element that cannot be measured by one questionnaire (Vinagre and Neaves,
2008).
5.4 Reflections of Phase Two
Phase two was specifically concerned with investigating negative perceived service
quality for all six determinants. Negative perception occurs when the perceptions of a
service provider are lower than the expectations of the services. The nine customers
who were interviewed all had some aspect of perceived negative service quality in the
analysis of their questionnaire. They were specifically asked why they rated the
perception question lower than their expectation question. The key findings in phase
two were different to phase one. The main findings for phase two were:
When the customers were interviewed in regard to the negative perception of the
servicescape and tangibles questions, they were the areas where customers had
the most negative comments. This was contrary to the findings in phase one
where the analysis found that those two determinants had the most positive
service quality gaps. It may be that it is verbally easier to criticise tangible
aspects of service quality. Despite empathy being the second lowest service
quality gap, only one customer commented on empathy and the negative
comment was in relation to the customer not being able to receive an
appointment with the desired therapist.
Empathy is also cited in the literature as being an important factor in a
healthcare setting and little was said despite empathy being the second lowest. It
is perhaps harder to talk about feelings of empathy to a researcher and this is
where the questionnaire is perhaps more valuable. Customers can honestly
express through scoring how they feel about the empathy in the practice.
There were several disparaging comments about the reception and the waiting
area of the practice and these areas fall under servicescape which was the most
positive determinant. This is also a tangible aspect of customer service that can
be perhaps more easily discussed than scored.
Assurance and responsiveness were both equal third lowest mean gap score. For
assurance, comments related to the fact that some of the paperwork of the
practice went temporarily missing. For responsiveness, comments related to the
125

interaction between the reception staff, the therapist and the customer. The
customer desired a more responsive interaction but perceived the reaction to be
negative compared to their expectations. Again these are areas that are sensitive
and perhaps a more true picture is depicted from the analysis in phase one rather
than the comments from the interviews.
Reliability had the least positive gap (0.03). When two customers were asked
why their reliability scores were negative, they translated the lack of availability
of the therapists and the ‘unprofessional’ note taking as why they had given a
negative perception of the practice.
That key management information was gleaned from the interviews and could
be presented as a customer service training session to all staff at the practice.
That there is a strong correlation between previous physiotherapy experiences
and expectations. That the customers gather experiences from other services,
both from the public and private healthcare services. The customers then
compare those experiences with the services of the practice.
That perceptions are also formed through experiences including the experiences
of others i.e. relatives.
The sample was much smaller for phase two, but despite this, much more information
was provided by the customers that could benefit the staff and the practice. In addition,
there were factors that the customers mentioned that the questionnaire could not provide
but equally there appeared to be evidence that the intangible aspects of the services
(empathy and assurance) were criticised more in phase one. It appears that the
comments from the interviews would be much more advantageous to the directors of the
practice when considering why customers had perceived some of their service quality in
a negative light. For any small independent practice, it is extremely important that they
know what their customers expect and think of their service in order to remain
competitive. The physiotherapy industry is a competitive industry and any information
that can help the management can only be a benefit.
126

Chapter Six: Conclusion, Future Research and Recommendations
6. Introduction
The aim of the study was to assess the service quality of an independent private
physiotherapy practice. Further, for the study to assist the practice in maintaining
and improving their service quality in order to remain competitive.
6.1 The Objectives
1. To establish and apply an appropriate conceptual framework to assess service
quality within a private independent physiotherapy practice.
2. To explore customers’ insights of service quality of a private independent
physiotherapy practice.
3. To provide recommendations to the practice in relation to service quality.
4. To contribute to the development of service quality debates through the example
of the practice.
The aim and objectives led to a thorough review of the healthcare and marketing
literature in regard to service quality. The literature revealed that many of the service
quality healthcare studies were one method studies. It was noted that there was a gap in
the literature for a mixed method approach to service quality in the independent private
physiotherapy sector. There were substantive discussions in the literature in relation to
service quality conceptual models. The final conceptual model for the practice
measured the gap between perceptions and expectations of service quality. The research
design was a two phased approach. Sixty two questionnaires were distributed in phase
one to the practice customers and phase two conducted nine semi-structured face to face
interviews. The analysis revealed that the service quality for the practice was positive
however, on deeper investigation, a negative perception of service quality was
established in some of the six determinants. The face to face interviews sought to
answer the reasons why the customers perceived aspects of the service quality of the
practice negatively. In addition, there were two emergent themes from the semi-
structured interviews. The first theme involved experiences of physiotherapy services
with other providers and comparisons to the practice and the second theme linked the
service quality with the treatment at the practice. This chapter explores if the aim and 127

objectives of the study were met, the key findings of phase one and two, the theoretical
and managerial implications, recommendations and concludes with recommendations
for future research.
6.1.2 To What Extent were the Aim and Objectives of the Thesis met?
The chosen conceptual model (The Gaps Model of Service Quality) and instrument
(The SERVQUAL Instrument) reflected the aim of the study and objective 1. The gap
for service quality was identified through two variables: customer expectations and
customer perceptions. The model and instrument provided an overall and individual
analysis of the service quality of the practice. In addition to the findings for the
physiotherapy sector, findings were also found for the general healthcare industry and
these are discussed below in the findings of phase one and two respectively.
The methodology of the study allowed the researcher to explore the service quality in
phase two and this met objective 2. No previous service quality study in the private
physiotherapy sector had conducted a mixed method approach. This added depth and
meaning to service quality as a whole for the practice. The information from the face to
face interviews provided valuable information for input into staff training for the
practice staff. It also provided strategic guidance for the practice directors so that they
can remain competitive. The study also helped the directors understand how to improve
the perception of their customers therefore ensuring the service quality gap remains
positive. Recommendations for the practice and for future research are discussed below
and both satisfied objectives 3 and 4 of the study.
6.2 Key Findings of Phase one
Measuring both expectations and perceptions provides valuable management
information. For this study, despite the perceptions being positive for all six factors, the
service quality gap for three determinants was small identifying that the customers’
expectations were just met and in one area (reliability) there were three questions that
had a negative perception of service quality. If the perceptions only had just been
measured, as partially advised in the literature (Cronin and Taylor 1992, 1994), the
findings for the practice may have been different. The analysis would have shown a
positive performance of service quality for all six areas. Measuring the expectations
allowed the analysis to demonstrate the differences in the determinants and therefore the
differences in the customers’ expectations and perceptions of the service. Youseff et al.
128

(1996) found that patients had high expectations of the service quality of West Midlands
hospitals but had a negative perception of the services in all five areas for the hospitals.
This analysis indicated to the hospital management that there was a serious problem
with the perception of their hospital services when compared to the patients’
expectations. Curry and Sinclair (2002) in their study of NHS physiotherapy services
found low expectations in some areas and low perceptions, therefore despite the low
perceptions, the patients were not as unhappy with the services as it met their
expectations. Measuring both variables is therefore an important element to any service
quality study to fully understand the aspects of service quality. This was a key finding
for the physiotherapy sector and for the healthcare sector in phase one.
The customers of the practice had high expectations of the service quality. The practice
is a private independent practice and many of the customers were paying for the
services themselves. Camilleri and O’Callaghan (1998) found that patients had higher
expectations of private hospitals in Malta than the public hospitals and that price was
the main differentiator between the two types of hospitals. Imran and Ijaz (2011)
identified that patients had a more negative perception of a public hospital in Pakistan
than the private hospital in their study. Both those studies demonstrated that patients
had higher expectations and perceptions of the service quality of the private healthcare
sector. It would suggest that customers expect and perceive the service quality in the
private sector to be of a higher standard. This was demonstrated in the study by Butt and
Cyril de Run (2010) who found negative perception of all five determinants for private
Malaysian hospitals. In contrast, Resnick and Griffiths (2011); Chakravarty (2010); Lee
and Yom (2006); Karassavidou et al. (2009); Youseff et al. (1996) found negative
perceptions of service quality in all five of the determinants in their healthcare studies in
public hospitals. The current study found both high expectations and high perceptions of
the service quality for the practice. Identifying high perceptions for all six determinants
is an unusual finding for the healthcare sector. However, in the physiotherapy study
Curry and Sinclair (2002) found that despite the variance of high and low expectations,
the service quality was positive. The analysis of the physiotherapy studies are therefore
in contrast to the other healthcare studies and this was another key finding. The
relevance of this to the practice is that it may be harder to remain competitive if other
private practices are also experiencing positive service quality. It is therefore vital that
129

any negative perceptions or small service quality gaps that have resulted from the study
are managed.
6.3 Key Findings of Phase Two
Supplementing the analysis in phase one with semi-structured face to face interviews
added depth and meaning to the overall understanding of service quality in the practice.
The interviews focussed on areas where the customers perceived the service quality
with a lower perception than expectation, providing a negative service quality gap
score. The information from the interviews gave insights into the reasons why the
customers scored the practice with a lower perception. This mixed method approach
added depth and meaning and this was a key finding for the healthcare and
physiotherapy sector. It was also a recommendation in the study by Karassavidou et al.
(2009). Very few healthcare studies are mixed method studies. Curry et al., (1999)
combined the SERVQUAL questionnaire with a nominal interview technique in their
study of care homes and this also provided more meaningful information to their study.
The customers of the practice were asked in their interview if they had previous
experience of physiotherapy services. Many had previous experience of the NHS and
compared their past experience with the practice. This was an interesting finding in that
customers were comparing the public sector with the private sector. The sample of
customers that had previous experience of physiotherapy services possessed
significantly higher expectations of the service than those that did not and this was a key
finding of the study. Grönroos (1984), Parasuraman et al. (1985) and Robledo (2001)
stated that past experience amongst other factors, word of mouth, media and public
relations formed the customers’ expectations. The finding of the face to face interviews
confirmed this but another key finding was that perceptions were also developed
through experiences and not only through the eyes of the customer but also through
those people that are close to the customer i.e. relatives. For the general healthcare
sector, this was a key finding and one of which management and healthcare personnel
should be made aware
Another key finding was the inseparability of the comments on the service quality of
the practice and the treatment received. Vinagre and Neaves (2008) and Vandame and
Leunis (1993) were of the opinion that customers/patients were unable to judge the
treatment they receive, however this study has demonstrated that the customers were
130
unable to separate the two services. This is what Hassanien et al. (2010) described as
the core service. This was another key finding for the healthcare sector and for the
physiotherapy sector. Researchers should be aware of this finding when designing their
research approach to service quality in the healthcare sector.
6.4 Summary of Key Findings
The findings refine and extend the literature in several areas:
The SERVQUAL Instrument is suitable for an independent private
physiotherapy practice. It can be amended slightly for the context of the study.
The distribution and the time taken to complete the questionnaire requires to be
taken into consideration when undertaking a study with the SERVQUAL
questionnaire as was found in previous studies (Curry and Sinclair, 2002;
Franceschini and Cignetti, 1998)
It is of benefit to measure both the expectations and perceptions of the
customer. It benchmarks the customers’ perceptions against their expectations of
the service quality of an organisation. Management are therefore able to identify
the determinants that require attention in order to maintain their service quality
with a positive gap or to improve the gap if a negative gap exists or could
potentially exist.
That a face to face interview sequentially following the analysis of the
SERVQUAL questionnaire provides deeper and perhaps more meaningful
information. This was also found in the study of Curry et al., (1999). That
customer stories are an important facet of any healthcare study (Lees, 2010).
That customers’ previous experience of healthcare providers (public or private)
is a significant factor in forming expectations (Grönroos, 1984; Robledo, 2001)
as are customers’ comparisons with other healthcare providers whether in the
public or private UK healthcare sector.
That customers of private healthcare providers have high expectations (Camilleri
and O’Callaghan, 1998; Irfan and Ijaz, 2011) and this was found in the current
study.
131

That customers also form perceptions through experiences, not only from their
own experiences but also from those close to them i.e. relatives.
132

6.5 Managerial ImplicationsThe findings provide management information that can guide practice owners how to
offer excellent service quality that may differentiate them in a competitive market:
Data and information was provided from phase one and two for all six
determinants. There are recommendations in the next section for each one. In
order for the practice to remain competitive in service quality the directors of
the practice need to ensure that training on all determinants is communicated
regularly to the staff.
Other healthcare studies have demonstrated that assurance and empathy are key
factors for customers of healthcare services. For this study, these two
determinants had a less positive service quality gap than tangibles or
servicescape. For the practice both empathy and assurance require attention
before they become negative service quality gaps. The next section offers
management recommendations in these areas.
That service quality should be a key strategic objective. That service quality
should be measured regularly which can then be monitored internally for
improvements, areas that are working well or problems. This should be applied
to any healthcare setting.
That the measurement of service quality in the healthcare sector should be
complemented with an interview in order to add depth and meaning to service
quality. This will provide information for training to improve the service quality
of an organisation whether in the private or the public sector.
Since sharing the research results with the directors, they have given both the
reception area and the treatment rooms a makeover; this was a direct result of
the analysis and feedback provided in phase one and two respectively. In
addition, the staff at the practice have been informed that the paperwork requires
attention and that processes need to be more tightly adhered to in order to
improve the service quality of the practice to further improve the service quality.
133

6.5.1 Areas for Celebration, Areas for Concern and Areas for Training
for The Practice
Table 27: Areas to Share and Celebrate for The Practice
The table commences with the areas with the highest gap score.
Area Share and Celebrate
Servicescape Phase one and two confirmed that the window display is excellent and to be celebrated with the team. This area has the highest gap score of the practice.
Responsiveness In phase one, the customers indicated that the staff are never too busy to respond to them, continue with this excellent service.
Tangibles In phase one the customers rated the facilities as visually appealing. This is likely to be the gym area (see Appendix 14 for a picture).The gym is always neat and tidy and well equipped. Keep the gym, it may be a unique selling point.
Empathy In phase one, the customers felt that the staff gave them personal attention. This is to be encouraged.
Assurance In phase one, the customers noted that the staff are consistently courteous with them. This is excellent service.
Reliability In phase one, the practice was noted for always performing the service right the first time. Continue meeting the customer needs in this manner.
Table 27 indicates the areas with the highest mean gap score for each determinant.
These are highlights in the practice for service quality. The highlights should be shared
with all the staff and encouraged to continue with these aspects of excellent customer
service.
134

Table 28: Areas for Concern for The Practice
The table commences with the lowest gap score for the practice.
Area Areas of Concern
Reliability In phase one, the customers said that the record keeping
at the practice is less than what they expected. This is the
lowest service quality gap for the practice and changes
should be instigated. In phase two, it was noted that the
lack of professionalism with the note taking made the
practice look unreliable.
Empathy In phase one, the customers rated the practice with the
second lowest mean gap score in relation to its opening
hours. The Directors should investigate changing the
operating hours. This was also confirmed in phase two.
Tangibles In phase two, the customers compared the equipment in
the practice to the equipment in other practices. The
customers noted that the equipment was a bit muddled in
the reception area. (see photographs in Appendix 14).
The reception area requires attention.
Responsiveness In phase one, the customers rated the practice low in
their perceptions where the staff were always willing to
help. This was in contrast to the highest score that noted
that the staff were never too busy to respond. It may
mean that staff are responding quickly but not meeting
the customers’ needs.
Assurance In phase one the customers perceived that they did not
always feel safe in the transactions of the practice. This
was explained in phase two by one customer as the
paperwork going awry. This comment links to the
comments above in reliability factor. The paperwork
requires attention.
Servicescape The customers in phase one rated the cleanliness and
tidiness of the treatment rooms as the lowest of the
servicescape scores. This was echoed in phase two where
comments were made in relation to the treatment rooms
saying they were unfinished and quite small. The
treatment rooms could do with a ‘makeover’.
135

Table 28 highlights the areas with the lowest mean gap scores and are therefore areas of
concern. Management should be aware that these are the areas that could quickly
become negative, that is, the customers may have a negative perception of the service
quality in these areas.
Table 29: Areas of Training for The Practice
Area Staff Training Required
Servicescape Continue to regularly change the window display.
Tangibles Comments mentioned that the reception area could be a bit untidy. Staff should remember to regularly store away boxes and equipment in addition to tidying the reception desk of newspapers and pamphlets.
Responsiveness Customers mentioned that the appointment system was not meeting their needs. Staff need to enquire more as to the needs of the customer in relation to appointment times and availability of the therapists.
Assurance The assurance determinant was scored as the third lowest service quality gap. The Directors should discuss with the staff what this could potentially mean. The customers want to feel assured by the staff.
Empathy The empathy determinant was scored as the second lowest determinant but little was said in the interviews. The Directors should discuss with the staff about having the best interests of the customers at heart and what that means in reality.
Reliability Reliability had the lowest service quality gap score. The analysis in phase one and two suggested that customers’ records require to be more accurate. All staff should undertake training in the paperwork processes.
The above table should form the basis of a staff training workshop on service quality. It should also feed into the strategy for service quality for the practice.
136

6.6 Contribution to TheoryThe amended SERVQUAL model added a sixth determinant (servicescape) that
included the internal and external décor of the practice. Adding a sixth determinant did
lengthen the questionnaire by a further three paired item questions, however it provided
valuable information about the décor of the exterior and interior of the practice. It was
the determinant with the most positive service quality gap that reinforced the
importance of the window display. Adding to the SERVQUAL instrument provided a
conceptual framework that suited the requirement of the practice, it was also an area
that Sureshchandar et al. (2002) felt was missing from the SERVQUAL instrument.
Adding the servicescape determinant added to the overall depth of the study and to the
overall understanding of the service quality of the practice. It provided even more
specific information that was validated by the richness of the information.
The face to face interviews focussed on negative perceived quality, customers’ past
experiences and expectations of the practice. The interviews did not take account of
positive perceptions and this may have been an interesting comparison to the negative
ones. However, the interviews provided another layer of information that contributed
extremely well to the overall understanding of the service quality in the practice. It
allowed for specific comments to complement the analysis, in particular, comments in
relation to the reception area that the directors of the practice have direct control of and
therefore direct control of improving the service quality and perception of that area.
137

6.7 Future Research Adapt the SERVQUAL Instrument to the context and culture of the study.
To sequentially follow up the SERVQUAL analysis with face to face interviews
including probing questions that include all determinants to establish customers’
stories and themes. The information from the face to face interviews will
complement the analysis and provide valuable management information.
If surveying the service quality and the treatment in a healthcare setting, careful
thought should be given to what aspects of the treatment the researcher is
questioning? This study has shown that despite separating the two constructs
the customers naturally linked both the service quality of the business and the
treatment provided as part of the core service.
Particular attention should be given to empathy and assurance as both are
determinants that patients value in a healthcare setting and one that is perhaps
easier for them to associate with the treatment given? This could be in relation to
both the questionnaire and the face to face interview. It may be that those two
determinants focus on the treatment aspects of the care rather than the service
quality of the organisation.
To focus the interviews on both the negative and the positive perceptions of
service quality in order to give even more cause for celebration.
138

Appendix 1: Ten Dimensions of Service QualitySource: Zeithaml et al., (1990)
Dimension and Definition Examples of Specific Questions raised by Customers
Tangibles: Appearance of physical facilities, equipment, personnel and communication materials.
Are the bank’s facilities attractive? Is my stockbroker dressed
appropriately? Is my credit card statement easy to
understand? Do the tools used by the repair person
look modern?Reliability: Ability to perform the promised service dependably and accurately.
When a loan officer says she will call me back in 15 minutes, does she do so?
Does my stockbroker follow my exact instructions to buy or sell?
Is my credit card statement free of errors?
Is my washing machine repaired right the first time?
Responsiveness: Willingness to help customers and provide prompt service.
When there is a problem with my bank statement, does the bank resolve the problem quickly?
Is my stockbroker willing to answer my questions?
Are charges for returned merchandise credited to my account promptly?
Is the repair firm willing to give me a specific time when the repair person will show up?
Competence: Possession of the required skills and knowledge to perform the service.
Is the bank teller able to process my transactions without fumbling around?
Does my brokerage firm have the research capabilities to accurately track market developments?
When I call my credit card company, is the person at the other end able to answer my question?
Does the repair person appear to know what he is doing?
Courtesy: Politeness, respect, consideration and friendliness of contact personnel.
Does the bank teller have a pleasant demeanour?
Does my broker refrain acting busy or being rude when I ask a question?
Are the telephone operators in the credit card company consistently polite when answering my calls?
Does the repair person take off his muddy shoes before stepping on my carpet?
Credibility: Trustworthiness, believability, honesty of the service provider.
Does the bank have a good reputation? Does my broker refrain from
139

pressurising me to buy? Are the interest rates/fees charged by
my credit card company consistent with the services provided?
Does the repair firm guarantee its services?
Security: Freedom from the danger, risk or doubt.
Is it safe to use the bank’s automatic teller machines?
Does my brokerage firm know where my stock certificate is?
Is my credit card safe from unauthorised use?
Access: Approachability and ease of contact. How easy is it for me to talk to senior bank officials when I have a problem?
Is it easy to get through to my broker over the telephone?
Does the credit card company have a 24-hour, toll-free telephone number?
Is the repair service facility conveniently located?
Communication: Keeping customers informed in language they can understand and listening to them.
Can the loan officer explain clearly the various charges related to the mortgage loan?
Does my broker avoid using technical jargon?
When I call my credit card company, are they willing to listen to me?
Does the repair firm call when they are unable to keep a scheduled repair appointment?
Understanding the Customer: Making the effort to know the customers and their needs.
Does someone in my bank recognise me as a regular customer?
Does my broker try to determine what my specific financial objectives are?
Is my credit limit set by my credit card company consistent with what I can afford (i.e. neither too high nor too low)?
Is the repair firm willing to be flexible enough to accommodate my schedule?
140

Appendix 2: SERVQUAL and its Application
AUTHOR TYPE OF
INDUSTRY
ADAPTIONS TO
SERVQUAL
SAMPLE SIZE VALIDITY
ANALYSIS
Carman (1990) Retail Industry
Services (Dental,
Business School
Placement Centre
and an Acute Care
Hospital).
Minor adaptions to
22 item SERVQUAL
questionnaire
(adaptions, wording
to suit the industry).
Sample 800 over the
four industries
Cronbach Alpha.
The mean alpha
was 0.75.
Chou et al., (2010) Airlines Added flight Pattern
to the SERVQUAL
determinants, a 28
item questionnaire.
Not available Fuzzy weighted
SERVQUAL
method and mean
scores.
Curry and Herbert
(1998)
Public Sector-
Public services
SERVQUAL 22 item
questionnaire, minor
changes. Merged
with another tool.
40% response rate
from external
customers, 31% from
staff and 71% from
management (no
record of total sample
numbers)
Mean Gap Scores
Donnelly et al.
(2006)
Public Sector –
Police
SERVQUAL 22 item
questionnaire, minor
wording adaptions to
fit the context.
The Customers
Viewpoint: 471 (142
respondents).
The Police Force
Viewpoint: 200 (79
respondents).
Cronbach Alpha.
Mean Gap Scores
Weightings and
Ranking.
Franceschini and
Cignetti (1998)
Services (libraries,
supermarkets and
telephones)
Importance weights
given to each
dimension the
SERVQUAL
questionnaire, 22
items.
Sample 290-487 spread
over several
companies.
Factor Analysis
followed by
oblique rotation.
Cronbach Alpha
(0.8-0.93)
Gagliano (1994) Retail Apparel
Stores
SERVQUAL :
Adapted to: (1)
Personal Attention
(2) Reliability (3) and
(4) Convenience
Not available Factor Analysis
141

Hokey and Hyesung
(1997)
Retail – Luxury
Korean Hotels
14 item questionnaire
and included:
Tangibles Reliability
and Responsiveness.
180 employees of 6
luxury Korean Hotels
(144 respondents).
Paired t-test
Wilcoxon-Mann-
Whitney test
Kumar et al., (2009) Banks Adapted
SERVQUAL to four
determinants. Called
two determinants
(convenience and
competence). 26 item
questionnaire.
Sample 308 Malaysian
bank customers. 289
respondents
Mean Scores
Cronbach Alpha
Lassar et al. (2000) Banking SERVQUAL 22 item
questionnaire and
Technical/ Functional
Quality Framework
Sample 300.
Respondents 80.
Cronbach Alpha
(range 0.96-0.92)
Factor Analysis
Pearson correlation
Smith et al. (2007) Public Sector –
Education
SERVQUAL 22 item
questionnaire with
minor changes.
314 Student responses
152 Staff responses
Factor Analysis
Mann-Whitney
Test
Pakdil and Aydin
(2007)
Airlines 35 item questionnaire
including
SERVQUAL
determinants and
additional sections on
Employees, Flight
Patterns, Availability
and Image of airline
company.
1000 (response rate
32%)
Mean Scores
Cronbach Alpha
(0.89 Percetion
related items) and
0.93 for
Expectation related
items)
Sureshchandar et
al., (2002)
Banking Added Core Service,
Systemisation of
Service Delivery and
Social Responsibility.
Deleted two
questions
Sample 452 from 51
different banks.
Respondents 277.
Comparative Fit
Index (0.929)
Cronbach Alpha
Bentler Bonett
Coefficient (0.915)
142

Appendix 3: The SERVQUAL Questionnaire (as amended)
Customer Service Questionnaire for the Practice Customers
In recognition of the importance that The Practice place on Customer Service, they have agreed to take part in a research project, into their customers’ expectations and perceptions of customer service, by Edinburgh Napier University. The researcher is studying for a Doctorate in Customer Service and your replies will form part of that research. No names or companies will feature in the study; it will be totally anonymous and confidential.
The questionnaire is in two parts. The first section of the questionnaire is looking at customers’ expectations of ANY physiotherapy practice and the second part of the questionnaire is looking ONLY at customer perceptions of THE PRACTICE. The questionnaire is ONLY enquiring about customer service, it is NOT asking about the physiotherapy treatment you receive or have received.
Thank you for taking the time to complete this Customer Services Questionnaire as part of The Practice’s ongoing commitment to Customer Service – it should take no longer than 10 minutes. Once you have completed the questionnaire, please put it in the sealed box at reception where it will be collected and analysed ONLY by the independent researcher.
Directions:
First Part of the Questionnaire – Customer Expectations on ANY Physiotherapy Practice
Based on your experiences as a consumer of Physiotherapy services, please think about the kind of physiotherapy practice that would deliver excellent customer service.
Think about the kind of practice with which you would be pleased to do business. Please show the extent to which you think such a physiotherapy practice would possess the feature described by each statement.
If you feel a feature is not at all essential for excellent physiotherapy practices such as the one you have in mind, circle 1 for strongly disagree.
If you feel a feature is absolutely essential for excellent physiotherapy practices circle 7 for strongly agree.
If your feelings are less strong, circle one of the numbers in the middle.
There are no right or wrong answers; all we are interested in is a number that truly reflects your feelings regarding physiotherapy practices that would deliver excellent customer service.
143

First Part of the Questionnaire – Customer Expectations on ANY Physiotherapy Practice Q’s 1 - 25
Disagree Agree
1. Excellent physiotherapy practices will have modern equipment. 1 2 3 4 5 6 7
2. The physical facilities at excellent physiotherapy practices will be visually appealing. 1 2 3 4 5 6 7
3. Employees at excellent physiotherapy practices will be neat-appearing. 1 2 3 4 5 6 7
4. Materials associated with the services (such as pamphlets) will be visually appealing in an excellent physiotherapy practice.
1 2 3 4 5 6 7
5. When excellent physiotherapy practices promise to do something by a certain time, they will do so. 1 2 3 4 5 6 7
6. When a customer has a problem, excellent physiotherapy practices will show a sincere interest in solving it. 1 2 3 4 5 6 7
7. Excellent physiotherapy practices will perform the service right the first time. 1 2 3 4 5 6 7
8. Excellent physiotherapy practices will provide their services at the time they promise to do so. 1 2 3 4 5 6 7
9. Excellent physiotherapy practices will insist on accurate records. 1 2 3 4 5 6 7
10. Employees in excellent physiotherapy practices will tell customers exactly when services will be performed. 1 2 3 4 5 6 7
11. Employees in excellent physiotherapy practices will give prompt service to customers. 1 2 3 4 5 6 7
12. Employees in excellent physiotherapy practices will always be willing to help customers. 1 2 3 4 5 6 7
144

The following set of statements relate to your feelings about ANY physiotherapy practice.
Disagree Agree
13. Employees in excellent physiotherapy practices will never be too busy to respond to customers’ requests. 1 2 3 4 5 6 7
14. The behaviour of employees in excellent physiotherapy practices will instil confidence in customers. 1 2 3 4 5 6 7
15. Customers of excellent physiotherapy practices will feel safe in their transactions (financial or other). 1 2 3 4 5 6 7
16. Employees in excellent physiotherapy practices will be consistently courteous with customers. 1 2 3 4 5 6 7
17. Employees in excellent physiotherapy practices will have the knowledge to answer customers’ questions. 1 2 3 4 5 6 7
18. Excellent physiotherapy practices will give customers individual attention. 1 2 3 4 5 6 7
19. Excellent physiotherapy customers will have operating hours convenient to all their customers. 1 2 3 4 5 6 7
20. Excellent physiotherapy practices will have employees who give customers personal attention. 1 2 3 4 5 6 7
21. Excellent physiotherapy practices will have the customers’ best interests at heart. 1 2 3 4 5 6 7
22. The employees of excellent physiotherapy practices will understand the specific needs of their customers. 1 2 3 4 5 6 7
23. The external décor of an excellent physiotherapy practice will be neat and tidy. 1 2 3 4 5 6 7
24. The treatment rooms of an excellent physiotherapy practice will be clean and tidy. 1 2 3 4 5 6 7
25. The reception area of an excellent physiotherapy practice will be clean and tidy. 1 2 3 4 5 6 7
145

Directions:
Second part of the questionnaire – Customer Perceptions of THE PRACTICE
The following set of statements relate to your perceptions of THE PRACTICE.
For each statement below, please show the extent to which you believe THE PRACTICE would possess the feature described by each statement.
By circling 1, you are indicating that you strongly disagree that THE PRACTICE has that feature.
By circling 7, you are indicating that you strongly agree that THE PRACTICE has that feature.
If your feelings are less strong, circle one of the numbers in the middle.
There are no right or wrong answers; all we are interested in is a number that truly reflects your perceptions regarding THE PRACTICE.
Second Part of the Questionnaire – Customer Perceptions of THE PRACTICE Q’s 1-25
The following set of statements relate to your perceptions of THE PRACTICE.
Disagree Agree
1. The Practice has modern looking equipment. 1 2 3 4 5 6 7
2. The Practice physical facilities are visually appealing.
1 2 3 4 5 6 7
3. The Practice employees are neat-appearing. 1 2 3 4 5 6 7
4. Materials associated with The Practice (such as pamphlets) are visually appealing. 1 2 3 4 5 6 7
5. When The Practice promises to do something by a certain time, it does so. 1 2 3 4 5 6 7
6. When you have a problem, The Practice shows a sincere interest in solving it. 1 2 3 4 5 6 7
7. The Practice performs the service right the first time.
1 2 3 4 5 6 7
8. The Practice provides its services at the time it promises to do so. 1 2 3 4 5 6 7
9. The Practice insists on accurate records. 1 2 3 4 5 6 7
146

The following set of statements relate to your feelings about The Practice.
Disagree Agree
10. Employees in The Practice tell you exactly when services will be performed. 1 2 3 4 5 6 7
11. Employees in The Practice give you prompt service.
1 2 3 4 5 6 7
12. Employees in The Practice are always willing to help you.
1 2 3 4 5 6 7
13. Employees in The Practice are never too busy to respond to your requests. 1 2 3 4 5 6 7
14. The behaviour of employees in The Practice instils confidence in you. 1 2 3 4 5 6 7
15. You feel safe in your transactions (financial or other) with The Practice.
1 2 3 4 5 6 7
16. Employees in The Practice are consistently courteous with you. 1 2 3 4 5 6 7
17. Employees in The practice have the knowledge to answer your questions. 1 2 3 4 5 6 7
18. The Practice gives you individual attention. 1 2 3 4 5 6 7
19. The Practice has operating hours convenient to all its customers. 1 2 3 4 5 6 7
20. The Practice has employees who give you personal attention.
1 2 3 4 5 6 7
21. The Practice has your best interests at heart. 1 2 3 4 5 6 7
22. Employees of The Practice understand your specific needs.
1 2 3 4 5 6 7
23. The Practice has a neat and tidy external décor. 1 2 3 4 5 6 7
24. The Practice has clean and tidy treatment rooms.
1 2 3 4 5 6 7
25. The Practice has a clean and tidy reception area.
1 2 3 4 5 6 7
147

ANY OTHER COMMENTS – PLEASE WRITE IN THE BOX BELOW
ARE YOU? (please tick box):
Male Female
AGE:
Under 21 21 -35 36- 50 51-64 65 & Over
ARE YOU?
Paying for treatment yourself By a third party Using Medical Insurance
DO YOU HAVE EXPERIENCE OF ANY OTHER PHYSIOTHERAPY CLINICS?
Yes No
If Yes:
NHS Private Hospital Privately Owned Practice
Would you be willing to take part in further research (face to face 20 minute interview) at a location and time convenient to you?
Those who take part in the face to face interview will be entered into a draw for a £50 Marks and Spencer’s Voucher.
Yes No
If Yes, please provide a contact email address _____________________________________ or telephone
number ______________________
All details will remain confidential and you will be contacted by an independent researcher who will not identify you in any survey results.
Thank you for your participation in this survey.
148

Appendix 4: Memo to The Therapists of The Practice
Dear All
I am emailing to let you know that we have agreed to take part in some
research into our customer service at The Practice in conjunction with
Edinburgh Napier University.
Audrey Gow is the researcher (and some of you already know her).
Audrey is studying for a Doctorate in Customer Services and has our
permission to conduct her study on The Practice.
A pilot study of 30 existing customers will first be undertaken after
which, the full study will take place on all existing customers (not
customers who are coming to The Practice for the first time) over
the summer months.
Attached is a copy of the questionnaire. The questionnaire is being
handed out at reception and collated and analysed by Audrey only.
The results will be totally anonymous and confidential.
We are confident that the results will be excellent!
Kind regards
Directors
THE PRACTICE
149

Appendix 5: Memo Regarding the Pilot Questionnaire
Customer Service Pilot Questionnaire
To: Reception
From: Audrey
Dear Reception,
I hope that you are both well?
The Directors of The Practice have agreed to take part in some research into their customer service.
The first part of the study is the Pilot Study and I am looking for 30 questionnaires to be completed by customers at The Practice.
The customers should NOT be customers who are coming into the practice for the very first time but customers who have been to the practice more than once.
Please ask the customer if they could take part in a customer services questionnaire. You might like to say something like below:
“Excuse me, I wonder whilst you are waiting for your appointment might we take 10 minutes of your time by asking you to complete our customer services questionnaire. [then hand the customer the questionnaire with a pen and then say]. Once you have completed the questionnaire, please can you put it in the sealed box on the table where it will be collected by the researcher”
If you have any questions or queries that you need to ask me, please do not hesitate to contact me and I will get straight back to you. THANK YOU both.
Best wishes
Audrey
150

Appendix 6: Outline of the Semi-Structured Face to Face Interview
Note for researcher:
Ask candidates to complete read ethics guidelines and sign the agreement
form.
Tell candidates that the interview will be recorded and gain their
agreement
Tell candidates how long the interview will take
Remind candidates that the research is only concerned with the service
quality of the practice and not the service quality of the treatment
Remind candidates of confidentiality and anonymity
Question One: Have you any previous experience of physiotherapy services?
Question Two: Can you explain to me why you scored this question with a more
negative score than this question (the candidate was shown their original completed
questionnaire and they were referred to their questions where the perception score was
lower than their expectation score).
Thank the candidate for coming to the interview and for their time.
Ask them if they have any further questions.
151

Appendix 7: The Ethical Guidelines
My name is Audrey Gow and I am a research student from the School of Edinburgh Napier
University. As part of my programme research, I am undertaking a research project for my
dissertation. The title of my project is: An Investigation into customer service in the private
physiotherapy sector.
All data will be anonymised as much as possible, but you may be identifiable from tape
recordings of your voice. You name will be replaced with a participant number or a pseudonym,
and it will not be possible for you to be identified in any reporting of the data gathered. All
findings will be reported in a generalised form. All data collected will be kept in a secure place
to which I only have access. These will be kept until the end of the examination process,
following which all data that could identify you could be destroyed. The researcher is not aware
of any risks associated with this research.
The results may be published in a journal or presented at a conference.
If you would like to contact an independent person, who knows about this project but is not
involved in it, you are welcome to contact Professor Anne Munro at Edinburgh University at
If you have read and understood this information sheet, and you would like to be a participant in
the study, please now read and sign the consent form below.
-------------------------------------------------------------------------------------------------------------------
I have read and understood the information sheet and this consent form. I have had an
opportunity to ask questions about my participation. I understand that I am under no obligation
to take part and that I have the right to withdraw at any stage without giving any reason.
Name of Participant…………………………………………………………………………………………………………………………….
Signature of Participant……………………………………………………………………………………………………………………….
Signature of Researcher……………………………………………………………Date………………………………………………….
152

Appendix 8: Reliability Data and Overall Mean Gap ScoresDeterminant Overall Mean
Gap ScorePerception Mean Gap Score
Expectation Mean Gap Score
Servicescape 0.55 6.47 5.92Tangibles 0.44 5.99 5.55Responsiveness 0.32 6.45 6.29Assurance 0.32 6.69 6.37Empathy 0.25 6.57 6.32Reliability 0.03 6.40 6.37
Reliability – N = 62
The table below outlines the actual difference between each paired question for the
sample for the Reliability determinant. It also shows the mean Gap Score for each
question.
Q31-Q 5
DifferenceQ32- Q6
DifferenceQ33- Q7
DifferenceQ34- Q8
DifferenceQ35- Q9
Difference
Mean Gap
Score0 0 1 0 0 0.251 1 2 1 1 1.251 -1 2 3 0 1.250 1 0 0 0 0.25-1 0 0 0 0 -0.251 0 0 1 0 0.52 1 1 1 0 1.250 0 0 0 0 00 0 0 0 0 00 0 0 0 0 00 0 0 0 0 00 1 1 1 0 0.750 0 1 0 -1 0.250 0 1 2 -1 0.752 -1 0 2 0 0.750 0 0 0 0 00 1 -1 -1 0 -0.250 0 0 0 0 01 1 0 1 1 0.75-1 -1 0 0 0 -0.5-1 0 0 0 0 -0.250 0 2 0 0 0.50 0 0 0 0 0-2 0 1 1 -1 01 0 1 1 0 0.75
153

1 1 0 0 -1 0.50 0 0 0 0 00 -1 -1 -1 -1 -0.75-1 -1 3 -1 -2 00 0 2 0 -2 0.5-1 0 0 0 0 -0.250 0 0 0 -1 00 0 0 0 0 00 0 2 0 0 0.50 0 0 0 0 0-1 0 1 1 -2 0.25-1 0 0 0 0 -0.250 0 0 0 0 00 0 1 -1 -3 00 0 0 0 0 00 0 1 1 1 0.50 0 0 0 0 01 0 0 0 -2 0.250 -1 3 0 0 0.50 -1 1 -1 -1 -0.250 0 1 0 0 0.250 0 -1 0 0 -0.251 1 1 0 0 0.750 0 0 1 0 0.250 0 0 0 -2 00 0 0 0 0 01 1 1 1 0 1-1 -1 1 1 -1 00 0 0 0 0 01 1 1 0 1 0.750 0 1 0 0 0.25-2 0 1 -2 -2 -0.75-2 -1 0 -4 -2 -1.75-1 -1 -1 0 -1 -0.75-2 -1 -1 -1 -2 -1.250 0 0 0 0 01 0 0 1 -1 0.5
P P P P P E E E E E
Total 394 408 397 400 385 396 409 368 393 410
Mean 6.35 6.58 6.4 6.45 6.21 6.39 6.6 5.94 6.32 6.61
STDev 0.748699 0.559519 0.756603 0.761306 0.870973 0.836755 0.664305 1.171673 0.901259 0.661713
154

Appendix 9: Empathy DataEmpathy – N = 62
The table below outlines the actual difference between each paired question for the
sample for the Empathy determinant. It also shows the mean difference for each
question.
EMPATHY N=62
Q43-Q18Difference
Q44-Q19Difference
Q45-Q20Difference
Q46-Q21Difference
Q47-Q22Difference
MeanDifference
0 0 0 0 0 01 1 1 1 1 11 0 1 1 1 0.80 0 0 1 2 0.61 1 1 1 0 0.80 0 0 0 0 00 0 0 -1 1 00 -1 0 0 0 -0.20 0 1 0 0 0.20 0 0 0 0 00 -1 1 0 2 0.41 1 1 0 1 0.80 0 1 0 0 0.20 -1 0 0 1 02 5 2 0 0 1.80 0 0 0 0 00 0 0 -1 -1 -0.40 0 1 1 0 0.41 1 1 1 1 11 1 1 1 1 10 0 1 1 -1 0.21 1 2 1 1 1.20 2 0 0 0 0.40 1 1 1 1 0.81 0 1 0 0 0.40 1 0 0 0 0.20 0 0 0 0 00 0 1 1 1 0.6
-1 -1 -1 -2 -1 -1.20 0 0 0 0 01 0 1 0 0 0.40 0 0 -1 -1 -0.4
155

0 0 0 0 0 00 0 0 0 0 00 0 0 0 0 01 2 1 2 1 1.41 0 0 1 1 0.60 -2 1 -1 1 -0.21 0 3 -3 3 0.80 2 0 0 0 0.40 -2 0 0 1 -0.20 0 1 1 1 0.60 1 0 0 0 0.21 -3 0 0 0 -0.42 2 2 0 1 1.40 -1 0 0 0 -0.20 0 1 0 0 0.22 0 1 0 1 0.81 -1 1 0 0 0.20 0 1 1 0 0.40 0 0 0 0 00 0 0 0 0 00 0 1 0 -1 00 1 0 0 0 0.22 3 2 2 2 2.20 1 0 0 1 0.40 -2 0 -1 0 -0.60 -5 0 0 0 -10 0 0 -1 -1 -0.4
-2 -3 -2 -3 -2 -2.40 0 0 0 0 00 0 0 0 0 0
156
P P P PTotal 414 387 415 404 416Mean 6.68 6.24 6.69 6.52 6.71STDev 0.566097 1.050924 0.560699 0.783894 0.554774
E E E E ETotal 395 383 384 400 397Mean 6.37 6.18 6.19 6.45 6.4STDev 0.706733 1.03265 0.806504 0.716948 0.777968717
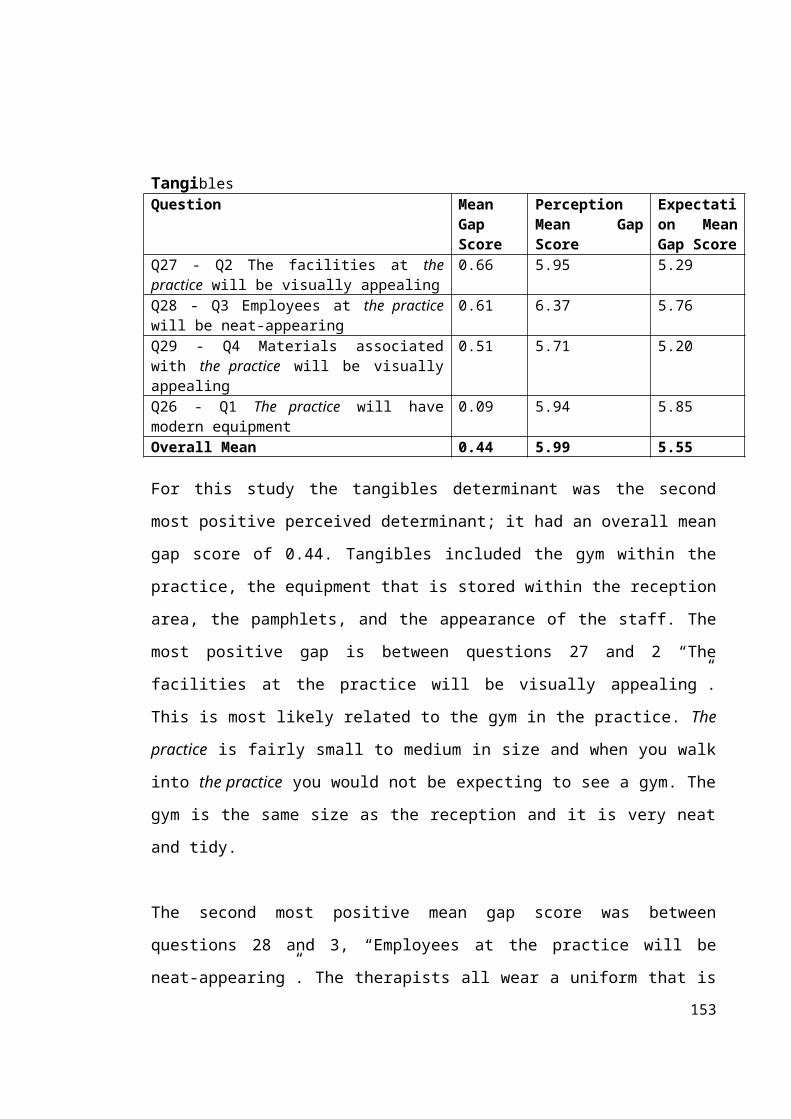
Appendix 10: Tangibles DataTangibles – N = 62
The table below outlines the actual difference between each paired question for the
sample for the Tangibles determinant. It also shows the mean Gap Score for each
question.
Q26-Q1Difference
Q27- Q2Difference
Q28- Q3Difference
Q29- Q4Difference
Mean Gap Score
0 0 0 0 02 2 2 1 1.750 0 0 0 00 0 0 0 01 1 1 1 10 1 1 1 0.75-2 1 1 0 00 1 1 0 0.51 2 1 0 12 2 2 2 2-2 -2 0 0 -1-1 2 1 2 10 0 -1 -1 -0.51 2 1 1 1.25-1 -1 2 -1 -0.250 0 0 -3 -0.751 1 1 2 1.251 1 0 0 0.50 0 -1 0 -0.25-1 0 0 -2 -0.75-1 -1 0 0 -0.50 0 0 0 00 3 2 1 1.51 0 1 0 0.50 0 1 -2 -0.251 0 1 2 1-2 0 0 0 -0.51 1 0 1 0.752 1 -1 4 1.50 0 0 1 0.25-2 1 1 1 0.25-1 -1 0 -1 -0.750 0 0 0 0
157

3 3 1 3 2.52 1 1 0 11 1 1 -1 0.51 1 0 2 11 1 0 -1 0.25-1 1 0 1 0.250 0 0 0 00 0 1 0 0.25-1 0 1 0 00 3 1 1 1.253 4 1 2 2.51 2 3 1 1.750 0 1 0 0.251 1 0 0 0.51 0 2 1 1-1 0 -2 -1 -1-2 0 1 0 -0.250 0 0 0 00 0 3 2 1.25-2 2 1 3 10 3 2 -1 11 1 2 1 1.251 2 2 2 1.751 1 0 1 0.75-3 -2 1 -1 -1.25-1 0 -1 0 -0.5-2 -3 -2 0 -1.750 0 0 -2 -0.50 1 1 1 0.75
P P P P E E E ETotal 368 368 395 354 363 328 357 330Mean 5.94 5.95 6.37 5.71 5.85 5.29 5.76 5.32
STDev 0.884678 0.920993 0.751695 0.85674 1.239338 1.246465 0.917686 1.211613
158

Appendix 11: The Responsiveness DataResponsiveness – N = 62
The table below outlines the actual difference between each paired question for the
sample for the Responsiveness determinant. It also shows the mean Gap Score for each
question.
Q35- Q10Difference
Q36- Q11Difference
Q37- Q12Difference
Q38- Q13Difference
MeanGap
Score0 0 0 0 01 1 1 1 10 0 -1 0 -0.250 0 0 3 0.750 0 1 0 0.251 0 0 0 0.251 0 0 1 0.50 0 0 0 00 0 0 0 00 0 0 2 0.50 0 0 1 0.252 1 0 1 10 0 0 1 0.25-1 0 1 1 0.251 0 0 3 10 0 0 0 00 0 0 0 00 0 0 1 0.251 1 0 2 10 -1 0 0 -0.250 0 0 1 0.250 0 0 1 0.250 0 0 0 01 0 0 1 0.50 1 1 2 12 2 2 3 2.250 0 0 0 00 0 0 0 0-1 0 -1 0 -0.50 0 0 0 0-1 0 0 0 -0.25-1 0 0 0 -0.250 0 0 0 0
159

0 0 0 0 00 0 0 0 02 1 0 4 1.751 0 0 0 0.250 0 0 1 0.252 1 1 3 1.750 0 0 0 01 1 0 0 0.50 -1 -1 0 -0.50 0 0 0 00 1 2 3 1.50 0 0 1 0.250 0 0 1 0.250 0 0 1 0.250 1 1 1 0.750 0 0 1 0.25-1 1 1 2 0.750 0 0 0 01 1 0 0 0.50 2 -1 2 0.750 0 0 2 0.50 1 1 3 1.251 1 0 1 0.75-1 -2 -1 1 -0.75-1 -2 0 0 -0.750 0 0 0 0-2 -2 -1 -1 -1.50 0 0 0 00 1 1 1 0.75
P P P P E E E ETotal 404 400 411 401 395 390 404 349Mean 6.52 6.45 6.63 6.47 6.37 6.29 6.52 5.63STDev 0.671234 0.823376 0.606897 0.740353 0.834382 0.85674 0.718421 1.345714
160

Appendix 12: Assurance DataAssurance – N = 62
The table below outlines the actual difference between each paired question for the
sample for the Assurance determinant. It also shows the mean Gap Score for each
question.
Q39-Q14
DifferenceQ40-Q15Difference
Q41-Q16
Difference
Q42-Q17
Difference
MeanGap
Score0 0 0 0 01 1 1 1 10 0 0 0 02 0 2 1 1.250 -1 1 2 0.50 0 1 0 0.251 0 0 0 0.250 0 0 0 00 0 0 0 00 0 0 0 00 1 0 0 0.251 0 0 1 0.50 0 0 1 0.250 -1 -1 1 -0.251 1 0 1 0.750 0 0 0 01 0 0 0 0.251 1 0 1 0.751 2 1 1 1.250 0 0 1 0.250 0 1 0 0.251 2 1 1 1.250 0 0 0 00 0 1 1 0.50 0 1 1 0.52 0 1 1 10 0 0 0 0-1 -1 1 1 0-1 -1 -1 -1 -10 0 0 0 00 0 1 0 0.250 0 0 0 00 0 0 0 0
161

0 0 0 0 00 0 0 0 01 0 0 2 0.751 1 1 1 10 1 0 1 0.53 1 2 1 1.750 0 0 0 01 1 1 0 0.750 1 0 0 0.25-1 -1 0 0 -0.51 2 2 2 1.750 0 1 1 0.50 0 0 0 00 0 0 0 00 1 2 1 10 0 -1 0 -0.250 1 2 -1 0.50 0 0 0 00 0 0 0 00 0 2 0 0.50 0 0 0 01 2 3 1 1.750 0 1 1 0.50 0 0 0 00 0 0 1 0.25-1 -1 1 1 0-2 -4 1 -2 -1.750 0 0 0 00 0 0 1 0.25
P P P P E E E ETotal 414 411 420 414 400 402 391 388Mean 6.68 6.63 6.77 6.68 6.45 6.48 6.31 6.26STDev 0.59435 0.706733 0.493211 0.719157 0.782544 0.718421 0.841324 0.86717
162

Appendix 13: Servicescape DataServicescape N=62
The table below outlines the actual difference between each paired question for the
sample for the Servicescape determinant. It also shows the mean Gap Score for each
question.
Q48-Q23Difference
Q49-Q24Difference
Q50-Q25Difference
MeanGap
Score0 0 0 0.001 0 0 0.331 1 1 1.001 0 0 0.331 1 2 1.331 0 -1 0.001 1 3 1.671 0 1 0.670 0 0 0.002 0 2 1.33-1 -1 -1 -1.00-1 0 -1 -0.670 1 0 0.33-1 0 0 -0.333 2 2 2.330 0 0 0.000 0 0 0.000 0 0 0.001 1 1 1.000 0 0 0.000 0 0 0.002 0 2 1.333 0 1 1.331 0 1 0.671 0 0 0.331 1 -1 0.330 -1 0 -0.330 0 1 0.332 -1 0 0.33-3 -1 -2 -2.002 2 2 2.002 0 0 0.670 0 0 0.00
163

2 0 0 0.670 0 0 0.003 1 2 2.002 1 1 1.331 0 1 0.673 2 2 2.332 0 1 1.001 1 1 1.001 0 1 0.672 2 2 2.001 0 3 1.331 1 1 1.001 0 0 0.331 1 1 1.000 1 1 0.670 0 0 0.002 1 2 1.670 0 0 0.001 1 1 1.000 -1 0 -0.332 0 0 0.673 3 3 3.002 1 1 1.330 -2 -2 -1.330 0 0 0.000 0 0 0.00-1 -2 -2 -1.670 0 0 0.001 0 0 0.33
P P P E E ETotal 397 406 400 345 389 367Mean 6.4 6.55 6.45 5.56 6.27 5.92STDev 0.68854 0.618762 0.782544 0.951633 0.771827 0.874003
164

Appendix 14: Pictures of The Practice
Pictures of the Window Display
165

166

Pictures of the Gym and the Reception Area
167

Appendix 15: Phase Two-Negative Gap Scores
Reliability
Customer Respondent - Candidate D
Perception Question
(P) Score Expectation Question
(E) Score Gap Score
Q5. When the practice promises to do something by a certain time it does.
6 Q5. When excellent physiotherapy practices promise to do something they will do so.
7 6-7=-1
Customer Respondent - Candidate KK
Perception Question
Score Expectation Question
Score Gap Score
Q5. When the practice promises to do something by a certain time it does.
6 Q5. When excellent physiotherapy practices promise to do something they will do so.
7 5-7 -1
Customer Respondent – Candidate C
Perception Question
Score Expectation Question
Score Gap Score
Q6. When you have a problem, the practice shows a sincere interest in solving it.
6 Q6. Excellent physiotherapy practices show a sincere interest in solving your problems.
7 6-7= -1
Customer Respondent- Candidate SS
Perception Question
Score Expectation Question
Score Gap Score
Q6. When you have a problem, the practice shows a sincere interest in solving it.
6 Q6. Excellent physiotherapy practices show a sincere interest in solving your problems.
7 6-7= -1
168

Appendix 15 Continued
Customer Respondent- Candidate DD
Perception Question
Score Expectation Question
Score Gap Score
Q9. The practice insists on accurate records.
5 Q9. Excellent physiotherapy practices insist on accurate records.
7 5-7=-2
Customer Respondent- Candidate RR
Perception Question
Score Expectation Question
Score Gap Score
Q9. The practice insists on accurate records.
5 Q9. Excellent physiotherapy practices insist on accurate records.
7 5-7 = -2
Customer Respondent- Candidate KK
Perception Question
Score Expectation Question
Score Gap Score
Q9. The practice insists on accurate records.
5 Q9. Excellent physiotherapy practices insist on accurate records.
7 5-7 = -2
EMPATHY
Customer Respondent - Candidate PP
Perception Question
Score Expectation Question
Score Gap Score
Q19. The practice has operating hours that are convenient to its customers?
5 Q19. Excellent physiotherapy practices have operating hours convenient to its customers?
7 7-5 = -2
169

Appendix 15 Continued
Responsiveness
Customer Respondent – Candidate QQ
Perception Question
Score Expectation Question
Score Gap Score
Q11. Employees in the practice give you prompt service.
6 Q11. Employees in excellent physiotherapy practices give you prompt service.
7 6-7 = -1
Customer Respondent - Candidate C
Perception Question
Score Expectation Question
Score Gap Score
Q12. Employees in the practice are always willing to help you.
6 Q12. Employees in excellent physiotherapy practices are always willing to help you.
7 6-7 = -1
Customer respondent - Candidate QQ
Perception Question
Score Expectation Question
Score Gap Score
Q12. Employees in the practice are always willing to help you.
6 Q12. Employees in excellent physiotherapy practices are always willing to help you.
7 6-7 = -1
170

Appendix 15 Continued
ASSURANCE
Customer Respondent - Candidate RR
Perception Question
Score Expectation Question
Score Gap Score
Q14.The behaviour of employees at the practice instils confidence in you.
6 Q14. The behaviour of employees at excellent physiotherapy practices instils confidence in you.
7 6-7=-1
Customer Respondent - Candidate E
Perception Question
Score Expectation Question
Score Gap Score
Q15. You feel safe in your transactions at the practice.
6 Q15. You feel safe in your transactions at excellent physiotherapy practices.
7 6-7 = -1
Customer Respondent - Candidate RR
Perception Question
Score Expectation Question
Score Gap Score
Q15. You feel safe in your transactions at the practice.
6 Q15. You feel safe in your transactions at excellent physiotherapy practices.
7 6-7=-1
171

Appendix 15 Continued
TANGIBLES
Customer Respondent - Candidate QQ
Perception Question
Score Expectation Question
Score Gap Score
Q1. The practice has modern looking equipment.
6 Q1. Excellent physiotherapy practices have modern looking equipment.
7 6-7= -1
Customer Respondent - Candidate KKK
Perception Question
Score Expectation Question
Score Gap Score
Q4. Materials associated with the practice are visually appealing.
5 Q4. Materials of excellent physiotherapy practices are visually appealing.
7 5-7= -2
Customer Respondent- Candidate KK
Perception Question
Score Expectation Question
Score Gap Score
Q4. Materials associated with the practice are visually appealing.
4 Q4. Materials of excellent physiotherapy practices are visually appealing.
5 4-5=-1
172

Appendix 15 Continued
SERVICESCAPE
Customer Respondent - Candidate DD
Perception Question
Score Expectation Question
Score Gap Score
Q23. The Practice has a neat and tidy exterior.
4 Q23. Excellent physiotherapy practices have a neat and tidy exterior.
7 4-7= -3
Q24. The practice has clean and tidy treatment rooms.
6 Q24. Excellent physiotherapy practices have neat and tidy treatment rooms.
7 6-7=-1
173

References
Abrahamson, M. (1983) Social research methods. Englewood Cliffs, NJ: Prentice-Hall.
Ahmed, R. and Samreen, H. (2011) ‘Assessing the service quality of some selected
hospitals in Karachi based on the SERVQUAL model’, Pakistani Business Review, Vol.
7, pp. 266- 314.
Alrubaiee, L., (2011) ‘The mediating effect of patient satisfaction in the patients’
perceptions of healthcare quality – patient trust relationship’, International Journal of
Marketing Studies, Vol. 3, (1), pp. 1-38.
Andaleed, S.S. (1998) ‘Determinants of customer satisfaction with hospital: a
managerial model’, International Journal of Health Care Quality Assurance, Vol. 11
(6), pp. 181-7.
Babakus, E., & Boller, G. W. (1992) ‘An empirical assessment of the SERVQUAL
scale’ Journal of Business Research, Vol. 24 (3), pp. 253-268.
Babakus, E. And Mangold, W.G. (1992) ‘Adapting the SERVQUAL scale to hospital
services: an empirical investigation’, Journal of Health Services Research, Vol. 26 (6),
pp. 767-786.
Baker, T.L., and Taylor, S.A. (1994) ‘An assessment of the relationship between service
quality and customer satisfaction in the formation of consumers' purchase intentions’,
Journal of Retailing, Vol, 70 (2), pp. 163-178.
Bansal, H. S., & Taylor, S. (1997) ‘Investigating the Relationship Between Service
Quality, Satisfaction, and Switching Intentions’, Developments in Marketing Science,
Vol, 20, pp.304-313.
Benton, T. and Craib, I. (200I) Philosophy of Social Science. Palgrave Macmillan
Berry, L.L., Parasuraman, A., Zeithaml, V.A. (1988) ‘The Service Quality Puzzle’,
Business Horizons, Vol. 31 (5). pp 35-43.
Bhaskar, R. (1979, 1998) The possibility of Naturalism. Hemel Hempstead: Harvested
Wheatsheaf
174

Bitner, M.J. (1990) ‘Evaluating service encounters: the effects of physical surroundings
and employee responses’, The Journal of Marketing, Vol. 54 (2), pp. 69-82.
Bitner, M.J. (1992) ‘Servicescapes: the impact of physical surroundings on customers
and employees’, Journal of Marketing, Vol. 56 (2) pp. 57-71.
Bolton, R.N. and Drew, J.H. (1991) ‘A longitudinal analysis of the impact of service
changes on customer attitudes’, Journal of Marketing, Vol. 55 (1) pp 1-9.
Bopp, K. D. (1990) ‘How patients evaluate the quality of ambulatory medical
encounters: a marketing perspective’, Journal of Health Care Marketing, Vol. 10 (1),
pp.6-15.
Boulding, W., Kalra, A., Staelin, R., & Zeithaml, V. A. (1993) ‘A dynamic process
model of service quality: from expectations to behavioral intentions’, Journal of
Marketing Research, Vol. 30 (1), pp.7-27.
Bowers, M.R., Swan, J.E. and Koehler, W.F. (1994) ‘What attributes determine quality
and satisfaction of healthcare delivery?’, Healthcare Management Review, Vol. 19, (4),
pp. 49-55.
Brady, M.K. and Cronin, J.J. (2001) ‘Some new thoughts on conceptualising perceived
service quality: a hierarchical approach’, Journal of Marketing, Vol, 65. PP 34-49.
Brannen, J. (2005) ‘Mixing methods: The entry of qualitative and quantitative
approaches into the research process’, International Journal of Social Research
Methodology, Vol. 8 (3), pp.173-184.
Brewer, J., & Hunter, A. (2005) Foundations of multi-method research. Thousand
Oaks, CA: Sage.
Broetzmann, S.M., Kemp, J., Rossano, M. And Marwaha, J., (1995) ‘Customer
Satisfaction – lip service or management tool?’, Managing Service quality, Vol. 5, (2),
pp. 13-18.
Brown, T.J., Churchill, G.A. Jr and Peter, J.P. (1993) ‘Research note: improving the
measurement of service quality’, Journal of Retailing, Vol. 69 (1) pp.127-39.
Bryman, A. (1988) Quantity and quality in social research, London, Unwin Hyman
175

Bryman, A. (2006) ‘Paradigm peace and the implications for quality’, International
Journal of Social Research Methodology, Vol., 9 (2), pp.111-126.
Bryman, A., & Bell, E. (2007) Business research methods, Oxford University press.
Burgess, R. G., (1982) ‘The unstructured interview as a conversation’, Field Research:
A sourcebook and Field Manual, pp. 107-10.
Butt, M. M., and Cyril de Run, E., (2010) ‘Private Healthcare quality: applying a
SERVQUAL model’, International Journal of Health Care, Vol. 23 (7), pp 658-673.
Buttle, F. (1996), ‘SERVQUAL: review, critique, research agenda’. European Journal
of Marketing, Vol. 30 (1), pp. 28-32.
Buzzel, R.D. (1963) ‘Is Marketing a science?’, The Harvard Business School, Vol. 14,
pp. 32-40:166-170.
Cadote, E.R. Woodruff, R.B. and Jenkins, R.L. (1983) ‘Modelling consumer
satisfaction processes using experienced based norms’, Journal of Marketing, October
p.59
Campbell, S, M., Roland, M. O. and Buetow, S. A., (2000) ‘Defining quality of care’,
Social Science & Medicine Vol. 51, (11), pp. 1611-1625.
Carman, J. (1990) ‘Consumer perceptions of service quality: An assessment of the
SERVQUAL dimensions’, Journal of Retailing, Vol. 66, (1), pp. 33-55
Camilleri, D. and O’Callaghan, M. (1998) ‘Comparing public and private hospital care
service’, International Journal of Health Care Quality Assurance, Vol. 11 (4), pp. 127-
133.
Caro,M. L., & García, M.J. A. (2007) ‘Measuring perceived service quality in urgent
transport service’, Journal of Retailing and Consumer Services, Vol. 14 (1), pp.60-72.
Chakravarty, C. A., (2010) Evaluation of service quality of hospital outpatient
department services, Medical Journal Armed Forces India, Vol. 67 (3), pp. 221-224.
176

Chand, M. (2010) ‘Measuring the service quality of Indian tourism destinations: an
application of SERVQUAL model’ International Journal of Services Technology and
Management, Vol. 13 (3), pp.218-233.
Chaniotakis, I. and Lymeropoulos, C., (2009) ‘Service quality effect on satisfaction and
word of mouth in the health care industry’, Managing Service Quality, Vol.19 (2), pp.
229-242.
Choi, K. S., Lee, H., Kim, C., & Lee, S. (2005) ‘The service quality dimensions and
patient satisfaction relationships in South Korea: comparisons across gender, age and
types of service’, Journal of Services Marketing, Vol. 19 (3), pp.140-149.
Chou, C-C., Liu, L-J., Huang, S-F., Yih, J-M., Han, T-C, (2011) ‘An evaluations of
airline service quality using the fuzzy weighted SERVQUAL method’, Journal of
Applied Soft Computing, Vol. 11, pp. 2117-2118.
Chowdhary, N., & Prakash, M. (2005) ‘Service quality: revisiting the two factors
theory’, Journal of Services Research, Vol. 5 (1), pp.61-75.
Coffey, A. A., and Atkinson, P. (1996) Making sense of qualitative data:
Complementary research strategies. Sage
Collis, J., & Hussey, R. (2009) Business research: A practical guide for undergraduate
and postgraduate students. Palgrave Macmillan.
Creswell, J. W., Plano Clark, V. L., Gutmann, M. L., & Hanson, W. E. (2003)
‘Advanced mixed methods research designs’, Handbook of Mixed Methods in Social
and Behavioural Research, pp.209-240.
Creswell, J. W., & Clark, V. L. P. (2007) Designing and conducting mixed methods
research. Thousand Oaks, CA: Sage publications.
Creswell, J. W., (2009) Research design: Qualitative, quantitative, and mixed methods
approaches. Sage.
Cronin, J.J., and Taylor, Jr. S., (1992) ‘Measuring service quality: a re-examination and
extension’, Journal of Marketing, Vol. 56 (3), pp. 55-68.
177

Cronin, J.J., and Taylor, Jr. S., (1994) ‘SERVPERF versus SERVQUAL: Reconciling
performance-based and perceptions- minus-expectations measurement of service
quality’, The Journal of Marketing, Vol. 58, (1), pp. 125-131.
Crotty, M., (1998) The foundations of Social Research, Sage Publications
http:www.csp.org.uk/professional-union/professionalism/what-
professionalism,accessed 14/5/2013
http:www.csp.org.uk/standards, accessed 14/5/2013
Curry and Pagouni, E. (1997) ‘Measuring the service quality of an out-patients
department at Astley Ainslie Hospital: using the SERVQUAL model’, Royal National
Hospital, Larbert, Seminar Paper
Curry, A. and Herbert, D. (1998) ‘Continuous improvement in public services – a way
forward’, Managing Service Quality, Vol. 8 (5) pp. 339-349.
Curry, A. (1999) ‘Innovation in public sector management’, Managing Service Quality,
Vol. 9 (3) pp. 180-190.
Curry, A., Stark, S., and Summerhill, L., (1999) ‘Patient and stakeholder consultation in
healthcare’, Managing Service Quality, Vol. 9, (5), pp. 327-336.
Curry, A., Stark, S., (2000) ‘Quality of nursing homes’ Health Service Management
Research, Vol. 13 (4), pp.205-215
Curry, A. and Sinclair, E., (2002) ‘Assessing the quality of physiotherapy services using
SERVQUAL’, The International Journal of Health Care Quality Assurance, Vol. 15,
(5), pp. 197-205.
Dabholkar, P.A. (1995) ‘Contingency framework for predicting casuality between
customer satisfaction and prices in the life insurance industry, in Sujan, M. and Kardes,
F. (Eds)’, Advances in Consumer Research, Vol. 22, pp. 101-8.
Dabholkar, P. A., Shepherd, C. D., & Thorpe, D. I. (2000) ‘A comprehensive
framework for service quality: an investigation of critical conceptual and measurement
issues through a longitudinal study’, Journal of Retailing, Vol. 76 (2), pp. 139-173.
178

Dabolkar, P.A., Thorpe, D.I. and Rentz, J.O. (1996) ‘A measure of service quality for
retail stores: scale development and validation’, Journal of the Academy of Marketing
Science, Vol. 24 pp. 3-16.
Dalrymple, J.F., Donnelly, M., Curry, A.C. and Wisniewski, M. (1995a) ‘Assessing the
quality of local government service provision – using the SERVQUAL scale’, Teare,
R. and Armistead, C. (Eds) Services Management: New Directions, New Perspectives,
Cassell, London
Davies, H. T., Nutley, S.M., and Mannion, R., (2000) ‘Organisational culture and
quality of health care’, Quality in Health Care 9, No. 2, pp. 111-119.
Denzin, N., and Lincoln, Y., (Eds), (1998) The Landscape of Qualitative Research:
Theories and Issues, Sage
Department of Health (1989) Working for patients, HMSO, London
Department of Health (1991) Framework for action, HMSO, London
Department of Health (1991) The patient’s charter, HMSO, London
Department of Health (1994) The new NHS: Modern dependable, HMSO, London
Department for Health (1997) Designed to care, HMSO, London
Department of Health (1998) A first class service: Quality in the new NHS, HMSO,
London
Department of Health (1999) The clinical governance: Quality in the NHS, HMSO,
London
Department of Health (2012) Caring for our future, HMSO, London
Diamantopoulos, A., Reynolds, N. L., & Simintiras, A. C. (2006) ‘The impact of
response styles on the stability of cross-national comparisons’, Journal of Business
Research, Vol. 59 (8), pp. 925-935.
Donabedian, A. (1980) Explorations in Quality Assessment and Monitoring: III., Health
Administration Press
179

Donnelly, M., Kerr, N., Rimmer, R. and Shiu (2006) ‘Assessing the quality of police
services using SERVQUAL’, International Journal of Police Strategies and
Management, Vol. 29, No.1, pp. 92-105.
Doyle, L., Brady, A. M., & Byrne, G. (2009) ‘An overview of mixed methods research’,
Journal of Research in Nursing, Vol. 14, (2), pp.175-185.
Easterby-Smith, M., Thorpe, R., Jackson, P., & Lowe, A. (2008) Management research:
Theory and Practice
Easterby-Smith, M., Thorpe, R., & Lowe, A. (2004), Management research (ed.)
Easton. G. (2002) ‘Marketing, A Critical Realist Approach, The Journal of Business
Research, Vol. 55, pp103-109
Edvardsson, B., Larsson, G. (1997) ‘Internal service quality and the psychological work
environment: an empirical analysis of conceptual interrelatedness’, The Service Industry
Journal, Vol. 17 (2), pp. 252-263
Edvardsson, B., Gustafsson, A. and Roos, I., (2005) ‘Service portraits in service
research: A critical review’, International Journal of Service Industry Management,
Vol. 16 (1), pp.107- 121.
Franceschini, F, and Cignetti, M, (1998) ‘Comparing tools for service quality
evaluation’, International Journal of Quality, Vol. 3 (4), pp. 356-367.
Gagliano, K. and Hathcote, J. (1994), ‘Customer expectations and perceptions of service
quality in retail apparel stores’, Journal of Services Marketing, Vol. 8, pp. 60-69.
Goldstein, M. S., Elliott, S.D. and Guccione, A. A. (2000) ‘The development of an
instrument to measure satisfaction with physical therapy’, Journal of the American
Physical Therapy Association, Vol. 8 (9), pp. 853-863.
Gosselink, R. Bott,J., Johnson, M., Dean, E. Nava, S., Norrenberg, M., Schönhofer, B.,
Stiller, K., Van de Leur, H. and Vincent, JL., (2008) ‘Physiotherapy for adult patients
with critical illness: recommendations of the European Respiratory Society and
European Society of Intensive Care medicine task force on physiotherapy for critically
ill patients, Intensive Care Medicine Vol.34 (7) pp. 1188-1199.
180

Gotlieb, J B., Grewal, D, Brown, S.W. (1994) @Consumer satisfaction and perceived
quality: Complementary or divergent constructs?’, Journal of Applied Psychology, Vol.
79 (6), pp.875-885.
Grix, J., (2004) The Foundations of Research. Hampshire: Palgrave MacMillan
Grönroos, C., (1984) ‘A Service Quality Model and its marketing Implications’,
European Journal of Marketing, Vol. 18 (4), pp. 36-44.
Grönroos, C., (1990) Service Management and Marketing theory, Managing the
moments of truth in service competition, Lexington Books, Lexington, MA.
Grönroos, C., (2000) Service management and marketing: A customer relationship
management approach, Wiley, New York, NY
Grönroos, C. (2001) ‘The perceived service quality concept–a mistake?’, Managing
Service Quality, Vol. 11 (3), pp.150-152.
Gullick, J., and Shimadry, B. (2008) Using patient stories to improve quality of care,
Nursing Times Vol. 104 (10), pp. 33-34.
Gummersson, E. (1991) ‘Truths and myths in service quality’, International Journal of
Service Industry Management, Vol. 2 (3), pp7-16.
Gustafson, D. H., Sainfort, F. C., Van Konigsveld, R., & Zimmerman, D. R. (1990)
‘The Quality Assessment Index (QAI) for measuring nursing home quality’, Health
Services Research, Vol. 25, p.97.
Hart, M. (1996) ‘Improving the quality of NHS out-patient clinics: the application and
misapplications of TQM’, International Journal of Health Care Quality Assurance,
Vol. 9 (2), pp. 20-27.
Hassanien, A., Dale, C. and Clarke, A. (2010) Hospitality Business Development,
Butterworth-Heinemann
Hoffman, K.D., Bateson, J.E.G., Wood, E.H. and Kenyon, A.J. (2009) Services
Marketing Concepts, Strategies and Cases, Cengage Learning EMEA
181

Holmlund, M., & Kock, S. (1996) ‘Relationship marketing: the importance of customer-
perceived service quality in retail banking’, Service Industries Journal, Vol. 16 (3), pp.
287-304.
Hopkins, Anthony, John Gabbay, and Julia Neuberger (1994) ‘Role of users of health care in achieving a quality service’ Quality in Health Care Vol.3, (4), pp. 112-117.
Howe, K. R. (1998) ‘The interpretive turn and the new debate in education’, Educational Researcher, Vol. 27 (8), pp.13-20.
Hudak, P., McKeever, P. and Wright, J.G. (2002) ‘The Metaphor of Patients as Customers:
Implications for measuring Satisfaction’, Journal of Clinical Epidemiology, pp. 103-108.
Hung, Y. H., Huang, M. L., & Chen, K. S. (2003) ‘Service quality evaluation by service
quality performance matrix’, Total Quality Management and Business Excellence, Vol.
14 (1), pp.79-89.
Irfan, S. M., and A. Ijaz, (2011) ‘Comparison of Service Quality between Private and
Public Hospitals: Empirical Evidences from Pakistan’, Journal of Quality and
Technology Management Vol.7, pp. 11-22.
Jabnoun, N., and AL Rasasi, AJ., (2005) ‘Transformational leadership and service
quality in UAE hospitals’, Managing Service Quality Vol. 15 (1) pp. 70-81.
Jungki, L., (2007) ‘SERVQUAL v’s SERVPERF: round 2 in a multi-cultural setting:
quality management’, The Journal of Academy of Business and Economics, Vol. 7 (3),
pp. 77-88.
Karassavidou, E., Glaveli, N. and Papadopoulos, C. (2009) ‘Health care quality in
Greek NHS hospitals: No one knows better than patients’, International QMOD
Conference, August, pp. 20-22.
Kim, W. G., Ng, C. Y. N., & Kim, Y. S. (2009) ‘Influence of institutional DINESERV
on customer satisfaction, return intention, and word-of-mouth’, International Journal of
Hospitality Management, Vol. 28 (1), pp.10-17.
182

Kim, J. and Han, W. (2012) ‘Improving service quality in long term care hospitals:
National evaluation on long-term care hospitals and employees perception of quality
dimensions’, Osong Public Health Perspect, Vol. 3, (2) pp.94-99.
Khan, M. (2003) ‘ECOSERV: ecotourists’ quality expectations’, Annals of Tourism
Research, Vol. 18 (6/7), pp. 524-33.
Kotler, P., Armstrong., G, Wong. V, and Saunders., J. (2008) Principles of Marketing,
Prentice Hall, Financial Tome, 5th edition pp. 598-603.
Kuhn, T.S. (1977) The Essential Tension, University of Chicago Press, Chicago
Kumar, M., Kee, F. T. And Charles, V. (2009) ‘Comparative evaluation of critical
factors in delivering service quality of banks: an application of dominance analysis in
modified SERVQUAL model’, International Journal of Quality and Reliability
Management, Vol. 27 (3), pp. 351-377.
Ladhari, R. (2008) ‘Alternative measures of service quality: a review’, Managing
Service Quality, Vol. 18 (1), pp. 65-86.
Ladhari, R (2009) ‘A review of twenty years of SERVQUAL research’, International
Journal of Quality and Services Sciences, Vol. 1 (2), pp. 172-198.
Lafond, A.K. (1995) ‘Improving the quality of investment in health: lessons on
sustainability’, Health Policy and Planning, Vol. 10, pp. 63-76.
Lassar, W., Manolis, C. and Winsor, R. (2000) ‘Service quality perspectives and
satisfaction in private banking’, Journal of Services Marketing, Vol. 14 (3) pp. 244-271.
Launer, J. (2002) Narrative based primary care: A practical guide, Radcliffe Medical
Press, Abingdon
Lee, M.A. and Yom, Y.H., (2007) ‘A comparative study of patients’ and nurses’
perceptions of the quality of nursing services, satisfaction and intent to revisit the
hospital: A questionnaire survey’, International Journal of Nursing Studies, Vol. 44, pp.
545-555.
183

Lee, Y. L. and Hing, N., (1995) ‘Measuring quality in restaurant operations: an
application of the SERVQUAL instrument’, International Journal of Hospitality
Management, Vol. 14 (3/4), pp. 293-310.
Lees, C. (2011) ‘Measuring the patient experience: Narrative method’, Nurse
Researcher, Vol. 19 (1), pp.24-29.
Lim, P.C., and Tang. N.K.H., (2000) ‘A study of patients’ expectations and satisfaction
in Singapore hospitals." International Journal of Health Care Quality Assurance 13, no.
7, 290-299.
Lovelock, CH. (1981) Why marketing management needs to be different for service, in
Donnelly, J. and George, W. (Eds)’, Marketing of Services, American Marketing
Association, Chicago, IL, pp 5-9.
Lovelock, C. and Wirtz, J. (2007) Services marketing: People technology and strategy,
Pearson, Prentice Hall 6th ed
Manaf, N.H.A., and Nooi, P.S., (2009) ‘Patient satisfaction as an indicator of service quality in Malaysian public hospitals’, Asian Journal on Quality Vol. 10, (1), pp. 77-87.
Markovic, S. (2006) ‘Expected service quality measurement in tourism higher education’, Nase Gospodarstvo, Vol. 52, (1/2) pp.86-95.
Martinez, J. and Martinez, L. (2010) ‘Some insights on conceptualizing and measuring service quality’, Journal of Retailing and Consumer Services, Vol. 17, pp. 29-42.
May, S. (2007) ‘Patients' attitudes and beliefs about back pain and its management after physiotherapy for low back pain’, Physiotherapy Research International, Vol. 12, (3), pp. 126-135.
Maylor, H. and Blackmon, K. (2005) Researching business and management, Palgrave
Miles, M.B., and Huberman, A.M., (1994) Qualitative data analysis: An expanded
sourcebook. Sage
Miller, W. L., & Crabtree, B. F. (1994) ‘Qualitative analysis: how to begin making
sense’, Family Practice Research Journal, Vol. 14 (3), pp.289-297.
Min, H., & Min, H. (1997) ‘Benchmarking the quality of hotel services: managerial
perspectives’, International Journal of Quality & Reliability Management, Vol. 14 (6),
pp. 582-597.
184

Mostafa, M.M., (2005) ‘An empirical study of patients’ expectations and satisfaction in
Egyptian hospitals’, International Journal of Health Care Quality Assurance, Vol.18 (7)
pp. 516-32.
Moule, P. and Goodman, M. (2009) Nursing research: An introduction. Sage
Publications
McGorry, S. (1999) ‘An investigation of expectations and perceptions of health-care
services with a Latino population’, International Journal of Health Care Quality
Assurance, Vol. 12, (5), pp. 190-198.
Nicholls, J.A.F., Gilbert, G.R., Roslow, S., (1998) ‘Parisimonious measurement of
customer satisfaction with personal service and the service setting’, Journal of
Consumer Marketing, Vol. 15, (3), pp. 239-253.
Oliver, R. L., (1981)’ Measurement and evaluation of satisfaction processes in retail
settings’,
Journal of Retailing, Vol. 57 (3), pp. 25-48.
Pakdil, F., and Aydin, O., (2007) ‘Expectations and perceptions in airline services: An
analysis using weighted SERVQUAL scores’, Journal of Air Transport Management,
Vol. 13, pp. 229-237.
Parasuraman, A., Zeithaml, V.A. and Berry, L.L. (1985) ‘A conceptual model of
Service Quality and its implication for future research’, Journal of Marketing, Vol. 49
(4), pp. 41- 40.
Parasuraman, A., Zeithaml, V.A. and Berry, L.L. (1988) ‘SERVQUAL, a multiple-item
scale for measuring consumer perceptions of service quality’, Journal of Retailing, Vol.
64 (1), pp. 12 -40.
Parasuraman, A., Zeithaml, V.A. and Berry, L.L. (1991) ‘Refinement and reassessment
of the SERVQUAL scale’, Journal of Retailing, Vol. 67, (4), pp. 420-50.
Parasuraman, A., Zeithaml, V.A. and Berry, L.L. (1994) ‘Alternating scales of
measuring service quality: a comparative assessment based on psychometric and
diagnostic criteria’, Journal of Retailing, Vol. 70, pp. 201-30.
185

Perry, C. (1998) ‘Processes of a case study methodology for postgraduate research in
marketing’, European Journal of Marketing, Vol. 32 (9/10), pp. 785-802.
Petrovici, D. And Phillips, P. (2009) ‘Conceptualising the perceived performance in
hospital services: a patient’s perspective’, University of Kent, Working Paper Series,
No.169
Phillips, D. D. C. (2000) Postpositivism and educational research. Rowman &
Littlefield
Potter, M., Gordon, S., and Hamer, P. (2003a) ‘The difficult patient in private practice
physiotherapy: A qualitative study’, Australian Journal of Physiotherapy, Vol. 49, pp.
53-61.
Potter, M., Gordon, S., and Hamer, P. (2003b) ‘The physiotherapy experience in private
practice: The patients’ perspective’, Australian Journal of Physiotherapy, Vol. 49, pp.
195-202.
Quine, W.V.O., (1980) From a logical point of view, Cambridge, MA: Harvard
University Press
Raduan, C.R., Uli, J., Mohani, A. and Kim, L.N. (2004) ‘Hospital service quality: a
managerial challenge’, International Journal of Health Care Quality Assurance, Vol. 17
(3), pp.146-59.
Resnick, S. And Griffiths, M. (2011) ‘Service quality in alcohol treatment, International
Journal of Health Care Quality Assurance, Vol. 24 (2), pp. 149-163.
Robledo, M.A. (2001) ‘Measuring and managing service quality: integrating customer
expectations, Managing Service Quality, Vol.11 (1), pp. 22-31.
Rust, R. T., Oliver, R.L. (1994) ‘Service quality insights and managerial implications
from the frontier. In Rust, R.T. and Oliver, R.L. (Eds)’, Service Quality: new directions
in theory and practice. Sage publications, London pp 1-19
Ruyter de, K., Wetzels, M., Broemer, J., (1998) ‘On the relationship between perceived
service quality, service loyalty and switching costs’, Journal of Service Management,
Vol. 9, (5), pp. 436-453.
186

Saunders, M. Lewis, P., and Thornhill, A. (2007) Research Methods for Business
Students, 4th edition, Prentice Hall, London
Sewell, N. (1997) ‘Continuous quality improvement in acute healthcare: creating a
holistic and integrated approach’, Journal of Health Care Quality Assurance, Vol. 10
(1), pp. 20-26.
Shemwell, D.J., Yavas, U. and Bilgin, Z. (1998) ‘Customer service provider
relationships: an empirical test of a model of service quality, satisfaction and
relationship orientated outcome’, International Journal of Service Industry
Management, Vol. 9 (2), pp. 155-68.
Smith, G., Smith, A., Clarke, A. (2007) ‘Evaluating service quality in universities: a
service department perspective’, Journal of Quality Assurance in Education, Vol. 15,
pp. 334-351.
Spreng, R.A. and Mackoy, R.D. (1996) ‘An empirical examination of a model of
perceived service quality and satisfaction’, Journal of Retailing, Vol.72, pp.201-14.
Strauss, A., and Corbin, J. (1998) Basics of qualitative research, Thousand Oaks
Sultan, F., & Simpson Jr, M. C. (2000) ‘International service variants: airline passenger
expectations and perceptions of service quality’, Journal of Services Marketing, Vol. 14
(3), pp.188-216.
Sureshchandar, G.S., Rajendran, C. and Anatharaman, R.N., (2002) ‘Determinants of
customer perceived service quality: a confirmatory factor analysis approach’, Journal of
Services Marketing, Vol. 16, (1) pp. 9-34.
Sureshchandar, G.S., Rajendran, C. and Anatharaman, R.N., (2002) ‘The relationship
between service quality and customer satisfaction – a factor specific approach’, Journal
of Services Marketing, Vol. 16 (4), pp. 363-379.
Tashakkori, A., & Teddlie, C. (Eds.). (2003) Handbook of mixed methods in social &
behavioural research. Sage.
Teboul, J. (1991) Managing Quality Dynamics, Prentice Hall, London
187

Teas, R.K., (1993) ‘Expectations, performance evaluation and consumers’ perceptions
of quality’, Journal of Marketing, Vol. 57 (2), pp. 56-69.
Teas, R.K., (1994) ‘Expectations as a comparison standard in measuring service quality:
an assessment of a reassessment’, Journal of Marketing, Vol. 58 (1), pp. 132-139.
Urdang, B. And Howey, R. M., (2000) ‘Assesing damages for non-performance of a
travel professional – a suggested use of SERVQUAL’, Tourism Management, Vol. 22,
pp. 533-538.
Vandamme, R., and Leunis, J. (1993) ‘Development of a Multiple-item Scale for
Measuring Hospital Service Quality’, International Journal of Service Industry
Management, Vol. 4 (3), pp30-49.
Van Herk, H., Poortinga, Y. H., & Verhallen, T. M. (2005) ‘Equivalence of survey data:
relevance for international marketing’, European Journal of Marketing, Vol. 39 (3/4),
pp. 351-364.
Vinagre, M.H. and Neaves, J. (2008) ‘The Influence of Service Quality and Patients’
Emotions on satisfaction’, International Journal of Health Care Quality Assurance,
Vol. 21 (1), pp. 87-103.
Walker, J. and Baker, J. (2000) ‘An exploratory study of a multi-expectation framework
for services’, Journal of Services Marketing, Vol. 14 (5), pp. 411-431.
Ware, J.E. and Synder, M.K. (1975) ‘Dimensions of patient attitudes regarding doctors
and medical care services’, Medical Care, Vol., 13 (8).
Yin, R.K., (2003) Case study research: Design and methods. Vol. 5. Sage.
Youseff, F.N., Jones, R. And Hunt, A. (1996) ‘Health care quality in NHS hospitals’,
International Journal of Health Care Quality Assurance, Vol. 9 (1), pp. 15-28.
Zammito, J.H., (2004) A nice derangement of epistemes: post positivism in the study of
science from Quine to Latour, The University of Chicago Press, Chicago
Zeithaml, V.A., Parasuraman, A., Berry, L.L., (1990) Delivering Quality Service;
Balancing Customer perceptions and Expectations, The Free Press, New York
188