an investigation of the trout fishery in the hiwassee ... · an investigation of the trout fishery...
TRANSCRIPT

An Investigation of the Trout Fishery in the Hiwassee River
A Final Report
Presented to the
Tennessee Wildlife Resources Agency
by
Michael P. Luisi, M.S., and Phillip W. Bettoli, Ph.D.
U.S. Geological Survey, Biological Resources Division Tennessee Cooperative Fisheries Research Unit
Tennessee Technological University Cookeville, TN 38505
June 2001

1
Executive Summary
1. The Hiwassee River below Apalachia Powerhouse is managed by the Tennessee Wildlife Resources Agency as a put-and-take trout fishery and is annually stocked with about 100,000 catchable (> 200 mm total length, TL) rainbow trout and 17,500 catchable brown trout. Detailed information pertaining to the fate of these stocked trout was not available when this study was initiated in 1999. 2. Growth, survival, and harvest rates were estimated by microtagging four cohorts of rainbow trout Oncoryhnchus mykiss (n ≥ 11,000 each) and all of the brown trout Salmo trutta (n = 17,870) stocked in 1999. Electrofishing samples were collected at fixed transects approximately monthly between February and December 1999 using an electrofishing raft and a jet-drive electrofishing boat. Population estimates were derived from change- in-ratio experiments conducted in January 1999 and 2000. A concurrent roving creel survey was conducted to estimate fishing pressure and harvest rates. 3. Nearly all rainbow trout grew slowly, if at all. Brown trout exhibited some growth in late spring and early summer (0.28 mm/day), but growth ceased after 100 days. Some of the rainbow trout stocked in July 1999 moved up to the reach immediately below the powerhouse and preyed heavily on entrained clupeids Alosa spp., which resulted in rapid growth rates of 8 mm and 54 g/month. With those exceptions, the condition of all stocked trout declined significantly over the course of our study. 5. Brown trout exhibited the highest 200-day survival rate (13%), but survival was poor for all cohorts. The harvest rate for rainbow trout stocked in January was high (54%); however, return rates for brown trout and the other three rainbow trout cohorts were low (4 – 22%). 6. Fishing pressure between 30 January and 20 November 1999 (42 weeks) totaled 73,842 hours and represented 20,761 trips. Given the large size of the tailwater (307 hectares at baseflow between the powerhouse and the new Patty Bridge), fishing pressure only amounted to 5.7 hours/hectare/week. Fishing pressure was light below Reliance, and almost non-existent between the Highway 411 bridge in Benton and the new Patty Bridge. 7. Fishing pressure peaked at more than 5,000 hours per two-week period between late March and mid-June, which coincided with baseflows resulting from drought conditions. Anglers harvested 1.15 fish per trip and most (72%) anglers reported catching at least one trout per trip. Twenty-two percent of the anglers were out-of-state residents; most (71%) of the Tennessee residents resided in Bradley, Hamilton, and McMinn counties.

2
Executive Summary - continued 8. Water temperatures in the Hiwassee River commonly exceeded 21 C during late spring and summer 1999, and poor survival rates of stocked trout could have been due, in part, to some initial stocking mortality. In a laboratory experiment, rainbow trout acclimated to 10C (simulating the temperatures in hatchery hauling tanks) experienced partial equilibrium loss when subjected to 24 C and full loss of equilibrium at 27 C. No acute effects were noted for fish tested at 18 or 21 C.
9. Few trout were present in the Hiwassee River in January 1999 (61/ha) or January 2000 (22/ha); the corresponding standing crops (20 and 13 kg/ha, respectively) were the lowest observed to date in any tailwater managed for trout in Tennessee. The low biomass of holdover trout, poor survival, and slow growth were attributed to the unproductive nature of the Hiwassee River (≤ 12mg/L CaCO3) and the low flows and high temperatures (20 – 25 C) experienced during 1999, a drought year. 10. Few trout of quality-size (i.e., > 356 mm; 14 inches) were present anywhere in the Hiwassee River, including the 6-km Quality Zone (QZ) reach. Growth was too slow and few trout survived from one year to the next to reach larger sizes in any reach of the river. The clerk observed 84 rainbow trout and 20 brown trout that were harvested in the QZ, only one of which was a legal fish (i.e., > 356 mm TL). 11. Rainbow trout and brown trout struggled to survive in the Hiwassee River during the drought of 1999. Although low flows and high temperatures undoubtedly contributed to the poor growth and survival of trout during our study, high water temperatures are a chronic problem on the river, which the drought merely exacerbated.

3
ACKNOWLEDGEMENTS Funding for this research was provided by the Tennessee Wildlife Resources Agency, the Center for the Management, Utilization, and Protection of Water Resources at Tennessee Technological University, and the U.S. Geological Survey, Biological Resources Division. We would like to thank Andy Currie, Terry Campbell, and the entire crew at Dale Hollow National Fish Hatchery for their cooperation while tagging and stocking trout. We appreciate the conscientious efforts of our creel clerks, Chris and Cathy Dalton. Paul Horner and Shawn Banks were able field assistants and we thank them for helping us meet our research objectives. Previous drafts of this document were reviewed and edited by Drs. Frank Bulow and Jack Gordon, Tennessee Technological University, and Frank Fiss, Tennessee Wildlife Resources Agency.
FOREWORD This final report is based on a thesis prepared by the first author in partial fulfillment of the requirements for the Master of Science degree at Tennessee technological University.

4
TABLE OF CONTENTS INTRODUCTION ......................................................................................... 5 STUDY AREA ............................................................................................. 6 METHODS .................................................................................................. 7 Trout Marking ………………............................................................. 7 Trout Stocking and Sampling ............................................................ 7 Population Estimates.......................................................................... 8 Habitat Mapping and Water Quality................................................... 9 Temperature Tolerance ..................................................................... 10 Creel Survey...................................................................................... 10 Data Analysis…................................................................................. 11 RESULTS .................................................................................................. 12 Survival.............................................................................................. 12 Growth............................................................................................... 12
Standing Crop Estimates.................................................................... 13 Creel Survey and Return Rates…………………………................... 13 Habitat Survey .................................................................................. 15 Temperature Tolerance ……………………………………………. 15 DISCUSSION ............................................................................................... 16 Survival and Harvest……………....................................................... 16 Growth and Condition……………………......................................... 17 Habitat and Water Quality................................................................... 19 Standing Crops..................................................................................... 19 CONCLUSIONS…………………………………………………………….. 21 REFERENCES……….................................................................................... 22 TABLES ......................................................................................................... 28 FIGURES ........................................................................................................ 37 APPENDIX….. ................................................................................................ 58

5
INTRODUCTION
Beginning with the construction of Norris Dam by the Tennessee Valley Authority (TVA) in 1937 on the Clinch River, hypolimnetic discharges have been managed by fisheries managers in Tennessee and elsewhere to provide angling opportunities where coldwater habitat never existed (Axon 1974). Across the country, put-and-take trout fishing became an integral part of the recreational opportunities available in each state. In an effort to utilize the habitat provided by hypolimnetic discharges, tailwaters in the Southeastern U.S. are regularly stocked with rainbow trout Oncorhynchus mykiss and brown trout Salmo trutta. The fluctuating discharge that occurs below a typical hydroelectric facility is the result of a demand for hydroelectric power, flood control and recreational releases (Parsons 1957; Cushman 1985). Peaking hydroelectric discharges subsequently have ecological effects in downstream reaches that influence trout growth (Weisburg and Burton 1993) and survival (Grizzle 1981). Fluctuations in flow create an unstable aquatic environment (Radford and Hartland-Row 1971), resulting in a reduction of a stream’s carrying capacity (Neel 1963) and poor fish community structure (Bain et al. 1988). This instability, which is the result of changes in water velocity and depth, creates an unsuitable environment for many benthic macroinvertebrate species (Odenkirk and Estes 1991). Benthic taxa can become lost in the drift or dewatered during periods of rapid changes in water levels and velocity (Brusven 1984; Layzer et al. 1989). The scouring effect caused by fluctuating hypolimnetic releases can reduce a river’s productivity. The rainbow trout fishery in the upper Kennebec River, Maine, suffered as a result of extreme flow alterations, which caused the scouring of the streambed and a reduction of the benthic invertebrate populations (Trotzky and Gregory 1974). Studies by Radford and Hartland-Rowe (1971) on the Kananaskis River, Alberta, Blanz et al. (1969) on the White River, Arkansas, and McGary and Harp (1975) on the Little Red River, Arkansas, all noted that benthic communities are depauperate on regulated streams when compared to natural systems. Trout rely heavily on benthic invertebrates (Tippets and Moyle 1978) and will suffer if faced with an inadequate forage base caused by fluctuating flows. The vulnerability to anglers of stocked rainbow trout and brown trout is a key factor influencing the size attained by each species (Boles 1969). Brown trout are typically less vulnerable (Pawson 1991) and reside in the system for longer periods of time. It is this attribute that often allows brown trout to obtain greater size when compared to rainbow trout. However, Weiland and Hayward (1997) reported that stocking rates, not species vulnerability, were more important in determining the maximum size reached by rainbow trout and brown trout. They noted that overstocking ultimately destroyed the forage base for trout in a Missouri reservoir. Water temperatures are a major factor regulating trout growth and survival in tailwaters. The pulsing of cold, hypolimnetic water drastically alters temperature regimes and directly affects downstream fauna. Changes in water temperature affected the rate of consumption by brown trout in studies by Jensen and Berg (1993; 1995). A sudden drop in temperature (5.2 C) over a 16-h period reduced consumption rates and resulted in the smallest intake of rations that was observed. The optimum temperature for trout growth

6
will vary among species and sizes of fish, but Elliot (1975) noted that adult brown trout grew fastest between 10 and 15 C. Appropriate water temperatures must be present year-round to maintain a quality trout fishery; water temperatures above 23 C can be lethal to rainbow trout (Cherry et al. 1977; Biagi and Brown 1997). However, the thermal acclimation state of an individual ultimately determines the response of the individual to changing temperatures (Brett 1956). Stream depth and water velocity, which are important habitat variables related to trout growth and survival, are governed by rates of water discharge (Shirvell and Dungey 1983). Large woody debris and other critical habitat structures preferred by trout may be washed out or dewatered as a result of fluctuating flows. Artificial flow regimes also decrease habitat stability by reducing the quality and quantity of available habitat types within a system (Pert and Erman 1994). The Hiwassee River below Apalachia Powerhouse in southeast Tennessee has been a popular trout fishery for several decades. Each year, the river is stocked with about 100,000 catchable (> 200 mm total length, TL) rainbow trout and about 17,500 catchable brown trout. Little information exists on the fate of these fish because the Hiwassee River is difficult to sample using traditional techniques. Extensive shoals and whitewater rapids prevent rigid boats from traversing many reaches and the water is too deep and swift to wade with backpack electrofishing gear in other reaches. Bettoli (1989) conducted a creel survey in the mid-1980s and noted low return rates for trout stocked into the Hiwassee River. In recent years, high summer temperatures have been problematic and are thought to limit the trout fishery (F. Fiss, Tennessee Wildlife Resources Agency, personal communication). The objectives of this study were to: (1) estimate the population size and biomass of holdover trout in the Hiwassee River; (2) measure the growth, survival and condition of stocked trout; (3) determine rainbow trout resistance time to equilibrium loss at different temperatures; (4) map the habitat and evaluate the water quality in the tailwater; and (5) estimate fishing pressure and harvest rates.
STUDY AREA
Apalachia Dam is located on the Hiwassee River (HR) at river kilometer 106 (HRkm 106) in Cherokee County, North Carolina, approximately 50 km east of Cleveland, Tennessee. The Tennessee Valley Authority (TVA) completed construction of the dam in 1943 and it impounds Apalachia reservoir. At normal pool the reservoir has a surface area of 440 ha and a drainage area of 1,638 km2. Unlike most tailwater systems, the discharge from Apalachia Dam enters an aqueduct and is piped approximately 14 km downstream to the Apalachia Powerhouse at HRkm 86.2 in Polk County, Tennessee (Figure 1). At full generation, this two-turbine facility releases approximately 80 m3/s (2,850 cfs) with an additional flow of approximately 2 m3/s (80 cfs) from the old river channel (Williams 1997).
The Hiwassee River harbors both warmwater and coldwater species; however, salmonids are the dominant sportfish species in the tailwater. Rainbow trout and brown trout accounted for 97 percent of the fish harvested in 1995 (Scott et al. 1996). State trout regulations allow anglers to harvest seven trout daily on the Hiwassee River in all areas

7
other than the Quality Zone, a 6-km section in the upper reach of the tailwater (Figure 2). Quality Zone regulations include a 35.6 cm (14 inch) minimum length limit and a daily limit of two trout. Also, the use of any bait other than artificial lures is prohibited in the Quality Zone. Historically, high water temperatures and low dissolved oxygen (DO) levels (< 6mg/l) occurring in late summer and early fall and were considered to be limiting the trout populations in the Hiwassee River (Scott et al. 1996). To alleviate these problems, TVA implemented a year round minimum flow regulation (6 m3 /s; 200 cfs) in 1991, which is accomplished by pulsing one of the two turbines for one hour every four hours. Also, hub baffles were installed on the turbines in 1993 to aerate the discharge (Scott et al. 1996). These modifications were successful and reduced the number of deficit days (number of days that the target DO level of 6 mg/l was not met, multiplied by the number of mg/l below the target level) from 54 d to less than 1 d (Scott et al. 1996; Figure 3). The upper section of the tailwater below Apalachia Powerhouse is classified as a Class II whitewater river and receives heavy non-angling recreational use during the summer months. This area is also the only section of the tailwater that provides easy access for bank fishing and suitable depths for wading during periods of no generation. The conflicting interests of anglers and rafters are thought to have a direct effect on the amount of fishing pressure this area receives during the summer months (Bettoli 1989). In 1995, TVA initiated a minimum flow consisting of full generation between 11 AM and 7 PM from Memorial Day until the end of August to benefit canoeist and rafters. It is unknown what effect, if any, these new minimum flows have had on the trout fishery.
METHODS
Trout Marking
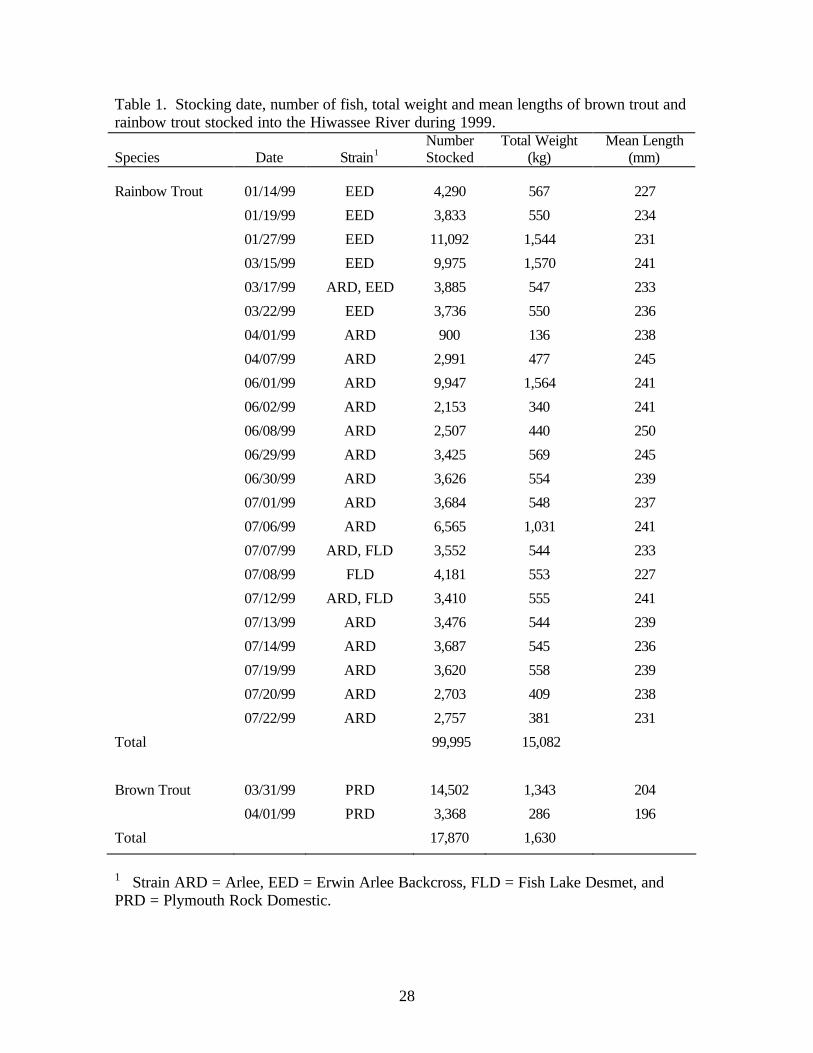
The Tennessee Wildlife Resources Agency (TWRA) stocked the Hiwassee River with approximately 100,000 catchable rainbow trout in four monthly cohorts between 14 January and 22 July 1999. One cohort of catchable brown trout (n = 17,870) was stocked on 31 March and 1 April 1999 (Table 1). A subsample of about half of each monthly rainbow trout cohort, and all the brown trout, were marked using Mark IV CWT microtagging units manufactured by Northwest Marine Technology. Each cohort was microtagged in a different anatomical location and the adipose fin of all tagged fish was clipped (Table 2). Prior to stocking and at least 30 days after tagging, about 2% of the fish in each cohort were measured for total length (mm), weight (g), and checked for retention of the microtag. To reduce the amount of stress on the fish, clove oil was used as an anesthetic during all handling (Anderson et al. 1997). Trout Stocking and Sampling
All trout cohorts, with the exception of the caudal fin-tagged brown trout and anal fin- tagged rainbow trout, were stocked at normal TWRA stocking locations (Figure 4) between 27 January and 9 July 1999 (Table 2). The caudal fin-tagged brown trout and the

8
anal fin-tagged rainbow trout were placed in livewells on whitewater rafts and stocked exclusively into the Quality Zone on 31 March and 8 June, respectively. Fifteen sampling transects were established in two strata (Figure 2). Strata 1 (the upper 9.5 kilometers located between the Apalachia Powerhouse and Reliance, TN) contained two transects in each of two reaches. One reach began at the powerhouse and ended at the top of the Quality Zone; the other reach was the Quality Zone. The specific course taken during each transect within each reach was not fixed; electrofishing times for each transect were recorded. In strata 2 (the 20.5 kilometers of tailwater between Reliance and Patty Bridge) each of the eleven transects was fixed and sampled for 600 seconds. The upper section (Strata 1) was sampled with a 3.7-m SOTAR whitewater raft based on a design provided by the Wyoming Game and Fish Department. This raft was custom-built for electrofishing and used DC supplied by a 2.5 GGP Smith-Root electrofishing system. A jet-driven electrofishing boat with the same Smith-Root electrofishing sys tem was used to sample stations in the lower section (strata 2). Beginning on 3 February 1999, samples were collected approximately monthly during daylight hours at full generation (≥ 637 m3/s). Drought conditions and low discharge levels prevented us from sampling the river in April or May 1999 (Figure 5). All trout collected during each electrofishing transect were placed in an aerated tank and anesthetized with clove oil. Total length (mm) and weight (g) were recorded for all fish and each fish was checked for the presence of a microtag using a detection wand before being released. Population Estimates
The number of holdover brown trout and rainbow trout was estimated in late winter in 1999 and 2000. A holdover fish was defined as any trout residing in the Hiwassee River prior to the first stockings in 1999 and 2000. The number of trout was estimated using the change- in-ratio technique (Paulik and Robson 1969):
N1 = Rx – P2R / (P2 – P1);
where N1 is the total population at time 1 (i.e.; before stocking), Rx is the net change in the number of tagged trout in the tailwater (equals the number of tagged rainbow trout tagged in January), R is the net change in the number of trout in the tailwater (equal to Rx), P2 is the proportion of tagged trout in the tailwater at time 2 (i.e.; when the sample is taken), and P1 is the proportion of tagged trout in the tailwater at time 1 (i.e.; before stocking). Key assumptions for the CIR technique are (1) marks or tags are not lost; (2) mixing between marked and unmarked organisms occurs; (3) marks or tags do not increase organisms susceptibility to recapture; (4) marks or tags do not cause mortality; (5) the system has geographic closure. Variance of the population estimates were calculated following Paulik and Robson (1969):
V(N1) = (P2 – P1)-2 [N1
2 V(P1) + (N1 + R)2 V(P2) + (1 – P2)2 V(Rx) + P22 V(Ry) ];

9
where V is the variance and Ry is the change in the number of holdover trout (i.e.; zero).
The biomass of holdover brown trout and rainbow trout was calculated using the following equation:
B = (Wi Ht) / A;
where B is the biomass of holdover trout, Wi is the mean weight (kg) of holdover trout (i.e.; brown, rainbow, or both species), Ht is the number of holdover trout (i.e.; population estimate for each species, or both species combined), and A is the area of the study reach, in hectares. The first CIR experiment began when 11,136 rainbow trout microtagged below the dorsal fin were stocked on 27 January 1999 at the standard TWRA stocking sites. Some of these fish were also stocked by boat in areas with limited road access between Reliance and Patty Bridge to ensure an equal distribution of marked fish along the entire tailwater. The census sample was collected with electrofishing gear on 3 February 1999 and trout were noted as being marked or unmarked. Prior to this CIR experiment, unmarked rainbow trout (n = 8,123) were inadvertently stocked earlier in January, before the tagged fish were released. Therefore, that number (8,123) was subtracted from the 1999 population estimate to estimate the number of holdover rainbow trout at the beginning of the 1999 fishing season. The CIR experiment was repeated in January 2000. Rainbow trout marked with an adipose fin clip (n = 11,427) were stocked on 17 January 2000 using the same protocols as in January 1999. A census sample was subsequently collected on 20 January 2000. Habitat Mapping and Water Quality
Using a Global Positioning System (GPS) receiver and computer software (ARC/INFO 1995; ArcView 1995), a Geographical Information System (GIS) map was developed for the habitat units of the Hiwassee tailwater in the spring of 1999. The entire study reach (30 km) was traversed on foot and by canoe during periods of base flow (i.e., no generation) and reference points were taken with a GPS receiver at each riffle, run, pool, and shoal habitat unit. Habitat units were defined based on visual observation. Relatively shallow areas with fast moving turbulent water were classified as riffles. Habitat units with moderately deep water and swift but non-turbulent flow were classified as runs; pools were recorded as deep-water areas with little flow or turbulence. A shoal was defined as any area that contained exposed, inverted bedrock resulting in numerous pool, riffle and run microhabitat units. Surface area (km2), mean width, and length of each habitat unit were calculated using GIS. Temperature loggers that recorded the temperature every 30 minutes were placed at three sites in the river (Apalachia Powerhouse, Childres Creek, Patty Bridge) from July through December 2000. Water quality parameters were measured using a Hydrolab Scout 2 water quality data system. Three replicate water samples were collected in January 2000 at the sites where temperature loggers were placed and assayed for alkalinity.
10
Temperature Tolerance
Approximately 125 rainbow trout (> 200 mm total length, TL) were transported from Dale Hollow National Fish Hatchery and placed into a dual-tank recirculating system (Figure 6) on 22 February 2000. The holding tanks had a combined volume of approximately 3,400 liters. Water temperature was regulated using a chilling unit and ranged from 9.2 C to 10.2 C. Stocking simulations were conducted by removing four fish from the holding tanks and placing them into a 114- l test tank (Figure 7). Trout were subjected to test temperatures of 18, 21, 24 and 27 C and temperatures were held constant using three 120-V heaters and a thermostat. The order of the trials at each temperature was randomly determined and two replicates were conducted at each temperature. Prior to the start of a trial, water quality parameters (dissolved oxygen, temperature and ammonia levels) were measured in the holding tanks and test tank. Visual observations of trout placed in the test tank were recorded for one hour. Times were recorded when partial or complete loss of equilibrium occurred. Partial loss of equilibrium was defined as a swimming motion which resulted in an individual orienting itself perpendicular to the surface; complete loss of equilibrium was recorded when an individual rolled over on its back . Any fish that completely lost its equilibrium for more than 30 seconds was immediately removed from the test tank. Individual fish were not tested more than once. Resistance time (elapsed time) was recorded for all observations and all fish were weighed (g) after they were removed. Creel Survey
A stratified non-uniform probability roving creel survey was conducted between 30 January 1999 and 20 November 1999. The survey was designed to collect information on the amount of fishing pressure the tailwater was receiving, the catch and harvest rates of marked and unmarked rainbow trout and brown trout, and the catch per unit of effort for both species.
The survey was divided into 21 two-week periods. Normally, four weekdays and all weekend days were surveyed in each two-week period. Sampling days were divided into equal work periods based on sunrise and sunset times. The river was stratified into two areas: the powerhouse to Reliance was Area 1 and the reach from Reliance to the new Patty Bridge was Area 2. Area 1 was sampled with a probability of 60% during the first eight periods of the survey (January – early May) and 70% thereafter; these probabilities reflected expected (and observed) differences in fishing pressure between the areas. The AM and PM work periods were sampled with equal probability during periods 1-9 and periods 17-21; during the summer months (periods 10 –16) the AM period was sampled with 60% probability. The clerk counted anglers in the area being surveyed once each work shift. The time to start the count was randomly selected from a list of possible start times for each shift, beginning at daylight (or midday) and every 30 minutes thereafter until 1 h before the end of the shift. The counts were adjusted upwards when more boat/raft trailers were counted than boats by adding the mean number of anglers per boat for each boat that was presumed to be on the river, but was not observed.

11
Before and after the count, the clerk interviewed anglers. If anglers agreed to be interviewed, they were asked how long they had been fishing that day, whether they were finished fishing, and how many trout they had caught. Anglers were asked their state of residency and Tennessee residents were also asked for their county residence. The clerk also recorded the method of fishing used by each angler. Finally, the clerk, who was equipped with a tag detection wand, examined the catch of each angler to see if any tagged fish were harvested and measured their lengths. A copy of the interview sheet is provided in Appendix I.
Mean daily counts were expanded to estimate effort in each stratum (i.e., kind-of-day), then pooled to estimate effort during each two-week period following the methods of Pollock et al. (1994). Catch and harvest rates were measured using the mean of ratios method, which is recommended for roving creel surveys (Pollock et al. 1997); interviews of parties that had been fishing for less than 30 minutes were excluded from the analysis. Catch and harvest of each trout species, and each tagged cohort, were then estimated for each two-week period. Standard errors of catch, harvest, and effort each two-week period were calculated according to Pollock et al. (1994). A spreadsheet performed all necessary calculations and calculated 95% confidence intervals around each estimate of catch, harvest, and effort. The pooled variance for total pressure, total harvest, and total catch of each species was calculated using the mean-square-successive-difference-between-periods procedure. The square root of the variance was doubled and then added and subtracted to the estimates to generate approximate 95% confidence intervals.
The average number of trout harvested by complete-trip anglers and incomplete-trip anglers was compared using the Wilcoxon rank-sum test. Complete-trip and incomplete-trip anglers did not differ in the rates at which they harvested trout (both species combined; P = 0.37); therefore, the data from all interviews were pooled. The results of this survey were compared to similar surveys conducted on the South Fork of the Holston, Clinch, Caney Fork and Watauga rivers (Bettoli and Bohm 1997; Bettoli 1999; Devlin and Bettoli 1999; Bettoli et al. 1999). These four rivers have been shown to be among the most popular tailwater trout fisheries in Tennessee. The results of this survey were also compared to creel survey results obtained for the Hiwassee River when it was surveyed in 1987 (Bettoli 1989). Data Analysis
Catch curve analysis was used to estimate the survival of each cohort. Catch data collected during monthly electrofishing samples were transformed (loge [catch+1]) and regressed against days post-stocking using software written for the Statistical Analysis System (SAS Institute 1982). Annual and 200-d survival rates were estimated using antilogs of the instantaneous rate of mortality (Z; slope). Survival could not be mathematically estimated for the rainbow trout stocked in March because too few of those fish were subsequently collected. A pairwise test of the homogeneity of slopes was performed to compare survival rates among cohorts (SAS Institute 1982); survival was considered similar at P ≥ 0.10. Growth of each cohort was calculated by regressing individual length and weights against days post-stocking using software written for the Statistical Analysis System (SAS
12
Institute 1982). Growth was considered significant if the slope of the regression line differed from zero (P≤ 0.10).
RESULTS
Survival Brown trout that were microtagged and stocked into the Hiwassee River below Apalachia Powerhouse were collected in all subsequent electrofishing samples (Table 3). The 200-d survival of this cohort was 12.7% (Figure 8). Catch of the January and June rainbow trout cohorts approached zero at 168 and 128 days post-stocking, respectively. The January rainbow trout cohort was observed through July and the 200-d survival was 4% (Figure 8). Rainbow trout stocked in June were observed through October with a 200-d survival of 3% (Figure 8). However, only four fish from the June rainbow trout cohort were collected after 34 days in the river (Table 3). Rainbow trout stocked in July persisted through the end of the study and their 200-d survival was 4% (Figure 8). However, similar to the May rainbow trout cohort, only seven July rainbow trout were collected after 37 days in the river. Brown trout had a significantly higher survival rate then the January and June cohorts of rainbow trout (P = 0.09 and 0.01, respectively). Rainbow trout stocked in July survived at the same rate as brown trout (P = 0.21). Rainbow trout survival rates were similar among cohorts and uniformly low (P = 0.88, Figure 8). Growth
Brown trout grew slowly in the Hiawassee River. Two brown trout that we collected in the summer of 1999 had adipose fin-clips, which identified them as fish stocked by the Tennessee Valley Authority in the spring of 1995 at an average size of 195 mm and 89 g. After five growing seasons in the tailwater, these fish averaged only 401 mm in total length. Microtagged brown trout stocked into the tailwater on 31 March 1999 grew in total length (P = 0.04) for the first 100 days post-stocking; however, growth subsequently ceased (Figure 9). When stocked, the microtagged brown trout averaged 193 mm (range: 145 - 240 mm) and 83 g (range: 37 - 162 g) (Table 2). Eight months later, these fish averaged only 242 mm TL and 120 g. Microtagged and holdover brown trout collected in 1999 (n = 301) ranged in size from 109 mm to 630 mm TL (Figure 10). Large holdover brown trout (TL ≥ 356 mm) were scarce; only 25% of the 149 holdover brown trout collected in 1999 were 356 mm long or longer and only 4% were longer than 408 mm. Most (61%) of large brown trout were collected in the Quality Zone. Rainbow trout longer than 306 mm were rare; the few we observed were collected near the powerhouse in the fall of 1999. Tagged and untagged rainbow trout collected in electrofishing samples in 1999 (n = 283) ranged from 126 to 365 mm TL (Figure 11). Only two of the four cohorts of rainbow trout stocked in 1999 exhibited significant growth. The January cohort grew 5.1 mm per month (P = 0.02); however, significant weight gains were not observed (P = 0.26). Rainbow trout stocked in March and June did not grow

13
significantly in either length or weight (P ≥ 0.10), but fish stocked in July grew 7.5 mm and 54 g per month (P ≤ 0.04). The growth analysis for those rainbow trout stocked in July was strongly influenced by a small number of recaptures collected near the Apalachia Powerhouse. During late summer, clupeids were being entrained at either Apalachia or Hiwassee Dams and eventually released through the turbines at the powerhouse. A cursory analysis of stomach contents of rainbow trout occupying the Hiwassee River below the powerhouse revealed that they were utilizing this abundant forage base, which resulted in rapid growth. When trout collected at the powerhouse were excluded from analysis, the July cohort did not exhibit significant growth in total length (P = 0.21) and they actually lost weight over time. Standing Crops
The 1999 census sample that was collected to estimate the population size of holdover trout resulted in the capture of 65 trout, 19 of which were microtagged; thus the population estimate was 26,961 holdover trout (Table 4). However, after correcting for the 8,123 rainbow trout stocked prior to the census sample, the actual number of holdover trout in the system was 18,838 or 61/ha. Rainbow trout were collected at all but three of the lower sampling stations; brown trout were not collected below the Quality Zone. Brown trout made up 75% (n = 14,067) of all holdover trout. The CIR technique was repeated on 20 January 2000 and resulted in a population estimate only one-third of the 1999 estimate. Seventy-three trout were collected, 46 of which were microtagged, resulting in a population estimate of 6,707 trout or 22/ha (Table 4). Most of the trout were collected in the upper section of the tailwater above Reliance. On the lower section, brown trout were only observed at two transects and rainbow trout at only four of the eleven transects sampled. Similar to the 1999 survey, brown trout made up 81% (n = 5,465) of all holdover trout in the tailwater. Brown trout stocked in 1999 contributed 37% (n = 2,484) to the number of holdover trout in January 2000 and the July cohort of rainbow trout contributed 7% (n = 497). Trout syanding crop estimates in 1999 and 2000 were only 20 kg/ha and 13 kg/ha, respectively (Table 4). When compared to estimates for other tailwater trout fisheries in Tennessee, the Hiwassee River estimates ranked last (Figure 12). Those estimates were also lower than the average standing crops Region IV biologists measure on small wild trout streams (31 kg/hectare; Habera et al. 2000). Creel Survey and Return Rates
During the 1999 survey period, we interviewed 964 fishing parties, representing 1,844 anglers. Fishing pressure during the 1999 survey period was estimated at 73,842 hours (Table 5). Over comparable periods (March-November), fishing pressure in 1999 was 30% higher than in 1987 (Bettoli 1989). Anglers reported catching 58,717 rainbow trout and 14,453 brown trout, of which 37% (21,828) and 11% (1,631) were harvested, respectively (Table 5). In contrast to survey results from 1987 and 1988 (Bettoli 1989), there was an inverse relationship (P = 0.0006, r2 = 0.47) between average daily discharge during each two-week creel period and fishing pressure in 1999 (Figure 13). Fishing pressure peaked in late March (period 5) and remained high (≥ 5,000 hours) through mid-
14
June (period 10; Figure 14). That peak in fishing pressure coincided with baseflow conditions in late spring. An estimated 54% (39,685 h) of the fishing pressure during the survey occurred during that baseflow period. Also, most of the rainbow trout (63%) and brown trout (81%) that anglers reported catching over the entire survey were caught between 13 March and 18 June 1999. To put fishing pressure on the Hiwassee River into perspective, we compared the pressure it received to other tailwaters surveyed in the 1990s during similar 26-week periods. To account for large differences in surface area (at baseflow) among tailwaters, fishing pressure per week was divided by the total area actively managed for trout fishing in each tailwater, as follows: ________________________________________________________________________ Start of 26-week Total Pressure (h) per River Survey Pressure (h) Hectare per week Reference_______ Hiwassee 3/27/00 59,380 7 This study Hiwassee 3/29/87 41,415 5 Bettoli (1989) Elk 4/ 4/95 14,340 10 Bettoli & Besler (1996) Clinch 3/30/96 75,876 12 Bettoli & Bohm (1997) Watauga 3/28/98 53,444 15 Bettoli (1999) Caney Fork 3/29/97 61,853 17 Devlin & Bettoli (1999) Caney Fork 4/ 4/95 74,534 21 Bettoli & Xenakis (1996) S.F. Holston 4/ 1/97 84,119 36 Bettoli et al. (1999) _________________________________________________________________________ Significantly more anglers were counted in Area 1 than in Area 2, on both weekdays and weekends (Wilcoxon two-sample-tests; P = 0.018 and 0.001, respectively). Over all weekend days, instantaneous counts averaged 20.3 in Area 1 and 7.9 in Area 2. Fewer anglers, but the same pattern, were observed on weekdays. Few anglers were ever observed in the lower reaches of Area 2 (downstream of the Highway 411 bridge in Benton), even though that reach was stocked. The clerk observed 1,211 rainbow trout in the creel, of which 485 were microtagged. Based on the expanded creel estimates, microtagged rainbow trout stocked in January 1999 were harvested at a high rate (54%), but return rates fell for tagged trout stocked in March (22%), June (5-7%), and July (7%; Table 6). Although 5% of the rainbow trout stocked into the Quality Zone in June were harvested, all were harvested outside the Quality Zone; 7% of the rainbow trout stocked outside the Quality Zone in June were harvested. The clerk observed 84 rainbow trout that were harvested in the Quality Zone, only one of which was legal size (i.e., > 356 mm TL).
The clerk observed only 94 brown trout in the creel; 20 brown trout were harvested in the Quality Zone, although none were legal-size. Based on the expanded creel estimates, microtagged brown trout stocked into the Quality Zone were harvested at a higher rate (18%; Table 6) than brown trout stocked outside the Quality Zone (1%; P < 0.05); however, the pooled return rate for all brown trout stocked in 1999 was only 4%.
15
Anglers harvested an average of 1.15 fish per trip; most (67%) did not harvest any fish (Figure 15). Most (72%) anglers reported catching at least one trout per trip and the average number caught per trip was high (4.33 fish/angler). Seventy-eight percent of all anglers interviewed were Tennessee residents, followed by Georgia residents (13%, Figure 16). The surveyed section of the river lies entirely within the boundaries of Polk County, which is where 14% of the Tennessee residents we interviewed resided. Most of the Tennessee residents we interviewed lived in Bradley (32%), Hamilton (22%) and McMinn (17%) counties in southeast Tennessee. Most (61%) of the anglers we interviewed were fishing with artificial lures (i.e., flies, spinners, plugs, or spoons) instead of bait. Fly fishermen represented 30% of all the anglers we interviewed. Habitat Survey and Water Quality
A map was constructed using geographic information systems (GIS) software (Figures 17 and 18) and the surface area was determined for each individual habitat unit (Table 7). The pool-riffle-run-shoal ratio at baseflow was 1.2 : 0.9 : 1.0 : 1.0; however, pools and shoals accounted for 39% and 35% of the total surface area of the river, respectively. Pools and shoals averaged 400 and 275 m in length and 113 and 134 m in width, respectively. Runs represented 22% of the surface area of the tailwater, with an average length and width of 382 and 60 m, respectively. The 29 riffles averaged 63 m in both length and width and accounted for 4% of the total area. The upper section of the tailwater (above Reliance) was dominated by pools and shoals; whereas, the lower section (Reliance to Patty Bridge) was comprised mainly of pool and run habitat units. Average width of the tailwater also differed between the upper and lower sections. The mean width of the upper section was 250 m, whereas the lower section was more constricted, with an average width of 60 m. Daily maximum water temperatures and water temperature fluctuations between July and December 1999 are shown in Figures 19 and 20. Water temperatures exceeding 20 C were common in summer and fall throughout the river. Below Childres Creek (near Reliance), maximum water temperatures exceeded 22 C on most days in August and September (Figure 19). Average daily water temperatures increased 1.7 C between Apalachia Powerhouse and Childres Creek; water temperatures varied less than 1 C between Reliance and Patty Bridge from July through December 1999. The maximum temperature observed on the tailwater was 25 C at Childres Creek on 29 August 1999. Daily water temperature fluctuations were the smallest, on average, at the Powerhouse (2.3 C) and largest at Childres Creek (3.2 C). However, the largest daily fluctuations (8 C) in water temperature were observed in late October near the Powerhouse Relative to other east Tennessee tailwaters, the Hiwassee River was low in dissolved ions and very soft (Table 8). Alkalinity (as CaCO3) was only 8-12 mg/L at three sites, and conductivity ranged between 41 and 47 µS/cm.
Temperature Tolerance
Rainbow trout acclimated at 10 C did not exhibit full loss of equilibrium when immersed in water at 18 and 21 C. However, partial loss of equilibrium (perpendicular orientation to the surface) was observed at 21 C. At 24 C, trout experienced full
16
equilibrium loss after an average of 8 minutes (n = 8; SE = 1:23; Figure 21). Similarly, full loss of equilibrium was observed after 4.5 minutes (n = 8; SE = 0:16) when trout were placed into the 27 C test tank. Even though equilibrium loss (partial and full) was observed during test trials at 24 and 27 C, only trout placed into the 27 C test tank were unable to regain equilibrium. After losing equilibrium, the majority of rainbow trout tested at 24 C quickly recovered and were able to maintain equilibrium through the rest of the trial. Only one fish tested at 24 C failed to regain equilibrium after 30 seconds. Conversely, all fish tested at 27 C were unable to regain and maintain equilibrium and they were removed from the test tank after an average of 17 minutes (n = 8; SE = 2:56).
DISCUSSION Survival and Harvest
Brown trout have always exhibited better survival than rainbow trout in previously studied Tennessee tailwaters (Bettoli and Besler 1996; Bettoli and Bohm 1997; Bettoli 1999; Bettoli et al. 1999; Devlin and Bettoli 1999), and that was the case in the Hiwassee River. In terms of 200-d survival rates, brown trout survived better in the Hiwassee River (13%) then in the Elk River (2%), but brown trout survived much better in the Clinch (69%), South Fork of the Holston (56%), Watauga (46%), and Caney Fork (34%) rivers. Poor survival of tagged brown trout in the absence of substantial harvest (i.e., their return rate was only 4%) indicated that natural mortality was more important than fishing mortality in regulating survival of recently-stocked brown trout.
Rainbow trout also survived poorly in the Hiwassee River relative to other Tennessee rivers. Only in the Elk River did stocked rainbow trout survive at a lower rate over 200-d (0%) than in the Hiwassee River (3-4%). In contrast, 200-d survival rates of stocked rainbow trout ranged as high as 27% in the Watauga River, 24% in the South Fork of the Holston River, and 14% in the Caney Fork River. Low survival would be expected when return rates are high, but with the exception of fish stocked into the Hiwassee River in January 1999, return rates for all other rainbow trout cohorts were low (7 – 22%). As with brown trout, the combination of low return rates and poor survival clearly indicated that the force of natural mortality was much greater than fishing mortality in regulating the survival of recently-stocked rainbow trout. Water temperatures were often too warm for trout growth and survival in the Hiwassee River below Apalachia Dam. Maximum water temperatures consistently exceeded 21 °C daily between mid-July and mid-October, depending on the location in the tailwater. In a laboratory study, Spigarelli and Thommes (1979) reported that rainbow trout strongly avoided temperatures exceeding 21 °C and preferred a temperature of approximately 19 °C. Lethal thermal conditions for trout can arise when water temperatures exceed 23 °C (Cherry et al. 1977; Biagi and Brown 1997). These temperatures were rare at the powerhouse; however, maximum water temperatures in September regularly exceeded 23 °C at Childres Creek and Patty Bridge. Thermal stress associated with high water temperatures during late spring and summer probably

17
influenced trout survival rates during stocking. Depending on the acclimation temperature of the trout when released, a rapid change in temperature can cause a response (equilibrium loss) that increases their vulnerability to predation and other sources of mortality. Drought conditions in southeast Tennessee during the spring of 1999 resulted in extended periods of minimum flows and high water temperatures on the Hiwassee River below Apalachia Dam. In fact, water discharges through Apalachia Dam in 1999 were the lowest in 10 years (Figure 22). Coincident with the low flows and high temperatures were heavy fishing pressure and high catches of trout. Although most (70 – 80%) of the rainbow trout and brown trout reportedly caught during late spring and summer 1999 were released, hooking mortality may have been a factor in the poor survival that was observed during this study. In several studies, water temperature was a significant predictor of post-release mortality of trout (Dotson 1982; Schisler and Bergersen 1996), although Taylor and White (1992) did not detect such an effect in a meta-analysis of hooking mortality. Heavy fishing pressure and high catch rates during a time when water temperatures were high could have reduced the survival of trout stocked before and during base flow conditions. Predation by striped bass Morone saxatillis and walleye Stizostedion vitreum may have influenced trout survival in the Hiwassee River. Striped bass in the Caney Fork River below Center Hill Dam, Tennessee, readily preyed on recently-stocked rainbow trout (Devlin and Bettoli 1999). Similarly, walleye are known to prey on stocked rainbow trout in tributary reservoirs in Tennessee (C. Vandergoot, Tennessee Technological University, personal communication). Striped bass and walleye were routinely encountered, albeit in small numbers, during the electrofishing samples; however, the numbers of trout lost to predation could not be quantified because the size of the predator populations was unknown. If predation was a factor, it would probably be most severe in the lower reaches of the tailwater (below Reliance), where the majority of these predators were observed. Growth and Condition With the exception of some rainbow trout that were stocked in July, all trout stocked into the Hiwassee River grew slowly when compared those in other Tennessee tailwaters. Initially, brown trout growth on the Hiwassee River (8 mm/month) was comparable to growth on the Elk (6 mm/month), Watauga (6 mm/month), Caney Fork (8 mm/month), Clinch (11 mm/month), and South Fork of the Holston (11 mm/month) Rivers (Bettoli and Besler 1996; Bettoli et al. 1999; Devlin and Bettoli 1999). However, brown trout ceased growing on the Hiwassee River after about 100 days and, unlike in other tailwaters, weight gain was insignificant throughout the study. Two brown trout stocked as catchables in 1995 by the Tennessee Valley Authority were collected in 1999 and averaged only 401 mm TL. In comparison, brown trout stocked in the Caney Fork and Clinch Rivers reached total lengths of 325-350 mm in only one year (Bettoli and Bohm 1997; Devlin and Bettoli 1999). In the Caney Fork River, brown trout averaged 484 mm TL only 26 months post-stocking (Devlin and Bettoli 1999). The January cohort of rainbow trout was the only group of trout that exhibited significant growth throughout the study, although it was slow (5mm/month). Although growth was significant for fish stocked in July, the growth rates were influenced by a few (n = 4) large individuals collected directly below the powerhouse. Those fish preyed on clupeids that were entrained at Apalachia Dam during generation. Utilizing this forage

18
base, some July rainbow trout exhibited excellent growth that was uncharacteristic of trout growth elsewhere in the river. If released elsewhere in the tailwater, that group of rainbow trout would likely have grown slowly. Excluding those large fish from analysis resulted in no growth in length and significant weight loss for trout stocked in July. In contrast, rainbow trout routinely display good or even excellent growth rates of up to 20 mm/month in other Tennessee tailwaters such as the Clinch River or South Fork of the Holston River (Bettoli and Bohn 1997; Bettoli et al. 1999). Similarly, rainbow trout in tailwaters around the country such as Flaming Gorge, UT (15 mm/month; Johnson et al. 1982); Missouri River, MT (7 mm/month; Kathrein 1950); Bighorn River (15 mm/month; Stevenson 1975); and White River, AK (20 mm/month; Aggus et al. 1979) grew at a faster rate than rainbow trout in the Hiwassee River. The condition of stocked rainbow trout and brown trout in the Hiwassee River declined over time. This trend of declining condition of stocked trout is well documented (Reimers 1963; Ersbak and Haase 1983; Bachman 1984) and has been observed in other Tennessee tailwaters (e.g., Bettoli and Besler 1996; Devlin and Bettoli 1999). Hatchery fish, which are typically more robust and have a higher basal metabolic rate than wild or holdover trout, have difficulty satisfying their bioenergetic demands (Ersbak and Hasse 1983). There are several factors that determine the success of stocked trout and their ability to thrive in a new environment. They include behavioral adaptations, competition for food, food availability, habitat limitations, and water quality. Hatchery trout typically adapt quickly to natural prey items (Lord 1934; Raney and Lachner 1942; Ersbak and Haase 1983); however, they can be inflexible to seasonal changes in forage. For instance, resident brown trout in a Pennsylvania stream utilized expanding populations of Brachycentridae and Limnephilidae larvae (caddisflies), but stocked brook trout continued to utilize a diminishing population of Glossosomatidae (caddisfly) larvae (Ersbak and Haase 1983). The brook trout were apparently unable to recognize the new prey items and their condition suffered as a result. This delayed reaction to new and plentiful prey items creates a disadvantage for stocked trout when competing for food. In other rivers, hatchery trout moved more frequently than wild or naturalized trout (Bettinger and Bettoli 2000) and were less energy-efficient when feeding and competing for habitat (Bachman 1984). A depauperate prey base caused by fluctuating flows can result in poor fish growth and condition (Brusven 1984; Odenkirk and Estes 1991;Weisburg and Burton 1993). The macroinvertebrate community in the Hiwassee River suffered in the spring of 1999 when much of the wetted area of the tailwater was dewatered for long periods of time. The pulsing of water during that time flooded the area directly below the powerhouse; however, areas downstream (> 3 km) remained dewatered. Limited food availability may have been one reason why growth and condition of trout on the Hiwassee River was so poor. When sufficient prey (i.e., clupeids) were available below the powerhouse in the fall of 1999, some rainbow trout took advantage of the abundant forage and gained substantial weight. Further research on the effects of water fluctuation as it relates to the macroinvertebrate community and the growth and condition of trout in the Hiwassee River would be valuable.
19
Habitat and Water Quality The habitat in the upper reach of the Hiwassee River was considerably different compared to other Tennessee tailwaters (Bettoli 1999; Bettoli et al. 1999; Devlin and Bettoli 1999). Riffles were the predominant habitat in the South Fork of the Holston and Watauga rivers and cobble and gravel were observed throughout each tailwater. In the Caney Fork River, pools accounted for 90% of the surface area and riffles and runs were sparse (6% and 4%, respectively). Similarly, riffles were scarce on the Hiwassee River, accounting for less than 5% of the surface area. Bedrock was the predominant substrate on the Hiwassee River above Reliance, and the inverted bedrock in that section created shoal habitats. Within each shoal, there were numerous pool, riffle, and run microhabitats, and the majority of trout collected in this study were located in and around shoal habitats above Reliance. It appears that trout were using these shoals as resting and feeding areas during periods of high flow. The habitat in the lower reach of the Hiwassee River below Reliance was more typical of habitat found in some other Tennessee tailwaters. Bedrock was less abundant and boulders and large woody debris were present. However, few trout were collected in the lower reaches and other environmental factors such as temperature were probably limiting trout abundance in the lower reaches on the Hiwassee River.
Alkalinity levels are used to predict biological productivity of trout streams in other locales (Scarnecchia and Bergersen 1987; Clarke and Scruton 1999). Based on its low (≤ 12mg/L) alkalinity, the Hiwassee River was regarded as an infertile system (Banks and Bettoli 2000). The low productivity of the Hiwassee River was considered a major factor contributing to the poor growth, condition, and survival of stocked trout.
Elevated water temperatures have been a chronic problem limiting trout productivity in the Hiwassee River. Scott et al. (1996) observed that fish diversity (43 species) and fish species composition present in the Hiwassee River in 1993 was typical of warmwater streams in Tennessee. In contrast, other east Tennessee tailwaters (Clinch, Watauga, and South Fork of the Holston rivers) supported coldwater fish communities dominated by trout, with fewer (15-25) species (Scott et al. 1996; Habera et al. 1999, 2000). Although we did not collect or quantify non-trout species during our electrofishing samples, we noted that trout were outnumbered by other species, particularly in the reach below Reliance. As most of the species identified by Scott et al. (1996) were insectivorous or omnivorous (as are trout), interspecific competition for food resources may be intense in the Hiwassee River relative to other Tennessee tailwaters, which are usually dominated by trout. Standing Crops The two estimates of population size and standing crop of holdover trout in the Hiwassee River were low when compared to those of other Tennessee tailwaters (Bettoli 1999; Devlin and Bettoli 1999). The infertile waters of the Hiwassee River may be an important reason why estimates of population size and biomass were consistently low. Kwak and Waters (1997) reported that salmonid production was positive ly correlated with alkalinity in Minnesota streams. In Tennessee, high standing crops of holdover trout

20
(112 - 232 kg/hectare) accompanied high alkalinity values (≥100mg/L) in the Clinch and South Fork of the Holston rivers. Natural reproduction did not contribute to trout standing crops in the Hiwassee River. The failure of brown trout and rainbow trout to reproduce in the Hiwassee River was due, in part, to the lack of appropriate habitat and substrate (Banks and Bettoli 2000). Although potential spawning areas were located at Childres Creek, high flows during the spawning season probably prevented any reproduction in that area. Two wild age-0 rainbow trout were collected during the summer of 1999; however, we concluded these fish were the product of reproduction which occurred in tributaries of the Hiwassee River. Even if appropriate substrates and water flows were present in the main river channel, few large adults were present in the system, and their reproductive fitness was low. In fact, brown trout fecundity in the Hiwassee River was substantially lower than in three other east Tennessee tailwaters (Banks and Bettoli 2000). Fall stockings may remedy the poor survival and carry-over of rainbow trout in the Hiwassee River. Stocking rainbow trout in December 1997 resulted in a five-fold increase in the overwintering population of rainbow trout in the Caney Fork River (Devlin and Bettoli 1999). Summer-stocked rainbow trout in Convict Creek, California, suffered high mortality rates in the winter due to poor condition (Reimers 1963); however, robust fall-stocked trout were able to survive the winter and made a valuable contribution to the fishery the following spring.
21
CONCLUSIONS Growth and survival of brown trout and rainbow trout in the Hiwassee River were poor when compared to other tailwater systems. Factors that directly influenced trout growth and survival were high water temperatures and low water fertility; high rates of predation and hooking mortality may also have contributed to poor survival. As a result of these factors, the density and standing crop of holdover trout in the Hiwassee River were extremely low. The drought conditions present in the Hiwassee River in 1999 undoubtedly contributed to the low standing crop of trout carrying over into January 2000. However, the standing crop of trout measured in January 1999, which reflected environmental conditions the previous year, was also very low, despite the fact that 1998 was a more typical year in terms of rainfall and discharge (Figure 22). The tailwater trout fishery in the Hiwassee River is sensitive to the amount of water discharged each summer because the water discharged from Hiwassee Dam (which then travels through Apalachia Dam) is warm. Even in average rainfall years (e.g., 1998), the water discharged from Hiwassee Dam will routinely exceed 18°C in late summer (TVA, unpublished data). On a typical summer day, that water warms as it passes through Apalachia Reservoir, the sluiceway, and the river below the powerhouse. In contrast, water discharged during summer at TVA facilities on other rivers managed for trout is much cooler (9°C below Norris Dam, 12°C below the South Fork of the Holston Dam, 9°C below Wilbur Dam on the Watauga River). In wet years, water temperatures in the Hiwassee River may not be an acute problem; in average or dry years, elevated water temperatures will strongly and negatively influence trout growth and survival. Additional studies are required to determine whether enough cold water can be stored in Hiwassee Reservoir to support healthy and robust trout populations in the Apalachia tailwater each summer and fall, given the current schedule of water releases.
We characterized trout growth and survival during a drought year; additional research on water temperatures and the fate of trout in this river during average or above-average rainfall years would be useful. In the interim, the following management actions should be considered:
1. Eliminate all stockings at and below Highway 411 because of high water
temperatures, poor habitat, and low fishing pressure. Eliminate or severely reduce the number of trout stocked in late summer (August – September), and initiate winter stockings earlier (November or December).
2. When drought conditions are present, avoid stocking trout during extended
periods of baseflow that can occur in spring months, when upstream reservoirs are being brought up to summer pool.
3. The Hiwassee River is unproductive and the amount of fishing pressure it
receives is probably not high enough to warrant the stocking of nearly 120,000 catchable trout per year. A lower stocking rate should promote better growth and better rates of return to the creel. Stocking fewer fish would also be appropriate if stockings are limited to the upstream reaches of the tailwater.

22
REFERENCES Aggus, L.R., D.I. Morias, and R.F. Baker. 1979. Evaluation of the trout fishery in the
tailwater of bull shoals reservoir, Arkansas, 1971-1973. Proceedings of the Southeastern Association of Fish and Wildlife Agencies 31:565-573.
Anderson, R.O., McKinley, R.S., and M. Colavecchia. 1997. The use of clove oil as an
anesthetic for rainbow trout and its effects on swimming performance. North American Journal of Fisheries Management 17:301-307.
ARC/INFO. 1995. Environmental Systems Research Institute, Inc. Redlands, California
USA. ArcView. 1995. Environmental Systems Research Institute, Inc. Redlands, California
USA. Axon, J.R. 1974. Review of coldwater fish management in tailwaters. Proceedings of the
Southeastern Association of Fish and Wildlife Agencies 28:351-355. Bain, M.B., Finn, J.T., and H.E. Booke. 1988. Streamflow regulation and fish community
structure. Ecology 69(2):382-392. Bachman, R.A. 1984. Foraging behavior of free-ranging wild and hatchery brown trout in
a stream. Transactions of the American Fisheries Society 113:1-32. Banks, S.M., and P.W Bettoli. 2000. Reproductive potential of brown trout in Tennessee
tailwaters. Fisheries report 00-19, Tennessee Wildlife Resources Agency, Nashville, Tennessee.
Bettoli, P.W. 1989. Survey of the recreational fisheries in the Caney Fork, Elk, and
Hiwassee Rivers. Final Report. Tennessee Wildlife Resources Agency, Nashville, Tennessee.
Bettoli, P.W. 1999. Creel survey and population dynamics of salmonids stocked into the
Watauga River below Wilbur Dam. Fisheries Report No. 99-41. Tennessee Wildlife Resources Agency, Nashville, Tennessee.
Bettoli, P.W., and D.A. Besler. 1996. An investigation of the trout fishe ry in the Elk
River below Tims Ford Dam. Fisheries Report No. 96-22. Tennessee Wildlife Resources Agency, Nashville, Tennessee.
Bettoli, P.W., and L. Bohm. 1997. Clinch River trout investigations and creel survey.
Fisheries Report No. 97-39. Tennessee Wildlife Resources Agency, Nashville, Tennessee.

23
Bettoli, P.W., Owens, S.J., and M. Nemeth. 1999. Trout habitat, reproduction, survival, and growth in the South Fork of the Holston River. Fisheries Report No. 99-3. Tennessee Wildlife Resources Agency, Nashville, Tennessee.
Bettoli, P.W., and S. Xenakis. 1996. An investigation of the trout fishery in the Caney
Fork River below Center Hill Dam. Fisheries Report No. 96-23, Tennessee Wildlife Resources Agency, Nashville, Tennessee.
Bettinger, J.M., and P.W. Bettoli. 2000. Movements and activity of rainbow trout and
brown trout in the Clinch River, Tennessee, as determined by radio-telemetry. Fisheries Report No. 00-14, Tennessee Wildlife Resources Agency, Nashville, Tennessee.
Biagi, J., and R.P. Brown. 1997. Upper temperature tolerance of juvenile and adult brown
and rainbow trout tested under flowing conditions. Final report. Georgia Department of Natural Resources, Wildlife Resources Division, Fisheries Management Section.
Blanz, R.E., Hoffman, C.E., Kilambi, R.V., and C.R. Liston. 1969. Benthic
macroinvertebrates in cold tailwaters and natural streams in the state of Arkansas. Proceedings of the Southeastern Association of Fish and Wildlife Agencies 281-292.
Boles, H.D. 1969. Little Tennessee River investigation. Proceedings of the Southeastern
Association of Fish and Wildlife Agencies 22(1968):321-338. Brett, J.R. 1956. Some principles in the thermal requirements of fishes. The Quarterly
Review of Biology 31(2):75-87. Brusven, M.A. 1984. The distribution and abundance of benthic insects subjected to
reservoir-release flows in the Clearwater River, Idaho, USA. Pages 167-180 in Lillehammer, A. and S.J. Saltveit, editors. Regulated Rivers, Universitetsforlaget AS, Norway.
Cherry, D.S., K.L. Dickson, J. Carns, Jr., and J.R. Stuaffer. 1977. Preferred, avoided, and
lethal temperatures of fish during rising temperature conditions. Journal of the Fisheries Research Board of Canada 34:239-246.
Clarke, K.D., and D.A. Scruton. 1999. Brook trout production in the streams of a low
fertility Newfoundland watershed. Transactions of the American Fisheries Society 128:1222-1229.
Cushman, R.M. 1985. Review of ecological effects of rapidly varying flows downstream
from hydroelectric facilities. North American Journal of Fisheries Management 5:330-339.

24
Devlin, G.J., and P.W. Bettoli. 1999. Creel survey and population dynamics of salmonids stocked into the Caney Fork River below Center Hill Dam. Final Report No. 99-8. Tennessee Wildlife Resources Agency, Nashville, Tennessee.
Dotson, T. 1982. Mortalities in trout by gear type and angler- induced stress. North
American Journal of Fisheries Management 2:60-65. Elliott, J.M. 1975a. The growth rate of brown trout (Salmo trutta L.) fed on maximum
rations. Journal of Animal Ecology 44:805-821. Ersbak, K., and B.L Haase. 1983. Nutritional deprivation after stocking as a possible
mechanism leading to mortality in stream-stocked brook trout. North American Journal of Fisheries Management. 3:142-151.
Grizzle, J.M. 1981. Effects of hypolimnetic discharge on fish health below a reservoir.
Transactions of the American Fisheries Society 110:29-43. Habera, J.W., R.D. Bivens, B.D.Carter, and C.E. Williams. 1999. Region IV Trout
Fisheries Report-1998. Fisheries Report 99-4, Tennessee Wildlife Resourced Agency, Nashville.
Habera, J.W., R.D. Bivens, B.D.Carter, and C.E. Williams. 2000. Region IV Trout
Fisheries Report-1998. Fisheries Report 00-9, Tennessee Wildlife Resourced Agency, Nashville.
Jensen, J.W., and T. Berg. 1993. Food rations and rate of gastric evacuation in brown trout fed pellets. The Progressive Fish-Culturist 55:244-249. Jensen, J.W., and T. Berg. 1995. The annual growth cycle of brown trout. The
Progressive Fish-Culturist 57:231-237. Johnson, J.E., R.P. Kramer, E. Larson, and B.L. Bonebrake. 1982. Trout growth, harvest,
survival, and macrohabitat selection in the Green River, Utah, 1978-1987. Final Report, Flaming Gorge Tailwater Fisheries Investigations. Publication Number 87-13, Utah Division of Wildlife Resources, Salt Lake City.
Kathrein, J.W. 1950. Growth rate of four species of fish in a section of the Missouri River
between Holtes Dam and Cascade, Montana. Transactions of the American Fisheries Society 80:93-98.
Kwak, T.J., and T.F. Waters. 1997. Trout production dynamics and water quality in
Minnesota streams. Transactions of the American Fisheries Society 126: 35-48. Layzer, J.B., T.J. Nehus, W. Pennington, J.A. Gore, and J.M. Nestler. 1989. Seasonal
variation in the composition of the drift below a peaking hydroelectric project. Regulated Rivers: Research and Management 3:29-34.

25
Lord, R.F. 1934. Hatchery trout as foragers and game fish. Transactions of the American
Fisheries Society 64:339-345. McGary, J.L., and G.L. Harp. 1972. The benthic macroinvertebrate community of the
Greer’s Ferry Reservoir cold tailwater, Little Red River, Arkansas. Proceedings of the Southeastern Association of Fish and Wildlife Agencies 33:490-500.
Neel, J.K. 1963. Limnology of North America. (Ed. By D.G. Frey), pp. 575-595.
University of Wisconsin Press, Madison, Wisconsin. Odenkirk, J.S., and R.D. Estes. 1991. Food habits of rainbow trout in a Tennessee
tailwater. Proceedings of the Southeastern Association of Fish and Wildlife Agencies 45:451-459.
Parsons, J.W. 1955. The trout fishery of the tailwater below Dale Hollow Reservoir.
Transactions of the American Fishery Society 85:75-92. Paulik, G.J., and D.S. Robson. 1969. Statistical calculations for change- in-ratio estimators
of population parameters. Journal of Wildlife Management 33(1):1-27. Pawson, M.G. 1991. Comparison of the performance of brown trout, Salmo trutta L., and
rainbow trout, Oncorhynchus mykiss (Walbaum), in a put-and-take fishery. Aquaculture and Fisheries Management 22:247-257.
Pert, E.J., and D.C. Erman. 1994. Habitat use by adult rainbow trout under moderate
artificial fluctuations in flow. Transactions of the American Fisheries Society 123:913-923.
Pollock, K.H., J.M. Hoenig, C.M. Jones, D.S. Robson, and C.J. Greene. 1997. Catch rate
estimation for roving and access point surveys. North American Journal of Fisheries Management 17:11-19.
Radford, D.S., and R. Hartland-Rowe. 1971. A preliminary investigation of the bottom
fauna and invertebrate drift in an unregulated and regulated stream in Alberta. Journal of Applied Ecology 8:883-903.
Raney, E.C., and E.A. Lachner. 1942. Autumn food of recent planted young brown trout
in small streams of central Ney York. Transactions of the American Fisheries Society 71:106-111.
Reimers, N. 1963. Body condition, water temperature and over-winter survival of
hatchery-reared trout in Convict Creek, California. Transactions of the American Fisheries Society 92:39-46.
SAS Institute. 1882. SAS users guide: Statistics. Cary, North Carolina.
26
Scarnecchia, D.L., and E.P Bergersen. 1987. Trout production and standing crop in
Colorado’s small streams, as related to environmental features. North American Journal of Fisheries Management 7:315-330.
Scott, Jr. E.M., Gardner, K.D., Baxter, D.S., and B.L. Yeager. 1996. Biological and water
quality response in tributary tailwaters to dissolved oxygen and minimum flow improvements, implementation of the reservoir releases improvements program / lake improvement plan. Water Management Services. Tennessee Valley Authority, Norris, TN.
Schisler, G.J., and E.P. Bergersen. 1996. Postrelease hooking mortality of rainbow trout
caught of scented artificial baits. North American Journal of Fisheries Management 16:570-578.
Shirvell, C.S., and R.G. Dungey. 1983. Microhabitats chosen by brown trout for feeding
and spawning rivers. Transactions of the American Fisheries Society 112:312-316. Spirarelli, S.A., and M.M. Thommes. 1979. Temperature selected and estimated thermal
acclimation by rainbow trout (Salmo gairdneri) in a thermal plume. Journal of the Fisheries Board of Canada 36:366-376.
Stevenson, H. 1975. The trout fishery of the Bighorn River below Yellowtail Dam,
Montana. M.S. Thesis, Montana State University, Bozeman. 67pp. Taylor, M.J., and K.R. White. 1992. A meta-analysis of hooking mortality of
nonanadromous trout. North American Journal of Fisheries Management 12:760-767.
Tippets, W.E., and P.B. Moyle. 1978. Epibenthic feeding by rainbow trout Salmo
gairdneri in the McCloud River, California. Journal of Animal Ecology 47:549-559.
Trotzky, H.M., and R.W. Gregory. 1974. The effects of water flow manipulation below a
hydroelectric power dam on the bottom fauna of the upper Kennebec River, Maine. Transactions of the American Fisheries Society 126:985-998.
Weiland M.A., and R.S. Hayward. 1997. Cause for the decline of large rainbow trout in a
tailwater fishery: Too much putting or too much taking? Transactions of the American Fisheries Society 126:103-109.
Weisburg, S.B., and W.H. Burton. 1993. Enhancement of fish feeding and growth after an
increase in minimum flow below the Conowingo Dam. North American Journal of Fisheries Management 13:103-109.

27
Williams, G.G. 1997. Response of holdover resident brown (Salmo trutta) and rainbow trout (Onchorynchus mykiss) during changing thermal conditions of Summer in the Hiwassee River, Polk County, TN. Cooperative Project Report. Tennessee Valley Authority Water Management Clean Water Initiative, Norris, TN.
28
Table 1. Stocking date, number of fish, total weight and mean lengths of brown trout and rainbow trout stocked into the Hiwassee River during 1999. Species
Date
Strain1
Number Stocked
Total Weight (kg)
Mean Length (mm)
Rainbow Trout 01/14/99 EED 4,290 567 227
01/19/99 EED 3,833 550 234
01/27/99 EED 11,092 1,544 231
03/15/99 EED 9,975 1,570 241
03/17/99 ARD, EED 3,885 547 233
03/22/99 EED 3,736 550 236
04/01/99 ARD 900 136 238
04/07/99 ARD 2,991 477 245
06/01/99 ARD 9,947 1,564 241
06/02/99 ARD 2,153 340 241
06/08/99 ARD 2,507 440 250
06/29/99 ARD 3,425 569 245
06/30/99 ARD 3,626 554 239
07/01/99 ARD 3,684 548 237
07/06/99 ARD 6,565 1,031 241
07/07/99 ARD, FLD 3,552 544 233
07/08/99 FLD 4,181 553 227
07/12/99 ARD, FLD 3,410 555 241
07/13/99 ARD 3,476 544 239
07/14/99 ARD 3,687 545 236
07/19/99 ARD 3,620 558 239
07/20/99 ARD 2,703 409 238
07/22/99 ARD 2,757 381 231
Total 99,995 15,082
Brown Trout 03/31/99 PRD 14,502 1,343 204
04/01/99 PRD 3,368 286 196
Total 17,870 1,630
1 Strain ARD = Arlee, EED = Erwin Arlee Backcross, FLD = Fish Lake Desmet, and PRD = Plymouth Rock Domestic.

Table 2. Number and size of brown trout and rainbow trout tagged and stocked into the Hiwassee River below Apalachia Powerhouse in 1999. Mean total length (TL, mm), mean weight (WT, g), and standard deviation (in parenthesis) were calculated using a subsample of approximately 20% of the total number tagged. Species
Cohort
Tag location
TL
WT
Number Tagged
Tag Retention (%)
Number Stocked
Date Stocked
Rainbow January Dorsal 206 (25) 96 (32) 11,136 100 11,136 27 Jan Rainbow March Caudal 243 (29) 157 (46) 11,137 97 10,803 16-17 Mar Rainbow June Left Pectoral 247 (18) 145 (33) 12,071 97 11,709 1-2 June Rainbow June Anal 1 246 (16) 144 (29) 2,714 100 2,714 8 June Rainbow July Snout 246 (22) 153 (37) 14,478 95 13,754 6-9 July Brown March Dorsal 192 (15) 82 (30) 14,384 98 14,096 31 Mar Brown March Caudal 1 196 (15) 88 (20) 2,719 95 2,583 31 Mar
1 Trout stocked only into the quality zone of the Hiwassee River tailwater.
29

Table 3. Number of trout in each microtagged cohort collected on the Hiwassee River during 1999.
Tag Location
Date Stocked
3-Feb
2-Mar
7-June
25-June
14-July
12-Aug
9-Sept
7-Oct
10-Nov
9-Dec
Total
Rainbow Trout
Dorsal 27-Jan 19 29 5 3 2 0 0 0 0 0 58
Caudal 16-Mar - - 2 3 5 1 0 0 0 0 11
Anal 1 8-June - - - 4 2 2 1 1 0 0 10
L. Pectoral 1-June - - 16 5 5 0 0 0 0 0 26
Snout 6-July - - - - 22 14 1 4 1 1 43
Brown Trout
Dorsal 31-Mar - - 25 25 12 8 11 5 2 4 92
Caudal 1 31-Mar - - 19 16 6 4 6 3 4 2 60
1 Stocked in Quality Zone
30
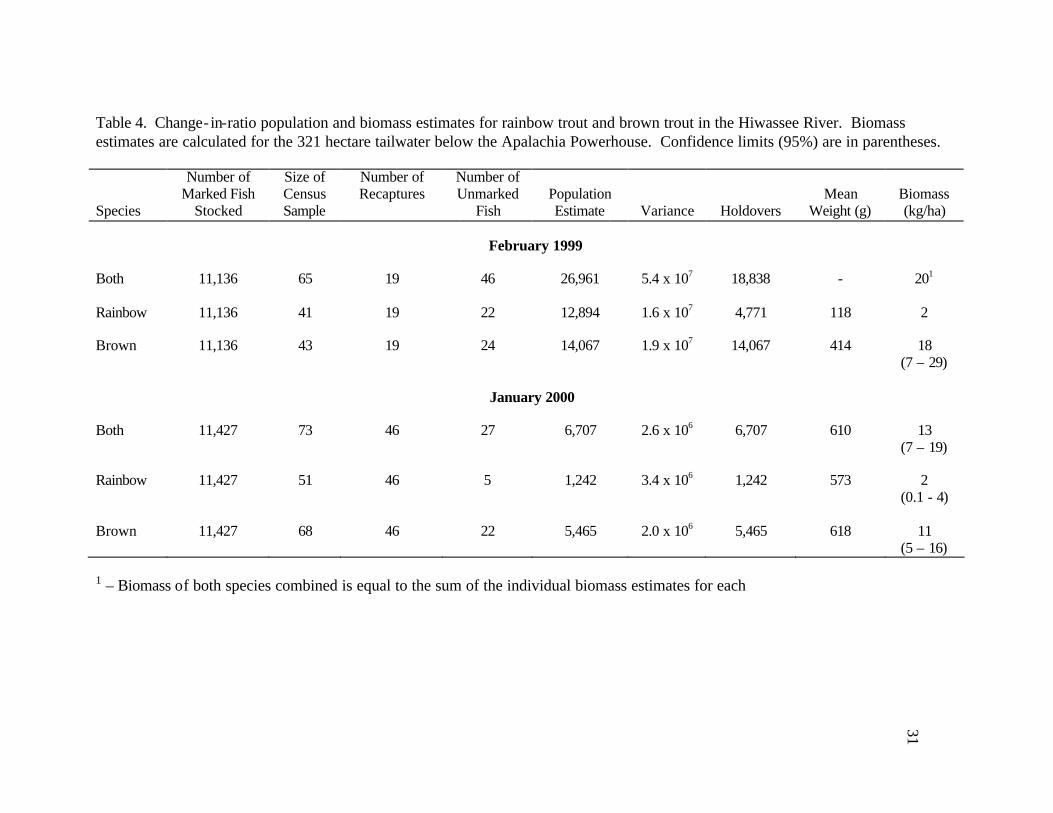
Table 4. Change- in-ratio population and biomass estimates for rainbow trout and brown trout in the Hiwassee River. Biomass estimates are calculated for the 321 hectare tailwater below the Apalachia Powerhouse. Confidence limits (95%) are in parentheses. Species
Number of Marked Fish
Stocked
Size of Census Sample
Number of Recaptures
Number of Unmarked
Fish
Population Estimate
Variance
Holdovers
Mean
Weight (g)
Biomass (kg/ha)
February 1999 Both 11,136 65 19 46 26,961 5.4 x 10⁷ 18,838 - 201 Rainbow 11,136 41 19 22 12,894 1.6 x 10⁷ 4,771 118 2 Brown 11,136 43 19 24 14,067 1.9 x 10⁷ 14,067 414 18
(7 – 29) January 2000 Both 11,427 73 46 27 6,707 2.6 x 10⁶ 6,707 610 13
(7 – 19) Rainbow 11,427 51 46 5 1,242 3.4 x 10⁶ 1,242 573 2
(0.1 - 4) Brown 11,427 68 46 22 5,465 2.0 x 10⁶ 5,465 618 11
(5 – 16)
1 – Biomass of both species combined is equal to the sum of the individual biomass estimates for each
31
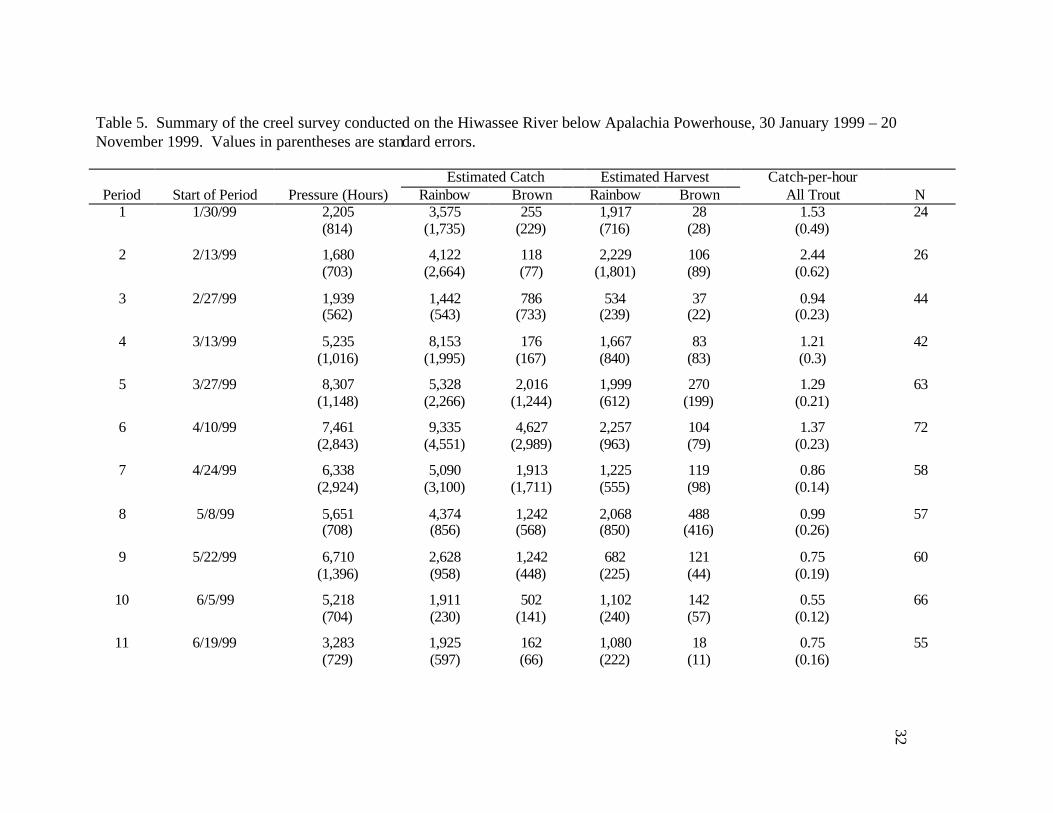
Table 5. Summary of the creel survey conducted on the Hiwassee River below Apalachia Powerhouse, 30 January 1999 – 20 November 1999. Values in parentheses are standard errors.
Estimated Catch Estimated Harvest Catch-per-hour Period Start of Period Pressure (Hours) Rainbow Brown Rainbow Brown All Trout N
1 1/30/99 2,205 (814)
3,575 (1,735)
255 (229)
1,917 (716)
28 (28)
1.53 (0.49)
24
2 2/13/99 1,680 (703)
4,122 (2,664)
118 (77)
2,229 (1,801)
106 (89)
2.44 (0.62)
26
3 2/27/99 1,939 (562)
1,442 (543)
786 (733)
534 (239)
37 (22)
0.94 (0.23)
44
4 3/13/99 5,235 (1,016)
8,153 (1,995)
176 (167)
1,667 (840)
83 (83)
1.21 (0.3)
42
5 3/27/99 8,307 (1,148)
5,328 (2,266)
2,016 (1,244)
1,999 (612)
270 (199)
1.29 (0.21)
63
6 4/10/99 7,461 (2,843)
9,335 (4,551)
4,627 (2,989)
2,257 (963)
104 (79)
1.37 (0.23)
72
7 4/24/99 6,338 (2,924)
5,090 (3,100)
1,913 (1,711)
1,225 (555)
119 (98)
0.86 (0.14)
58
8 5/8/99 5,651 (708)
4,374 (856)
1,242 (568)
2,068 (850)
488 (416)
0.99 (0.26)
57
9 5/22/99 6,710 (1,396)
2,628 (958)
1,242 (448)
682 (225)
121 (44)
0.75 (0.19)
60
10 6/5/99 5,218 (704)
1,911 (230)
502 (141)
1,102 (240)
142 (57)
0.55 (0.12)
66
11 6/19/99 3,283 (729)
1,925 (597)
162 (66)
1,080 (222)
18 (11)
0.75 (0.16)
55
32

Table 5. (Continued)
Estimated Catch Estimated Harvest Catch-per-hour Period Start of Period Pressure (Hours) Rainbow Brown Rainbow Brown All Trout N
12 7/3/99 3,435 (1,259)
1,849 (659)
183 (55)
1,407 (693)
43 (38)
0.59 (0.09)
61
13 7/17/99 3,417 (757)
2,455 (603)
322 (141)
1,539 (481)
0 0.96 (0.16)
63
14 7/31/99 2,214 (525)
1,341 (704)
149 (51)
321 (124)
29 (17)
0.85 (0.16)
53
15 8/14/99 3,162 (915)
2,036 (784)
121 (67)
793 (242)
32 (28)
0.54 (0.11)
66
16 8/28/99 2,549 (578)
1,171 (538)
273 (139)
454 (198)
0 0.63 (0.12)
48
17 9/11/99 1,635 (387)
361 (178)
62 (47)
44 (31)
0 0.38 (0.16)
27
18 9/25/99 1,366 (471)
730 (223)
202 (171)
299 (124)
11 (11)
0.78 (0.15)
28
19 10/9/99 342 (128)
213 (127)
28 (28)
66 (66)
0 0.93 (0.29)
12
20 10/23/99 978 (450)
343 (229)
13 (10)
145 (120)
0 0.33 (0.11)
26
21 11/6/99 717 (250)
335 (199)
61 (41)
0 0 0.6 (0.27)
15
TOTALS 73,842 (5,156)
58,717 (7,454)
14,453 (3,215)
21,828 (2,413)
1,631 (439)
0.9 (0.05)
966
33
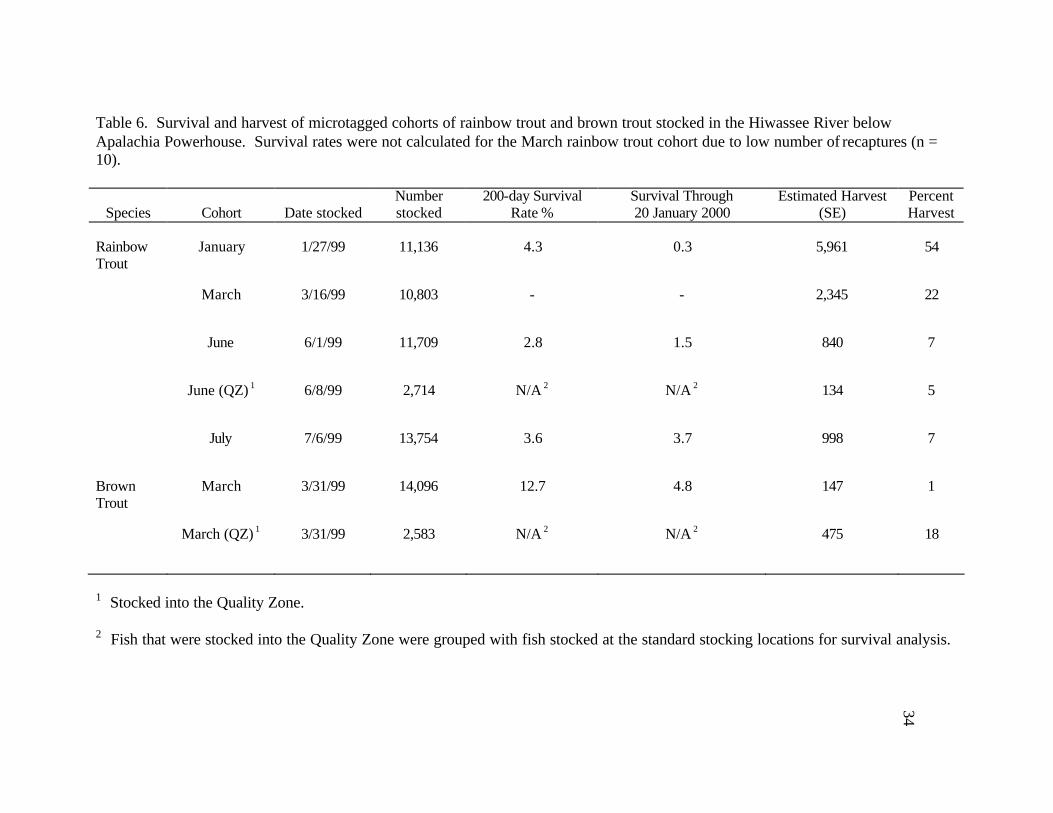
Table 6. Survival and harvest of microtagged cohorts of rainbow trout and brown trout stocked in the Hiwassee River below Apalachia Powerhouse. Survival rates were not calculated for the March rainbow trout cohort due to low number of recaptures (n = 10).
Species
Cohort
Date stocked
Number stocked
200-day Survival Rate %
Survival Through 20 January 2000
Estimated Harvest (SE)
Percent Harvest
Rainbow Trout
January 1/27/99 11,136 4.3 0.3 5,961
54
March 3/16/99 10,803 - - 2,345
22
June 6/1/99 11,709 2.8 1.5 840
7
June (QZ) 1 6/8/99 2,714 N/A 2 N/A 2 134 5
July 7/6/99 13,754 3.6 3.7 998
7
Brown Trout
March 3/31/99 14,096 12.7 4.8 147 1
March (QZ) 1 3/31/99 2,583 N/A 2 N/A 2 475 18
1 Stocked into the Quality Zone. 2 Fish that were stocked into the Quality Zone were grouped with fish stocked at the standard stocking locations for survival analysis.
34

35
Table 7. Total area of habitat units on the Hiwassee River, Tennessee. ID represents the sequential order of habitat units beginning at Apalachia Powerhouse. Areas were calculated using Geographical Information Systems software. Unit Type
ID
Area (km2)
Unit Type
ID
Area (km2)
Unit Type
ID
Area (km2)
Unit Type
ID
Area (km2)
Riffle 1 0.0157 Run 3 0.0500 Pool 5 0.0625 Shoal 2 0.0140 4 0.0010 27* 0.0059 7 0.0077 6 0.0408 9 0.0083 29* 0.0020 10 0.0429 8 0.0185 26* 0.0005 34* 0.0079 12 0.0099 11 0.0155 28* 0.0012 41* 0.0022 14 0.0096 13 0.0094 35* 0.0041 44* 0.0064 16 0.0151 15 0.1166 43* 0.0023 47* 0.0036 17* 0.0550 18* 0.1968 48* 0.0021 49* 0.0079 19* 0.0291 20* 0.0137 63 0.0013 52 0.0077 21* 0.0130 22* 0.0344 65 0.0127 54 0.0258 23* 0.0276 24* 0.0426 68 0.0112 57 0.0371 25* 0.0787 30* 0.0314 71 0.0153 66 0.0212 31* 0.0321 32* 0.0292 74 0.0051 69 0.0110 33* 0.1939 36* 0.0366 81 0.0011 72 0.0085 37* 0.0078 38* 0.0032 83 0.0024 79 0.0160 46* 0.0701 39* 0.0022 88 0.0090 80 0.0032 50* 0.0131 40* 0.0642 90 0.0138 84 0.0141 53 0.0119 42* 0.0255 94 0.0064 91 0.0168 55 0.0082 45* 0.0052 96 0.0013 93 0.0067 58 0.0119 51 0.0471 99 0.0037 95 0.0107 60 0.0120 56 0.0626 103 0.0021 97 0.0088 62 0.0160 59 0.0053 109 0.0021 101 0.0667 73 0.0058 61 0.1604 111 0.0045 104 0.0170 75 0.0154 64 0.0390 112 0.0020 106 0.0122 77 0.0398 67 0.0315 114 0.0005 108 0.0275 82 0.0635 70 0.0045 116 0.0009 110 0.0306 87 0.0585 76 0.0141 119 0.0002 113 0.0013 89 0.0490 78 0.0041 115 0.0409 92 0.0815 85 0.0077 117 0.1916 98 0.0391 86 0.0038 100 0.0402 102 0.0164 105 0.0286 107 0.0243 118 0.0113 Total Area
0.1308
0.6613
1.2015
1.0799
* Habitat units within the Quality Zone.
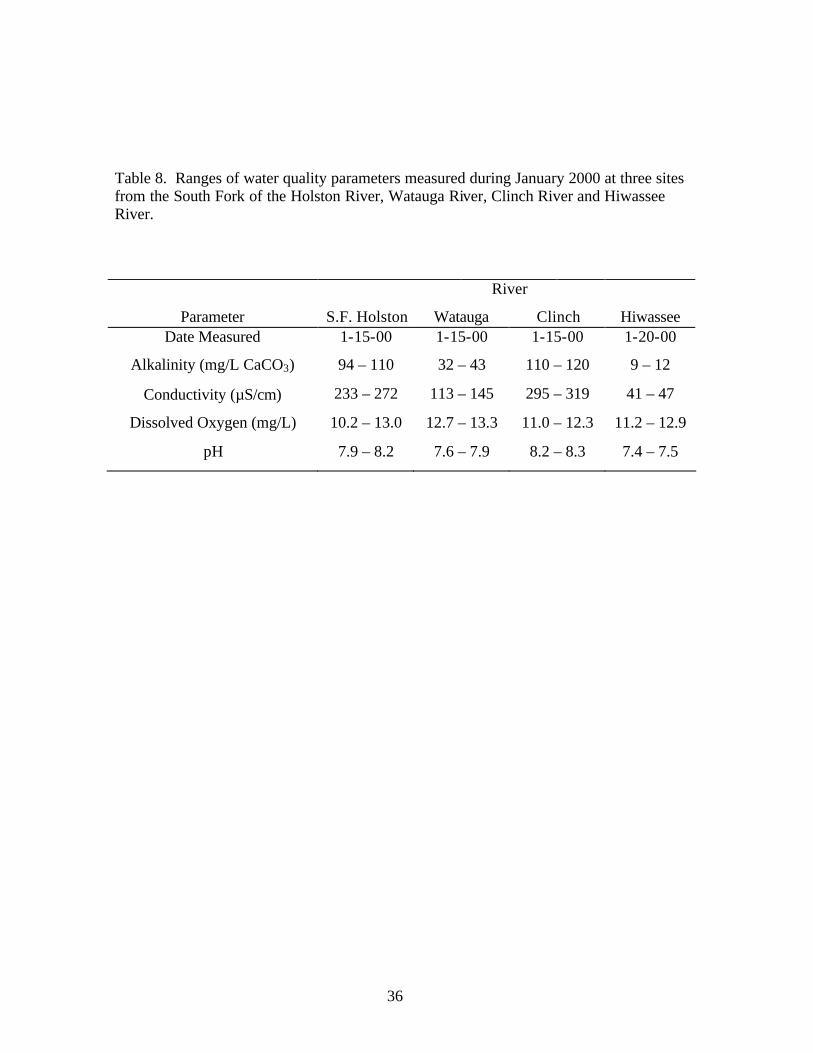
36
Table 8. Ranges of water quality parameters measured during January 2000 at three sites from the South Fork of the Holston River, Watauga River, Clinch River and Hiwassee River. River
Parameter S.F. Holston Watauga Clinch Hiwassee Date Measured 1-15-00 1-15-00 1-15-00 1-20-00
Alkalinity (mg/L CaCO3) 94 – 110 32 – 43 110 – 120 9 – 12
Conductivity (µS/cm) 233 – 272 113 – 145 295 – 319 41 – 47
Dissolved Oxygen (mg/L) 10.2 – 13.0 12.7 – 13.3 11.0 – 12.3 11.2 – 12.9
pH 7.9 – 8.2 7.6 – 7.9 8.2 – 8.3 7.4 – 7.5

37

38
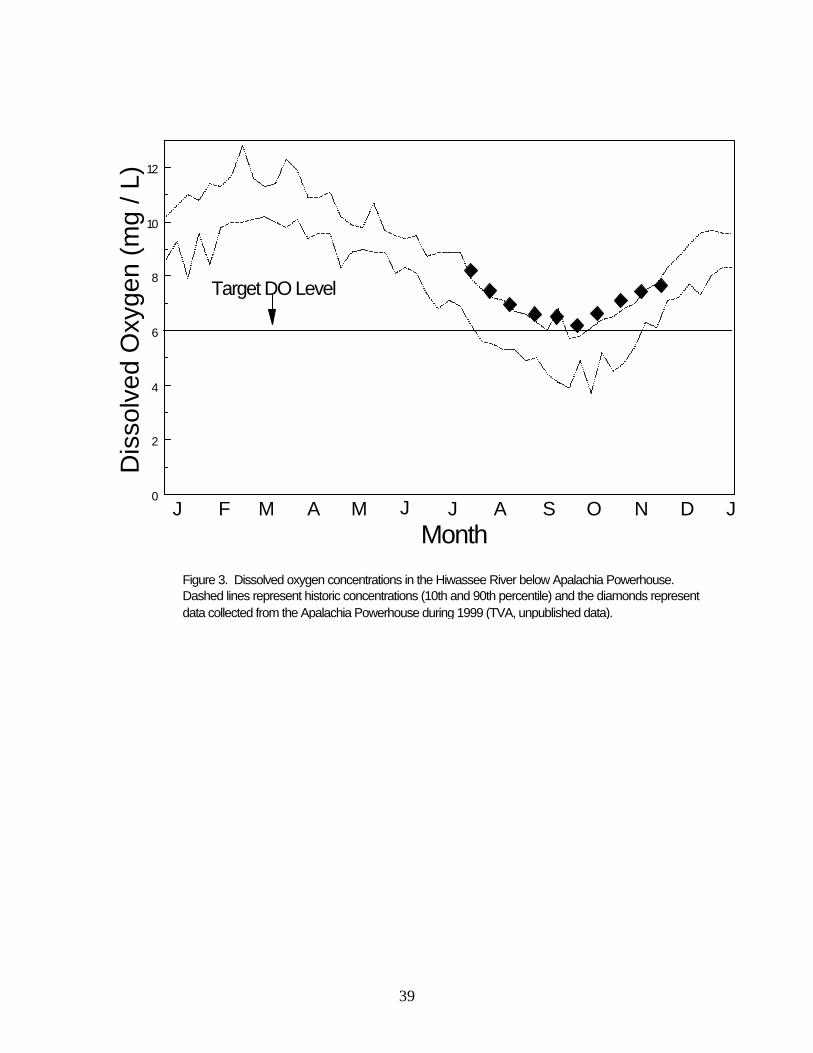
39
0
2
4
6
8
10
12
Dis
solv
ed O
xyge
n (m
g / L
)
J F M A M J J A S O N D J
Figure 3. Dissolved oxygen concentrations in the Hiwassee River below Apalachia Powerhouse. Dashed lines represent historic concentrations (10th and 90th percentile) and the diamonds represent data collected from the Apalachia Powerhouse during 1999 (TVA, unpublished data).
Target DO Level
Month
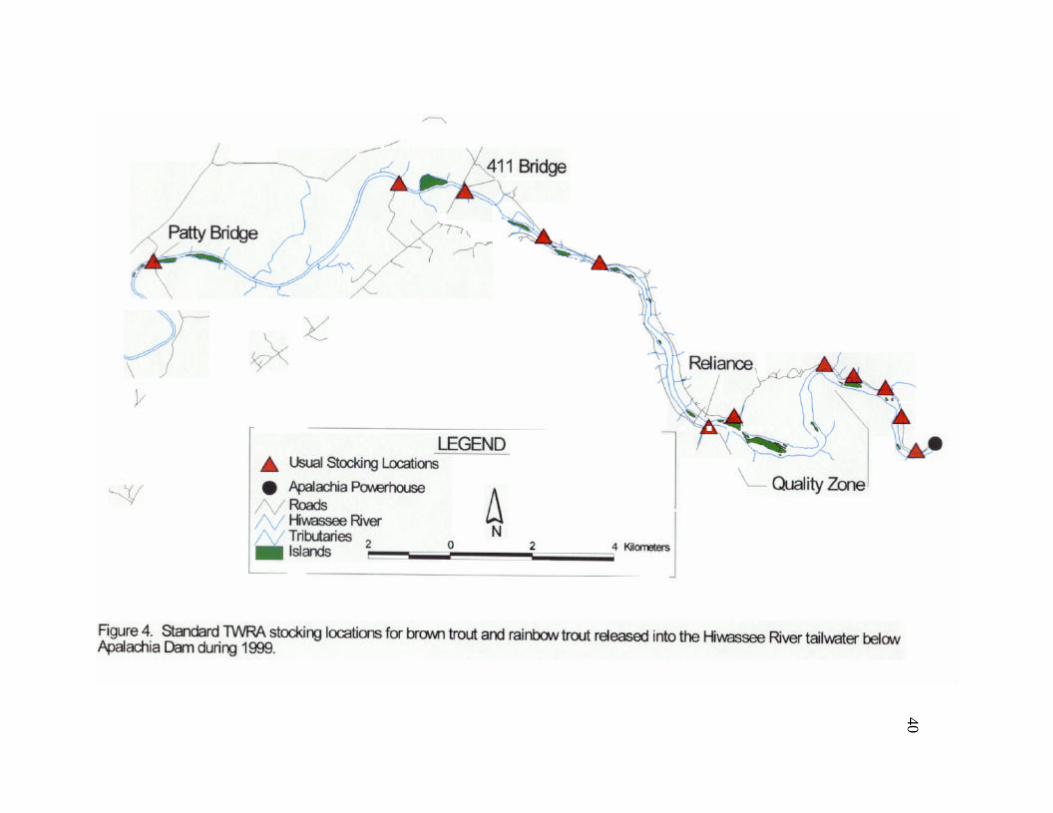
40
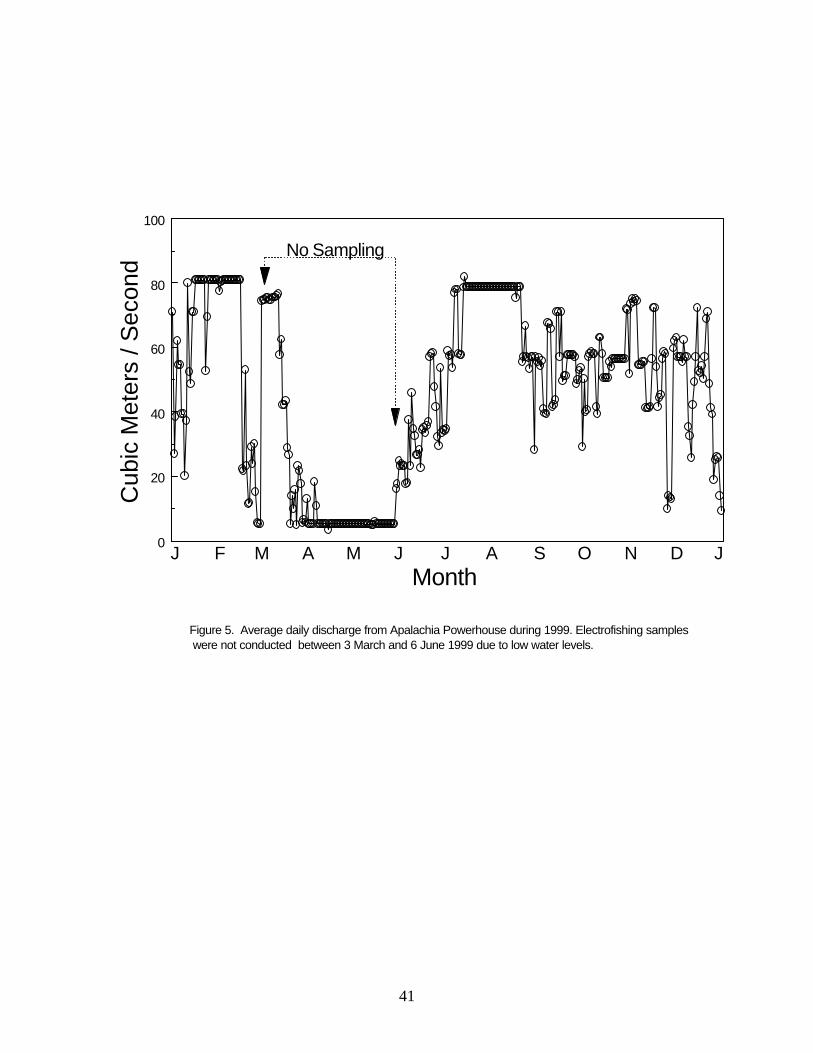
41
Cub
ic M
eter
s / S
econ
d
J F M A M J J A S O N D J
Figure 5. Average daily discharge from Apalachia Powerhouse during 1999. Electrofishing samples were not conducted between 3 March and 6 June 1999 due to low water levels.
0
20
40
60
80
100
No Sampling
Month
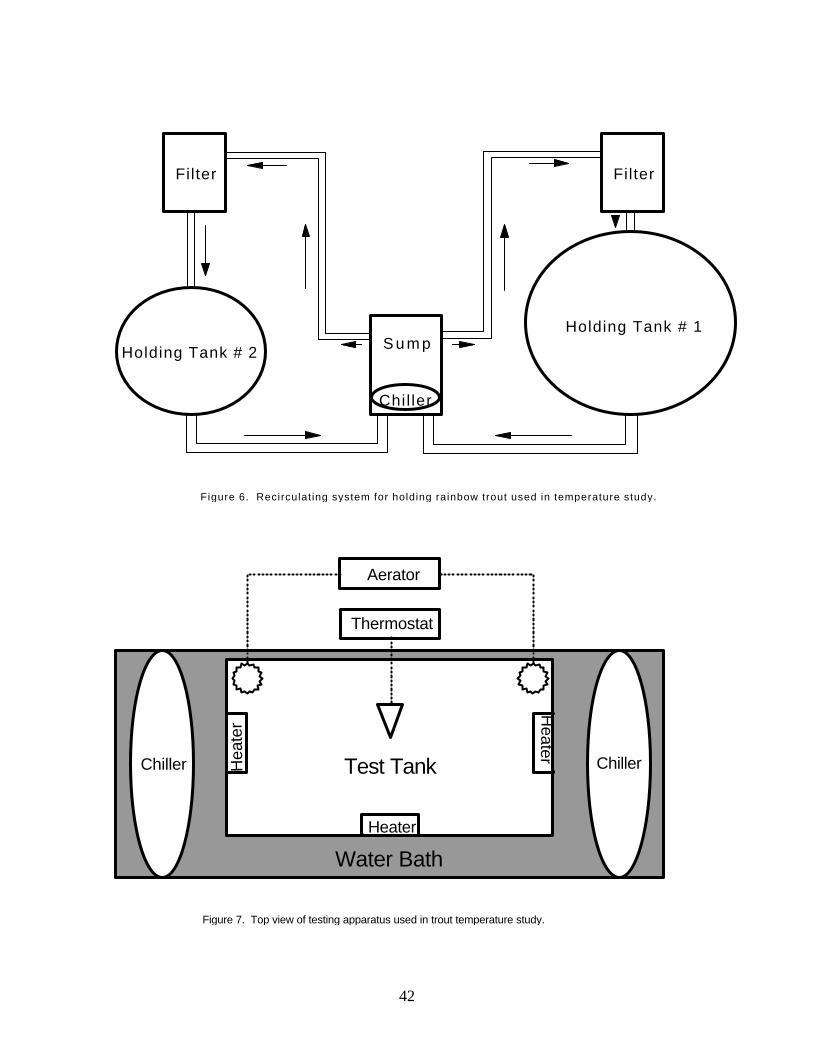
42
Holding Tank # 1
Holding Tank # 2
Filter Filter
S u m p
Chil ler
Figure 6. Recirculat ing system for holding rainbow trout used in temperature study.
Test Tank
Water Bath
Hea
ter
Heater
Heater
Thermostat
Aerator
Chiller Chiller
Figure 7. Top view of testing apparatus used in trout temperature study.

43
Days Post-stocking
Nat
ural
Log
arith
m (
catc
h +
1)
0 50 100 150 200 250 3000123456
March Brown Trout Z = -0.0103200 d = 13%
0 50 100 150 200 250 3000123456
January Rainbow Trout Z = -0.0157200 d = 4%
0 50 100 150 200 250 3000123456
July Rainbow Trout Z = -0.0166200 d = 4%
0 50 100 150 200 250 3000123456
June Rainbow Trout Z = -0.0179200 d = 3%
Figure 8. Catch curve analysis for cohorts of microtagged brown trout and rainbow trout stocked into the Hiwassee River below Apalachia Powerhouse in 1999. Instantaneous mortality rates (Z) and 200-day survival rates (S) are listed.
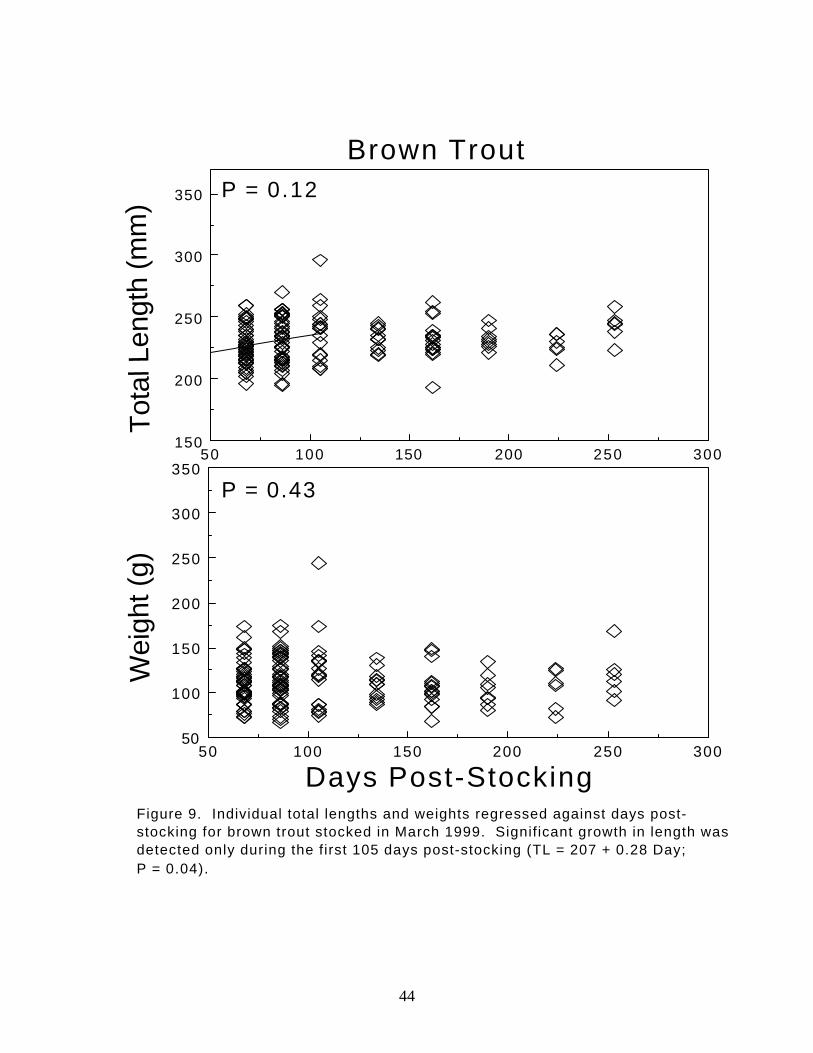
44
50 100 150 200 250 300150
200
250
300
350
Brown Trout To
tal L
engt
h (m
m) P = 0.12
50 100 150 200 250 30050
100
150
200
250
300
350P = 0.43
Wei
ght (
g)
Days Post-StockingFigure 9. Individual total lengths and weights regressed against days post-stocking for brown trout stocked in March 1999. Significant growth in length was detected only during the first 105 days post-stocking (TL = 207 + 0.28 Day; P = 0.04).
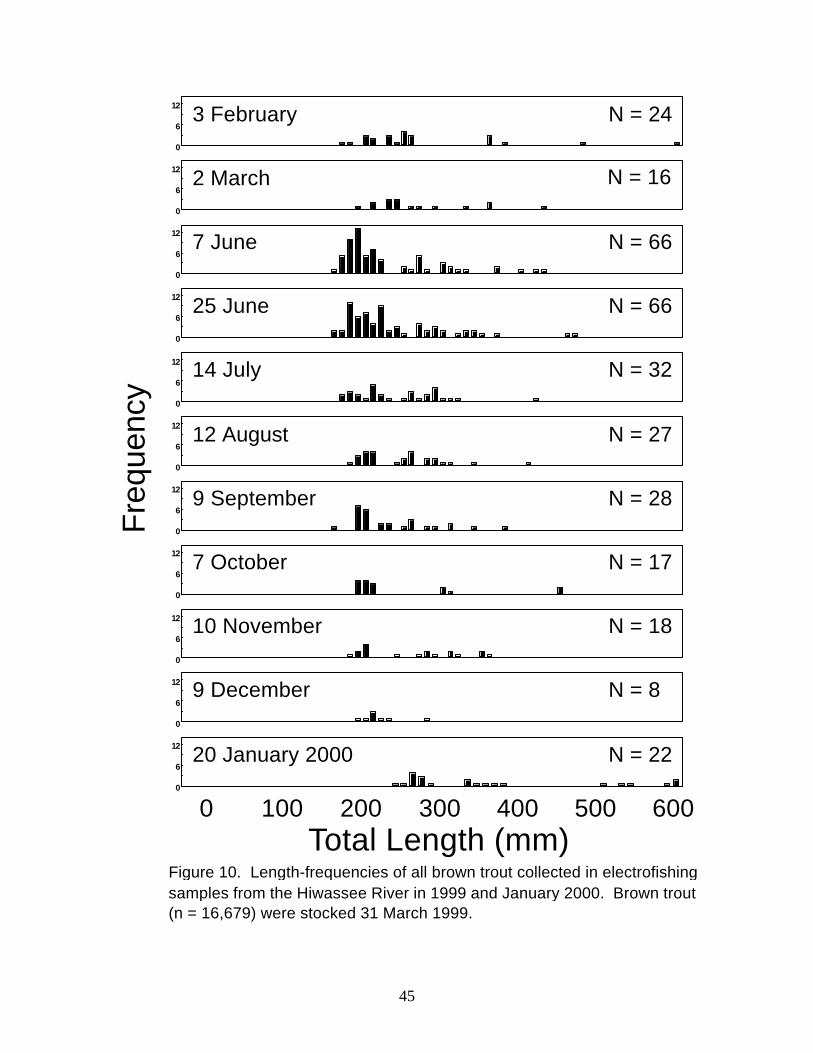
45
100 200 300 400 500 600
Fre
quen
cy
Total Length (mm)0
Figure 10. Length-frequencies of all brown trout collected in electrofishing samples from the Hiwassee River in 1999 and January 2000. Brown trout (n = 16,679) were stocked 31 March 1999.
3 February
2 March
7 June
25 June
14 July
12 August
9 September
7 October
10 November
9 December
0
6
12
0
6
12
0
6
12
0
6
12
0
6
12
0
6
12
0
6
12
0
6
12
0
6
12
0
6
12
0
6
12
20 January 2000
N = 24
N = 66
N = 66
N = 32
N = 27
N = 28
N = 17
N = 18
N = 8
N = 22
N = 16
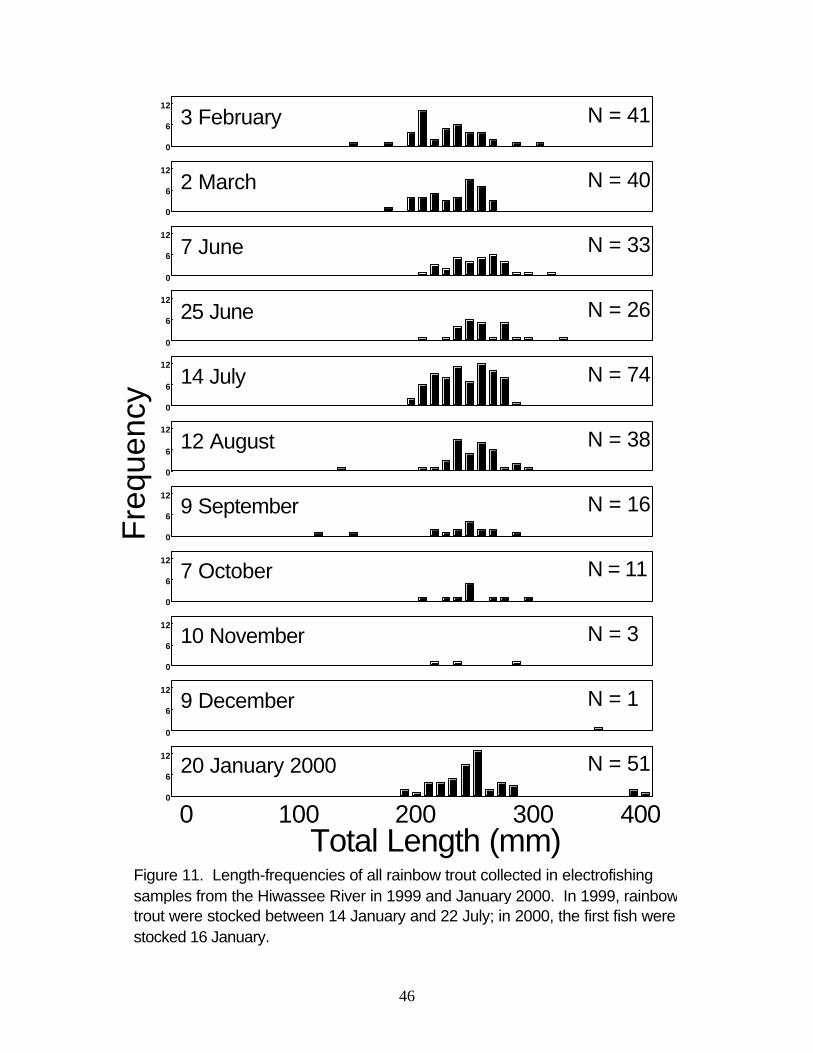
46
100 200 300 400
Fre
quen
cy
Total Length (mm)0
Figure 11. Length-frequencies of all rainbow trout collected in electrofishing samples from the Hiwassee River in 1999 and January 2000. In 1999, rainbowtrout were stocked between 14 January and 22 July; in 2000, the first fish werestocked 16 January.
0
6
12
0
6
12
0
6
12
0
6
12
0
6
12
0
6
12
0
6
12
0
6
12
0
6
12
0
6
12
0
6
12
3 February
2 March
25 June
9 December
20 January 2000
10 November
7 June
14 July
12 August
9 September
7 October
N = 41
N = 51
N = 1
N = 3
N = 11
N = 40
N = 33
N = 26
N = 74
N = 38
N = 16
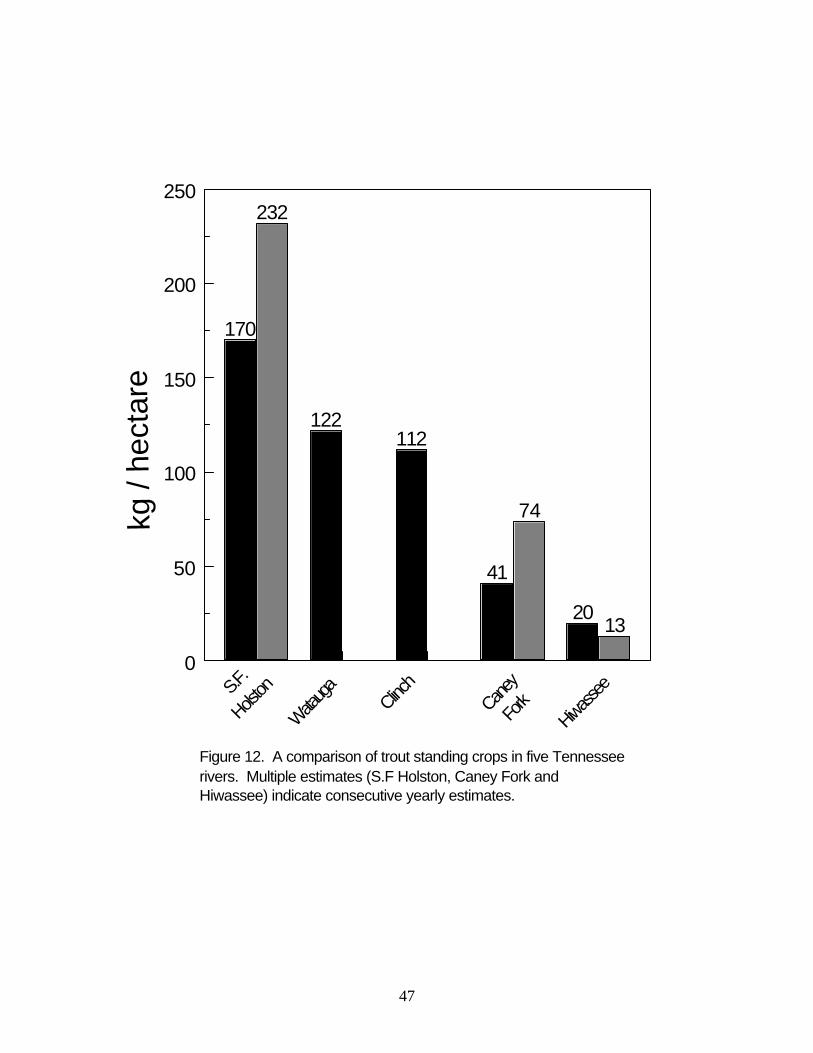
47
0
50
100
150
200
250
170
122112
41
20
232
74
13
kg /
hect
are
S.F.
Holston
Caney
Fork
Hiwassee
Wataug
a
Clinch
Figure 12. A comparison of trout standing crops in five Tennessee rivers. Multiple estimates (S.F Holston, Caney Fork and Hiwassee) indicate consecutive yearly estimates.
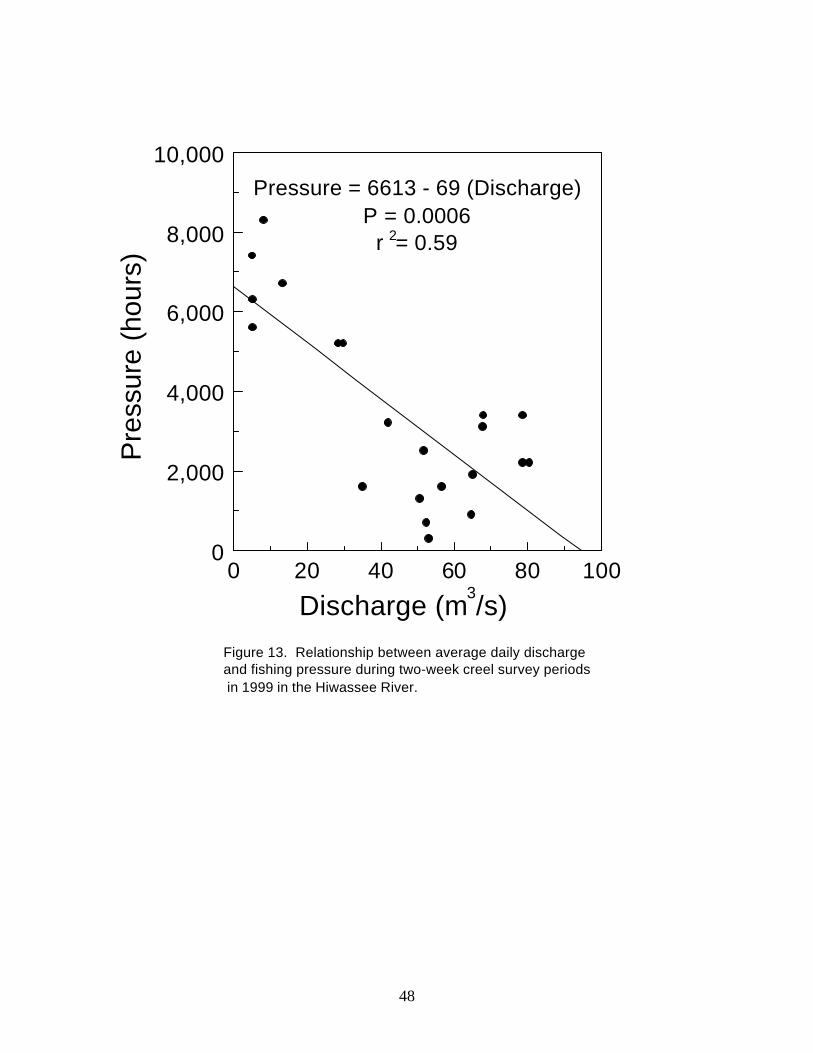
48
0 20 40 60 80 1000
2,000
4,000
6,000
8,000
10,000P
ress
ure
(hou
rs)
Discharge (m /s)3
Pressure = 6613 - 69 (Discharge)P = 0.0006
r = 0.592
Figure 13. Relationship between average daily discharge and fishing pressure during two-week creel survey periods in 1999 in the Hiwassee River.
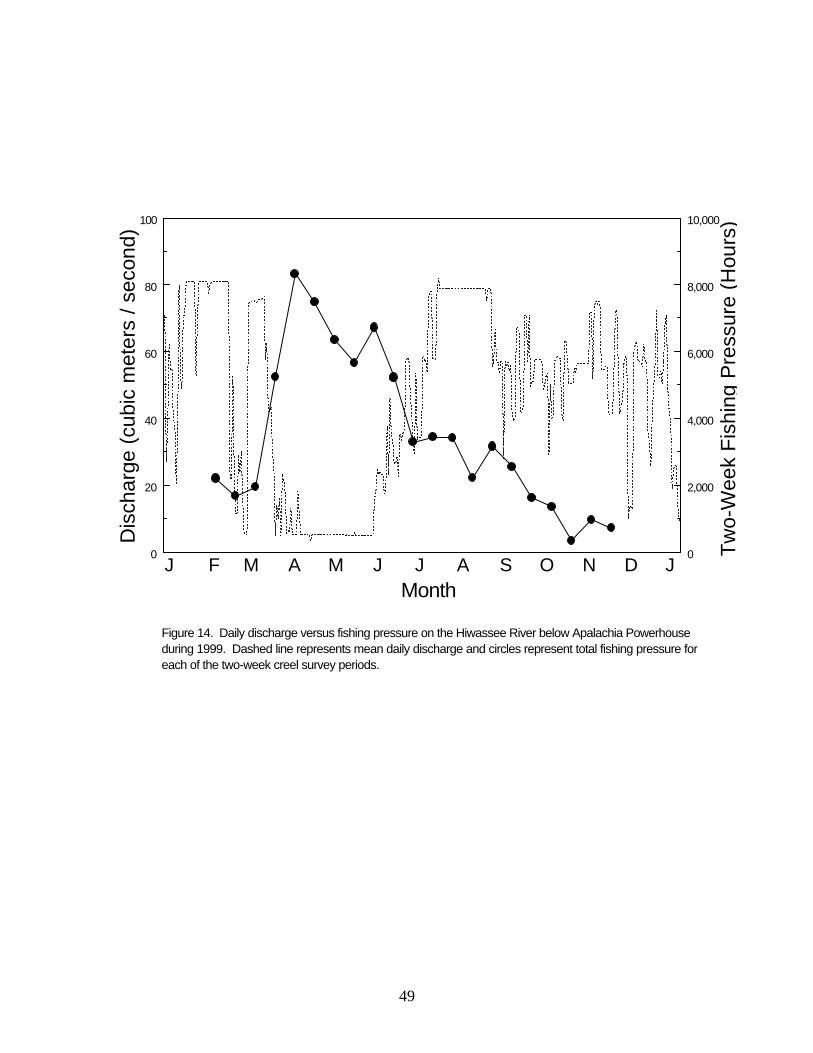
49
0
20
40
60
80
100
0
2,000
4,000
6,000
8,000
10,000
Dis
char
ge (
cubi
c m
eter
s / s
econ
d)
J F M A M J J A S O N D J
Figure 14. Daily discharge versus fishing pressure on the Hiwassee River below Apalachia Powerhouse during 1999. Dashed line represents mean daily discharge and circles represent total fishing pressure foreach of the two-week creel survey periods.
Tw
o-W
eek
Fis
hing
Pre
ssur
e (H
ours
)
Month

50
0 1 2 3 4 5 6 7 8 9 10
Number harvested per angler
0
50
100
150
200
250F
req
uen
cy
0 2 4 6 8 10 12 14 16 18 20+
Number caught per angler
0
20
40
60
80
100
120
Fre
qu
ency
MEAN = 1.15 FISH (SE = 0.11)
MEAN = 4.33 FISH (SE = 0.35)
21
Figure 15. Frequency distribution for the average number of trout harvestedand caught by each member of parties that had completed fishing when interviewed on the Hiwassee River, January 1999-November 1999. N = 353 parties.
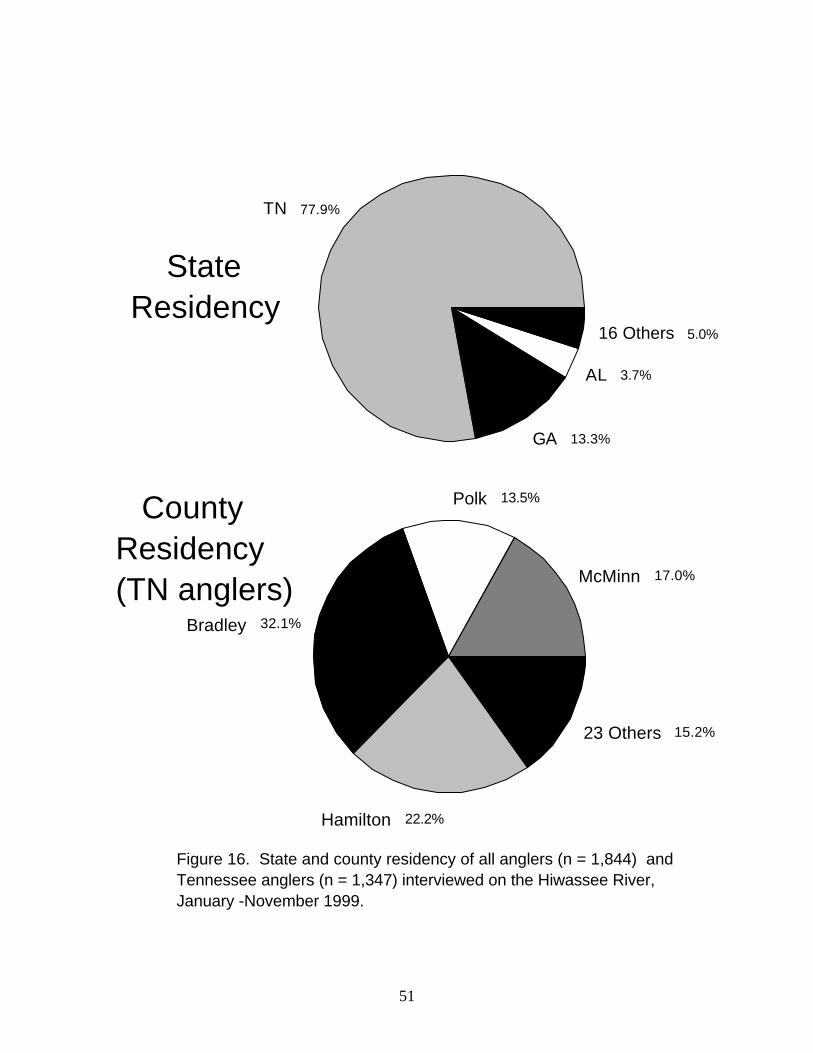
51
CountyResidency(TN anglers)
TN
GA
AL
16 Others
77.9%
13.3%
3.7%
5.0%
StateResidency
McMinn
Polk
Bradley
Hamilton
23 Others
17.0%
13.5%
32.1%
22.2%
15.2%
Figure 16. State and county residency of all anglers (n = 1,844) andTennessee anglers (n = 1,347) interviewed on the Hiwassee River, January -November 1999.

52

53
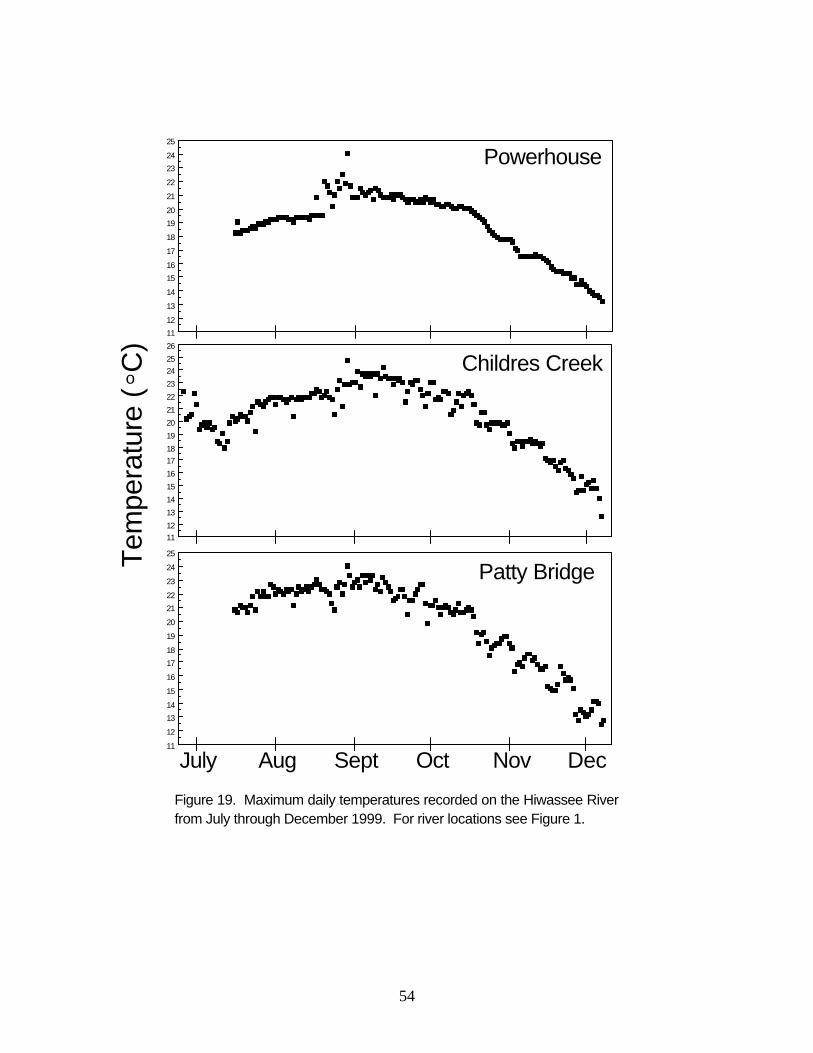
54
11
12
13
14
15
16
17
18
19
20
21
22
23
24
25
1112
13
14
15
16
1718
19
20
21
22
23
2425
26
11
12
13
14
15
16
17
18
19
20
21
22
23
24
25
Powerhouse
Childres Creek
Patty Bridge
July Aug Sept Oct Nov Dec
Figure 19. Maximum daily temperatures recorded on the Hiwassee River from July through December 1999. For river locations see Figure 1.
Tem
pera
ture
( C
)
o
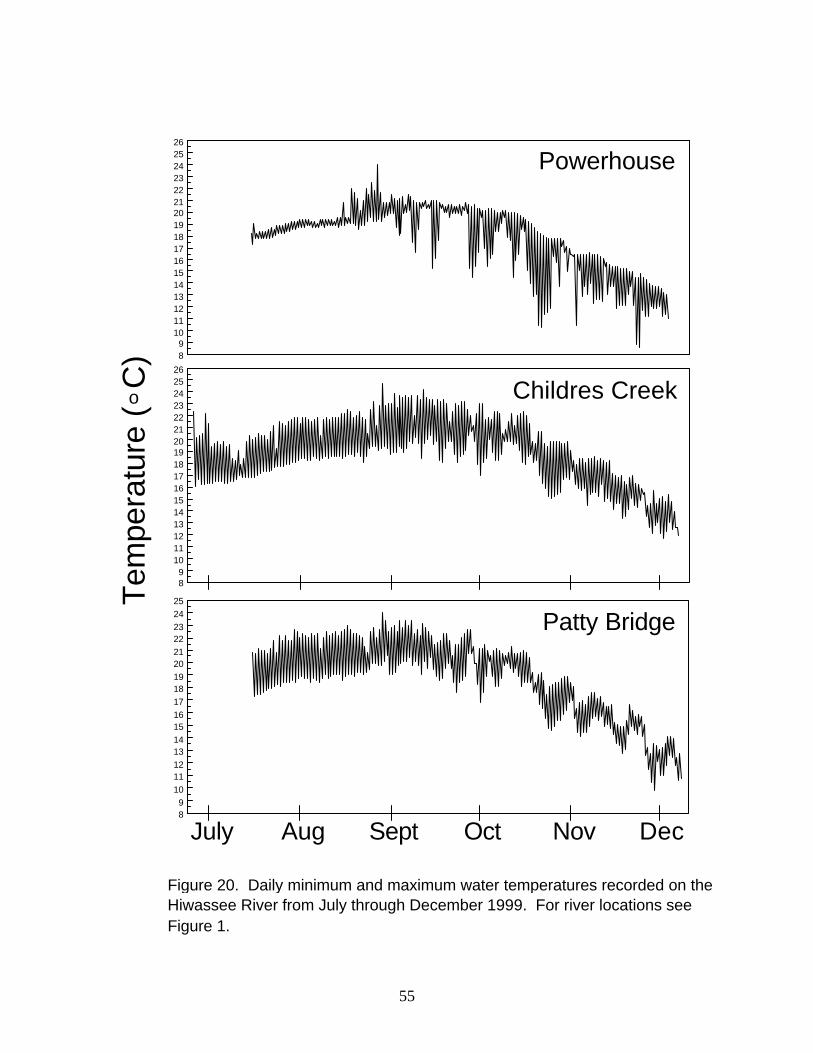
55
89
1011121314151617181920212223242526
89
1011121314151617181920212223242526
89
10111213141516171819202122232425
Powerhouse
Childres Creek
Patty Bridge
July Aug Sept Oct Nov Dec
Figure 20. Daily minimum and maximum water temperatures recorded on the Hiwassee River from July through December 1999. For river locations see Figure 1.
Tem
pera
ture
( C
)
o

56
Res
ista
nce
Tim
e (M
inue
ts)
Figure 21. Mean resistance times (and standard errors) to initial and permanent equilibrium loss for rainbow trout acclimated to 10 C. For each test temperature, n = 8. Each trial lasted 60 minutes.
Test Temperature ( C)o
18 21 24 270
10
20
30
40
50
60 Initial
18 21 24 270
10
20
30
40
50
60 Permanent

57
YearFigure 22. Total amount of water released annually through Apalachia Dam, 1990 - 1999. Dashed line indicates the 10-year average.
Acr
e-fe
et (
X 1
,000
,000
)
1990 1991 1992 1993 1994 1995 1996 1997 1998 19990
0.20.40.60.8
11.21.41.61.8
22.22.42.62.8
3

58
APPENDIX
Creel survey Forms

59
DAILY SAMPLE SHEET - HIWASSEE 1999 DATE (mo/day/year) 2-WEEK PERIOD _________ (1-21) KIND OF DAY _______________ (01 = weekday 02= weekend) AREA ( 1 OR 2) SHIFT (AM or PM) ___________ PROBABILITY ____________ TIME COUNT BEGAN __________________ (military time) RIVER STAGE IN WORK AREA _____________________ WHEN COUNT BEGAN (0 = NO GENERATION, 1 = PARTIAL , 2 = FULL) NUMBER NUMBER NUMBER RIVER REACH OF ANGLERS OF BOATS OF TRAILERS 1. ABOVE QUALITY ZONE ________________________________________________________________________ 2. QUALITY ZONE _______________________________________________________________________ 3. RELIANCE-TO-RT.411 _______________________________________________________________________ 4. FROM RT.411-TO-PATTY BRIDGE ______________________________________________________________________ “Boats” refers to any canoes, drift boats, or jonboats with people fishing. “Trailers” refers to any trailer used to haul a drift boat or jonboat. T O T A L S __________________________________________________________________ ANGLERS BOATS TRAILERS Number of Anglers per boat ________________________ Clerk ________________

60
INTERVIEW SHEET - HIWASSEE RIVER DATE (MO/DAY/YEAR) INTERVIEW NUMBER _________ PERIOD (01 - 21) KIND-OF-DAY ____________________ Weekday = 1 Weekend / holiday = 2 ACCESS POINT (1,2, 3, OR 4) NUMBER IN PARTY _______________ START OF FISHING END OF FISHING __________________ (MILITARY TIME) (Time of interview) (MILITARY TIME) Time Fishing HRS COMPLETED TRIP? ________________ By Party YES = 1 NO = 2 MIN____________ SPECIES FISHED FOR: CHECK ONE TROUT _____ OTHER or ANY______ (1) (2) NUMBER OF RAINBOWS CAUGHT = _______ NUMBER OF RAINBOWS KEPT : UNTAGGED DORSAL (D) _______ CAUDAL(C) ANAL (A) LEFT PECTORAL (LP) SNOUT (S) ____ LENGTHS OF TAGGED RAINBOWS ( & TAG LOCATION) ______________________ _______________________________________________________________________________ LENGTHS OF ANY UNTAGGED RAINBOWS OVER 35 CM____________________________ NUMBER OF BROWNS CAUGHT = ______________ NUMBER OF BROWNS KEPT : Untagged Tagged(Dorsal) Tagged (Caudal) ____ LENGTHS OF TAGGED BROWNS (& tag location)____________________________________ _______________________________________________________________________________ LENGTHS OF ANY UNTAGGED BROWNS OVER 35 CM______________________________ For METHOD, TERMINAL GEAR, and LOCATION, the numbers entered should equal the number in the party. METHOD: STILLFISHING _____ SPINFISHING _____ FLYFISHING _____ TERMINAL GEAR ARTIFICIAL LURES or FLIES _______ BAIT _ ______ LOCATION: ON BANK/WADING _____ IN BOAT ____ FLOAT-TUBE_______ STATE ____ AND COUNTY(IF TENN) ___________ OF RESIDENCE RAINBOW: JAN (D); MAR ( C ); JUN (LP); JUNE-QZ (A) ; JULY (S) BROWNS: QZ ( C); OTHERS ( D)