an iot-big data based machine learning technique for
TRANSCRIPT

HAL Id: hal-01888626https://hal.inria.fr/hal-01888626
Submitted on 5 Oct 2018
HAL is a multi-disciplinary open accessarchive for the deposit and dissemination of sci-entific research documents, whether they are pub-lished or not. The documents may come fromteaching and research institutions in France orabroad, or from public or private research centers.
L’archive ouverte pluridisciplinaire HAL, estdestinée au dépôt et à la diffusion de documentsscientifiques de niveau recherche, publiés ou non,émanant des établissements d’enseignement et derecherche français ou étrangers, des laboratoirespublics ou privés.
Distributed under a Creative Commons Attribution| 4.0 International License
An IoT-Big Data Based Machine Learning Technique forForecasting Water Requirement in Irrigation Field
Fizar Ahmed
To cite this version:Fizar Ahmed. An IoT-Big Data Based Machine Learning Technique for Forecasting Water Require-ment in Irrigation Field. 11th International Conference on Research and Practical Issues of EnterpriseInformation Systems (CONFENIS), Oct 2017, Shanghai, China. pp.67-77, �10.1007/978-3-319-94845-4_7�. �hal-01888626�

An IoT-Big data based machine learning technique for
forecasting water requirement in irrigation field.
Fizar Ahmed
PhD Student
Corvinus University of Budapest, Hungary
Abstract. Efficient water management is a major concern in rice cropping.
Controlling the use of excessive water in irrigation field is essential for the pro-
tection of underground water that will also be the part of climate change adapta-
tion. The sustainable use of water resources is the prior task in Bangladesh. Im-
balances between demand and supply are the main region for degradation of
surface and groundwater. The human readability of checking the water level on
irrigation field is considerable for these circumstances. In this paper I discussed
the procedure for monitoring of surface water level in irrigation field, continu-
ous monitoring of weather condition like temperature, air pressure, sunlight,
rainfall etc. by using sensor network. The aim is to create a machine learning
mechanism for farmers that can be given a forecast of water demand of irriga-
tion field by the collection of IoT based data. In turn, this will help the farmer to
prepare them to give water and on the other hand it will be helpful to use ap-
propriate ground water and also it can be used for predict energy utilization. In
this research Multiple linear regression algorithm is used for this prediction.
Data from the irrigation field of North-West part in Bangladesh is used here to
find the result of prediction.
Keywords: Internet of Things (IoT), Irrigation, Ground Water, Machine learn-
ing, Multiple linear regression.
1 Introduction
Water management is important for the adaptation of climate change. Shortage of
water resources are directly affects the vulnerability of ecosystems, socio-economic
activities and human health. On the other hand climate change is likely to lead to
major changes in water availability across Bangladesh with increasing water scarcity
and droughts mainly in North-West part of this country.

2
It’s assessed that as much as 50 per cent of irrigation water is wasted due to evapo-
ration or runoff. This happens because most irrigation systems still rely upon simple
human reading. However, Internet of Things technologies can provide “Smart” irriga-
tion systems. It can be useable for monitoring soil conditions, surface water level in
real time with low power, wireless sensor networks. The wireless sensor networks
send the data to a central network gateway, and the network gateway sends the data to
the cloud platform. The gateways have the ability to connect via both wired and cellu-
lar data connections, so that can be point them from anywhere. In the internet cloud
platform machine learning applications can be used for sending the application result
to the end users mobile phone or personal computer.
This research mainly focused on the utilization of ground water in weather-based
irrigation field. Weather-based irrigation determines the amount of water needed by
the landscape based on the current weather conditions, such as precipitation, solar
radiation, temperature, relative humidity, and wind speed. Weather data is provided
by IoT based land weather station. Data from the weather station matching with
measuring the level of water by using distance sensor where mainly measure the level
of water loss from the soil due to evaporation and plant transpiration. This water level
data in millimeter will be as a class data with other weather perimeter. A machine
learning technique multiple linear regression algorithm is used here for prediction of
water loses due to this weather condition in near future.
2 Related works
In Bangladesh, mainly in the north-west part of this country, ground water is the main
source of irrigation. Shahid & Hazarika (2010) investigated groundwater scarcity and
drought in three northwestern districts of Bangladesh. They proposed a Cumulative
Deficit approach from a threshold groundwater level has been used for the computa-
tion of severity of groundwater droughts. Their research shows that groundwater scar-
city in 42% area is an every year in the region. The daily evapotranspiration from rice
field will increase by an average of 31.3 mm and 0.33 mm/day respectively by the
year of 2100 (Shahid, 2011). The main finding of this research is that climate change
will increase the daily use of water for irrigation by an amount of 0.8 mm/day in the
end of this century.
In their research finding Qureshi, Ahmed, Krupnik (2014) shows that 35,322 deep
tubewells, 1,523,322 shallow tubewells and 170,570 low lift pumps are working in
Bangladesh to provide water for irrigation. About 79% of the total cultivated area in
Bangladesh is irrigated by groundwater, whereas the remaining is irrigated by surface
water. More than 90% of the pumps within Bangladesh are run by diesel engines. The
remaining 10% use electricity. Despite subsidies on electricity, diesel pumps are pre-
ferred by farmers due to low capital cost and mobility ease within small and frag-
mented farm lands. Each year, on average, about 980 million kWh of electricity is
used by electric tubewells with an estimated subsidized cost of USD 50 million. The

3
annual diesel consumption for groundwater extraction is of the order of 4.6 billion
liters, costing USD 4.0 billion in aggregate.
40 million people are at risk of arsenic poisoning-related diseases because the ground
water in these wells is contaminated with arsenic. Alam, M. G. M., et al. (2002) re-
views the arsenic infection of ground water, hydrological systems, groundwater po-
tential and utilization and environmental pollution in Bangladesh. They discussed the
main actions required to ensure the sustainable development of water resources in
Bangladesh. Safiuddin & Karim (2001) also highlighted the causes and mechanism of
arsenic contamination and presented several measures to remedy the arsenic contami-
nation in groundwater. Another survey by Meharg & Rahman, M (2003) shows that
paddy soils throughout Bangladesh showed that arsenic levels were elevated in zones
where arsenic in groundwater used for irrigation was high, and where these tube-wells
have been in operation for the longest period of time. The finding of another research
of Meharg (2004) is "Arsenic is sequestered in iron plaque on root surfaces in plants,
regulated by phosphorus status, and that there is considerable varietal variation in
arsenic sequestration and subsequently plant uptake, offers a hope for breeding rice
for the new arsenic disaster in South-East Asia – the contamination of paddy soils
with arsenic".
For reducing the wastage of ground water smart irrigation system is now the most
priotize topic in agriculture research. Mathurkar & Chaudhari (2013) focused on op-
timizing water management for agriculture through the physical and socioeconomic
conditions that inspired the success of an "indigenous technology" which has for
spanning exploited the potential for excess harvesting. Monda, Basu, & Bhadoria
(2011) described a Precision Agriculture (PA) concept was initiated for site specific
crop management as a grouping of locating system. By using this way of proper re-
source utilization and management, to a environmental friendly sustainable agricul-
ture is possible that they focused. Nandurkar & Thool (2012) designed a sensing sys-
tem is based on a "feedback control mechanism" with a integrated control unit which
standardizes the flow of water on to the field in the real time based on the rapid tem-
perature and moisture values. They also prepared a table that discover the amout of
water needed by that crop. Roy & Ansari (2014) and Awasthi & Reddy (2013) devel-
oped the irrigation control system to avoid wastage of water and increase irrigation
efficiency by using a PLC based irrigation system with the help of soil moisture sen-
sor, water level sensor, and GSM controller. Their system can be used for sending
message to farmer on mobile through GSM network for controlling actions.
Many machine learning techniques have been developed for learning rules and rela-
tionships automatically from various agricultural data sets. McQueen, Garner, Nevill-
Manning & Witten (1995) and Ozdogan, Yang, Allez & Cervantes (2010) described a
project that is applying a range of machine learning strategies to problems in agricul-
ture and horticulture. They experimented and described some software requirements
on real-world data sets. They also explored the value of archived data that enable
4
comparison of images through time. Ozdogan & Gutman (2008) presented a dryland
irrigation mapping methodology that relies on remotely sensed inputs from the MOD-
erate Resolution Imaging Spectroradiometer (MODIS) instrument. They proposed
different steps for mapping expected patterns where the dividing of majority of irri-
gated areas is concentrated in the dry lowland valleys. Image processing is an effec-
tive tool for analysis of the agriculture data sets (Vibhute & Bodhe 2012). This paper
focussed on the survey of application of image processing in agriculture field such as
imaging techniques, weed detection and fruit grading.
A machine learning technique Support Vector Machines (SVMs) was used for classi-
fied various crop types in a complex cropping system in the Phoenix Active Manage-
ment Area (Zheng, Myint, Thenkabail & Aggarwal 2015). They used "Landsat time-
series Normalized Difference Vegetation Index (NDVI)" data using training datasets
selected by two different approaches: stratified random approach and intelligent selec-
tion approach using local knowledge. For weather prediction (Radhika & Shashi
2009), long-term prediction of lake water levels (Khan & Coulibaly, 2006), SVM is
the most promising technique for better expectation. SVM can also be used for time
series application in many application areas from financial market prediction to elec-
tric utility load forecasting to medical and other scientific fields (Sapankevych &
Sankar 2009).
3 Multiple linear regression algorithm
A multiple linear regression (MLR) model that describes a dependent variable y by
independent variables x1, x2, ..., xp (p > 1) is expressed by the equation as follows,
where the numbers α and βk (k = 1, 2, ..., p) are the parameters, and ϵ is the error
term.
For example, in the built-in data set stackloss from observations of a chemical
plant operation, if we assign stackloss as the dependent variable, and as-
sign Air.Flow (cooling air flow), Water. Temp (inlet water temperature)
and Acid.Conc. (acid concentration) as independent variables, the multiple linear
regression model is:
4 Methodology
4.1 Hardware specifications
To read real-time data is typical of a weather station, using different sensors, and
capable of communicating via LoRa. After a review of all known hardware available
5
on the market, all the components strictly necessary to the solution were defined,
which in turn fulfilled the requirements of the above: The hardware chosen was:
• Adafruit Feather 32u4 RFM95 LoRa Radio with female pin headers2
• Adafruit RTC DS32313
• Sparkfun Weather Shield with RJ11 female connectors4
• Wind and Rain sensors kit5
• Antenna 868 Mhz and SMA cable
4.2 Core System controller
In terms of the core system within the Weather Station solution, it is composed by
the Feather32u4, which that takes a specialized role in the system where it performs
control functions through software, with processing power, enabling the sensory de-
vices to gather data from the environment, using specific libraries. This system also
has built-in communication capabilities.
4.3 Data Acquisition
The weather shield is an integrated module with several built-in sensors capable of
collecting data, such as temperature, humidity, luminosity, barometric pressure and
altitude. Along these sensors, the weather shield also enables the integration of three
more different sensors to collect data regarding wind direction, wind speed and
amount of rain. Based on the proposed model, it becomes clear the connection be-
tween the controller and the Weather Shield. This connection is established with the
I2C protocol that allow this digital integrated circuit to communicate with one or
more masters. It is used this type of protocol because it's only intended short distance
communications within a single device and only requires two signals to exchange
information. The software controller uses the library "Wire.h" that is dedicated to the
I2C logic protocol. The embedded software requires the “SparkFunHTU21D.h” and
“SparkFunMPL3115A2.h” libraries in order to call all the functions responsible for
activating and reading the sensors signals coupled to the weather shield.
4.4 Data Communication
Like as expected in the proposed system model, the controller will send data to the
outstation, based on the information collected from the weather shield module. For
this it makes use of the "SPI.h" library to run the communication with the radio mod-
ule RFM9x LoRa 868/915. The LoRa radio must communicate with the LoRa gate-
way, specified by the system, and for that will interact with the "featherLora.h" li-
brary. The data will be collected according to the time windows described, already
considered in the project. At the end of each time window will be sent the package
with the message containing the information collected. In data sharing with outstation

6
it was established to send an acknowledge information packet like a result of the in-
coming data from the different sensors. The typical message to be sent from one
gateway to another is based on the type message as described in the following exam-
ple:
Example of the message send in the package:
\\!TC/18/HU/85/LU/0.56/ WD/90/WC/5.55
The following table outlines the type and content of the information sent in each
package:
Table 1 - Communication package.
TC Temperature
HU Humidity
LU Luminosity
WD Wind Direction
WC Wind Speed
4.5 Water level measurement by Ultrasonic sensor
Ultrasonic distance measurement sensor is used to observe the level of water and
radio communication of this value via license free LoRa devices is used under differ-
ent package simultaneously with weather station. Temperature compensated distance
sensor US-100 (Voltage 2.4 - 5.5V), Arduino Pro Mini 3.3V (8MHz) version, energy
source (2 or 3 battery type AA), Radio module used in this package.
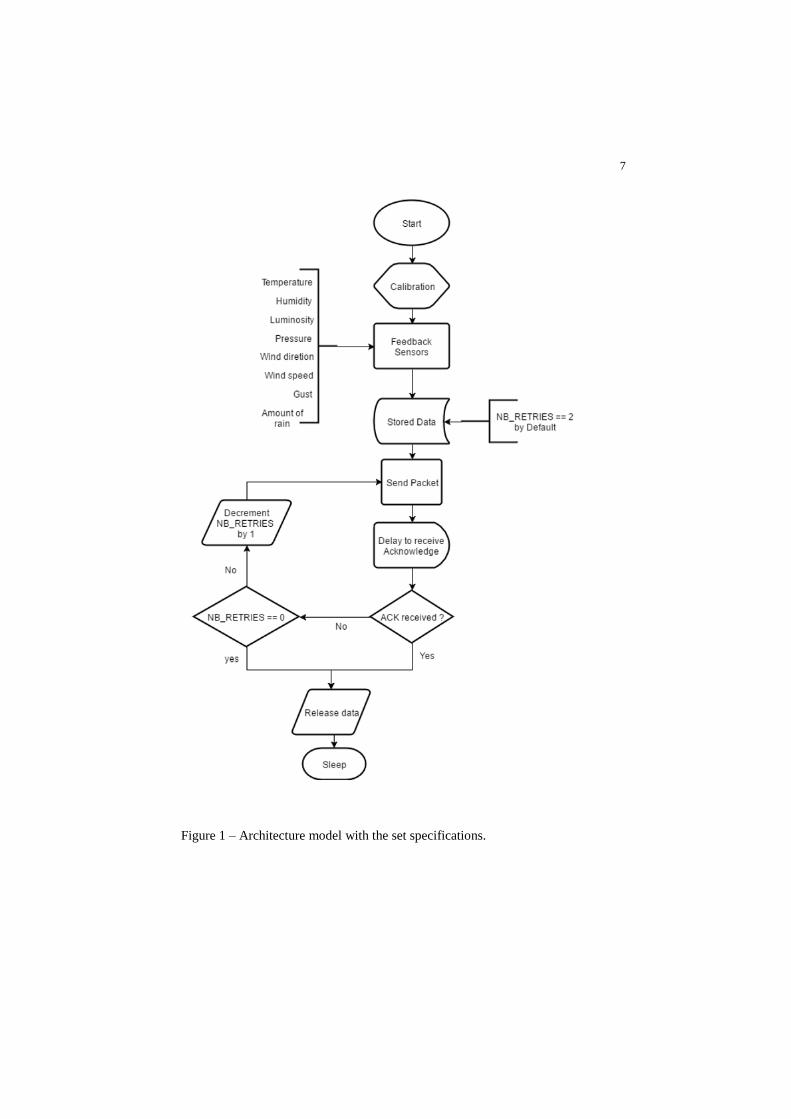
The architecture of proposed model and it’s operating flow with the set specifica-
tions:
7
Figure 1 – Architecture model with the set specifications.

8
5 Result and analysis
The following result has been found from this testing dataset:
Multiple R-squared: Approximately 79% variation in water level (Distance in Mil-
limetre- DM) can be explained by this model. (Wind direction -WD, Wind Speed-
WC, Humidity-HU, Luminous-LU and Temperature-TC)
F- statistics: These tests are null hypothesis and all the model coefficients are 0.
Residual standard error gives the idea of how far observed water level -DM (Y-
values) are from the predicted or fitted DM(the Y-hats). This gives us an idea of a
typical size of residual or error e= y -y'.
The intercept shows the estimated mean Y value when all Xs are 0. We can associ-
ate with increase some values of wind direction, speed or other values water level
adjusting or controlling the for Luminous or humidity. The hypothesis test that the
slope for WD or others is 0.

9
The collinearity between WD and and WC means that we should not directly inter-
pret the slope, as the effect of WD on DM adjusting for WC. The high correlation
between two values suggests that these two effects are somewhat bounded together.
Here confint values shows the slope for the level of 95%.

10

11
6 Conclusion
This IoT based machine learning works was my sample hands-on experience with real
time data. Behind this task, it has a lot of preparation for a big part: it involved data
understanding, sorting and reframing. That is beyond of this research work. A sample
small scale data just used here to show the result for predicting data model. It is
definitely challenging to work with this type big data. And finally, as I tried to under-
stand the different correlation relationships between the parameters and the forecasts,
I surprisingly also got a better understanding of prediction from the information of
weather perimeters and IoT data collection point of view.
References
1. Shahid, S., & Hazarika, M. K. (2010). Groundwater drought in the northwestern districts
of Bangladesh. Water Resources Management, 24(10), 1989-2006.
2. Shahid, S. (2011). Impact of climate change on irrigation water demand of dry season Bo-
ro rice in northwest Bangladesh. Climatic change, 105(3), 433-453.
3. Alam, M. G. M., Allinson, G., Stagnitti, F., Tanaka, A., & Westbrooke, M. (2002). Arsenic
contamination in Bangladesh groundwater: a major environmental and social disas-
ter. International Journal of Environmental Health Research, 12(3), 235-253.

12
4. Qureshi, A. S., Ahmed, Z., & Krupnik, T. J. (2014). Groundwater management in Bangla-
desh: an analysis of problems and opportunities.
5. Safiuddin, M., & Karim, M. M. (2001, November). Groundwater arsenic contamination in
Bangladesh: causes, effects and remediation. In Proceedings of the 1st IEB International
Conference and 7th Annual Paper Meet, The Institution of Engineers, Chittagong Center,
Bangladesh.
6. Meharg, A. A., & Rahman, M. M. (2003). Arsenic contamination of Bangladesh paddy
field soils: implications for rice contribution to arsenic consumption. Environmental Sci-
ence & Technology, 37(2), 229-234.
7. Meharg, A. A. (2004). Arsenic in rice–understanding a new disaster for South-East
Asia. Trends in plant science, 9(9), 415-417.
8. Mathurkar, S. S., & Chaudhari, D. S. (2013). A review on smart sensors based monitoring
system for agriculture. International Journal of Innovative Technology and Exploring En-
gineering (IJITEE) ISSN, 2.
9. Monda, P., Basu, M., & Bhadoria, P. B. S. (2011). Critical review of precision agriculture
technologies and its scope of adoption in India. American Journal of Experimental Agri-
culture, 1(3), 49.
10. Nandurkar, S. R., & Thool, V. R. (2012). Design of a Soil Moisture Sensing Unit for
Smart Irrigation Application. In International Conference on Emerging Technology Trends
on Advanced Engineering Research (ICETT’12), Proceedings published by International
Journal of Computer Applications (IJCA), pp.-1-4.
11. Roy, K. D., & Ansari, H. M. M. (2014). Smart Irrigation Control System. International
Journal of Environmental Research and Development, 4(4), 371-374.
12. Awasthi, A., & Reddy, S. R. N. (2013). Monitoring for precision agriculture using wireless
sensor network-a review. Global Journal of Computer Science and Technology, 13(7).
13. McQueen, R. J., Garner, S. R., Nevill-Manning, C. G., & Witten, I. H. (1995). Applying
machine learning to agricultural data. Computers and electronics in agriculture, 12(4), 275-
293.
14. Ozdogan, M., Yang, Y., Allez, G., & Cervantes, C. (2010). Remote sensing of irrigated ag-
riculture: Opportunities and challenges. Remote sensing, 2(9), 2274-2304.
15. Ozdogan, M., & Gutman, G. (2008). A new methodology to map irrigated areas using
multi-temporal MODIS and ancillary data: An application example in the continental
US. Remote Sensing of Environment, 112(9), 3520-3537.
16. Vibhute, A., & Bodhe, S. K. (2012). Applications of image processing in agriculture: a
survey. International Journal of Computer Applications, 52(2).
17. Zheng, B., Myint, S. W., Thenkabail, P. S., & Aggarwal, R. M. (2015). A support vector
machine to identify irrigated crop types using time-series Landsat NDVI data. International
Journal of Applied Earth Observation and Geoinformation, 34, 103-112.
18. Radhika, Y., & Shashi, M. (2009). Atmospheric temperature prediction using support vec-
tor machines. International journal of computer theory and engineering, 1(1), 55.
19. Khan, M. S., & Coulibaly, P. (2006). Application of support vector machine in lake water
level prediction. Journal of Hydrologic Engineering, 11(3), 199-205.
20. Sapankevych, N. I., & Sankar, R. (2009). Time series prediction using support vector ma-
chines: a survey. IEEE Computational Intelligence Magazine, 4(2).