an observation-constrained multi-physics wrf ensemble for
TRANSCRIPT
Geosci. Model Dev., 8, 2285–2298, 2015
www.geosci-model-dev.net/8/2285/2015/
doi:10.5194/gmd-8-2285-2015
© Author(s) 2015. CC Attribution 3.0 License.
An observation-constrained multi-physics WRF ensemble for
simulating European mega heat waves
A. I. Stegehuis1, R. Vautard1, P. Ciais1, A. J. Teuling2, D. G. Miralles3,4, and M. Wild5
1LSCE/IPSL, Laboratoire CEA/CNRS/UVSQ, Gif-sur-Yvette, France2Hydrology and Quantitative Water Management Group, Wageningen University, the Netherlands3Department of Earth Sciences, VU University Amsterdam, Amsterdam, the Netherlands4Laboratory of Hydrology and Water Management, Ghent University, Ghent, Belgium5ETH Zurich, Zurich, Switzerland
Correspondence to: A. I. Stegehuis ([email protected])
Received: 8 September 2014 – Published in Geosci. Model Dev. Discuss.: 19 November 2014
Revised: 5 May 2015 – Accepted: 23 June 2015 – Published: 29 July 2015
Abstract. Many climate models have difficulties in prop-
erly reproducing climate extremes, such as heat wave con-
ditions. Here we use the Weather Research and Forecasting
(WRF) regional climate model with a large combination of
different atmospheric physics schemes, in combination with
the NOAH land-surface scheme, with the goal of detecting
the most sensitive physics and identifying those that appear
most suitable for simulating the heat wave events of 2003
in western Europe and 2010 in Russia. In total, 55 out of
216 simulations combining different atmospheric physical
schemes have a temperature bias smaller than 1 ◦C during
the heat wave episodes, the majority of simulations showing
a cold bias of on average 2–3 ◦C. Conversely, precipitation
is mostly overestimated prior to heat waves, and shortwave
radiation is slightly overestimated. Convection is found to be
the most sensitive atmospheric physical process impacting
simulated heat wave temperature across four different con-
vection schemes in the simulation ensemble. Based on these
comparisons, we design a reduced ensemble of five well per-
forming and diverse scheme configurations, which may be
used in the future to perform heat wave analysis and to in-
vestigate the impact of climate change during summer in Eu-
rope.
1 Introduction
An increasing number of simulations and studies project a
higher frequency of several types of extreme weather events
in the future (e.g., Schär et al., 2004; Meehl et al., 2004;
Della-Marta et al., 2007; Beniston et al., 2007; Kuglitsch et
al., 2010; Fischer and Schär, 2010; Seneviratne et al., 2012;
Orlowsky and Seneviratne, 2012). Since summer heat waves
are among the most impacting of such phenomena – threaten-
ing society and ecosystems – climate models used for future
projections must provide accurate simulations of these phe-
nomena, or at least their uncertainties should be documented.
Even if climate models have been evaluated using observed
weather in past decades, it is unclear whether they will be
able to simulate extreme heat waves in future climates that
may not have analogues in the historical record. At a min-
imum, models should be able to reproduce the conditions
measured during recent extreme heat wave cases, some of
them having been shown to be unprecedented when consid-
ering the climate over the past 5 or 6 centuries (Chuine et al.,
2004; Luterbacher et al., 2010; García-Herrera et al., 2010;
Barriopedro et al., 2011; Tingley and Huybers, 2013).
Given the importance of forecasting summer heat waves
well in advance, many studies have analyzed their pre-
dictability, which remains poor in seasonal forecasts. For
instance, the 2003 European heat wave was not simulated
realistically (neither timing nor intensity) by the opera-
tional European Centre for Medium-Range Weather Fore-
casts (ECMWF) system, but improvements were clear with
Published by Copernicus Publications on behalf of the European Geosciences Union.

2286 A. I. Stegehuis et al.: Multi-physics WRF ensemble for simulating European mega heat waves
the use of a new land-surface hydrology, convection and ra-
diation schemes (e.g., Weisheimer et al., 2011; Dole et al.,
2011; Koster et al., 2010; van den Hurk et al., 2012). How-
ever, seasonal forecasting experiments do not straightfor-
wardly allow for the assessment of a model’s physical pro-
cesses underlying extreme temperatures during heat waves
because it is difficult to separate model biases due to defi-
ciencies in the model representation from sensitivity to initial
conditions. These may inhibit the effect of the representation
of physical processes in reproducing the exact atmospheric
circulation when starting simulations at the beginning of the
season.
From a statistical perspective, extreme temperatures have
been found to be reasonably well represented in global sim-
ulations of the current climate (IPCC, 2013), as well as
in regional simulations (Nikulin et al., 2010). In recent re-
gional modeling evaluation experiments, using an ensemble
of state-of-the-art regional models guided by re-analysis at
the boundaries of a European domain, summer extreme sea-
sonal temperatures were shown to be simulated with biases in
the range of a few degrees (Vautard et al., 2013). Individual
mega heat waves (2003 in western Europe, 2010 in Russia)
were reproduced by most models. However, it was difficult
to infer whether these models could also simulate associated
processes leading to the extreme heat waves. The exact same
events with similar atmospheric flow and persistence could
not be reproduced due to internal variability (internal degrees
of freedom) of the models.
A comprehensive assessment of simulations of recent
mega heat waves has only been the object of a limited num-
ber of such studies. Process-oriented studies of high extreme
temperatures over Europe have focused on land–atmosphere
feedbacks (e.g., Seneviratne et al., 2006, 2010; Fischer et
al., 2007; Teuling et al., 2009; Stegehuis et al., 2013; Mi-
ralles et al., 2014) because, beyond atmospheric synoptic
circulation, these feedbacks are known to play an impor-
tant role in summer heat waves. However, the sensitivity
of simulated heat wave conditions to physical processes in
models has not yet been explored in a systematic way. This
could be important because error compensation among pro-
cesses that involve land–atmosphere interactions, radiation
and clouds may cause high temperatures for the wrong rea-
sons (Lenderink et al., 2007).
The goal of the present study is threefold. First we exam-
ine the ability of a regional climate model, Weather Research
and Forecast (WRF, Skamarock et al., 2008), to simulate re-
cent European mega heat waves with a number of differ-
ent model configurations. Analysis of these experiments then
allows understanding which physical parameterizations are
prone to reproduce the build up of extreme temperatures and
thus the need for carefully constraining them in order to sim-
ulate these events properly. Finally, using observational con-
straints of temperature, precipitation and radiation, we select
a reduced ensemble of WRF configurations that best sim-
ulates European heat waves with different sets of physical
schemes combinations. This constrained multi-physics en-
semble aims therefore at spanning a range of possible physi-
cal parameterizations in extreme heat wave cases while keep-
ing simulations close to observations.
Our multi-physics regional ensemble approach contrasts
with the classical multi-model ensembles that are constructed
by the availability of model simulations in coordinated exper-
iments (see e.g., Déqué et al., 2007, and references therein) or
by arbitrarily configured combinations of parameterizations
selected by different groups using the same model system
(García-Díez et al., 2015). In the latter ensemble, the lack
of overall design strategy may lead the uncertainty estima-
tion to be biased and the models to be farther from obser-
vations. In addition, the real cause of model spread is dif-
ficult to understand because of shortcomings in the repre-
sentation of physical processes and their interactions. Re-
gional perturbed-physics or multi-physics ensembles could
help understand and constrain uncertainties more effectively,
but so far they have been seldom explored. García-Díez et
al. (2015) showed that even a small multi-physics ensemble
confronted to several climate variable observations can help
diagnose mean biases of a regional climate model. Bellprat et
al. (2012) showed that a well-constrained perturbed-physics
ensemble may encompass the observations. Their perturbed-
physics ensemble was designed by varying the values of a
number of free parameters and selecting only the configu-
rations that were closest to the observations; however, the
number of combinations of different physical parameteriza-
tion schemes was limited to a total of eight different config-
urations.
The WRF model offers several parameterization schemes
for most physical processes, and is thus suitable for a multi-
physics approach. In fact, a WRF multi-physics approach has
been used in several studies (e.g., García-Díez et al., 2011;
Evans et al., 2012; Awan et al., 2011; Mooney et al., 2013),
also with its predecessor MM5, but not specifically to simu-
late extreme heat waves.
Here we run an ensemble of 216 configurations of WRF
physical parameterizations and compare each simulation
with a set of observations of relevant variables in order to
select a reduced set of five configurations that best represent
European summer mega heat waves. The evaluation is made
over the extreme 2003 and 2010 events. The ensemble is also
evaluated for a more regular summer (2007) in order to test
the model configurations under non-heat wave conditions.
2 Methods
2.1 Simulations and general model setup
We use the WRF version 3.3.1 and simulate the 3 summers
(2003, 2007, 2010) using an ensemble of physics scheme
combinations. We first test the time necessary to initialize the
soil moisture on a limited number of cases. Soil conditions
Geosci. Model Dev., 8, 2285–2298, 2015 www.geosci-model-dev.net/8/2285/2015/

A. I. Stegehuis et al.: Multi-physics WRF ensemble for simulating European mega heat waves 2287
Table 1. Physics schemes used in this study (with references). All possible permutations are made, yielding a total of 216 simulations. The
numbers in the table refer to the number the schemes have in the Weather Research and Forecasting (WRF) model.
Microphysics (MP) PBL+ surface (PBL-
SF)
Radiation (RA) Convection (CU) Soil
(6) WRF-SM6 (Hong
and Lim, 2006)
(1-1) Yonsei Uni-
MM5 (Hong et al.,
2006; Beljaars, 1994)
(3) CAM (Collins et
al., 2004)
(1) Kain-Fritsch
(Kain, 2004)
(2) NOAH (Tewari et
al., 2004)
(8) New Thompson
(Thompson et al.,
2008)
(2-2) MYJ-ETA (Jan-
jic, 1994, 2002)
(4) RRTMG (Iacono
et al., 2008)
(3) Grell–Devenyi
(Grell and Devenyi,
2002)
(10) Morrison DM
(Morrison et al.,
2009)
(4-4) QNSE-QNSE
(Sukoriansky et al.,
2005)
(5) Goddard (Chou
and Suarez, 1999)
(6) Tiedtke (Tiedtke,
1989; Zhang et al.,
2011)
(5-2) MYNN-ETA
(Nakanishi and Niino,
2006, 2009; Janjic,
2002)
(14) New SAS (Han
and Pan, 2011)
(5-5) MYNN-MYNN
(Nakanishi and Niino,
2006, 2009)
(7-1) ACM2-MM5
(Pleim, 2007; Bel-
jaars, 1994)
are initialized using the ERA-Interim (Dee et al., 2011) soil
moisture and temperatures; thereafter, soil moisture and air
temperature are calculated as prognostic variables by WRF.
For the August 2003 case, we find that temperatures differ
by less than 0.5 ◦C among one another when starting exper-
iments before 1 May. Thus, in the current study, each sim-
ulation is run from the beginning of May to the end of Au-
gust for the years 2003, 2007 and 2010. The regional domain
considered is the EURO-CORDEX domain (European Coor-
dinated Downscaling Experiment; Jacob et al., 2014; Vautard
et al., 2013) and the low-resolution setup of 50km× 50km
(∼ 0.44◦ on a rotated lat–long grid) is used – note that Vau-
tard et al. (2013) recently concluded that a higher spatial
resolution did not provide a substantial improvement in heat
wave simulations. We use a vertical resolution with 32 lev-
els for WRF. Boundary conditions come from ERA-Interim,
including sea surface temperatures, initial snow cover, and
soil moisture and temperature. In order to focus on physi-
cal processes in the boundary layer and the soil–atmosphere
interface, and to avoid chaotic evolution of large-scale at-
mospheric circulation, we constrain the model wind fields
with ERA-Interim re-analyses above model level #15 (about
3000 m), similar to previous studies (Vautard et al., 2014), us-
ing grid nudging, with a relaxation coefficient of 5.10−5 s−1
corresponding to a relaxation time approximately equivalent
to the input frequency (every 6 h) (Omrani et al., 2013). Tem-
perature and water vapor were not constrained, to allow feed-
backs to fully develop.
2.2 Physics schemes
We test 216 combinations of physics schemes. We con-
sider different physics of the planetary boundary layer and
surface layer (PBL; six schemes), microphysics (MP; three
schemes), radiation (RA; three schemes) and of convection
(CU; four schemes). For each type of scheme, a few options
were selected among the ensemble of possibilities offered in
WRF. The selection was made to avoid variants of the same
scheme and to maximize the difference of temperature and
precipitation outputs in preliminary experiments. At the time
of study and model development stage, different land-surface
schemes were available in WRF: five-layer thermal diffusion
scheme (Dudhia, 1996), NOAH (Tewari et al., 2004), Rapid
Update Cycle (RUC) (Benjamin et al., 2004) and Pleim–Xiu
(Gilliam and Pleim, 2010). We decided however to only use
one, the NOAH land-surface scheme in order to focus our
study on atmospheric processes, while limiting the number
of simulations, and because the NOAH scheme is the most
widely used in WRF applications. This was also motivated
by the poor performance and extreme sensitivity of the RUC
land-surface scheme for the land latent and sensible heat
fluxes as compared with local observations in 2003. It simu-
lates strong latent heat fluxes in the beginning of the season
www.geosci-model-dev.net/8/2285/2015/ Geosci. Model Dev., 8, 2285–2298, 2015

2288 A. I. Stegehuis et al.: Multi-physics WRF ensemble for simulating European mega heat waves
●●●●●●
●●●●●●
●●●●●●
●●●●●●
●●●●●●
●●●●●●
●●●●●●
●●●●●●
●●●●●●
●●●●●●
●●●●●●
●●●●●●
●●●●●●
●●●●●●
●●●●●●
●●●●●●
●●●●●●
●●●●●●
●●●●●●
●●●●●●
●●●●●●
120 140 160 180 200 220 240
0
50
100
150
200
250
300
ATneu (47N,11E) − GRA
FLUXNETNOAHRUC
●●●●●●
●●●●●●
●●●●●●
●●●●●●
●●●●●●
●●●●●●
●●●●●●
●●●●●●
●●●●●●
●●●●●●
●●●●●●
●●●●●●
●●●●●●
●●●●●●
●●●●●●
●●●●●●
●●●●●●
●●●●●●
●●●●●●
●●●●●●
●●●●●●
120 140 160 180 200 220 240
0
50
100
150
200
250
300
DEtha (51N,4E) − ENF
●●●●●●
●●●●●●
●●●●●●
●●●●●●
●●●●●●
●●●●●●
●●●●●●
●●●●●●
●●●●●●
●●●●●●
●●●●●●
●●●●●●
●●●●●●
●●●●●●
●●●●●●
●●●●●●
●●●●●●
●●●●●●
●●●●●●
●●●●●●
●●●●●●
120 140 160 180 200 220 240
0
50
100
150
200
250
300
DKsor (55N,11E) − DBF
●●●●●●
●●●●●●
●●●●●●
●●●●●●
●●●●●●
●●●●●●
●●●●●●
●●●●●●
●●●●●●
●●●●●●
●●●●●●
●●●●●●
●●●●●●
●●●●●●
●●●●●●
●●●●●●
●●●●●●
●●●●●●
●●●●●●
●●●●●●
●●●●●●
120 140 160 180 200 220 240
−100
−50
0
50
100
150
200
ATneu (47N,11E) − GRA
●●●●●●
●●●●●●
●●●●●●
●●●●●●
●●●●●●
●●●●●●
●●●●●●
●●●●●●
●●●●●●
●●●●●●
●●●●●●
●●●●●●
●●●●●●
●●●●●●
●●●●●●
●●●●●●
●●●●●●
●●●●●●
●●●●●●
●●●●●●
●●●●●●
120 140 160 180 200 220 240
−100
−50
0
50
100
150
200
DEtha (51N,4E) − ENF
●●●●●●
●●●●●●
●●●●●●
●●●●●●
●●●●●●
●●●●●●
●●●●●●
●●●●●●
●●●●●●
●●●●●●
●●●●●●
●●●●●●
●●●●●●
●●●●●●
●●●●●●
●●●●●●
●●●●●●
●●●●●●
●●●●●●
●●●●●●
●●●●●●
120 140 160 180 200 220 240
−100
−50
0
50
100
150
200
DKsor (55N,11E) − DBF
●●●●●●
●●●●●●
●●●●●●
●●●●●●
●●●●●●
●●●●●●
●●●●●●
●●●●●●
●●●●●●
●●●●●●
●●●●●●
●●●●●●
●●●●●●
●●●●●●
●●●●●●
●●●●●●
●●●●●●
●●●●●●
●●●●●●
●●●●●●
●●●●●●
120 140 160 180 200 220 240
0.0
0.5
1.0
1.5
2.0
ATneu (47N,11E) − GRA
●●●●●●
●●●●●●
●●●●●●
●●●●●●
●●●●●●
●●●●●●
●●●●●●
●●●●●●
●●●●●●
●●●●●●
●●●●●●
●●●●●●
●●●●●●
●●●●●●
●●●●●●
●●●●●●
●●●●●●
●●●●●●
●●●●●●
●●●●●●
●●●●●●
120 140 160 180 200 220 240
0.0
0.5
1.0
1.5
2.0
DEtha (51N,4E) − ENF
●●●●●●
●●●●●●
●●●●●●
●●●●●●
●●●●●●
●●●●●●
●●●●●●
●●●●●●
●●●●●●
●●●●●●
●●●●●●
●●●●●●
●●●●●●
●●●●●●
●●●●●●
●●●●●●
●●●●●●
●●●●●●
●●●●●●
●●●●●●
●●●●●●
120 140 160 180 200 220 240
0.0
0.5
1.0
1.5
2.0
DKsor (55N,11E) − DBF
LH (
Wm
−2)
SH
(W
m−2
)E
F (
Wm
−2)
Time (DOY)Time (DOY)Time (DOY)
Figure 1. Time series of daily land heat fluxes in 2003 from May to the end of August on three different FLUXNET sites, with latent heat
flux (LH) on the first row, sensible heat flux (SH) on the second row, and evaporative fraction (EF – latent heat flux divided by the sum of
latent and sensible heat flux) on the last row (DOY is day of year). The three columns represent three sites, with Neustift/Stubai (Austria –
ATneu 47◦ N, 11◦ E) in the first column, Tharandt (Germany – DETha, 51◦ N, 4◦ E) in the second, and Soroe-LilleBogeskov (Denmark –
DKsor, 66◦ N, 11◦ E) in the third column. Vegetation types on the three sites are respectively grassland (GRA), evergreen needleleaf forest
(ENF), and deciduous broadleaf forest (DBF). In gray all 216 simulations with the NOAH scheme. Observational data is shown in black
(FLUXNET). The green line is one configuration with NOAH, while the blue line represents the same configuration but with RUC instead
of NOAH.
and an extreme drying at the end, while sensible heat flux is
overestimated. The NOAH scheme appeared more realistic
and robust in the tests that were done for capturing both latent
and sensible heat fluxes during the 2003 heat wave at selected
flux tower sites in western Europe (Fig. 1). Furthermore, the
Pleim–Xiu scheme is especially recommended for retrospec-
tive air quality simulations and is developed with a specific
surface layer scheme as coupled configuration (Gilliam and
Pleim, 2010). The last possible option is the five-layer ther-
mal diffusion scheme (Dudhia, 1996) which predicts ground
and soil temperatures but no soil moisture and is therefore
also not suitable for our study. Table 1 describes the physical
schemes that were combined to simulate the weather over the
3 summer seasons.
2.3 Observational data
In order to evaluate the ensemble and to rank and select its
best-performing simulations, we use gridded observed daily
temperature and precipitation from E-OBS with a 0.25◦ res-
olution (version 7.0) (Haylock et al., 2008). Bilinear interpo-
lation is used to regrid E-OBS data and the model output to
the same grid. Furthermore, we use station data of monthly
global radiation from the Global Energy Balance Archive
(GEBA) network (Wild et al., 2009). For France 2003 the
Geosci. Model Dev., 8, 2285–2298, 2015 www.geosci-model-dev.net/8/2285/2015/
A. I. Stegehuis et al.: Multi-physics WRF ensemble for simulating European mega heat waves 2289
−20 −10 0 10 20 30
2030
4050
6070
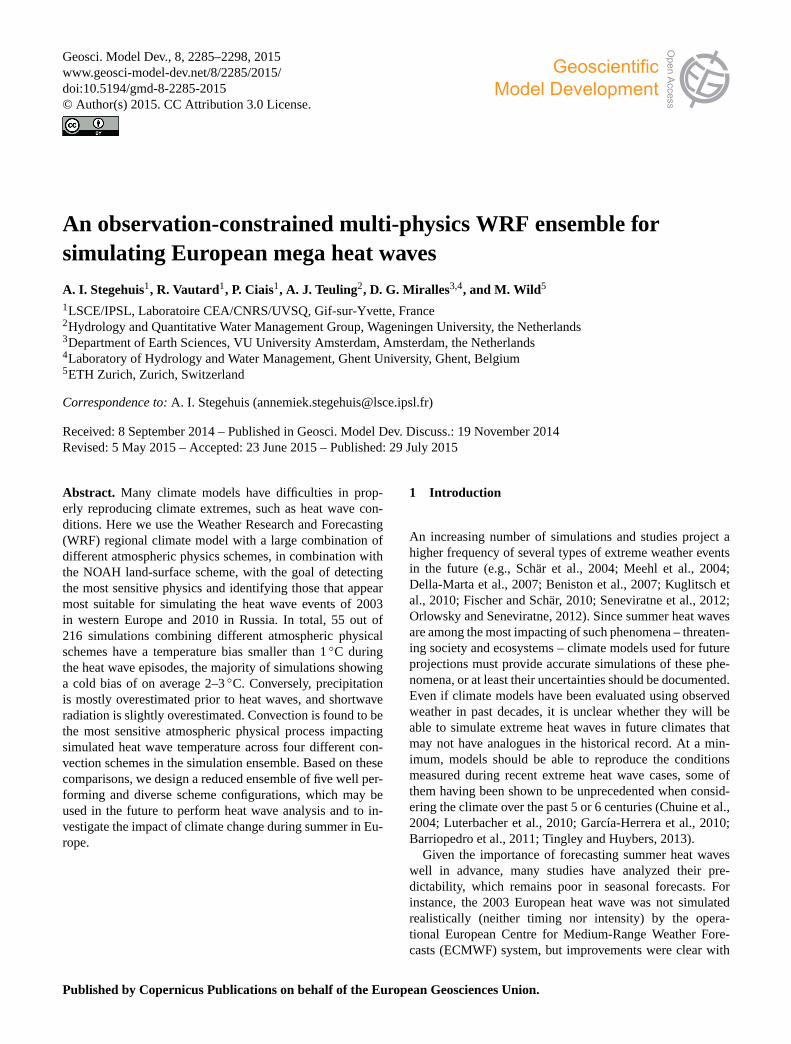
Figure 2. Domains used in this study: France, Iberian Peninsula,
Russia and Scandinavia.
data of 21 stations were available, for 2007 this number was
20. Observations over Russia were too scarce and have there-
fore not been considered. Model data are interpolated to these
stations using the nearest neighbor method. In addition, in
order to check land–atmosphere fluxes and the partitioning
of net radiation into sensible and latent heat fluxes, we use
the satellite observation-driven estimates of daily latent heat
fluxes from GLEAM (Miralles et al., 2011). Since the lat-
ter is not a direct measurement we do not use them to rank
the model configurations. Furthermore, latent and sensible
heat flux measurements are used from three FLUXNET sites
(Neustift/Stubai – Austria (Wohlfahrt et al., 2010); Tharandt-
Anchor station – Germany (Grünwald and Bernhofer, 2007);
and Soroe-LilleBogeskov – Denmark (Pilegaard et al., 2011),
from the Carbon-Extreme database), for the evaluation of the
land-surface schemes.
2.4 Evaluation and ranking of model simulations
For ranking, we set up several measures of model skill based
on the differences between observed and simulated spa-
tial averages over two domains: France for 2003 and 2007
(5◦W–5◦ E, 44–50◦ N), and Russia for 2007 and 2010 (25–
60◦ E and 50–60◦ N) (Fig. 2). A first scheme selection is
made based on the skill to reproduce air temperature dynam-
ics, since this is the primary impacted variable, while cor-
responding observations are reliable. Because we are inter-
ested in heat waves, we select only those simulations that are
within a 1 K regional average difference between simulated
and observed temperature, for heat wave periods; these pe-
riods are defined as 1–15 August for France (in 2003), and
1 July till 15 August for Russia (in 2010). The 1 K thresh-
old was arbitrarily chosen and is used to avoid processing
a large number of simulations that have unrealistic temper-
atures. Only 55 of the 216 simulations meet this criterion
and are further considered. Then, the ranking of the retained
simulations is done based on (i) the daily temperature differ-
ence between simulations and observations during the heat
wave periods (as above for 2003 and 2010), and during the
period 1–31 August for the normal year 2007; and (ii) the
root mean square error of monthly precipitation and radia-
tion for the months July, June and August. The GEBA data
set only contains scarce radiation observations over Russia
and therefore we could not consider this region for rank-
ing models against incoming shortwave radiation. As a fi-
nal step, an overall ranking is proposed by averaging the
ranks obtained from the three variables (temperature, precip-
itation and radiation). From this final ranking, and in order
to select an elite of multi-physics combinations, we selected
the top-five highest-ranked configurations. Note that obser-
vational uncertainty is not considered in this study, which
was shown to potentially impact model ranking over Spain
(Gomez-Navarro et al., 2012).
3 Results
3.1 Large systematic errors found during heat wave
periods
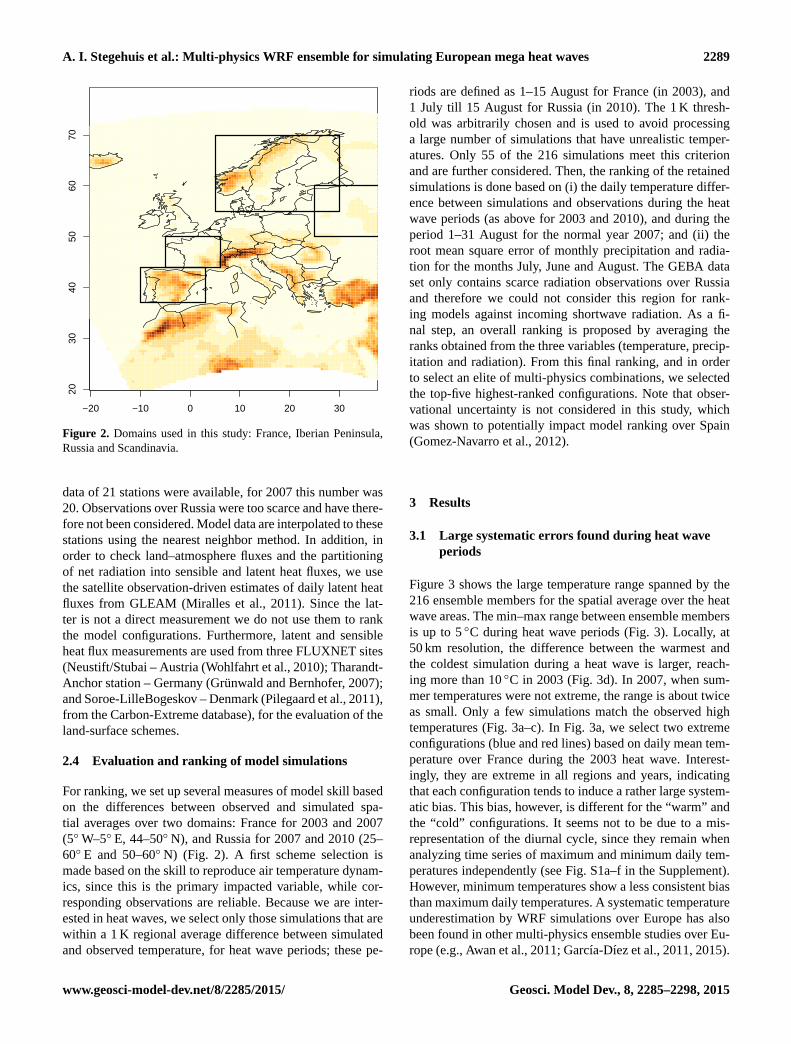
Figure 3 shows the large temperature range spanned by the
216 ensemble members for the spatial average over the heat
wave areas. The min–max range between ensemble members
is up to 5 ◦C during heat wave periods (Fig. 3). Locally, at
50 km resolution, the difference between the warmest and
the coldest simulation during a heat wave is larger, reach-
ing more than 10 ◦C in 2003 (Fig. 3d). In 2007, when sum-
mer temperatures were not extreme, the range is about twice
as small. Only a few simulations match the observed high
temperatures (Fig. 3a–c). In Fig. 3a, we select two extreme
configurations (blue and red lines) based on daily mean tem-
perature over France during the 2003 heat wave. Interest-
ingly, they are extreme in all regions and years, indicating
that each configuration tends to induce a rather large system-
atic bias. This bias, however, is different for the “warm” and
the “cold” configurations. It seems not to be due to a mis-
representation of the diurnal cycle, since they remain when
analyzing time series of maximum and minimum daily tem-
peratures independently (see Fig. S1a–f in the Supplement).
However, minimum temperatures show a less consistent bias
than maximum daily temperatures. A systematic temperature
underestimation by WRF simulations over Europe has also
been found in other multi-physics ensemble studies over Eu-
rope (e.g., Awan et al., 2011; García-Díez et al., 2011, 2015).
www.geosci-model-dev.net/8/2285/2015/ Geosci. Model Dev., 8, 2285–2298, 2015
2290 A. I. Stegehuis et al.: Multi-physics WRF ensemble for simulating European mega heat waves
●●●●
●●●●
●●●●
●●●●
●●●●
●●●●
●●●●
●●●●
●●●●
●●●●
●●●●
●●●●
●●●●
●●●●
●●●●
●●●●
●●●●
●●●●
●●●●
●●●●
●●●●
●●●●
●●●●
●●●●
●●●●
●●●●
●●●●
●●●●
●●●●
●●●●
●●●●
●●
120 140 160 180 200 220 240
5
10
15
20
25
30
Time (Day Of Year)
Tem
pera
ture
(°C
)
FRANCE 2003(a)
●●●●
●●●●
●●●●
●●●●
●●●●
●●●●
●●●●
●●●●
●●●●
●●●●
●●●●
●●●●
●●●●
●●●●
●●●●
●●●●
●●●●
●●●●
●●●●
●●●●
●●●●
●●●●
●●●●
●●●●
●●●●
●●●●
●●●●
●●●●
●●●●
●●●●
●●●●
●●
120 140 160 180 200 220 240
5
10
15
20
25
30
Time (Day Of Year)
Tem
pera
ture
(°C
)
FRANCE 2007(b)
●●●●
●●●●
●●●●
●●●●
●●●●
●●●●
●●●●
●●●●
●●●●
●●●●
●●●●
●●●●
●●●●
●●●●
●●●●
●●●●
●●●●
●●●●
●●●●
●●●●
●●●●
●●●●
●●●●
●●●●
●●●●
●●●●
●●●●
●●●●
●●●●
●●●●
●●●●
●●
120 140 160 180 200 220 240
5
10
15
20
25
30
Time (Day Of Year)
Tem
pera
ture
(°C
)
RUSSIA 2010(c)
−20 0 20 40
35
40
45
50
55
60
65
70
2
4
6
8
10
K
(d)
Figure 3. Time series of daily mean temperature over France in 2003 (a) and 2007 (b) and Russia in 2010 (c). Every simulation is shown
in gray and observations of E-OBS in black. The blue and red lines are the coldest and the warmest simulations over France during the heat
wave. These lines have the same set of physics in all the figures (3, 4, 5). Panel (d) shows the simulated temperature min–max range during
the heat wave of 2003 (1–15 August). The range is calculated as the difference between the warmest simulation and the coldest simulation
during the heat wave period between the 216 members of the ensemble.
0
1
2
3
4
5
Pre
cipi
tatio
n (m
m)
May June July August
FRANCE 2003
●
●
●●
●
● ● ●
●
●●
●
(a)
0
1
2
3
4
5
Pre
cipi
tatio
n (m
m)
May June July August
FRANCE 2007
●
●
●●
●
●●
●
●
●
●
●
(b)
0
1
2
3
4
5
Pre
cipi
tatio
n (m
m)
May June July August
RUSSIA 2010
● ●
●
●
●●
●
●
●●
●
●
(c)
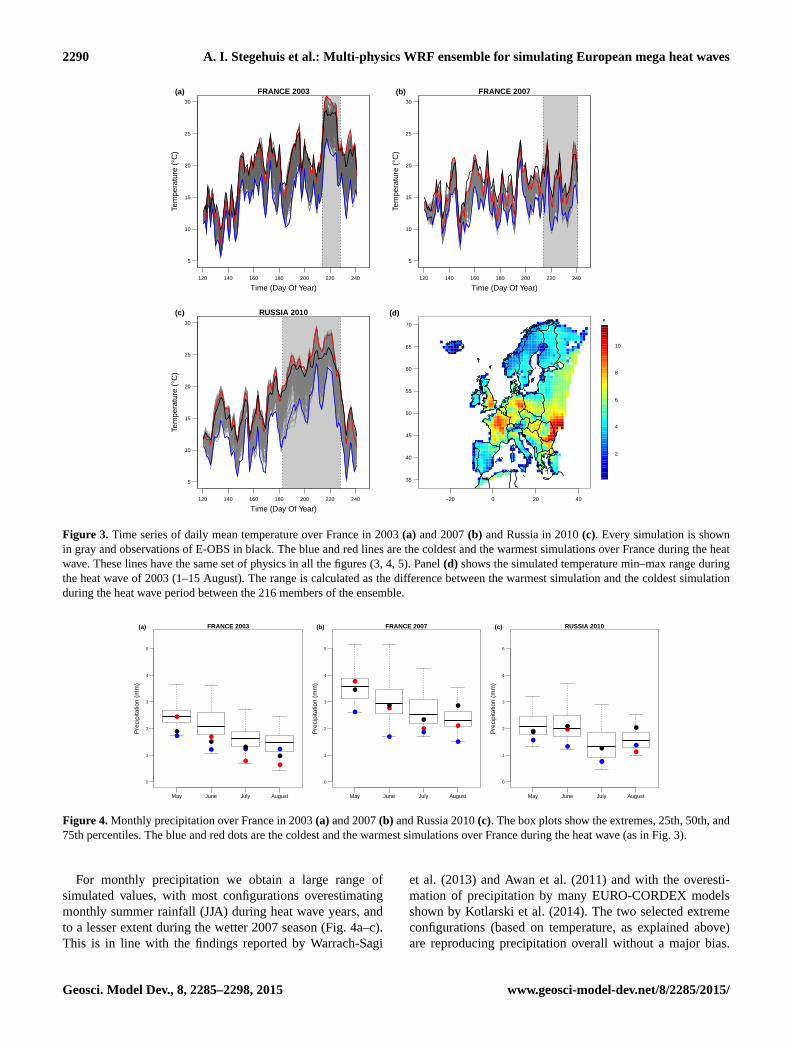
Figure 4. Monthly precipitation over France in 2003 (a) and 2007 (b) and Russia 2010 (c). The box plots show the extremes, 25th, 50th, and
75th percentiles. The blue and red dots are the coldest and the warmest simulations over France during the heat wave (as in Fig. 3).
For monthly precipitation we obtain a large range of
simulated values, with most configurations overestimating
monthly summer rainfall (JJA) during heat wave years, and
to a lesser extent during the wetter 2007 season (Fig. 4a–c).
This is in line with the findings reported by Warrach-Sagi
et al. (2013) and Awan et al. (2011) and with the overesti-
mation of precipitation by many EURO-CORDEX models
shown by Kotlarski et al. (2014). The two selected extreme
configurations (based on temperature, as explained above)
are reproducing precipitation overall without a major bias.
Geosci. Model Dev., 8, 2285–2298, 2015 www.geosci-model-dev.net/8/2285/2015/
A. I. Stegehuis et al.: Multi-physics WRF ensemble for simulating European mega heat waves 2291
●●
●
●
●
●
●
●
●
●
●
●
●
●
●
●
●
●
●●
●
●
●
● ●
●
●
●
●
●
●●
●
●
●
●
●●
●
●
●
●
●●
●
●
●
●
●
●
●
●●
●
0.18 0.20 0.22 0.24
18
19
20
21
22
23
24
25
●
cu=1cu=3cu=6cu=14
Soil moisture (m3m−3)
Tem
pera
ture
(°C
)
FRANCE 2003(a)
●
●
●
●●
●
●
●
●
●
●
●
●
●
●
●
●
●
●●
●
●
●
●
●●
●
●
●
●
●●
●
●
●
●
●
●
●
●
●
●
●●
●
●
●
●
●
●
●
● ●
●
●●
●
●
●●
●●
●
●
●
●
●●
●
●●
●
0.18 0.20 0.22 0.24
18
19
20
21
22
23
24
25
●
mp=6mp=8mp=10
Soil moisture (m3m−3)
Tem
pera
ture
(°C
)
FRANCE 2003(b)
●
●
●
●
●
●
●
●
●
●
●
●
●●
●
●
●
●
●
●
●
●
●
●
●●
●
●
●
●
●●
●
●
●
●
●
●
●
●
●
●
●●
●
●
●
●●
●
●
●
●
●
●
●
●
●
●●
●●
●
●
●
●
●
●
●
●
●
●
0.18 0.20 0.22 0.24
18
19
20
21
22
23
24
25
●
ra=3ra=4ra=5
Soil moisture (m3m−3)
Tem
pera
ture
(°C
)
FRANCE 2003(c)
●
●
●
●
●
●
●
●
●
●
●
●
●
●
●
●●
●
●
●
●
●
●
●
●
●
●
●
●
●
●
●●
●
●
●
0.18 0.20 0.22 0.24
18
19
20
21
22
23
24
25
●
bpl−sf=1−1bpl−sf=2−2bpl−sf=4−4bpl−sf=5−2bpl−sf=5−5bpl−sf=7−1
Soil moisture (m3m−3)
Tem
pera
ture
(°C
)
FRANCE 2003(d)
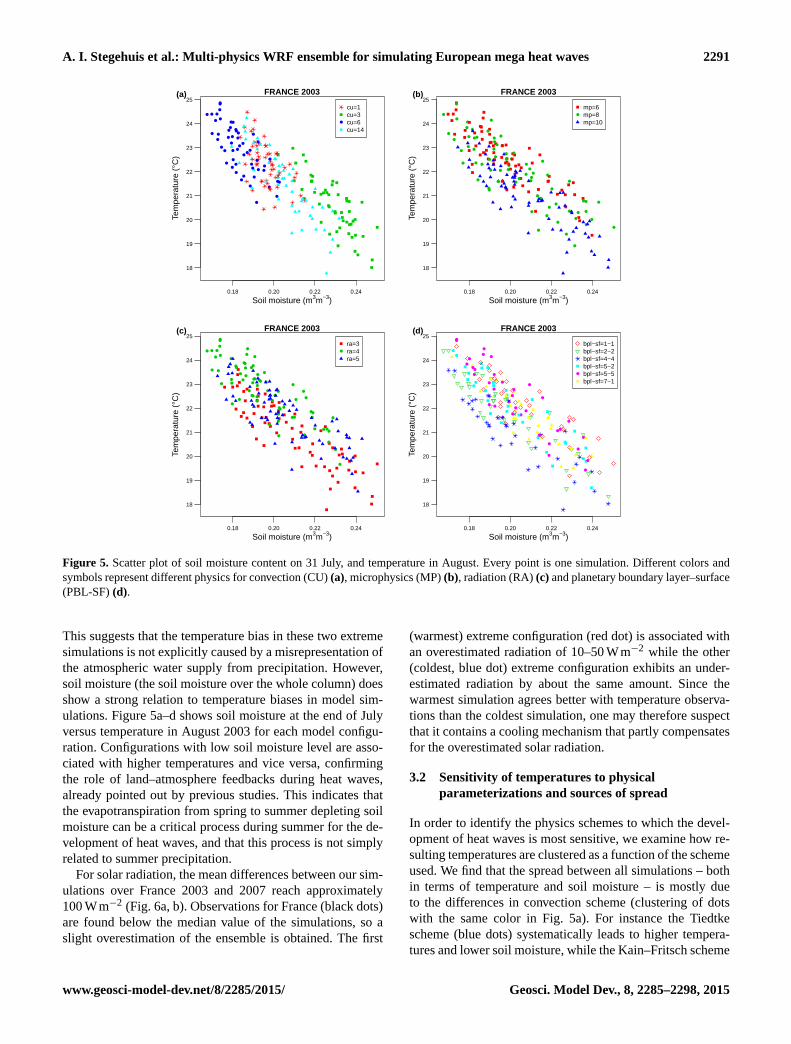
Figure 5. Scatter plot of soil moisture content on 31 July, and temperature in August. Every point is one simulation. Different colors and
symbols represent different physics for convection (CU) (a), microphysics (MP) (b), radiation (RA) (c) and planetary boundary layer–surface
(PBL-SF) (d).
This suggests that the temperature bias in these two extreme
simulations is not explicitly caused by a misrepresentation of
the atmospheric water supply from precipitation. However,
soil moisture (the soil moisture over the whole column) does
show a strong relation to temperature biases in model sim-
ulations. Figure 5a–d shows soil moisture at the end of July
versus temperature in August 2003 for each model configu-
ration. Configurations with low soil moisture level are asso-
ciated with higher temperatures and vice versa, confirming
the role of land–atmosphere feedbacks during heat waves,
already pointed out by previous studies. This indicates that
the evapotranspiration from spring to summer depleting soil
moisture can be a critical process during summer for the de-
velopment of heat waves, and that this process is not simply
related to summer precipitation.
For solar radiation, the mean differences between our sim-
ulations over France 2003 and 2007 reach approximately
100 Wm−2 (Fig. 6a, b). Observations for France (black dots)
are found below the median value of the simulations, so a
slight overestimation of the ensemble is obtained. The first
(warmest) extreme configuration (red dot) is associated with
an overestimated radiation of 10–50 Wm−2 while the other
(coldest, blue dot) extreme configuration exhibits an under-
estimated radiation by about the same amount. Since the
warmest simulation agrees better with temperature observa-
tions than the coldest simulation, one may therefore suspect
that it contains a cooling mechanism that partly compensates
for the overestimated solar radiation.
3.2 Sensitivity of temperatures to physical
parameterizations and sources of spread
In order to identify the physics schemes to which the devel-
opment of heat waves is most sensitive, we examine how re-
sulting temperatures are clustered as a function of the scheme
used. We find that the spread between all simulations – both
in terms of temperature and soil moisture – is mostly due
to the differences in convection scheme (clustering of dots
with the same color in Fig. 5a). For instance the Tiedtke
scheme (blue dots) systematically leads to higher tempera-
tures and lower soil moisture, while the Kain–Fritsch scheme
www.geosci-model-dev.net/8/2285/2015/ Geosci. Model Dev., 8, 2285–2298, 2015

2292 A. I. Stegehuis et al.: Multi-physics WRF ensemble for simulating European mega heat waves
150
200
250
300
350
Glo
bal r
adia
tion
(Wm
−2)
May June July August
FRANCE 2003
●
●
●
●
●
●
●
●●
●
●
●
(a)
150
200
250
300
350
Glo
bal r
adia
tion
(Wm
−2)
May June July August
FRANCE 2007
●
●●
●
● ●
●
●
●
●
●
●
(b)
Figure 6. Monthly radiation over France in 2003 (a) and 2007 (b); no radiation data being available in Russia for 2010. The box plots show
the extremes, 25th, 50th, and 75th percentiles. The blue and red dots are the coldest and the warmest simulations over France during the heat
wave (as in Fig. 3).
Table 2. The five best-performing configurations of physics in ranked from the best to the fifth best.
Microphysics PBL-surface Radiation Convection Soil Rank
Morrison DM Yonsei Uni-MM5 RRTMG Tiedtke NOAH 1
WRF-SM6 MYNN-MYNN RRTMG Grell–Devenyi NOAH 2
WRF-SM6 ACM2-MM5 Goddard Tiedtke NOAH 3
New Thompson MYNN-MYNN RRTMG New SAS NOAH 4
New Thompson ACM2-MM5 RRTMG Tiedtke NOAH 5
(green dots) leads to wetter soils and lower temperatures, in-
hibiting heat waves. Microphysics and radiation schemes are
also contributing to the spread of simulated temperature and
soil moisture values (Fig. 5b, c), although their effect is less
marked than for convection. Heat wave temperatures and soil
moisture seem to be least sensitive to the planetary boundary
layer and surface layer physics schemes. The sensitivity of
the convection scheme in WRF has already been mentioned
in previous studies (Jankov et al., 2005; Awan et al., 2011;
Vautard et al., 2013; García-Díez et al., 2015). Note that the
soil moisture simulated in early August 2003 is better corre-
lated with preceding radiation than with precipitation (com-
pare Figs. S2 and S3), indicating that the way clouds, and
particularly convective clouds, affect radiation prior to the
onset of heat waves is a major driver of the spread for the de-
velopment of heat waves – higher radiation leading to drier
soils and higher temperatures during heat waves.
3.3 A constrained reduced ensemble of best simulations
Focusing only on the 55 selected simulations that differ less
than 1 ◦C from the observations during the heat waves, we
apply the ranking method introduced in Sect. 2 based on
temperature, precipitation and radiation model–observation
comparison metrics. The five highest-ranked simulations are
given in Table 2 and are actually the numbers 1–5 in Table S1
in the Supplement. Figure 7a confirms the ranking by show-
ing that these simulations also perform well in terms of tem-
perature, during the months prior to the heat wave. The same
is furthermore found for the years 2007 in France (Fig. S5)
and 2010 in Russia (Fig. S4), and also for other regions such
as the Iberian Peninsula and Scandinavia (Fig. S6a, d). The
selected simulations however performed less well for precip-
itation over France in 2003 (Fig. 7b), but do not show a large
overestimation of precipitation either. Precipitation over Rus-
sia for the five highest-ranked simulations does show good
performance (Fig. S4b), as well as for other European re-
gions (Fig. S6). The mean radiation of the ensemble of the
five best simulations is closer to the GEBA observations than
in the case of the original ensemble (Fig. 7c).
Nonetheless, the better match of the reduced ensemble of
the five highest-ranked simulations to the observations of
temperature, precipitation and radiation is to a very large de-
gree unsurprising: the selection was based on the fit to ob-
servations. However, it is still satisfactory to see that some
simulations are capable of matching all three variables. Con-
versely, we also compare simulations against another key
variable that was not used for evaluating and ranking simula-
tions, namely the latent heat flux (Fig. 7d). Albeit somehow
reduced compared to the full-ensemble spread, the spread
of the five best simulations for the latent heat flux remains
large over the whole period, on average between 50 and
Geosci. Model Dev., 8, 2285–2298, 2015 www.geosci-model-dev.net/8/2285/2015/

A. I. Stegehuis et al.: Multi-physics WRF ensemble for simulating European mega heat waves 2293
Table 3. Cross-comparison between France 2003 and Russia 2010. The (5, 10, 15, 20 and 25) best simulations, when only using one heat
wave to select the best configurations and vice versa, are taken and compared with their ranking for the other heat wave. If there would be no
correlation between the 2 years, the average ranking would lay approximately at half of the total number of simulations for both years that
lay within a first selection of 1 K (column eight). In bold the rankings that are lower than this number. Because observations of radiation are
lacking over Russia, we tested France with and without including radiation in the ranking.
Average ranking of 5, 10, 15, 20 and 25 best simulations Number of simulations
5 10 15 20 25 within 1 ◦C
With radiation average rank Fr–Ru 22.6 21.8 25.3 23.1 27.5 104
With radiation average rank Ru–Fr 15.75 15.2 14.7 13 39.3 58
Without radiation average rank Fr–Ru 53 37 28.4 27.6 25.5 104
Without radiation average rank Ru–Fr 20.25 16.8 18.1 17 19.9 58
●●●●
●●●●
●●●●
●●●●
●●●●
●●●●
●●●●
●●●●
●●●●
●●●●
●●●●
●●●●
●●●●
●●●●
●●●●
●●●●
●●●●
●●●●
●●●●
●●●●
●●●●
●●●●
●●●●
●●●●
●●●●
●●●●
●●●●
●●●●
●●●●
●●●●
●
120 140 160 180 200 220 240
5
10
15
20
25
30
Time (DOY)
Tem
pera
ture
(°C
)
FRANCE 2003
12345EOBS
(a)
0.5
1.0
1.5
2.0
2.5
3.0
3.5
Pre
cipi
tatio
n (m
m)
May June July August
FRANCE 2003
●
●
●
●
●
●
● ●
●
●
12345EOBS
(b)
200
250
300
350
Glo
bal r
adia
tion
(Wm
−2)
May June July August
FRANCE 2003
●
●
●
●
●
●
●
●
●
●
12345GEBA
(c)
●●●●
●●●●
●●●●
●●●●
●●●●
●●●●
●●●●
●●●●
●●●●
●●●●
●●●●
●●●●
●●●●
●●●●
●●●●
●●●●
●●●●
●●●●
●●●●
●●●●
●●●●
●●●●
●●●●
●●●●
●●●●
●●●●
●●●●
●●●●
●●●●
●●●●
●●●●
●●
120 140 160 180 200 220 240
0
50
100
150
200
Time (DOY)
Late
nt h
eat f
lux
(Wm
−2)
FRANCE 2003
12345GLEAM
(d)
Figure 7. Daily time series of temperature (a) and latent heat flux (c), monthly time series of precipitation (b) and incoming shortwave
radiation (d). Observations are shown in black and the five best-performing runs in colors. Gray lines indicate other simulations. All figures
are a spatial average over France during summer 2003.
120 Wm−2 (observed values are around 75 Wm−2). How-
ever, during the 2003 heat wave over France, three of the
five best simulations exhibit a close resemblance to the latent
heat observations (approximately 5–10 Wm−2) (Fig. 7d).
The two simulations that are found to considerably overes-
timate latent heat flux by approximately 30–40 Wm−2 (as
compared to GLEAM) are those that use a different convec-
tion scheme than the Tiedtke scheme. The overestimation of
latent heat fluxes in these schemes is however not general-
ized for other regions and years (Figs. S4c, S5d, S6c, f–h),
for which the latent heat flux was fairly well simulated within
the range of uncertainty of GLEAM.
www.geosci-model-dev.net/8/2285/2015/ Geosci. Model Dev., 8, 2285–2298, 2015

2294 A. I. Stegehuis et al.: Multi-physics WRF ensemble for simulating European mega heat waves
●●
●●
●●
●●
●●
●●
●●
●●
●●
●●
●●
●●
●●
●●
●●
●●
●●
●●
●●
●●
●●
●●
●●
●●
●●
●●
●●
●●
●●
●●
●●
●●
●●
●●
●●
●●
●●
●●
●●
●●
●●
●●
●●
●●
●●
●●
●●
●●
●●
●●
●●
●●
●●
●●
●●
●●
●●
●●
●●
●●
●●
●●
●
120 140 160 180 200 220 240
−2
−1
01
23
Time (DOY)
Tem
pera
ture
(°C
)
FRANCE 2003
Figure 8. Sensitivity test of the initialization of soil moisture. Difference between the perturbed simulations (red indicates 20 % reduction
of initial soil moisture, blue 20 % enhancement) performed with the five highest-ranked configurations compared to their corresponding
“control” simulations. The darkest lines refer to the simulation conducted with the best-ranked configuration (1), while descending color
shade agrees with descending ranking (1–5).
A cross-comparison for the years 2003 and 2010, that is,
using only the 2010 heat wave to select schemes and verify
the performance of the selected schemes over 2003 and vice
versa, yields some promising results. Table 3 shows the av-
erage ranking of the best (5, 10, 15, 20 and 25) simulations.
When only using one heat wave to select the best configura-
tions, they all lie in the top-ranked half, and even higher in
the ranking in the case of the 2010 heat wave over Russia be-
ing used to select the best configurations. This suggests that
the selection based upon one heat wave in one region should
also provide better simulations for other heat waves or heat
waves in other areas, i.e., that the bias of a member of the
WRF ensemble is not local but at least regional at the scale
of western Europe.
4 Concluding remarks
In this study we designed and analyzed a large multi-physics
ensemble with the WRF model. It is made of all possible
combinations of a set of different atmospheric physics pa-
rameterization schemes. They were evaluated for their ability
to simulate the European heat waves of 2003 and 2010 us-
ing the regional climate model WRF based on temperature,
precipitation and shortwave radiation. Even though the sim-
ulations were constrained by grid nudging, the multi-physics
ensemble contained a large spread in temperature, precipita-
tion and incoming shortwave radiation, the three variables we
used to create an overall configuration ranking. Most simula-
tions systematically underestimate temperature and overesti-
mate precipitation during heat waves, a model pattern that
was already found in previous studies dealing with much
smaller ensembles (e.g., Awan et al., 2011; García-Díez et
al., 2011; Warrach-Sagi et al., 2013). The spread among en-
semble members is amplified during the two extreme heat
Geosci. Model Dev., 8, 2285–2298, 2015 www.geosci-model-dev.net/8/2285/2015/

A. I. Stegehuis et al.: Multi-physics WRF ensemble for simulating European mega heat waves 2295
waves of study. Since we only considered a single land-
surface scheme, it is possible that the ensemble spread would
considerably increase when incorporating the uncertainty as-
sociated with modeling land-surface processes. Nevertheless,
considering only atmospheric processes, the magnitude of
the spread still reaches 5 ◦C during the peak of the heat
waves.
We also showed that among atmospheric process param-
eterizations, the choice of a convection scheme appears to
dominate the ensemble spread. We found indications that the
large differences between convection schemes seem to occur
mostly through radiation and therefore the way convective
clouds affect the surface energy and water budget prior to
and during heat waves. Changes in incoming radiation cause
changes in evapotranspiration and therefore soil moisture,
which may subsequently feed back on air temperature.
From this ensemble, we selected a small sub-ensemble
with the five best configurations of atmospheric physics
schemes based on the fit to observations. These configura-
tions capture well the temperature dynamics during the mega
heat waves of France and Russia and they perform better than
other configurations in other regions of Europe. In addition,
they are consistent with independent latent heat flux data
used for cross-validation. This indicates that the constraints
set for the selection reduce the uncertainty across the whole
European continent and point towards the creation of an op-
timized ensemble of WRF configurations specific for heat
waves, with reduced error compensations. A sub-ensemble
that outperforms a larger ensemble was also found by Herrera
et al. (2010). The sub-ensemble based on mean precipitation
showed better results for extreme precipitation as well.
However, a limitation of this study is the use of only
one land-surface scheme; the five selected WRF configura-
tions may actually all be affected by systematic errors of
the NOAH land-surface scheme. The importance of the se-
lected land-surface scheme is further confirmed by the larger
spread of the “best” ensemble for latent heat (in Wm−2) than
for shortwave radiation. In order to mimic radically different
land-surface processes, sensitivity tests in which the initial
absolute amount of soil moisture was artificially increased
and decreased by 20 % all along the soil column have been
conducted. Results confirm the sensitivity of the tempera-
ture simulations to soil moisture, a variable partly controlled
by the land-surface scheme (Fig. 8). The full answer to this
question is left for a future study in which different atmo-
spheric schemes and surface schemes will be jointly per-
muted.
Although our ensemble is trained on only summer condi-
tions, our results have several implications for climate mod-
eling. First, the constrained WRF ensemble may be used in
future studies of climate change; each of the five members
may exhibit a different sensitivity to future climate change
conditions, leading to a constrained exploration of the uncer-
tainty. Then it is important to notice that our study pinpoints
the need to carefully design or adjust the convection scheme
for a proper representation of the summer climate during
heat waves. This is particularly important in order to eval-
uate the impacts of climate change on ecosystems, health,
carbon cycle, water and cooling capacity of thermal energy
plants, since heat waves in the mid latitudes are expected to
be one of the most impacting phenomena in a human-altered
climate. Therefore, impact studies can be designed based on
the selected configurations.
The Supplement related to this article is available online
at doi:10.5194/gmd-8-2285-2015-supplement.
Acknowledgements. A. I. Stegehuis acknowledges CEA for
funding as well as the GHG-Europe FP7 project. A. J. Teuling
acknowledges financial support from the Netherlands Organisation
for Scientific Research through Veni grant 016.111.002. P. Ciais
acknowledges support of the ERC-SYG project P-IMBALANCE.
The authors acknowledge K. Pilegaard, A. Ibrom, C. Bernhofer,
G. Wohlfahrt and CarboEurope for sharing FLUXNET data. We
would like to thank the reviewers for their useful comments and
suggestions for improving the manuscript.
Edited by: A. Colette
References
Awan, N. K., Truhetz, H., and Gobiet, A.: Parameterization-induced
error characteristics of MM5 and WRF operated in climate mode
over the Alpine region: an ensemble-based analysis, J. Climate,
24, 3107–3123, doi:10.1175/2011JCLI3674.1, 2011.
Barriopedro, D., Fischer, E. M., Luterbacher, J., Trigo, R., and
Garcia-Herrera, R.: The hot summer of 2010: redrawing the
temperature record map of Europe, Science, 332, 220–224,
doi:10.1126/science.1201224, 2011.
Beljaars, A. C. M.: The parameterization of surface fluxes in large-
scale models under free convection, Q. J. Roy. Meteorol. Soc.,
121, 255–270, 1994.
Bellprat, O., Kotlarski, S., Luthi, D., and Schär, C.: Exploring per-
turbed physics ensembles in a regional climate model, J. Climate,
25, 4582–4599, doi:10.1175/JCLI-D-11-00275.1, 2012.
Beniston, M., Stephenson, D. B., Christensen, O. B., Ferro, C.
A. T., Frei, C., Goyette, S., Halsnaes, K., Holt, T., Jylha, K.,
Koffi, B., Palutikof, J., Scholl, R., Semmler, T., and Woth, K.:
Future extreme events in European climate: an exploration of
regional climate model projections, Clim. Change, 81, 71–95,
doi:10.1007/s10584-006-9226-z, 2007.
Benjamin, S. G., Grell, G. A., Brown, J. M., and Smirnova, T.
G.: Mesoscale weather prediction with RUC hybrid isentropic-
terrain-following coordinate model, Mon. Weather Rev., 132,
473–494, 2004.
Chou, M.-D. and Suarez, M. J.: A solar radiation parameterization
for atmospheric studies, NASA Tech. Memo 104606, 40, Green-
belt, Maryland, 1999.
www.geosci-model-dev.net/8/2285/2015/ Geosci. Model Dev., 8, 2285–2298, 2015

2296 A. I. Stegehuis et al.: Multi-physics WRF ensemble for simulating European mega heat waves
Chuine, I., Yiou, P., Viovy, N., Seguin, B., Daux, V., and Ladurie,
E. L.: Historical phenology: grape ripening as a past climate in-
dicator, Nature, 432, 289–290, doi:10.1038/432289a, 2004.
Collins, W. D., Rasch, P. J., Boville, B. A., Hack, J. J., McCaa, J. R.,
Williamson, D. L., Kiehl, J. T., Brieglib, B., Bitz, C., Lin, S.-J.,
Zhang, M., and Dai, Y.: Description of the NCAR Community
Atmosphere Model (CAM 3.0), NCAR Tech. Note NCAR/TN-
464+STR. 214 pp., 2004.
Dee, D. P., Uppala, S. M., Simmons, A. J., Berrisford, P., Poli,
P., Kobayashi, S., Andrae, U., Balmaseda, M. A., Balsamo, G.,
Bauer, P., Bechtold, P., Beljaars, A. C. M., van de Berg, L., Bid-
lot, J., Bormann, N., Delsol, C., Dragani, R., Fuentes, M., Geer,
A. J., Haimberger, L., Healy, S. B., Hersbach, H., Hólm, E. V.,
Isaksen, L., Kållberg, P., Köhler, M., Matricardi, M., McNally,
A. P., Monge-Sanz, B. M., Morcrette, J. J., Park, B. K., Peubey,
C., de Rosnay, P., Tavolato, C., Thépaut, J. N., and Vitart, F.: The
ERA-Interim reanalysis: Configuration and performance of the
data assimilation system, Q. J. Roy. Meteorol. Soc., 137, 553–
597, 2011.
Della-Marta, P. M., Haylock, M. R., Luterbacher, J., and
Wanner, H.: Doubled length of western European summer
heat waves since 1880, J. Geophys. Res., 112, D15103,
doi:10.1029/2007JD008510, 2007.
Déqué, M., Rowell, D. P., Luthi, D., Giorgi, F., Christensen, J. H.,
Rockel, B., Jacob, D., Kjellstrom, E., de Castro, M., and van den
Hurk, B.: An intercomparison of regional climate simulations
for Europe: assessing uncertainties in model projections, Clim.
Change, 81, 53–70, doi:10.1007/s10584-006-9228-x, 2007.
Dole, R., Hoerling, M., Perlwitz, J., Eischeid, J., Pegion, P., Zhang,
T., Quan, X.-W., Xu, T. Y., and Murray, D.: Was there a basis for
anticipating the 2010 Russian heat wave?, Geophys. Res. Lett.,
38, L06702, doi:10.1029/2010GL046582, 2011.
Dudhia, J.: A multi-layer soil temperature model for MM5. Sixth
Annual PSU/NCAR Mesoscale Model Users’ Workshop, Boul-
der CO, July 1996, 49–50, 1996.
Evans, J. P., Ekstrom, M., and Ji, F.: Evaluating the performance of
a WRF physics ensemble over South-East Australia, Clim. Dy-
nam., 39, 1241–1258, doi:10.1007/s00382-011-1244-5, 2012.
Fischer, E. M. and Schär, C.: Consistent geographical patterns of
changes in high-impact European heat waves, Nat. Geosci., 3,
398–403, 2010.
Fischer, E. M., Seneviratne, S. I., Luthi, D., and Schär, C.:
Contribution of land-atmosphere coupling to recent Euro-
pean summer heat waves, Geophy. Res. Lett., 34, L06707,
doi:10.1029/2006GL029068, 2007.
García-Díez, M., Fernández, J., Fita, L., and Yague, C.: Sea-
sonal dependence of WRF model biases and sensitivity to PBL
schemes over Europe, Q. J. Roy. Meteorol. Soc., 139, 501–514,
doi:10.1002/qj.1976, 2011.
García-Díez, M., Fernandez, J., and Vautard, R.: An RCM
multi-physics ensemble over Europe: multi-variable evalua-
tion to avoid error compensation, Clim. Dynam., in press,
doi:10.1007/s00382-0152529-x, 2015.
García-Herrera, R., Diaz, J., Trigo, R. M., Luterbacher, J.,
and Fischer, E. M.: A review of the European summer
heat wave of 2003, Crit. Rev. Env. Sci. Tec., 40, 267–306,
doi:10.1080/10643380802238137, 2010.
Gilliam, R. C. and Pleim, J. E.: Performance assessment of new land
surface and planetary boundary layer physics in the WRF-ARW,
J. Appl. Meteorol. Climatol., 49, 760–774, 2010.
Gomez-Navarro, J. J., Montávez, J. P., Jerez, S., Jimenez-Guerrero,
P., and Zorita, E.: What is the role of the observational dataset
in the evaluation and scoring of climate models?, Geophys. Res.
Lett., 39, L24701, doi:10.1029/2012GL054206, 2012.
Grell, G. A. and Devenyi, D.: A generalized approach to
parameterizing convection combining ensemble and data
assimilation techniques, Geophys. Res. Lett., 29, 1693,
doi:10.1029/2002GL015311, 2002.
Grünwald, T. and Bernhofer, C.: A decade of carbon, water and
energy flux measurements of an old spruce forest at the Anchor
Station Tharandt, Tellus, 59B, 387–396, 2007.
Han, J. and Pan, H.: Revision of convection and vertical diffusion
schemes in the NCEP Global Forecast System, Wea. Forecasting,
26, 520–533, 2011.
Haylock, M. R., Hofstra, N., Klein Tank, A. M. G., Klok,
E. J., Jones, P. D., and New, M.: A European daily high-
resolution gridded data set of surface temperature and pre-
cipitation for 1950–2006, J. Geophys. Res., 113, D20119,
doi:10.1029/2008JD010201, 2008.
Herrera, S., Fita, L., Fernández, J., and Gutierrez, J. M.: Evalua-
tion of the mean and extreme precipitation regimes from the EN-
SEMBLES regional climate multimodel, J. Geophys. Res., 115,
D21117, doi:10.1029/2010JD013936, 2010.
Hong, S.-Y. and Lim, J.-O. J.: The WRF single-moment 6-class mi-
crophysics scheme (WSM6), J. Korean Meteor. Soc., 42, 129–
151, 2006.
Hong, S.-Y., Noh, Y., and Dudhia, J.: A new vertical diffusion pack-
age with an explicit treatment of entrainment processes, Mon.
Weather Rev., 134, 2318–2341, 2006.
Iacono, M. J., Delamere, J. S., Mlawer, E. J., Shephard, M.
W., Clough, S. A., and Collins, W. D.: Radiative forcing
by long-lived greenhouse gases: Calculations with the AER
radiative transfer models, J. Geophys. Res., 113, D13103,
doi:10.1029/2008JD009944, 2008.
IPCC: Climate Change 2013: The Physical Science Basis. Contri-
bution of Working Group I to the Fifth Assessment Report of the
Intergovernmental Panel on Climate Change, edited by: Stocker,
T. F., Qin, D., Plattner, G.-K., Tignor, M., Allen, S. K., Boschung,
J., Nauels, A., Xia, Y., Bex, V., and Midgley, P. M., Cambridge
University Press, Cambridge, United Kingdom and New York,
NY, USA, 1535 p., doi:10.1017/CBO9781107415324, 2013.
Jacob, D., Petersen, J., Eggert, B., Alias, A., Christensen, O. B.,
Bouwer, L. M., Braun, A., Colette, A., Deque, M., Georgievski,
G., Georgopoulou, E., Gobiet, A., Menut, L., Nikulin, G.,
Haensler, A., Hempelmann, N., Jones, C., Keuler, K., Kovats,
S., Kroner, N., Kotlarski, S., Kriegsmann, A., Martin, E., Van
Meijgaard, E., Moseley, C., Pfeifer, S., Preuschmann, S., Rader-
macher, C., Radtke, K., Rechid, D., Rounsevell, M., Samuelsson,
P., Somot, S., Soussana, J. F., Teichmann, C., Valentini, R., Vau-
tard, R., Weber, B., and Yiou, P.: EURO-CORDEX: new-high-
resolution climate change projections for European impact re-
search, Reg. Environ. Change, 14, 563–578, 2014.
Janjic, Z. I.: The Step–Mountain Eta Coordinate Model: Further de-
velopments of the convection, viscous sublayer, and turbulence
closure schemes, Mon. Wea. Rev., 122, 927–945, 1994.
Geosci. Model Dev., 8, 2285–2298, 2015 www.geosci-model-dev.net/8/2285/2015/

A. I. Stegehuis et al.: Multi-physics WRF ensemble for simulating European mega heat waves 2297
Janjic, Z. I.: Nonsingular implementation of the Mellor-Yamada
Level 2.5 Scheme in the NCEP Meso model, NCEP Office Note
No. 437, 61 p., National Centers for Environmental Prediction,
College Park, MD, 2002.
Jankov, I., Gallus, W. A., Segal, M., Shaw, B., and Koch, S. E.: The
impact of different WRF model physical parameterizations and
their interactions on warm season WCS rainfall, Wea. Forecast-
ing, 20, 1048–1060, doi:10.1175/WAF888.1, 2005.
Kain, J. S.: The Kain–Fritsch convective parameterization: An up-
date, J. Appl. Meteor., 43, 170–181, 2004.
Koster, R. D., Mahanama, S. P. P., Yamada, T. J., Balsamo, G.,
Berg, A. A., Boisserie, M., Dirmeyer, P. A., Doblas-Reyes, F.
J., Drewitt, G., Gordon, C. T., Guo, Z., Jeong, J. H., Lawrence,
D. M., Lee, W. S., Li, Z., Luo, L., Malyshev, S., Merryfield,
W. J., Seneviratne, S. I., Stanelle, T., Van den Hurk, B. J. J.
M., Vitart, F., and Wood, E. F.: Contribution of land surface
initialization to subseasonal forecast skill: First results from
a multi-model experiment, Geophys. Res. Lett., 37, L02402,
doi:10.1029/2009GL041677, 2010.
Kotlarski, S., Keuler, K., Christensen, O. B., Colette, A., Déqué,
M., Gobiet, A., Goergen, K., Jacob, D., Lüthi, D., van Meij-
gaard, E., Nikulin, G., Schär, C., Teichmann, C., Vautard, R.,
Warrach-Sagi, K., and Wulfmeyer, V.: Regional climate model-
ing on European scales: a joint standard evaluation of the EURO-
CORDEX RCM ensemble, Geosci. Model Dev., 7, 1297–1333,
doi:10.5194/gmd-7-1297-2014, 2014.
Kuglitsch, F. G., Toreti, T., Xoplaki, E., Della-Marta, P. M., Zere-
fos, C. S., Turkes, M., and Luterbacher, J.: Heat wave changes in
the eastern Mediterranean since 1960, Geophys. Res. Lett., 37,
L04802, doi:10.1029/2009GL041841, 2010.
Lenderink, G., van Ulden, A., van den Hurk, B., and van Meij-
gaard, E.: Summertime inter-annual temperature variability in an
ensemble of regional model simulations: analysis of the surface
energy budget, Clim. Change, 81, 233–247, 2007.
Luterbacher, J., Koenig, S. J., Franke, J., Van der Schrier, G., Zorita,
E., Moberg, A., Jacobeit, J., Della-Marta, P. M., Kuttel, M., Xo-
plaki, E., Wheeler, D., Rutishauser, T., Stossel, M., Wanner, H.,
Brazdil, R., Dobrovolny, P., Camuffo, D., Bertolin, C., Van En-
gelen, A., Gonzalez-Rouco, F. J., Wilson, R., Pfister, C., Li-
manowka, D., Nordli, O., Leijonhufvud, L., Soderberg, J., Allan,
R., Barriendos, M., Glaser, R., Riemann, D., Hao, Z., and Zere-
fos, C. S.: Circulation dynamics and its influence on European
and Mediterranean January-April climate over the past half mil-
lennium: results and insights from instrumental data, documen-
tary evidence and coupled climate models, Clim. Change, 101,
201–234, doi:10.1007/s10584-009-9782-0, 2010.
Meehl, G. A. and Tebaldi, C.: More intense, more frequent, and
longer lasting heat waves in the 21st century, Science, 305, 994–
997, doi:10.1126/science.1098704, 2004.
Miralles, D. G., Holmes, T. R. H., De Jeu, R. A. M., Gash, J. H.,
Meesters, A. G. C. A., and Dolman, A. J.: Global land-surface
evaporation estimated from satellite-based observations, Hydrol.
Earth Syst. Sci., 15, 453–469, doi:10.5194/hess-15-453-2011,
2011.
Miralles, D. G., Teuling, A. J., van Heerwaarden, C. C., and Vilà-
Guerau de Arellano, J.: Mega-heatwave temperatures due to
combined soil desiccation and atmospheric heat accumulation,
Nature Geosci., 7, 345–349, doi:10.1038/ngeo2141, 2014.
Mooney, P. A., Mulligan, F. J., and Fealy, R.: Evaluation of the Sen-
sitivity of the Weather Research and Forecasting Model to Pa-
rameterization Schemes for Regional Climates of Europe over
the Period 1990–95, J. Climate, 26, 1002–1017, 2013.
Morrison, H., Thompson, G., and Tatarskii, V.: Impact of Cloud Mi-
crophysics on the Development of Trailing Stratiform Precipita-
tion in a Simulated Squall Line: Comparison of One- and Two-
Moment Schemes, Mon. Weather Rev., 137, 991–1007, 2009.
Nakanishi, M. and Niino, H.: An improved Mellor–Yamada level 3
model: its numerical stability and application to a regional pre-
diction of advecting fog, Bound. Layer Meteor., 119, 397–407,
2006.
Nakanishi, M. and Niino, H.: Development of an improved turbu-
lence closure model for the atmospheric boundary layer, J. Me-
teor. Soc. Japan, 87, 895–912, 2009.
Nikulin, G., Kjellstrom, E., Hansson, U., Strandberg, G., and Uller-
stig, A.: Evaluation and future projections of temperature, precip-
itation and wind extremes over Europe in an ensemble of regional
climate simulations, Tellus A, 63, 41–55, 2010.
Omrani, H., Dobrinski, P., and Dubos, P. T.: Optimal nudging strate-
gies in regional climate modelling: investigation in a Big-Brother
experiment over the European and Mediterranean regions, Cli-
mate Dynam., 41, 2451–2470, 2013.
Orlowsky, B. and Seneviratne, S. I.: Global changes in extreme
events: regional and seasonal dimension, Clim. Change, 110,
669–696, doi:10.1007/s10584-011-0122-9, 2012.
Pilegaard, K., Ibrom, A., Courtney, M. S., Hummerlshøj, P., and
Jensen, N. O.: Increasing net CO2 uptake by a Danish beech for-
est during the period from 1996 to 2009, Agric. For. Meteorol.,
151, 934–946, 2011.
Pleim, J. E.: A Combined Local and Nonlocal Closure Model for
the Atmospheric Boundary Layer. Part I: Model Description and
Testing, J. Appl. Meteor. Climatol., 46, 1383–1395, 2007.
Schär, C., Vidale, P. L., Luthi, D., Frei, C., Haberli, C., Liniger,
M. A., and Appenzeller, C.: The role of increasing temperature
variability in European summer heatwaves, Nature, 427, 332–
336, doi:10.1038/nature02300, 2004.
Seneviratne, S. I., Luthi, D., Litschi, M., and Schär, C.: Land-
atmosphere coupling and climate change in Europe, Nature, 443,
205–209, doi:10.1038/nature05095, 2006.
Seneviratne, S. I., Corti, T., Davin, E. L., Hirschi, M., Jaeger, E. B.,
Lehner, I., Orlowsky, B., and Teuling, A. J.: Investigating soil
moisture-climate interactions in a changing climate: a review,
Earth Sci. Rev., 99, 125–161, 2010.
Seneviratne, S. I., Nicholls, N., Easterling, D., Goodess, C. M.,
Kanae, S., Kossin, J., Luo, Y., Marengo, J., McInnes, K., Rahimi,
M., Reichstein, M., Sorteberg, A., Vera, C., and Zhang, X.:
Changes in climate extremes and their impacts on the natural
physical environment, in: Managing the Risks of Extreme Events
and Disasters to Advance Climate Change Adaptation, edited by:
Field, C. B., Barros, V., Stocker, T. F., Qin, D., Dokken, D. J.,
Ebi, K. L., Mastrandrea, M. D., Mach, K. J., Plattner, G.-K.,
Allen, S. K., Tignor, M., and Midgley, P. M., a Special Report of
Working Groups I and II of the Intergovernmental Panel on Cli-
mate Change (IPCC), Cambridge University Press, Cambridge,
UK, and New York, NY, USA, pp. 109–230, 2012.
Skamarock, W. C., Klemp, J. B., Dudhia, J., Gill, D. O., Barker,
D. M., Duda, M. G., Huang, X.-Y., Wang, W., and Powers, J.
G.: A description of the Advanced Research WRF version 3,
www.geosci-model-dev.net/8/2285/2015/ Geosci. Model Dev., 8, 2285–2298, 2015

2298 A. I. Stegehuis et al.: Multi-physics WRF ensemble for simulating European mega heat waves
NCAR Tech. Note 1–125, available at: http://nldr.library.ucar.
edu/repository/collections/TECH-NOTE-000000-000-855 (last
access: 20 July 2015), 2008.
Stegehuis, A., Vautard, R., Ciais, P., Teuling, A. J., Jung, M., and
Yiou, P.: Summer temperatures in Europe and land heat fluxes in
observation-based data and regional climate model simulations,
Clim. Dynam., 41, 455–477, doi:10.1007/s00382-012-1559-x,
2013.
Sukoriansky, S., Galperin, B., and Perov, V.: Application of a new
spectral model of stratified turbulence to the atmospheric bound-
ary layer over sea ice, Bound.-Lay. Meteor., 117, 231–257, 2005.
Teuling, A. J., Hirschi, M., Ohmura, A., Wild, M., Reichstein, M.,
Ciais, P., Buchmann, N., Ammann, C., Montagnani, L., Richard-
son, A. D., Wohlfahrt, G., and Seneviratne, S. I.: A regional
perspective on trends in continental evaporation, Geophys. Res.
Lett., 36, L02404, doi:10.1029/2008GL036584, 2009.
Tewari, M., Chen, F., Wang, W., Dudhia, J., LeMone, M. A.,
Mitchell, K., Ek, M., Gayno, G., Wegiel, J., and Cuenca, R. H.:
Implementation and verification of the unified NOAH land sur-
face model in the WRF model, 20th conference on weather anal-
ysis and forecasting/16th conference on numerical weather pre-
diction, pp. 11–15, Seattle, WA, American Meteorological Soci-
ety, 2004.
Thompson, G., Field, P. R., Rasmussen, R. M., and Hall, W. D.: Ex-
plicit Forecasts of Winter Precipitation Using an Improved Bulk
Microphysics Scheme. Part II: Implementation of a New Snow
Parameterization, Mon. Weather Rev., 136, 5095–5115, 2008.
Tiedtke, M.: A comprehensive mass flux scheme for cumulus pa-
rameterization in large-scale models, Mon. Weather Rev., 117,
1779–1800, 1989.
Tingley, M. P. and Huybers, P.: Recent temperature extremes at high
northern latitudes unprecedented in the past 600 years, Nature,
496, 201–205, doi:10.1038/nature11969, 2013.
Van den Hurk, B., Doblas-Reyes, F., Balsamo, G., Koster, R. D.,
Seneviratne, S. I., and Camargo, H.: Soil moisture effects on sea-
sonal temperature and precipitation forecast scores in Europe,
Clim. Dynam., 38, 349–362, doi:10.1007/s00382-010-0956-2,
2012.
Vautard, R., Gobiet, A., Jacob, D., Belda, M., Colette, A., Deque,
M., Fernandez, J., García-Díez, M., Goergen, K., Guttler, I.,
Halenka, T., Karacostas, T., Katragkou, E., Keuler, K., Kot-
larski, S., Mayer, S., Van Meijgaard, E., Nikulin, G., Patarcic,
M., Scinocca, J., Sobolowski, S., Suklitsch, M., Teichmann, C.,
Warrach-Sagi, K., Wulfmeyer, V., and Yiou, P.: The simulation
of European heat waves from an ensemble of regional climate
models within the EURO-CORDEX project, Clim. Dynam., 41,
2555–2575, doi:10.1007/s00382-013-1714-z, 2013.
Vautard, R., Thias, F., Tobin, I., Breon, F.-M., Devezeaux de
Lavergne, J.-G., Colette, A., Yiou, P., and Ruti, P. M.: Regional
climate model simulations indicate limited climatic impacts by
operational and planned European wind farms, Nature Commu-
nications, 5, 3196, doi:10.1038/ncomms4196, 2014.
Warrach-Sagi, K., Schwitalla, T., Wulfmeyer, V., and Bauer, H. S.:
Evaluation of a climate simulation in Europe based on the WRF-
NOAH model system: precipitation in Germany, Clim. Dynam.,
41, 755–774, doi:10.1007/s00382-013-1727-7, 2013.
Weisheimer, A., Doblas-Reyes, F. J., Jung, T., and Palmer, T. N.:
On the predictability of the extreme summer 2003 over Europe,
Geophys. Res. Lett., 38, L05704, doi:10.1029/2010GL046455,
2011.
Wild, M., Trussel, B., Ohmura, A., Long, C. N., Konig-Langlo, G.,
Dutton, E. G., and Tsvetkov, A.: Global dimming and brighten-
ing: An update beyond 2000, J. Geophys. Res., 114, D00D13,
doi:10.1029/2008JD011382, 2009.
Wohlfahrt, G., Pilloni, S., Hörtnagl, L., and Hammerle, A.: Esti-
mating carbon dioxide fluxes from temperate mountain grass-
lands using broad-band vegetation indices, Biogeosciences, 7,
683–694, doi:10.5194/bg-7-683-2010, 2010.
Zhang, C., Wang, Y., and Hamilton, K.: Improved representation of
boundary layer clouds over the southeast pacific in ARW–WRF
using a modified Tiedtke cumulus parameterization scheme,
Mon. Weather Rev., 139, 3489–3513, 2011.
Geosci. Model Dev., 8, 2285–2298, 2015 www.geosci-model-dev.net/8/2285/2015/