an on-board instrumentation system for high-rate...
TRANSCRIPT

An On-Board Instrumentation System forHigh-Rate Medium Caliber Projectiles
Item Type text; Proceedings
Authors Bukowski, Edward; Don, Michael; Grzybowski, David; Harkins,Thomas
Publisher International Foundation for Telemetering
Journal International Telemetering Conference Proceedings
Rights Copyright © held by the author; distribution rights InternationalFoundation for Telemetering
Download date 02/05/2018 22:22:30
Link to Item http://hdl.handle.net/10150/596432
1
AN ON-BOARD INSTRUMENTATION SYSTEM FOR HIGH-RATE MEDIUM CALIBER PROJECTILES
Edward Bukowski, Michael Don, David Grzybowski and Thomas Harkins U.S. Army Research Laboratory Aberdeen Proving Ground, MD
ABSTRACT The U.S. Army Research Laboratory developed an on-board telemetry instrumentation system to obtain measurements of the in-flight dynamics of medium caliber projectiles. The small size, high launch acceleration, and extremely high spin rates of these projectiles created many design challenges. Particularly challenging were the high spin rates, necessitating the development of a data compression scheme for solar sensors. Flight tests successfully captured data for spin rates exceeding 1000 Hertz (1 kHz).
KEY WORDS
Solar Sensors, On-Board Instrumentation, Data Compression, Power Supply
INTRODUCTION Tasked with measuring the in-flight dynamics of the 30mm MK310 projectile, the U.S. Army Research Laboratory (ARL) has designed an on-board telemetry instrumentation system for medium caliber projectiles. The small size, high launch acceleration, and extremely high spin rates of these projectiles posed many design challenges. Components were carefully selected, G-hardened, and experimentally evaluated to ensure survivability. A new data compression scheme for solar data was implemented to accommodate high spin rates. The project culminated in successful spin and flight tests, validating the design at roll rates exceeding 1000 Hertz (1 kHz). Although various aspects of this project have already been published (1, 2), this paper will focus on three aspects of the design that have not been presented in detail. After a general system overview, the power supply design will be discussed. Next, aspects of the solar sensor G-hardening and evaluation will be presented. Finally, the solar data compression will be explained and the results from the spin and flight tests shown.
SYSTEM OVERVIEW A model of the instrumentation system is provided by Figure 1 and Table 1. The round is divided into two sections. The front section houses the antenna, transmitter board, and two solar sensors.
2
The back section contains the instrumentation boards and battery power. 21 pin Micro-D style (MDM) connectors link the two sections together, providing signal routing when connected, as well as an external interface when the sections are separated. The instrumentation board stack shown in Figure 2 is housed in a space of 0.856 inches diameter (D) and 0.9 inches height (H).
Figure 1. Model of the instrumentation system
Table 1. Model item descriptions
Label Item Description 1 Batteries (x3) 80mAh Lithium Ion Polymer cells2 Configuration Board High-G Accelerometer, Battery Monitor, A/D, Signal Conditioning3 Encoder Connector (x2) Combines configuration and encoder into a standalone unit4 Encoder Board FPGA based PCM encoder, SRAM5 Side Boards (x4) Axial Accelerometer, Radial Rate, 3-Axis Mag, Power Regulation6 Accelerometer Board Low-G & High-G Radial Accelerometers, Axial Rate Sensor7 Connector Board Battery Protection, G-Switch, Enable Circuitry 8 Connectors (x2) Male and Female 21 pin MDM Connectors9 Solar Sensors (x2) ARL Solar Sensors (SLITs)10 Antenna/Transmitter Custom monopole antenna, 2255.5 MHz FM transmitter
POWER SUPPLY
Power supply options were very limited due to a number of restrictions. The final projectile design allocated a space of 22mm D and 28mm H for the power source. The power source also had to provide enough energy to power the onboard electronics which had a minimum operating voltage of 3 volts (V) and current draw of 500 milliamps (mA). Additionally, the power source had to be
1 9
2 3 4 5 6
8 10
7
Figure 2. Instrumentation board stack
3
secondary (rechargeable) and operate within a ballistic environment. Rechargeability was a necessity since the power source would be embedded within the projectile and could not be replaced once the unit was assembled. Projectile launch accelerations were estimated to be anywhere in the range of 60,000G’s (60kG) to 85,000G’s (85kG). Any power source integrated into the projectile needed to be able to survive these levels of acceleration and remain operational throughout the projectile flight. Most of these requirements were met by several commercial cells chosen for evaluation based on size, capacity, and chemistry. A CR2 model lithium-ion (Li-Ion) rechargeable cylindrical cell was the first choice since its standard size of 15.6mm D by 27mm H was well within the projectile space restrictions. These cells also have a standard 3.6V nominal voltage and were available in 400 milliamp-hour (mAh) capacity and 600mAh capacity models that would meet the given power requirements of the on-board electronics. Initial system design concepts incorporated a single CR2 model cylindrical cell mounted vertically within the base of the projectile. The only major concern for these cells was high-G survivability. Cells of this nature are often mounted in a flat or horizontal orientation in order to improve high-G survivability. In this case, the cell would be mounted vertically which could potentially lead to a reduction in performance due to effects from the high-G acceleration. A previous study conducted by ARL evaluated the high-G performance of similar CR2 lithium primary cylindrical cells. Results from this study showed that the lithium primary CR2 cells, mounted in a vertical orientation, survived acceleration levels up to 30kG, but significant reductions in performance were noted at levels around 65kG and above (3). A new study was conducted to assess the performance of the selected CR2 Li-Ion cylindrical cells, mounted in a vertical orientation, at acceleration levels of 50kG and above. Several models of Lithium Ion Polymer (LiPo) rechargeable pouch cells were also chosen for evaluation, but once again, available options were limited due to the required space and power specifications. Pouch cell models with capacities of 80mAh, 125mAh, and 200mAh were selected. As opposed to the single CR2 Li-Ion cylindrical cell solution, the smaller capacities of the LiPo pouch cells required two to three cells in a parallel configuration in order to meet the necessary power requirement. Space restrictions allowed for a 2-in-parallel (2P) configuration for the 125mAh and 200mAh cells mounted in a vertical orientation. The 80mAh cells could be used in a 3-in-parallel (3P) configuration mounted in a flat, or horizontal orientation, which is the preferred orientation (4). Table 2 outlines the various cells identified for high-G evaluation.
Table 2. Evaluated battery cells
4
The high-G impact study of these cells was conducted using the 4 inch air-gun facility located at ARL’s Adelphi Laboratory Center (ALC). A total of six air-gun battery experiments were conducted and produced acceleration levels ranging from 50kG up to 80kG (Figure 3). During each experiment, the cells were encapsulated and housed in a custom high-G carrier (Figure 4).
Figure 3. Air gun acceleration profiles
Figure 4. Battery puck and high-G carrier
Results obtained from the high-G acceleration experiments showed that none of the Li-Ion cylindrical cells and LiPo pouch cells mounted in a vertical orientation could be used for this application with any degree of confidence. Significant failures in electrical performance and instances of internal damage to the cell materials were observed in each case involving a vertical direction of acceleration. The only success was seen in the 80mAh LiPo pouch cells which are small enough in size to fit horizontally within the allocated volume. A total of 24 individual 80mAh LiPo pouch cells were evaluated with no significant reductions in performance noted (5). Based on these results, the 80mAh LiPo pouch cells were selected for use in the projectiles. A 3-in-parallel configuration was used to increase the battery capacity to 240mAh which would provide the on-board electronics enough power to operate for approximately 18 to 20 minutes (Figure 5). While this presents almost a 10 minute reduction in runtime from the 400mAh Li-Ion cylindrical cell, this trade-off was necessary in order to meet the high-G requirement.
Figure 5. Battery discharge evaluation
0
10
20
30
40
50
60
70
80
0 0.1 0.2 0.3 0.4 0.5 0.6 0.7 0.8 0.9 1.0
Shot 1 - 80kGShot 2 - 50kGShot 3 - 50kGShot 4 - 65kGShot 5 - 65kGShot 6 - 65kG
Time (milliseconds)
Acc
eler
atio
n (k
G)
5
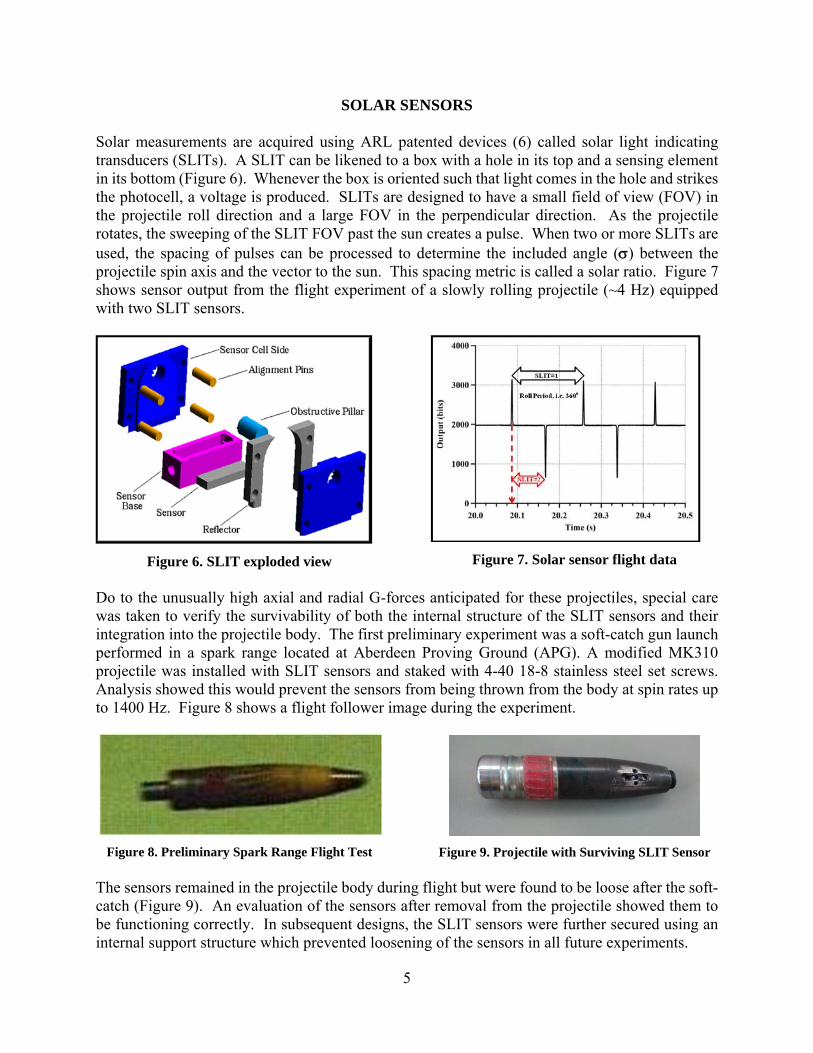
SOLAR SENSORS Solar measurements are acquired using ARL patented devices (6) called solar light indicating transducers (SLITs). A SLIT can be likened to a box with a hole in its top and a sensing element in its bottom (Figure 6). Whenever the box is oriented such that light comes in the hole and strikes the photocell, a voltage is produced. SLITs are designed to have a small field of view (FOV) in the projectile roll direction and a large FOV in the perpendicular direction. As the projectile rotates, the sweeping of the SLIT FOV past the sun creates a pulse. When two or more SLITs are used, the spacing of pulses can be processed to determine the included angle () between the projectile spin axis and the vector to the sun. This spacing metric is called a solar ratio. Figure 7 shows sensor output from the flight experiment of a slowly rolling projectile (~4 Hz) equipped with two SLIT sensors.
Figure 6. SLIT exploded view
Figure 7. Solar sensor flight data
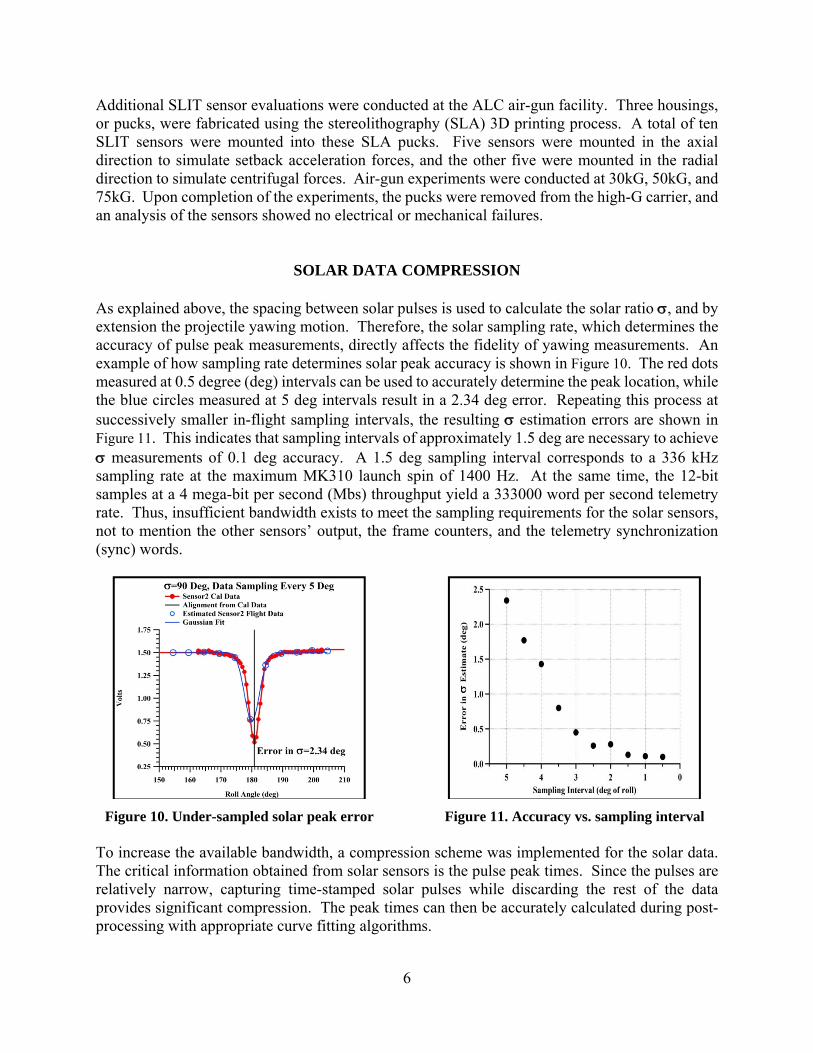
Do to the unusually high axial and radial G-forces anticipated for these projectiles, special care was taken to verify the survivability of both the internal structure of the SLIT sensors and their integration into the projectile body. The first preliminary experiment was a soft-catch gun launch performed in a spark range located at Aberdeen Proving Ground (APG). A modified MK310 projectile was installed with SLIT sensors and staked with 4-40 18-8 stainless steel set screws. Analysis showed this would prevent the sensors from being thrown from the body at spin rates up to 1400 Hz. Figure 8 shows a flight follower image during the experiment.
Figure 8. Preliminary Spark Range Flight Test
Figure 9. Projectile with Surviving SLIT Sensor
The sensors remained in the projectile body during flight but were found to be loose after the soft- catch (Figure 9). An evaluation of the sensors after removal from the projectile showed them to be functioning correctly. In subsequent designs, the SLIT sensors were further secured using an internal support structure which prevented loosening of the sensors in all future experiments.
6
Additional SLIT sensor evaluations were conducted at the ALC air-gun facility. Three housings, or pucks, were fabricated using the stereolithography (SLA) 3D printing process. A total of ten SLIT sensors were mounted into these SLA pucks. Five sensors were mounted in the axial direction to simulate setback acceleration forces, and the other five were mounted in the radial direction to simulate centrifugal forces. Air-gun experiments were conducted at 30kG, 50kG, and 75kG. Upon completion of the experiments, the pucks were removed from the high-G carrier, and an analysis of the sensors showed no electrical or mechanical failures.
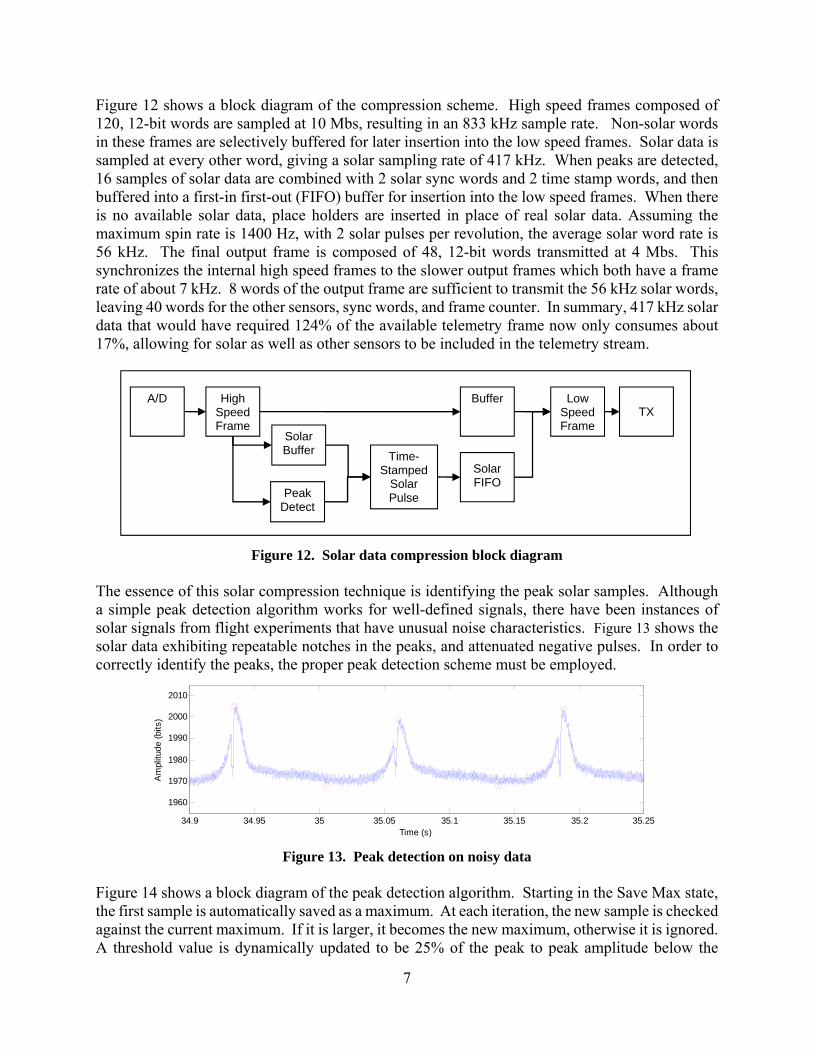
SOLAR DATA COMPRESSION As explained above, the spacing between solar pulses is used to calculate the solar ratio , and by extension the projectile yawing motion. Therefore, the solar sampling rate, which determines the accuracy of pulse peak measurements, directly affects the fidelity of yawing measurements. An example of how sampling rate determines solar peak accuracy is shown in Figure 10. The red dots measured at 0.5 degree (deg) intervals can be used to accurately determine the peak location, while the blue circles measured at 5 deg intervals result in a 2.34 deg error. Repeating this process at successively smaller in-flight sampling intervals, the resulting estimation errors are shown in Figure 11. This indicates that sampling intervals of approximately 1.5 deg are necessary to achieve measurements of 0.1 deg accuracy. A 1.5 deg sampling interval corresponds to a 336 kHz sampling rate at the maximum MK310 launch spin of 1400 Hz. At the same time, the 12-bit samples at a 4 mega-bit per second (Mbs) throughput yield a 333000 word per second telemetry rate. Thus, insufficient bandwidth exists to meet the sampling requirements for the solar sensors, not to mention the other sensors’ output, the frame counters, and the telemetry synchronization (sync) words.
Figure 10. Under-sampled solar peak error
Figure 11. Accuracy vs. sampling interval
To increase the available bandwidth, a compression scheme was implemented for the solar data. The critical information obtained from solar sensors is the pulse peak times. Since the pulses are relatively narrow, capturing time-stamped solar pulses while discarding the rest of the data provides significant compression. The peak times can then be accurately calculated during post-processing with appropriate curve fitting algorithms.
7
Figure 12 shows a block diagram of the compression scheme. High speed frames composed of 120, 12-bit words are sampled at 10 Mbs, resulting in an 833 kHz sample rate. Non-solar words in these frames are selectively buffered for later insertion into the low speed frames. Solar data is sampled at every other word, giving a solar sampling rate of 417 kHz. When peaks are detected, 16 samples of solar data are combined with 2 solar sync words and 2 time stamp words, and then buffered into a first-in first-out (FIFO) buffer for insertion into the low speed frames. When there is no available solar data, place holders are inserted in place of real solar data. Assuming the maximum spin rate is 1400 Hz, with 2 solar pulses per revolution, the average solar word rate is 56 kHz. The final output frame is composed of 48, 12-bit words transmitted at 4 Mbs. This synchronizes the internal high speed frames to the slower output frames which both have a frame rate of about 7 kHz. 8 words of the output frame are sufficient to transmit the 56 kHz solar words, leaving 40 words for the other sensors, sync words, and frame counter. In summary, 417 kHz solar data that would have required 124% of the available telemetry frame now only consumes about 17%, allowing for solar as well as other sensors to be included in the telemetry stream.
Figure 12. Solar data compression block diagram
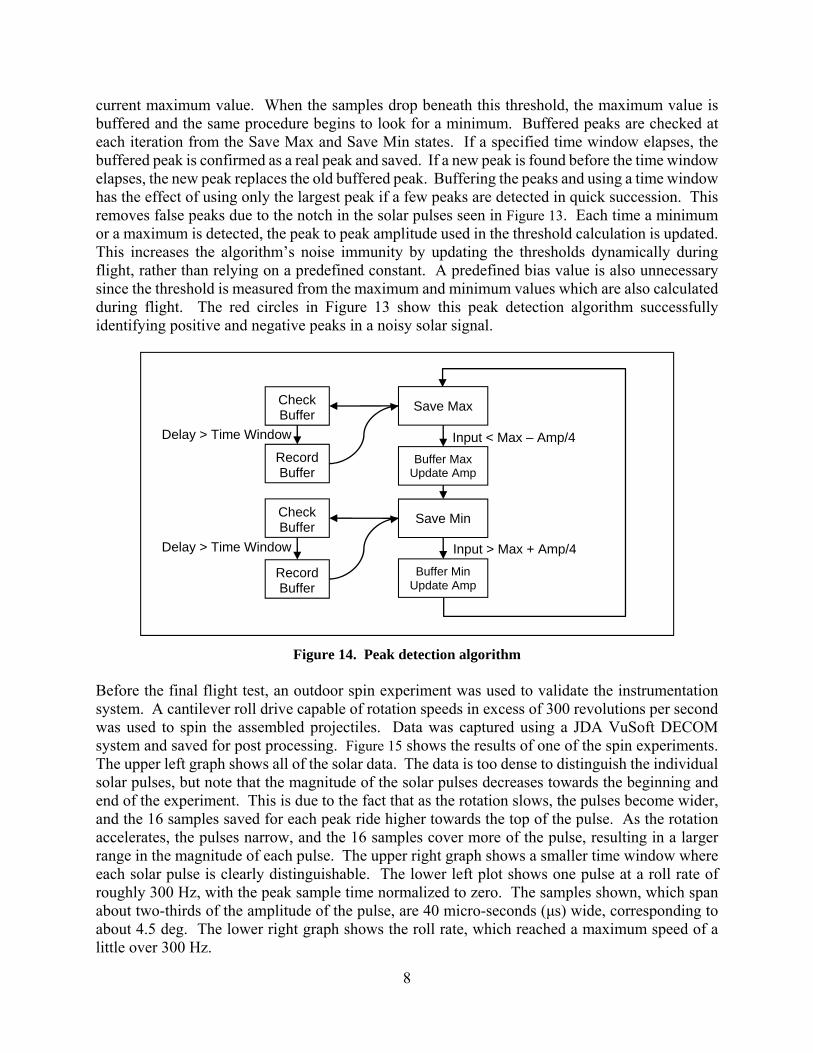
The essence of this solar compression technique is identifying the peak solar samples. Although a simple peak detection algorithm works for well-defined signals, there have been instances of solar signals from flight experiments that have unusual noise characteristics. Figure 13 shows the solar data exhibiting repeatable notches in the peaks, and attenuated negative pulses. In order to correctly identify the peaks, the proper peak detection scheme must be employed.
Figure 13. Peak detection on noisy data
Figure 14 shows a block diagram of the peak detection algorithm. Starting in the Save Max state, the first sample is automatically saved as a maximum. At each iteration, the new sample is checked against the current maximum. If it is larger, it becomes the new maximum, otherwise it is ignored. A threshold value is dynamically updated to be 25% of the peak to peak amplitude below the
34.9 34.95 35 35.05 35.1 35.15 35.2 35.25
1960
1970
1980
1990
2000
2010
Time (s)
Am
plitu
de (b
its)
A/D High Speed Frame
Low Speed Frame
Solar Buffer
Peak Detect
Time-Stamped
Solar Pulse
TX Buffer
Solar FIFO
8
current maximum value. When the samples drop beneath this threshold, the maximum value is buffered and the same procedure begins to look for a minimum. Buffered peaks are checked at each iteration from the Save Max and Save Min states. If a specified time window elapses, the buffered peak is confirmed as a real peak and saved. If a new peak is found before the time window elapses, the new peak replaces the old buffered peak. Buffering the peaks and using a time window has the effect of using only the largest peak if a few peaks are detected in quick succession. This removes false peaks due to the notch in the solar pulses seen in Figure 13. Each time a minimum or a maximum is detected, the peak to peak amplitude used in the threshold calculation is updated. This increases the algorithm’s noise immunity by updating the thresholds dynamically during flight, rather than relying on a predefined constant. A predefined bias value is also unnecessary since the threshold is measured from the maximum and minimum values which are also calculated during flight. The red circles in Figure 13 show this peak detection algorithm successfully identifying positive and negative peaks in a noisy solar signal.
Figure 14. Peak detection algorithm
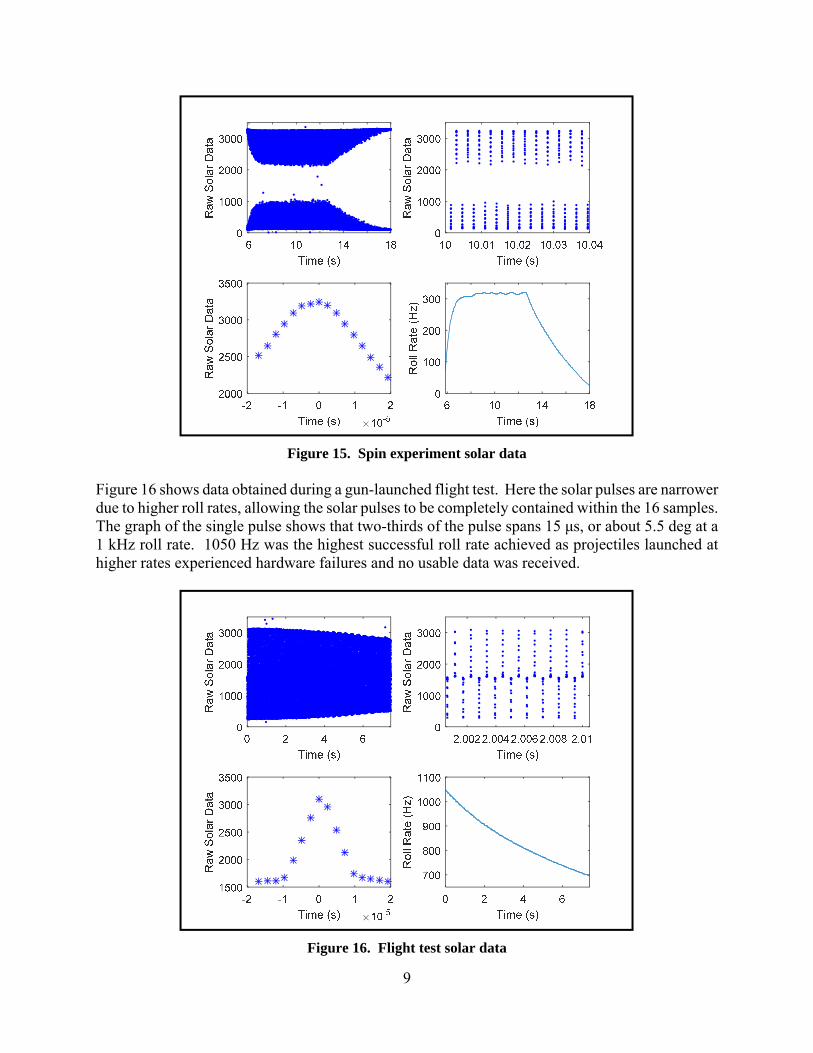
Before the final flight test, an outdoor spin experiment was used to validate the instrumentation system. A cantilever roll drive capable of rotation speeds in excess of 300 revolutions per second was used to spin the assembled projectiles. Data was captured using a JDA VuSoft DECOM system and saved for post processing. Figure 15 shows the results of one of the spin experiments. The upper left graph shows all of the solar data. The data is too dense to distinguish the individual solar pulses, but note that the magnitude of the solar pulses decreases towards the beginning and end of the experiment. This is due to the fact that as the rotation slows, the pulses become wider, and the 16 samples saved for each peak ride higher towards the top of the pulse. As the rotation accelerates, the pulses narrow, and the 16 samples cover more of the pulse, resulting in a larger range in the magnitude of each pulse. The upper right graph shows a smaller time window where each solar pulse is clearly distinguishable. The lower left plot shows one pulse at a roll rate of roughly 300 Hz, with the peak sample time normalized to zero. The samples shown, which span about two-thirds of the amplitude of the pulse, are 40 micro-seconds (μs) wide, corresponding to about 4.5 deg. The lower right graph shows the roll rate, which reached a maximum speed of a little over 300 Hz.
Save Max
Save Min
Input < Max – Amp/4 Buffer Max
Update Amp
Buffer MinUpdate Amp
Check Buffer
Record Buffer
Record Buffer
Input > Max + Amp/4
Check Buffer
Delay > Time Window
Delay > Time Window
9
Figure 15. Spin experiment solar data
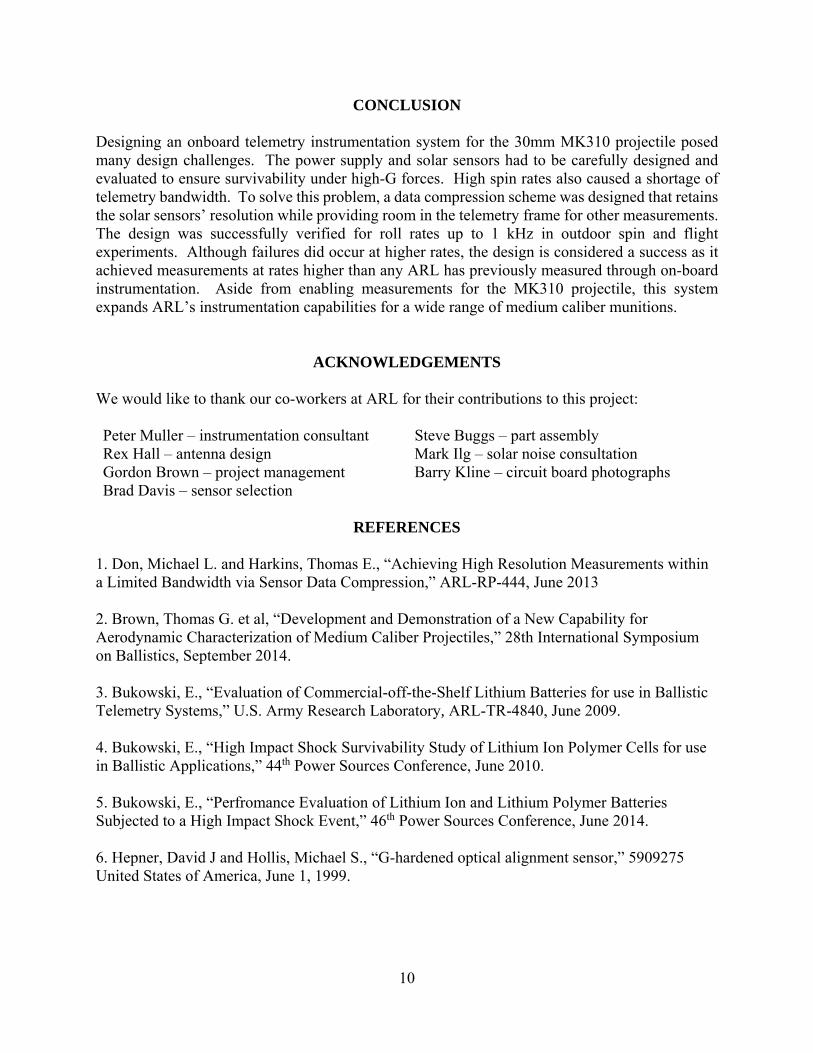
Figure 16 shows data obtained during a gun-launched flight test. Here the solar pulses are narrower due to higher roll rates, allowing the solar pulses to be completely contained within the 16 samples. The graph of the single pulse shows that two-thirds of the pulse spans 15 μs, or about 5.5 deg at a 1 kHz roll rate. 1050 Hz was the highest successful roll rate achieved as projectiles launched at higher rates experienced hardware failures and no usable data was received.
Figure 16. Flight test solar data
10
CONCLUSION Designing an onboard telemetry instrumentation system for the 30mm MK310 projectile posed many design challenges. The power supply and solar sensors had to be carefully designed and evaluated to ensure survivability under high-G forces. High spin rates also caused a shortage of telemetry bandwidth. To solve this problem, a data compression scheme was designed that retains the solar sensors’ resolution while providing room in the telemetry frame for other measurements. The design was successfully verified for roll rates up to 1 kHz in outdoor spin and flight experiments. Although failures did occur at higher rates, the design is considered a success as it achieved measurements at rates higher than any ARL has previously measured through on-board instrumentation. Aside from enabling measurements for the MK310 projectile, this system expands ARL’s instrumentation capabilities for a wide range of medium caliber munitions.
ACKNOWLEDGEMENTS We would like to thank our co-workers at ARL for their contributions to this project: Peter Muller – instrumentation consultant Steve Buggs – part assembly Rex Hall – antenna design Mark Ilg – solar noise consultation Gordon Brown – project management Barry Kline – circuit board photographs Brad Davis – sensor selection
REFERENCES
1. Don, Michael L. and Harkins, Thomas E., “Achieving High Resolution Measurements within a Limited Bandwidth via Sensor Data Compression,” ARL-RP-444, June 2013 2. Brown, Thomas G. et al, “Development and Demonstration of a New Capability for Aerodynamic Characterization of Medium Caliber Projectiles,” 28th International Symposium on Ballistics, September 2014. 3. Bukowski, E., “Evaluation of Commercial-off-the-Shelf Lithium Batteries for use in Ballistic Telemetry Systems,” U.S. Army Research Laboratory, ARL-TR-4840, June 2009. 4. Bukowski, E., “High Impact Shock Survivability Study of Lithium Ion Polymer Cells for use in Ballistic Applications,” 44th Power Sources Conference, June 2010. 5. Bukowski, E., “Perfromance Evaluation of Lithium Ion and Lithium Polymer Batteries Subjected to a High Impact Shock Event,” 46th Power Sources Conference, June 2014. 6. Hepner, David J and Hollis, Michael S., “G-hardened optical alignment sensor,” 5909275 United States of America, June 1, 1999.