an optical investigation of combustion process of a … · an optical investigation of combustion...
TRANSCRIPT
ORIGINAL ARTICLE
An optical investigation of combustion process of a directhigh-pressure injection of natural gas
Ryosuke Ishibashi1 • Daisuke Tsuru1
Received: 5 August 2014 /Accepted: 13 November 2016 / Published online: 3 December 2016
� The Author(s) 2016. This article is published with open access at Springerlink.com
Abstract More than 90%ofworldwide cargo transportation
is carried out by ships. Nowadays, a contradictory circum-
stance like tough exhaust emission regulations for ocean-
going ships by International Maritime Organization (IMO)
and deterioration in the quality of marine fuel forces some
challenges. A change to another fuel, such as liquefied nat-
ural gas (LNG), is conceivable. To create ideas for such the
new combustion system, it is essential to visualize the
combustion process and find the actual problems. For that
target, a world largest class Rapid Compression and
ExpansionMachine (RCEMwith 200-mm-wide or 240-mm-
diameter window) that holds under 20 MPa cylinder pres-
sure has been designed and built by the authors. This RCEM
is equipped with several electronically controlled fuel
injection systems for both liquid fuel and gas fuel. Charac-
teristics of diesel spray combustion and gas injection (GI)
combustion can be analyzed using direct photography and
some kinds of laser optical techniques. After one-shot
burning of the fuel, the burnt gas is sent from RCEM to a gas
analyzer and NOx, CO, CO2 and THC can be measured. In
this paper, a fundamental difference of combustion process
between diesel and GI is made clear. However, as GI com-
bustion emits much higher NOx than the lean-burn, some
measures like EGR is necessary for the IMO Tier 3 NOx
regulation. The GI combustion under EGR atmosphere
(lower oxygen %) is also visualized. Some data of GI com-
bustion are obtained by above-mentioned experiments.
However, the phenomena are too complicated. As the next
task, to create and validate a calculation model is important
to optimize the GI system. In this study, the three-dimen-
sional CFD code, KIVA3V, combined with the software tool
for solving complex chemical kinetics, SENKIN, was
modified for GI combustion.
Keywords Gas engine � Gas direct injection � Methane �Optical engine � Large engine � Marine diesel engine
1 Introduction
The use of natural gas, whose main component is methane
(CH4), as a fuel for vessels is a highly promising solution to
meet challenges of technical compliance requested by
upcoming carbon dioxide (CO2) and emission regulations.
The gas injection (GI) combustion system for which high-
pressure gas is directly injected into the cylinder is described
here. In a typical low-speed two-stroke GI engine, gas at
25–30 MPa is injected through gas injection nozzles fitted on
the cylinder head at the end of compression stroke; it is then
ignited by a small amount of liquid fuel injected from pilot
fuel injectors. The combustion pattern of a GI engine is
totally different from that of what we call the premixed lean-
burn gas combustion; rather, it is much closer to the diffusive
combustion that occurs in diesel spray combustion.
Referring to the history of GI type gas engines during
the 1980s, many low-speed engine builders began devel-
oping and testing two-stroke dual-fuel (DF) engines for use
on LNG carriers, so as to make it possible to burn the boil-
off gas as fuel.
After the developing time, MES (Mitsui Engineering and
Shipbuilding Co., Ltd) built the 12K80MC-GI-S (40 MW)
engine with a bore of 800 mm and 12 cylinders [1]. This
engine was operated for a total of 20,000 h during
1994–2003 as a local power station at the company’s Chiba
& Daisuke Tsuru
1 Department of Energy and Environmental Engineering,
Kyushu University, Ksuga-koen 6-1, Kasuga, Fukuoka, Japan
123
J Mar Sci Technol (2017) 22:447–458
DOI 10.1007/s00773-016-0422-x

shipyard. The technology developed by MES has been later
incorporated into the followingME-GI engine development.
At MAN Diesel & Turbo AS, a test engine 4T50ME-X
(number of cylinders: 4, bore: 500 mm, stroke: 2200 mm,
MCR speed: 123 rpm, MCR power: 7080 kW) has been
converted to a GI engine and various tests related to the
practical application have been conducted. The Pme (mean
effective pressure) has already reached a level of 2 MPa [2].
However, fundamental studies [3] on the combustion
process with GI system have not so often been discussed.
To create the new ideas, for example, to reduce NOx
emission and to improve the thermal efficiency at the same
time, it is essential to clarify how the gas-jet is burning in
the GI engine in detail. Moreover, the injection and mixture
process of gas jet differ essentially from diesel spray pro-
cess in that gas jet has no evaporation process. Self-ignition
temperature of methane is much higher than that of gas oil.
GI combustion requires the pilot diesel spray for ignition.
Conversely, GI combustion can control the fuel–air mixing
by changing the injection timing of pilot diesel spray.
Therefore, this paper reveals the feature of GI combustion
by comparing with diesel combustion.
For that purpose, the authors have developed a rapid
compression and expansion machine (RCEM) to visualize
the GI combustion process. The RCEM also helps to clarify
the emission-influencing parameters such as injection
condition and oxygen concentration.
In the first series of experiments, a cylinder head with a
cuboid-shaped clearance volume and an observation view
of 200 mm in width and 50 mm in height is applied to
analyze a single GI flame. In the experiments, pure
methane, the main component of natural gas, is burned and
compared to the diesel spray combustion.
For the second series of experiments, the combustion
chamber is replaced with a cylindrical volume simulating a
current two-stroke GI engine. It is designed to allow an
observation of multi-flames in swirling air through a
240-mm-dia. window.
Some data of GI combustion are obtained by above-
mentioned experiments. However, the phenomena are too
complicated. As the next task, to create and validate a cal-
culationmodel is important to optimize theGI system. In this
study, the three-dimensional CFD code, KIVA3V, combined
with the software tool for solving complex chemical kinetics,
SENKIN, was modified for GI combustion.
2 Rapid compression and expansion machine(RCEM)
A single-cylinder test engine has been completely mod-
ified and converted into the rapid compression and
expansion machine (RCEM). The arrangement shown in
Fig. 1 is for the above-mentioned multi-flames investi-
gation by the cylindrical combustion chamber (described
in Sect. 4). On the other hand, the cuboid-shaped clear-
ance volume shown in Fig. 2 with a pair of glass win-
dows (200 mm wide) on both sides allows various
optical investigations for the single flame combustion
(Sect. 3).
The experimental procedure is as follows. Prior to the
experiment, the charge air is pre-heated and pre-com-
pressed in the large air tank shown in Fig. 1. This two-
stage compression concept allows the experimentation at
sufficiently high compression pressure (Pc) and
Air tank
Gas injector
Quartzwindow
Pilotinjector
Decompvalve
Fig. 1 Rapid compression and expansion machine (RCEM) (ar-
rangement for top view described in Sect. 4)
Fig. 2 Combustion chamber for single flame observation described
in Sect. 3
448 J Mar Sci Technol (2017) 22:447–458
123
temperature (Tc) at the combustion, though the compres-
sion ratio is fairly low (around 8). Moreover, Pc and Tc can
be easily changed depending on the experimental
conditions.
The RCEM is a one-shot firing machine: an electric
motor accelerates the RCEM to 300 rpm, and an intake
valve is actuated only once, allowing the pre-heated and
pre-compressed air to flow into the cylinder and one real
cycle of compression and combustion is carried out. After
that, all the burned gas is sent to a gas analyzer and NOx,
CO, and THC can be measured.
Electronically controlled fuel injection systems are
utilized, not only for the gas injection but also for the
diesel oil pilot injection. The electronically controlled
fuel injection system has the merit that any injection
timing and duration can be chosen. A gas booster can
pressurize the methane up to 50 MPa. The gas injector
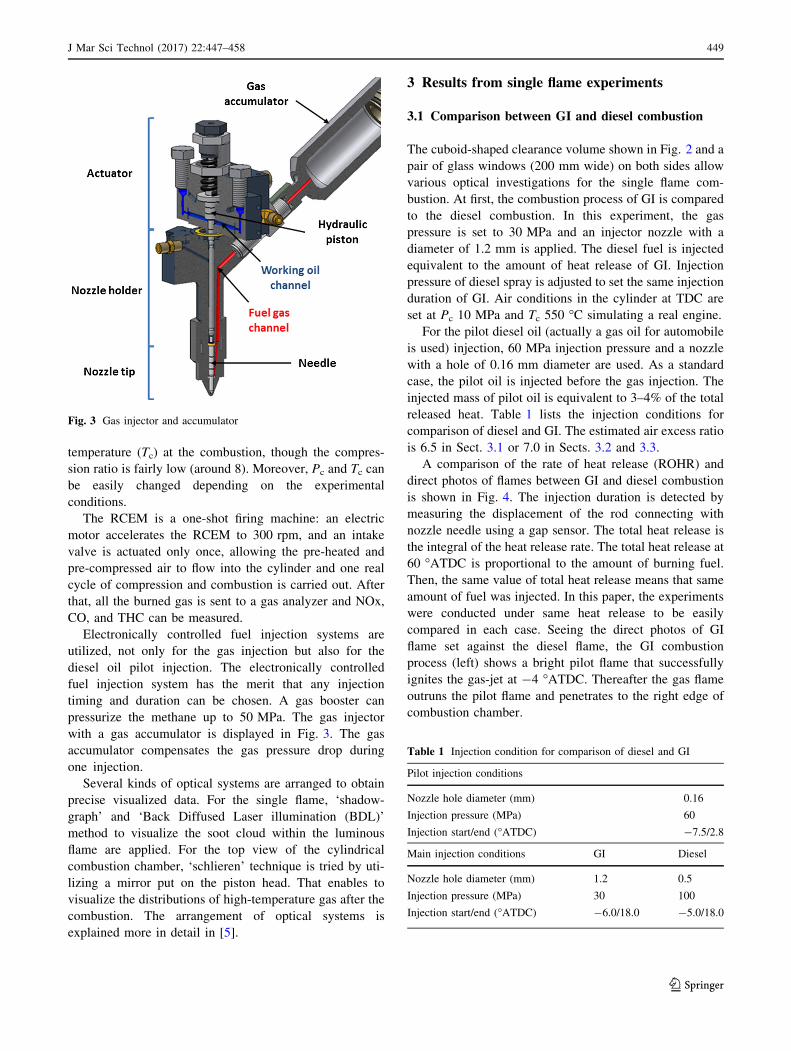
with a gas accumulator is displayed in Fig. 3. The gas
accumulator compensates the gas pressure drop during
one injection.
Several kinds of optical systems are arranged to obtain
precise visualized data. For the single flame, ‘shadow-
graph’ and ‘Back Diffused Laser illumination (BDL)’
method to visualize the soot cloud within the luminous
flame are applied. For the top view of the cylindrical
combustion chamber, ‘schlieren’ technique is tried by uti-
lizing a mirror put on the piston head. That enables to
visualize the distributions of high-temperature gas after the
combustion. The arrangement of optical systems is
explained more in detail in [5].
3 Results from single flame experiments
3.1 Comparison between GI and diesel combustion
The cuboid-shaped clearance volume shown in Fig. 2 and a
pair of glass windows (200 mm wide) on both sides allow
various optical investigations for the single flame com-
bustion. At first, the combustion process of GI is compared
to the diesel combustion. In this experiment, the gas
pressure is set to 30 MPa and an injector nozzle with a
diameter of 1.2 mm is applied. The diesel fuel is injected
equivalent to the amount of heat release of GI. Injection
pressure of diesel spray is adjusted to set the same injection
duration of GI. Air conditions in the cylinder at TDC are
set at Pc 10 MPa and Tc 550 �C simulating a real engine.
For the pilot diesel oil (actually a gas oil for automobile
is used) injection, 60 MPa injection pressure and a nozzle
with a hole of 0.16 mm diameter are used. As a standard
case, the pilot oil is injected before the gas injection. The
injected mass of pilot oil is equivalent to 3–4% of the total
released heat. Table 1 lists the injection conditions for
comparison of diesel and GI. The estimated air excess ratio
is 6.5 in Sect. 3.1 or 7.0 in Sects. 3.2 and 3.3.
A comparison of the rate of heat release (ROHR) and
direct photos of flames between GI and diesel combustion
is shown in Fig. 4. The injection duration is detected by
measuring the displacement of the rod connecting with
nozzle needle using a gap sensor. The total heat release is
the integral of the heat release rate. The total heat release at
60 �ATDC is proportional to the amount of burning fuel.
Then, the same value of total heat release means that same
amount of fuel was injected. In this paper, the experiments
were conducted under same heat release to be easily
compared in each case. Seeing the direct photos of GI
flame set against the diesel flame, the GI combustion
process (left) shows a bright pilot flame that successfully
ignites the gas-jet at -4 �ATDC. Thereafter the gas flame
outruns the pilot flame and penetrates to the right edge of
combustion chamber.
Fig. 3 Gas injector and accumulator
Table 1 Injection condition for comparison of diesel and GI
Pilot injection conditions
Nozzle hole diameter (mm) 0.16
Injection pressure (MPa) 60
Injection start/end (�ATDC) -7.5/2.8
Main injection conditions GI Diesel
Nozzle hole diameter (mm) 1.2 0.5
Injection pressure (MPa) 30 100
Injection start/end (�ATDC) -6.0/18.0 -5.0/18.0
J Mar Sci Technol (2017) 22:447–458 449
123

Compared to the diesel flame, the gas flame looks less
bright, as expected from the lower C/H ratio of methane,
and it has a wider flame breadth than the diesel flame.
Though the gas injection pressure of 30 MPa is much lower
than the diesel injection pressure of 100 MPa, the pene-
tration of gas flame is equivalent to the diesel flame, for
example at 0 deg. and 6 deg.. A special feature of GI case
is that the visible flame looks unable to come up to the
injection nozzle side from the ignition point during and
after the gas injection.
Though GI and diesel combustion have the differences
mentioned above, the ROHR by GI combustion is close to
that of the diesel combustion, as seen from Fig. 4. Seeing
in detail, ROHR of GI raises steeper just after the ignition,
maybe because of the pilot oil combustion. However, the
maximum rate is a little smaller in the GI case than the
diesel combustion.
In the emission data shown in Table 2, GI combustion
emits smaller CO but higher HC than the diesel. HC,
unburned methane from this experiment is estimated to be
about 0.5% of total injected gas. This is much less than the
case of lean-burn gas combustion, where normally 2–3%
methane slip is observed.
As mentioned, the luminosity of GI flame is lower than
the luminosity of diesel flame, and proportionally the
temperature of GI flame should be lower than the tem-
perature of diesel flame. As shown in Table 2, NOx
emission from GI combustion results in about 3/4 of that of
the diesel. However, unlike the homogeneous combustion
of lean-burn gas engines, the drastic reduction of NOx
emission such as -80% is impossible.
To demonstrate how clean the GI combustion is, the
soot formation in the flame is visualized using the BDL
technique mentioned before. Two experiments are carried
out. The normal pilot injection is used as the ignition
source for the first experiment and a glow plug for the
second experiment to eliminate the soot formed by the pilot
gas oil. Figure 5 shows the shadowgraph and BDL photos
for GI flame in the above-mentioned two cases of ignition
sources. The black part of shadowgraph represents the
burning area and the black part of BDL photos shows the
soot cloud formed in the flame.
Looking at -1 deg. of BDL, it is clear that the pilot
flame forms a black soot cloud. At 7 deg., the soot from the
pilot flame is pushed by the following gas-jet to the flame
front. On the other hand, seeing the case of glow plug
ignition at 7 deg. where no pilot flame exists, though the
Fig. 4 Comparison between GI and diesel combustion [flame photos (right) and ROHR rate of heat release (left)]
Table 2 Comparison of emis-
sion dataFuel GI Diesel
CO (ppm) 8–10 44
HC (ppm) 69–87 21
NOx (ppm) 346–393 531
450 J Mar Sci Technol (2017) 22:447–458
123
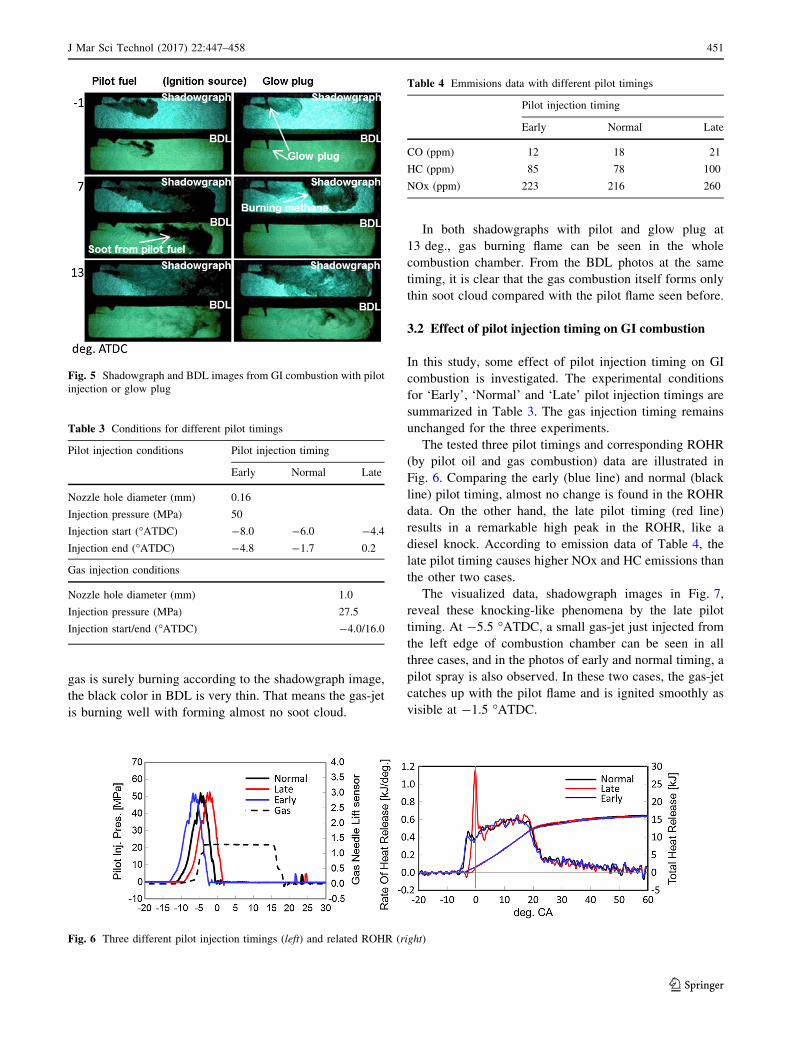
gas is surely burning according to the shadowgraph image,
the black color in BDL is very thin. That means the gas-jet
is burning well with forming almost no soot cloud.
In both shadowgraphs with pilot and glow plug at
13 deg., gas burning flame can be seen in the whole
combustion chamber. From the BDL photos at the same
timing, it is clear that the gas combustion itself forms only
thin soot cloud compared with the pilot flame seen before.
3.2 Effect of pilot injection timing on GI combustion
In this study, some effect of pilot injection timing on GI
combustion is investigated. The experimental conditions
for ‘Early’, ‘Normal’ and ‘Late’ pilot injection timings are
summarized in Table 3. The gas injection timing remains
unchanged for the three experiments.
The tested three pilot timings and corresponding ROHR
(by pilot oil and gas combustion) data are illustrated in
Fig. 6. Comparing the early (blue line) and normal (black
line) pilot timing, almost no change is found in the ROHR
data. On the other hand, the late pilot timing (red line)
results in a remarkable high peak in the ROHR, like a
diesel knock. According to emission data of Table 4, the
late pilot timing causes higher NOx and HC emissions than
the other two cases.
The visualized data, shadowgraph images in Fig. 7,
reveal these knocking-like phenomena by the late pilot
timing. At -5.5 �ATDC, a small gas-jet just injected from
the left edge of combustion chamber can be seen in all
three cases, and in the photos of early and normal timing, a
pilot spray is also observed. In these two cases, the gas-jet
catches up with the pilot flame and is ignited smoothly as
visible at -1.5 �ATDC.
Fig. 5 Shadowgraph and BDL images from GI combustion with pilot
injection or glow plug
Table 3 Conditions for different pilot timings
Pilot injection conditions Pilot injection timing
Early Normal Late
Nozzle hole diameter (mm) 0.16
Injection pressure (MPa) 50
Injection start (�ATDC) -8.0 -6.0 -4.4
Injection end (�ATDC) -4.8 -1.7 0.2
Gas injection conditions
Nozzle hole diameter (mm) 1.0
Injection pressure (MPa) 27.5
Injection start/end (�ATDC) -4.0/16.0
Fig. 6 Three different pilot injection timings (left) and related ROHR (right)
Table 4 Emmisions data with different pilot timings
Pilot injection timing
Early Normal Late
CO (ppm) 12 18 21
HC (ppm) 85 78 100
NOx (ppm) 223 216 260
J Mar Sci Technol (2017) 22:447–458 451
123
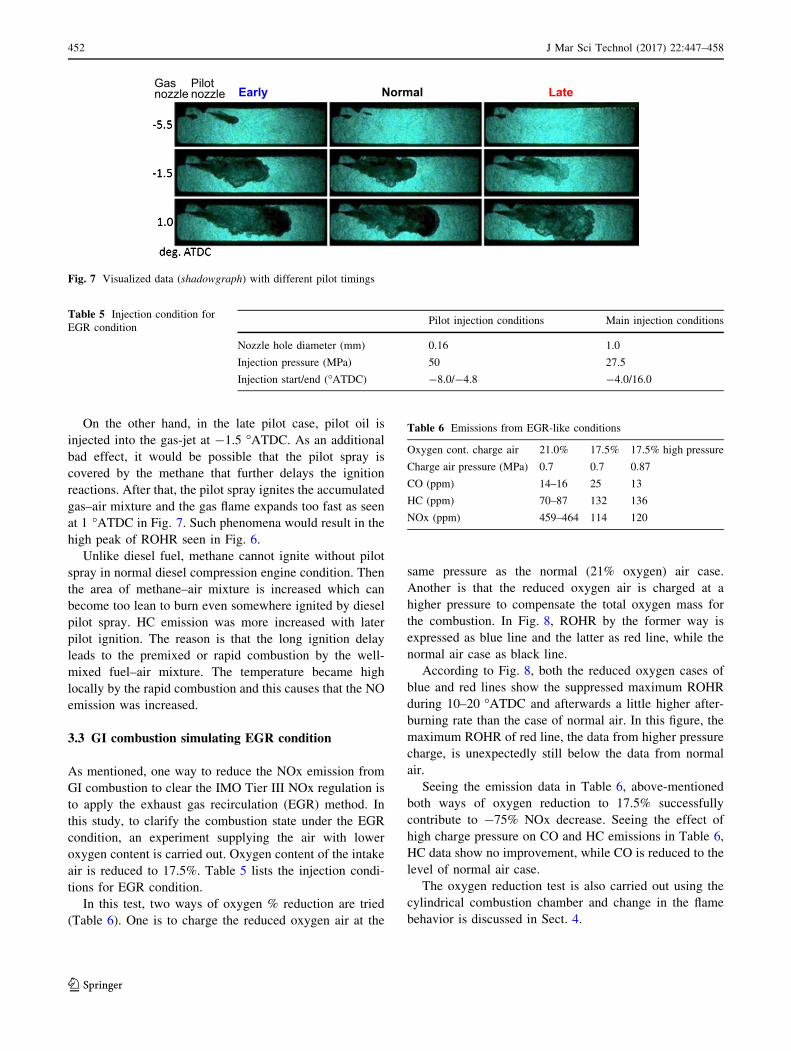
On the other hand, in the late pilot case, pilot oil is
injected into the gas-jet at -1.5 �ATDC. As an additional
bad effect, it would be possible that the pilot spray is
covered by the methane that further delays the ignition
reactions. After that, the pilot spray ignites the accumulated
gas–air mixture and the gas flame expands too fast as seen
at 1 �ATDC in Fig. 7. Such phenomena would result in the
high peak of ROHR seen in Fig. 6.
Unlike diesel fuel, methane cannot ignite without pilot
spray in normal diesel compression engine condition. Then
the area of methane–air mixture is increased which can
become too lean to burn even somewhere ignited by diesel
pilot spray. HC emission was more increased with later
pilot ignition. The reason is that the long ignition delay
leads to the premixed or rapid combustion by the well-
mixed fuel–air mixture. The temperature became high
locally by the rapid combustion and this causes that the NO
emission was increased.
3.3 GI combustion simulating EGR condition
As mentioned, one way to reduce the NOx emission from
GI combustion to clear the IMO Tier III NOx regulation is
to apply the exhaust gas recirculation (EGR) method. In
this study, to clarify the combustion state under the EGR
condition, an experiment supplying the air with lower
oxygen content is carried out. Oxygen content of the intake
air is reduced to 17.5%. Table 5 lists the injection condi-
tions for EGR condition.
In this test, two ways of oxygen % reduction are tried
(Table 6). One is to charge the reduced oxygen air at the
same pressure as the normal (21% oxygen) air case.
Another is that the reduced oxygen air is charged at a
higher pressure to compensate the total oxygen mass for
the combustion. In Fig. 8, ROHR by the former way is
expressed as blue line and the latter as red line, while the
normal air case as black line.
According to Fig. 8, both the reduced oxygen cases of
blue and red lines show the suppressed maximum ROHR
during 10–20 �ATDC and afterwards a little higher after-
burning rate than the case of normal air. In this figure, the
maximum ROHR of red line, the data from higher pressure
charge, is unexpectedly still below the data from normal
air.
Seeing the emission data in Table 6, above-mentioned
both ways of oxygen reduction to 17.5% successfully
contribute to -75% NOx decrease. Seeing the effect of
high charge pressure on CO and HC emissions in Table 6,
HC data show no improvement, while CO is reduced to the
level of normal air case.
The oxygen reduction test is also carried out using the
cylindrical combustion chamber and change in the flame
behavior is discussed in Sect. 4.
Gas Pilotnozzle nozzle Early Normal Late
Fig. 7 Visualized data (shadowgraph) with different pilot timings
Table 5 Injection condition for
EGR conditionPilot injection conditions Main injection conditions
Nozzle hole diameter (mm) 0.16 1.0
Injection pressure (MPa) 50 27.5
Injection start/end (�ATDC) -8.0/-4.8 -4.0/16.0
Table 6 Emissions from EGR-like conditions
Oxygen cont. charge air 21.0% 17.5% 17.5% high pressure
Charge air pressure (MPa) 0.7 0.7 0.87
CO (ppm) 14–16 25 13
HC (ppm) 70–87 132 136
NOx (ppm) 459–464 114 120
452 J Mar Sci Technol (2017) 22:447–458
123

4 Image of GI combustion in a real engine
4.1 Experimental conditions
To visualize the GI combustion in more realistic condi-
tions, the cylinder head with a cylindrical combustion
chamber (Fig. 1) equipped with a glass for whole bore
(240 mm) observation is installed. When air is induced into
this combustion chamber from an inclined intake port,
swirling flow whose tangential velocity is around 15 m/s
(measured value at TDC by the PIV method) is generated.
This velocity is almost same as in a modern low-speed two-
stroke diesel engine [4].
A gas injection nozzle with four holes whose injection
directions are shown in Fig. 9 is applied simulating the side
injection system of two-stroke engines. A pilot injection
nozzle with one hole is installed at just upstream position
as seen in the figure.
The injection nozzle is tested with four holes of
0.7 mm diameter. Gas injection pressure is set at
31.5 MPa. In this paper, the combination of 0.7 mm
diameter and 31.5 MPa injection pressure is defined as
the ‘standard’ gas injection condition. Experimental
conditions are summarized in Table 7. The air condition
at compression end is set at Pc 9 MPa and Tc 500 �C,which represents a partial load of a real low-speed two-
stroke GI engine. The estimated air excess ratio is
around 8.8 in Sect. 4.
As mentioned in Sect. 2, the schlieren photo technique
is applied for detailed observation. The schlieren photos
(center) give more information than the direct photos (left)
in Fig. 9, the black part downstream of the flame at
16 �ATDC indicates the burned hot gas distribution by the
effect of air swirl on the flame.
4.2 Image of GI multiple flames in air swirl
4.2.1 Diesel and GI combustion
Figure 10 shows the schlieren photos of diesel and GI
flames. In the left side of the figure, gas oil is injected at a
pressure of 135 MPa from the diesel nozzle with four holes
of 0.3 mm diameter. In the center, methane is injected in
the above-mentioned ‘standard’ condition into the normal
air. Photos in the right side are GI flames in the air with
lower oxygen (17.3%) simulating the EGR condition.
Comparing the diesel flame (left) and GI flame in the
normal air (center), difference in the brightness of flames
is seen like the single flame photos in Fig. 4. Moreover,
the diesel flame with strong penetration is less affected by
the swirl flow from 8 to 12 �ATDC compared to the GI
case. However, as little difference in the distribution of
burned gas, the black part downstream from the flame, is
found at 16 and 20 deg., it is not concluded that the
optimum swirl intensity is different between for diesel
and GI combustion.
Fig. 8 Change in ROHR by reducing oxygen % simulating EGR
condition
Direct photos Schlieren in Nitrogen
0
8
12
16C
rank
Ang
le [A
TDC
]
Pilotspray
Methanegas-jet
Pilotflame
Swirl
010
3040
GasPilot fuel
Fig. 9 Photos of GI multi-flames/jets using several optical techniques
(gas injection condition: ‘standard’ in Table 5)
J Mar Sci Technol (2017) 22:447–458 453
123
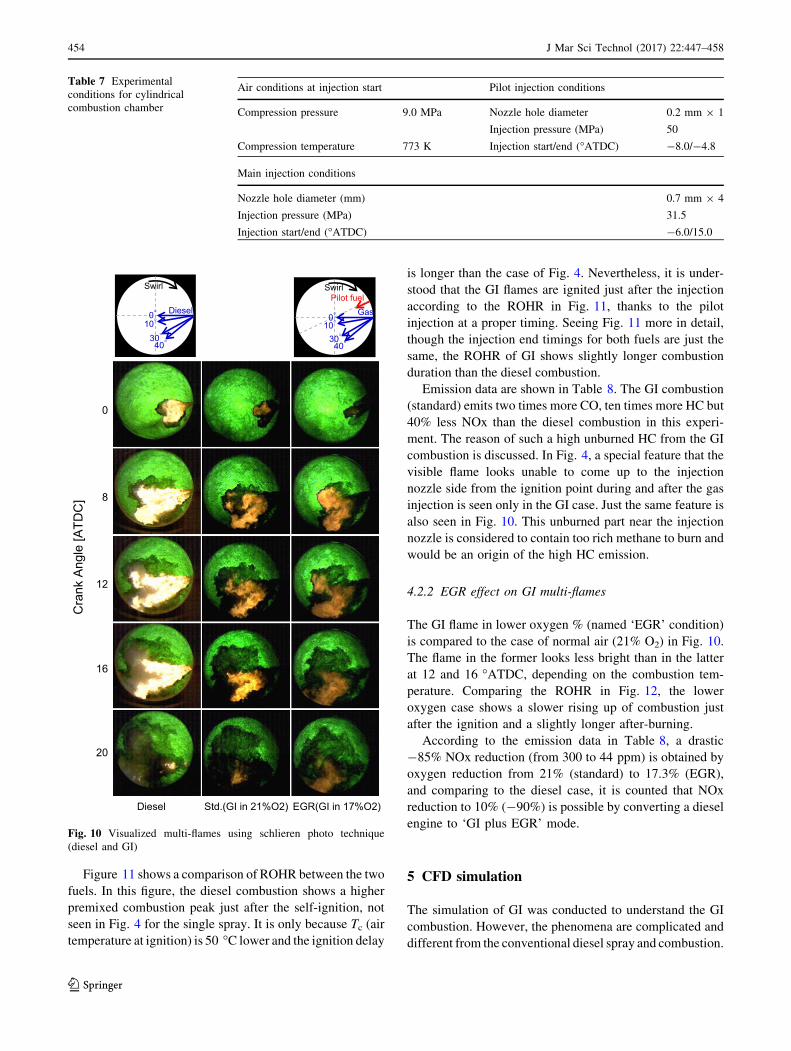
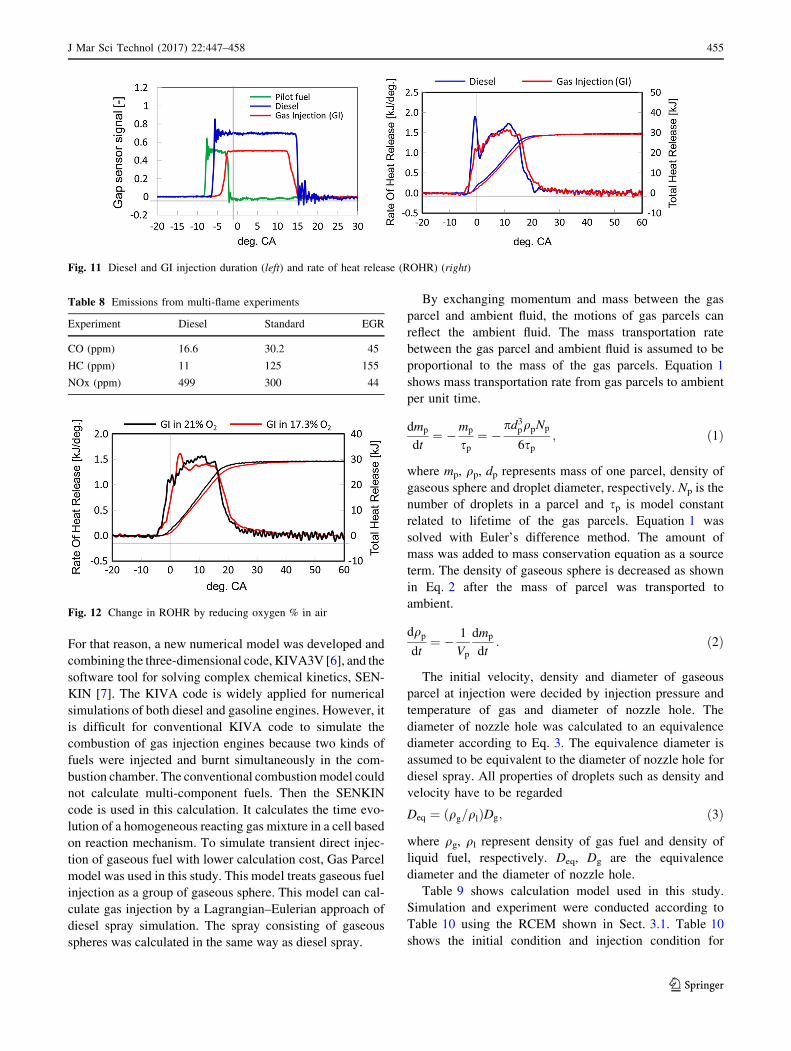
Figure 11 shows a comparison of ROHR between the two
fuels. In this figure, the diesel combustion shows a higher
premixed combustion peak just after the self-ignition, not
seen in Fig. 4 for the single spray. It is only because Tc (air
temperature at ignition) is 50 �C lower and the ignition delay
is longer than the case of Fig. 4. Nevertheless, it is under-
stood that the GI flames are ignited just after the injection
according to the ROHR in Fig. 11, thanks to the pilot
injection at a proper timing. Seeing Fig. 11 more in detail,
though the injection end timings for both fuels are just the
same, the ROHR of GI shows slightly longer combustion
duration than the diesel combustion.
Emission data are shown in Table 8. The GI combustion
(standard) emits two times more CO, ten times more HC but
40% less NOx than the diesel combustion in this experi-
ment. The reason of such a high unburned HC from the GI
combustion is discussed. In Fig. 4, a special feature that the
visible flame looks unable to come up to the injection
nozzle side from the ignition point during and after the gas
injection is seen only in the GI case. Just the same feature is
also seen in Fig. 10. This unburned part near the injection
nozzle is considered to contain too rich methane to burn and
would be an origin of the high HC emission.
4.2.2 EGR effect on GI multi-flames
The GI flame in lower oxygen % (named ‘EGR’ condition)
is compared to the case of normal air (21% O2) in Fig. 10.
The flame in the former looks less bright than in the latter
at 12 and 16 �ATDC, depending on the combustion tem-
perature. Comparing the ROHR in Fig. 12, the lower
oxygen case shows a slower rising up of combustion just
after the ignition and a slightly longer after-burning.
According to the emission data in Table 8, a drastic
-85% NOx reduction (from 300 to 44 ppm) is obtained by
oxygen reduction from 21% (standard) to 17.3% (EGR),
and comparing to the diesel case, it is counted that NOx
reduction to 10% (-90%) is possible by converting a diesel
engine to ‘GI plus EGR’ mode.
5 CFD simulation
The simulation of GI was conducted to understand the GI
combustion. However, the phenomena are complicated and
different from the conventional diesel spray and combustion.
Table 7 Experimental
conditions for cylindrical
combustion chamber
Air conditions at injection start Pilot injection conditions
Compression pressure 9.0 MPa Nozzle hole diameter 0.2 mm 9 1
Injection pressure (MPa) 50
Compression temperature 773 K Injection start/end (�ATDC) -8.0/-4.8
Main injection conditions
Nozzle hole diameter (mm) 0.7 mm 9 4
Injection pressure (MPa) 31.5
Injection start/end (�ATDC) -6.0/15.0
0
8
12
16
20
Cra
nk A
ngle
[ATD
C]
Diesel Std.(GI in 21%O2) EGR(GI in 17%O2)
Swirl
010
3040
Diesel
Swirl
010
3040
GasPilot fuel
Fig. 10 Visualized multi-flames using schlieren photo technique
(diesel and GI)
454 J Mar Sci Technol (2017) 22:447–458
123
For that reason, a new numerical model was developed and
combining the three-dimensional code, KIVA3V [6], and the
software tool for solving complex chemical kinetics, SEN-
KIN [7]. The KIVA code is widely applied for numerical
simulations of both diesel and gasoline engines. However, it
is difficult for conventional KIVA code to simulate the
combustion of gas injection engines because two kinds of
fuels were injected and burnt simultaneously in the com-
bustion chamber. The conventional combustionmodel could
not calculate multi-component fuels. Then the SENKIN
code is used in this calculation. It calculates the time evo-
lution of a homogeneous reacting gas mixture in a cell based
on reaction mechanism. To simulate transient direct injec-
tion of gaseous fuel with lower calculation cost, Gas Parcel
model was used in this study. This model treats gaseous fuel
injection as a group of gaseous sphere. This model can cal-
culate gas injection by a Lagrangian–Eulerian approach of
diesel spray simulation. The spray consisting of gaseous
spheres was calculated in the same way as diesel spray.
By exchanging momentum and mass between the gas
parcel and ambient fluid, the motions of gas parcels can
reflect the ambient fluid. The mass transportation rate
between the gas parcel and ambient fluid is assumed to be
proportional to the mass of the gas parcels. Equation 1
shows mass transportation rate from gas parcels to ambient
per unit time.
dmp
dt¼ �mp
sp¼ �
pd3pqpNp
6sp; ð1Þ
where mp, qp, dp represents mass of one parcel, density of
gaseous sphere and droplet diameter, respectively. Np is the
number of droplets in a parcel and sp is model constant
related to lifetime of the gas parcels. Equation 1 was
solved with Euler’s difference method. The amount of
mass was added to mass conservation equation as a source
term. The density of gaseous sphere is decreased as shown
in Eq. 2 after the mass of parcel was transported to
ambient.
dqpdt
¼ � 1
Vp
dmp
dt: ð2Þ
The initial velocity, density and diameter of gaseous
parcel at injection were decided by injection pressure and
temperature of gas and diameter of nozzle hole. The
diameter of nozzle hole was calculated to an equivalence
diameter according to Eq. 3. The equivalence diameter is
assumed to be equivalent to the diameter of nozzle hole for
diesel spray. All properties of droplets such as density and
velocity have to be regarded
Deq ¼ ðqg=qlÞDg; ð3Þ
where qg, ql represent density of gas fuel and density of
liquid fuel, respectively. Deq, Dg are the equivalence
diameter and the diameter of nozzle hole.
Table 9 shows calculation model used in this study.
Simulation and experiment were conducted according to
Table 10 using the RCEM shown in Sect. 3.1. Table 10
shows the initial condition and injection condition for
Fig. 11 Diesel and GI injection duration (left) and rate of heat release (ROHR) (right)
Table 8 Emissions from multi-flame experiments
Experiment Diesel Standard EGR
CO (ppm) 16.6 30.2 45
HC (ppm) 11 125 155
NOx (ppm) 499 300 44
Fig. 12 Change in ROHR by reducing oxygen % in air
J Mar Sci Technol (2017) 22:447–458 455
123
simulation and experiment. Initial pressure was changed to
keep the oxygen mass with reduction of oxygen concen-
tration. The number of cells used in this simulation is about
100,000 at BDC. Minimum cell size is 5 9 4 9 4 mm.
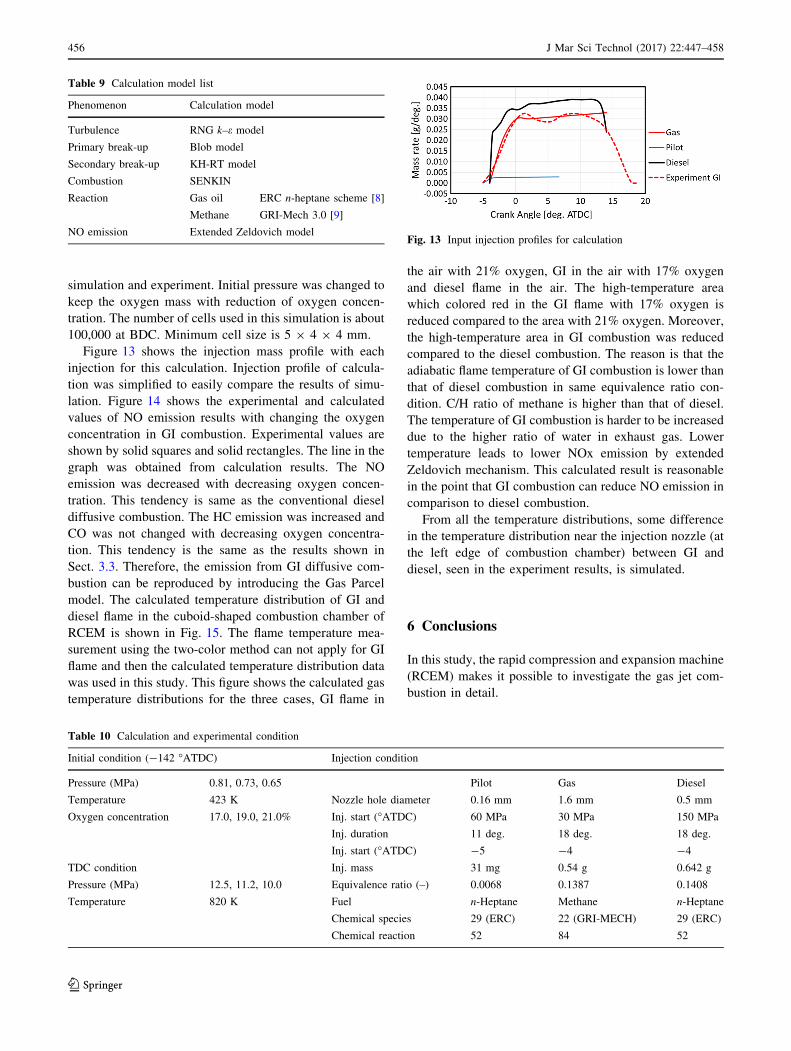
Figure 13 shows the injection mass profile with each
injection for this calculation. Injection profile of calcula-
tion was simplified to easily compare the results of simu-
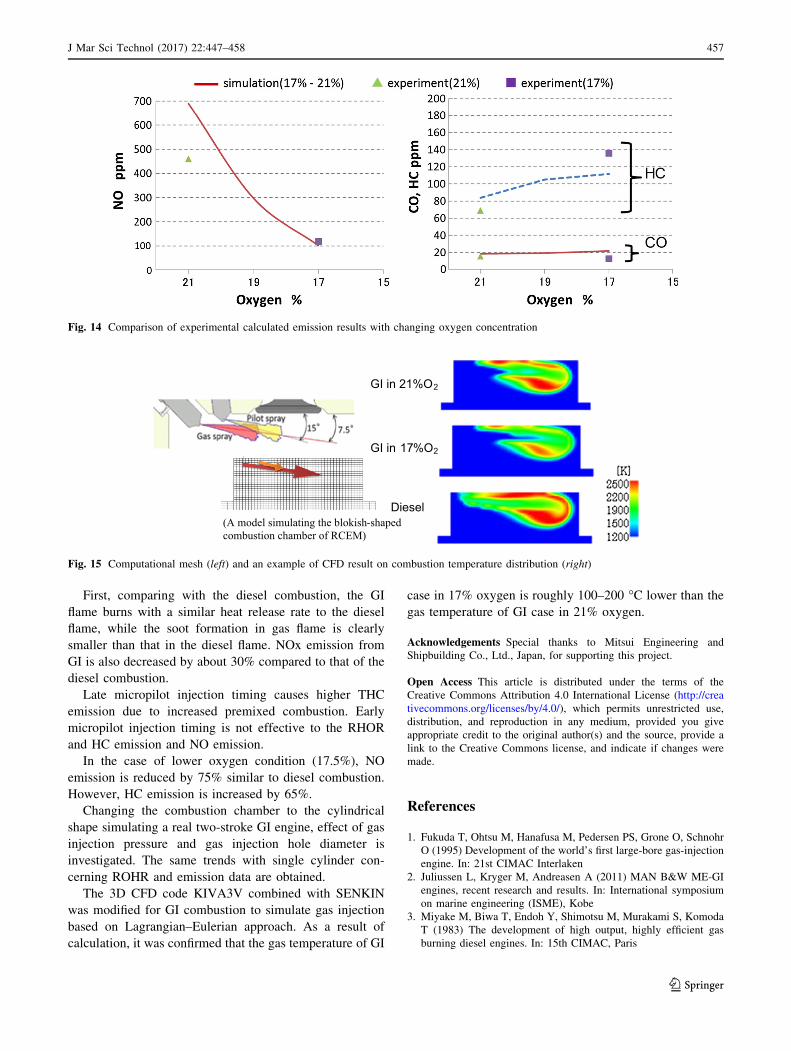
lation. Figure 14 shows the experimental and calculated
values of NO emission results with changing the oxygen
concentration in GI combustion. Experimental values are
shown by solid squares and solid rectangles. The line in the
graph was obtained from calculation results. The NO
emission was decreased with decreasing oxygen concen-
tration. This tendency is same as the conventional diesel
diffusive combustion. The HC emission was increased and
CO was not changed with decreasing oxygen concentra-
tion. This tendency is the same as the results shown in
Sect. 3.3. Therefore, the emission from GI diffusive com-
bustion can be reproduced by introducing the Gas Parcel
model. The calculated temperature distribution of GI and
diesel flame in the cuboid-shaped combustion chamber of
RCEM is shown in Fig. 15. The flame temperature mea-
surement using the two-color method can not apply for GI
flame and then the calculated temperature distribution data
was used in this study. This figure shows the calculated gas
temperature distributions for the three cases, GI flame in
the air with 21% oxygen, GI in the air with 17% oxygen
and diesel flame in the air. The high-temperature area
which colored red in the GI flame with 17% oxygen is
reduced compared to the area with 21% oxygen. Moreover,
the high-temperature area in GI combustion was reduced
compared to the diesel combustion. The reason is that the
adiabatic flame temperature of GI combustion is lower than
that of diesel combustion in same equivalence ratio con-
dition. C/H ratio of methane is higher than that of diesel.
The temperature of GI combustion is harder to be increased
due to the higher ratio of water in exhaust gas. Lower
temperature leads to lower NOx emission by extended
Zeldovich mechanism. This calculated result is reasonable
in the point that GI combustion can reduce NO emission in
comparison to diesel combustion.
From all the temperature distributions, some difference
in the temperature distribution near the injection nozzle (at
the left edge of combustion chamber) between GI and
diesel, seen in the experiment results, is simulated.
6 Conclusions
In this study, the rapid compression and expansion machine
(RCEM) makes it possible to investigate the gas jet com-
bustion in detail.
Table 9 Calculation model list
Phenomenon Calculation model
Turbulence RNG k–e model
Primary break-up Blob model
Secondary break-up KH-RT model
Combustion SENKIN
Reaction Gas oil ERC n-heptane scheme [8]
Methane GRI-Mech 3.0 [9]
NO emission Extended Zeldovich model
Table 10 Calculation and experimental condition
Initial condition (-142 �ATDC) Injection condition
Pressure (MPa) 0.81, 0.73, 0.65 Pilot Gas Diesel
Temperature 423 K Nozzle hole diameter 0.16 mm 1.6 mm 0.5 mm
Oxygen concentration 17.0, 19.0, 21.0% Inj. start (�ATDC) 60 MPa 30 MPa 150 MPa
Inj. duration 11 deg. 18 deg. 18 deg.
Inj. start (�ATDC) -5 -4 -4
TDC condition Inj. mass 31 mg 0.54 g 0.642 g
Pressure (MPa) 12.5, 11.2, 10.0 Equivalence ratio (–) 0.0068 0.1387 0.1408
Temperature 820 K Fuel n-Heptane Methane n-Heptane
Chemical species 29 (ERC) 22 (GRI-MECH) 29 (ERC)
Chemical reaction 52 84 52
Fig. 13 Input injection profiles for calculation
456 J Mar Sci Technol (2017) 22:447–458
123
First, comparing with the diesel combustion, the GI
flame burns with a similar heat release rate to the diesel
flame, while the soot formation in gas flame is clearly
smaller than that in the diesel flame. NOx emission from
GI is also decreased by about 30% compared to that of the
diesel combustion.
Late micropilot injection timing causes higher THC
emission due to increased premixed combustion. Early
micropilot injection timing is not effective to the RHOR
and HC emission and NO emission.
In the case of lower oxygen condition (17.5%), NO
emission is reduced by 75% similar to diesel combustion.
However, HC emission is increased by 65%.
Changing the combustion chamber to the cylindrical
shape simulating a real two-stroke GI engine, effect of gas
injection pressure and gas injection hole diameter is
investigated. The same trends with single cylinder con-
cerning ROHR and emission data are obtained.
The 3D CFD code KIVA3V combined with SENKIN
was modified for GI combustion to simulate gas injection
based on Lagrangian–Eulerian approach. As a result of
calculation, it was confirmed that the gas temperature of GI
case in 17% oxygen is roughly 100–200 �C lower than the
gas temperature of GI case in 21% oxygen.
Acknowledgements Special thanks to Mitsui Engineering and
Shipbuilding Co., Ltd., Japan, for supporting this project.
Open Access This article is distributed under the terms of the
Creative Commons Attribution 4.0 International License (http://crea
tivecommons.org/licenses/by/4.0/), which permits unrestricted use,
distribution, and reproduction in any medium, provided you give
appropriate credit to the original author(s) and the source, provide a
link to the Creative Commons license, and indicate if changes were
made.
References
1. Fukuda T, Ohtsu M, Hanafusa M, Pedersen PS, Grone O, Schnohr
O (1995) Development of the world’s first large-bore gas-injection
engine. In: 21st CIMAC Interlaken
2. Juliussen L, Kryger M, Andreasen A (2011) MAN B&W ME-GI
engines, recent research and results. In: International symposium
on marine engineering (ISME), Kobe
3. Miyake M, Biwa T, Endoh Y, Shimotsu M, Murakami S, Komoda
T (1983) The development of high output, highly efficient gas
burning diesel engines. In: 15th CIMAC, Paris
Fig. 14 Comparison of experimental calculated emission results with changing oxygen concentration
(A model simulating the blokish-shaped combustion chamber of RCEM)
GI in 21%O2
GI in 17%O2
Diesel
Fig. 15 Computational mesh (left) and an example of CFD result on combustion temperature distribution (right)
J Mar Sci Technol (2017) 22:447–458 457
123

4. Mayer S, Hult J, Nogenmyr K, Clausen S (2013) Advanced optical
development tools for two-stroke marine diesel engines. In: 27th
CIMAC, Shanghai, Paper No. 53
5. Imhof D, Tsuru D, Tajima H, Takasaki K (2013) High-pressure
natural gas injection (GI) marine engine research with a rapid
compression expansion machine. In: 27th CIMAC, Shanghai,
Paper No. 12
6. Amsden AA (1999) KIVA3V, Release 2, Improvement to
KIVA3V. Los Alamos National Laboratory Report LA-13608-MS
7. Luz AE, Kee RJ, Miller JA (1988) SENKIN: a FORTRAN
program for predicting homogeneous gas phase chemical kinetics
with sensitivity analysis. Sandia National Laboratories Report,
SAND 87-8248
8. Patel A, Kong S, Reitz R (2004) Development and validation of a
reduced reaction mechanism for HCCI engine simulations,
SAE2004-01-0558r
9. GRI-Mech 3.0 (Online). http://www.me.berkeley.edu/gri_mech/.
Accessed 14 Dec 2012
458 J Mar Sci Technol (2017) 22:447–458
123