an outcomes-oriented approach to alternativespa-pers.org/documents/11-19-2014powerpoint.pdfan...
TRANSCRIPT

GLOBAL INVESTMENT COMMITTEE
WEALTH MANAGEMENT
FOR INTERNAL USE ONLY – NOT FOR REDISTRIBUTION TO CLIE NTS
FALL 2014
An Outcomes-Oriented Approach to Alternatives
Global Investment Committee

FOR INTERNAL USE ONLY – NOT FOR REDISTRIBUTION TO CLIE NTS
WEALTH MANAGEMENT
GLOBAL INVESTMENT COMMITTEE FALL 2014
22
Complex
… OR ARE THEY?
RiskyRiskier than traditional
Investments
IlliquidThat’s something
to avoid
Not Widely Accessible
“Alternatives” - They are…
Expensive

FOR INTERNAL USE ONLY – NOT FOR REDISTRIBUTION TO CLIE NTS
WEALTH MANAGEMENT
GLOBAL INVESTMENT COMMITTEE FALL 2014
3
CommoditiesReal Estate
Venture CapitalCollectibles
CurrencyPrivate Equity
REITs
Master Limited Partnerships (MLPs)
Hedge Funds
What constitutes “Alternatives Investments”?
Structured Investments

FOR INTERNAL USE ONLY – NOT FOR REDISTRIBUTION TO CLIE NTS
WEALTH MANAGEMENT
GLOBAL INVESTMENT COMMITTEE FALL 2014
4
1 Alternatives asset classes are designed to provide better risk-adjusted performance than traditional long-only products
2 Alternatives asset classes aim to generate returns with low correlations to everything else the client owns (their traditional investments), adding diversification and lowering portfolio volatility
Why Consider Alternatives?

FOR INTERNAL USE ONLY – NOT FOR REDISTRIBUTION TO CLIE NTS
WEALTH MANAGEMENT
GLOBAL INVESTMENT COMMITTEE FALL 2014
Why Consider Alternatives?
5
*Dow Jones-UBS Commodity Total Return Index ** Barclays Capital US Aggregate Bond IndexSource: Bloomberg as of Dec. 31, 2013

FOR INTERNAL USE ONLY – NOT FOR REDISTRIBUTION TO CLIE NTS
WEALTH MANAGEMENT
GLOBAL INVESTMENT COMMITTEE FALL 2014
6
Why Consider Alternatives Now?
1. With interest rates rising and bond volatility increasing, bonds are not
Source: Morgan Stanley Wealth Management GIC as of Jan.31, 2014
As GDP Picks Up, Interest Rates Likely to Follow Eq uities Have Already Begun This Year More Volatile
Source: Morgan Stanley Wealth Management GIC as of Jan.31, 2014
likely to be an “anchor to windward”
FOR INTERNAL USE ONLY – NOT FOR REDISTRIBUTION TO CLIE NTS
WEALTH MANAGEMENT
GLOBAL INVESTMENT COMMITTEE FALL 2014
7
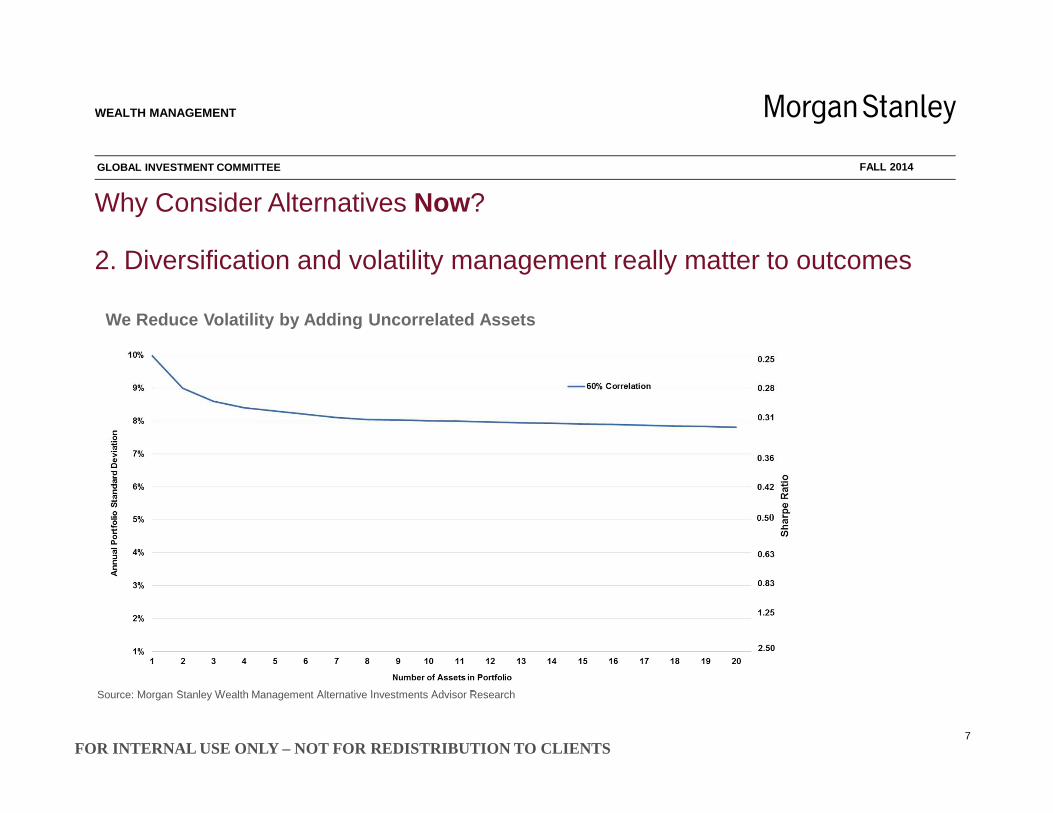
Source: Morgan Stanley Wealth Management Alternative Investments Advisor Research
We Reduce Volatility by Adding Uncorrelated Assets
Why Consider Alternatives Now?
2. Diversification and volatility management really matter to outcomes

FOR INTERNAL USE ONLY – NOT FOR REDISTRIBUTION TO CLIE NTS
WEALTH MANAGEMENT
GLOBAL INVESTMENT COMMITTEE FALL 2014
8
Source: Morgan Stanley Wealth Management Alternative Investments Advisor Research
Why Consider Alternatives Now?
2. Diversification and volatility management really matter to outcomes
We Reduce Volatility by Adding Uncorrelated Assets

FOR INTERNAL USE ONLY – NOT FOR REDISTRIBUTION TO CLIE NTS
WEALTH MANAGEMENT
GLOBAL INVESTMENT COMMITTEE FALL 2014
9
Source: Morgan Stanley Wealth Management Alternative Investments Advisor Research
Why Consider Alternatives Now?
2. Diversification and volatility management really matter to outcomes
We Reduce Volatility by Adding Uncorrelated Assets

FOR INTERNAL USE ONLY – NOT FOR REDISTRIBUTION TO CLIE NTS
WEALTH MANAGEMENT
GLOBAL INVESTMENT COMMITTEE FALL 2014
10
Source: Morgan Stanley Wealth Management Alternative Investments Advisor Research
Why Consider Alternatives Now?
2. Diversification and volatility management really matter to outcomes
The GIC Reduces Volatility by Adding Uncorrelated A ssets

FOR INTERNAL USE ONLY – NOT FOR REDISTRIBUTION TO CLIE NTS
WEALTH MANAGEMENT
GLOBAL INVESTMENT COMMITTEE FALL 2014
11
Source: Morgan Stanley Wealth Management Alternative Investments Advisor Research
Why Consider Alternatives Now?
2. Diversification and volatility management really matter to outcomes
The GIC Reduces Volatility by Adding Uncorrelated A ssets

FOR INTERNAL USE ONLY – NOT FOR REDISTRIBUTION TO CLIE NTS
WEALTH MANAGEMENT
GLOBAL INVESTMENT COMMITTEE FALL 2014
12
Source: Morgan Stanley Wealth Management GIC
Why Consider Alternatives Now?
2. Diversification and volatility management really matter to outcomes
Reducing Portfolio Volatility Increases Probability of Reaching Goals

FOR INTERNAL USE ONLY – NOT FOR REDISTRIBUTION TO CLIE NTS
WEALTH MANAGEMENT
GLOBAL INVESTMENT COMMITTEE FALL 2014
13
Source: Morgan Stanley Wealth Management GIC
Why Consider Alternatives Now?
2. Diversification and volatility management really matter to outcomes
Reducing Portfolio Volatility Increases Probability of Reaching Goals

FOR INTERNAL USE ONLY – NOT FOR REDISTRIBUTION TO CLIE NTS
WEALTH MANAGEMENT
GLOBAL INVESTMENT COMMITTEE FALL 2014
14
Three forces are now colliding, requiring us to revisit our assetallocation approach to alternative investments
New Alternatives Asset Allocation
Framework
Proliferationof alternativemutual funds
and ETFs
A clientaudience that has
becomedisillusioned, disengaged
and disappointed with Alternatives
Interest ratenormalization againsta backdrop of growing
retirement-orientedcapital preservationand income needs

FOR INTERNAL USE ONLY – NOT FOR REDISTRIBUTION TO CLIE NTS
WEALTH MANAGEMENT
GLOBAL INVESTMENT COMMITTEE FALL 2014
The GIC’s Framework Has Three Ambitions:
15
1
2
3 Set performance goals by establishing market-based benchmarks
Create a disciplined approach to Alternativesbased on investment characteristics
2 Improve ease of selecting Alternatives by aligning categories with client goals

FOR INTERNAL USE ONLY – NOT FOR REDISTRIBUTION TO CLIE NTS
WEALTH MANAGEMENT
GLOBAL INVESTMENT COMMITTEE FALL 2014
Alternative Strategies
Performance Since 1990,
Annualized (%)
Annual Volatility, 25-Year
Average (%) S&P 500
Barclays Capital Global
Aggregate Bond Index
25-Year Sharpe Ratio
Maximum Drawdown
(%)
Equity Long/Short 12.7 9.2 0.73 0.10 1.02 -30.6
Event Driven 11.6 6.8 0.70 0.10 1.21 -24.8
Hedge Fund of Funds Composite 7.3 5.2 0.62 0.13 1.21 -27.5
Relative Value 10.1 4.4 0.53 0.10 1.56 -18.0
Equity Market Neutral 6.8 3.2 0.32 0.10 2.10 -9.2
Convertible Arbitrage 8.6 6.6 0.50 0.20 1.31 -25.3
Global Macro 11.6 7.5 0.33 0.30 1.12 -10.7
Distressed Credit 12.1 6.5 0.52 0.51 1.85 -27.4
Managed Futures 6.7 11.6 -0.10 0.18 1.00 -16.2
S&P 500 9.5 14.9 0.39 -50.9Barclays Capital Global Aggegate Bond Index 6.5 3.7 0.88 -5.1
Long-Run Correlations
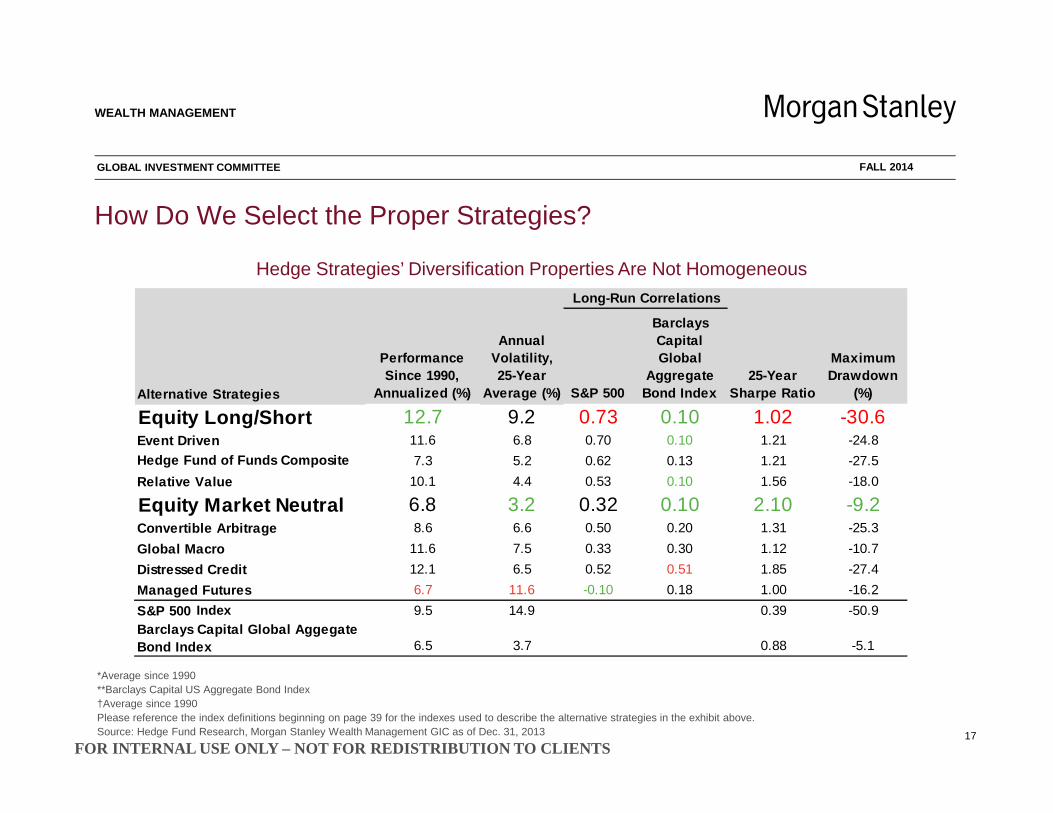
How Do We Select the Proper Strategies?
16
*Average since 1990**Barclays Capital US Aggregate Bond Index†Average since 1990Please reference the index definitions beginning on page 39 for the indexes used to describe the alternative strategies in the exhibit above.Source: Hedge Fund Research, Morgan Stanley Wealth Management GIC as of Dec. 31, 2013
Hedge Strategies’ Diversification Properties Are Not Homogeneous
Index
FOR INTERNAL USE ONLY – NOT FOR REDISTRIBUTION TO CLIE NTS
WEALTH MANAGEMENT
GLOBAL INVESTMENT COMMITTEE FALL 2014
How Do We Select the Proper Strategies?
17
*Average since 1990**Barclays Capital US Aggregate Bond Index†Average since 1990Please reference the index definitions beginning on page 39 for the indexes used to describe the alternative strategies in the exhibit above.Source: Hedge Fund Research, Morgan Stanley Wealth Management GIC as of Dec. 31, 2013
Hedge Strategies’ Diversification Properties Are Not Homogeneous
Alternative Strategies
Performance Since 1990,
Annualized (%)
Annual Volatility, 25-Year
Average (%) S&P 500
Barclays Capital Global
Aggregate Bond Index
25-Year Sharpe Ratio
Maximum Drawdown
(%)
Equity Long/Short 12.7 9.2 0.73 0.10 1.02 -30.6Event Driven 11.6 6.8 0.70 0.10 1.21 -24.8
Hedge Fund of Funds Composite 7.3 5.2 0.62 0.13 1.21 -27.5
Relative Value 10.1 4.4 0.53 0.10 1.56 -18.0
Equity Market Neutral 6.8 3.2 0.32 0.10 2.10 -9.2Convertible Arbitrage 8.6 6.6 0.50 0.20 1.31 -25.3
Global Macro 11.6 7.5 0.33 0.30 1.12 -10.7
Distressed Credit 12.1 6.5 0.52 0.51 1.85 -27.4
Managed Futures 6.7 11.6 -0.10 0.18 1.00 -16.2
S&P 500 9.5 14.9 0.39 -50.9Barclays Capital Global Aggegate Bond Index 6.5 3.7 0.88 -5.1
Long-Run Correlations
Index

FOR INTERNAL USE ONLY – NOT FOR REDISTRIBUTION TO CLIE NTS
WEALTH MANAGEMENT
GLOBAL INVESTMENT COMMITTEE FALL 2014
18
The GIC’s new Alternative Assets / Categories
Real Assets
Total ReturnAssets
Equity HedgeAssets
Equity ReturnAssets
OpportunisticAssets
Commodities ex Precious Metals Precious Metals/Gold, MLPs, Global REITs
Equity Market Neutral, Relative Value Strategies including Credit Long/Short
Global Macro, Managed Futures, Hedge Fund of Funds, Multi-Strategy Alts
Equity Long/Short, Event Driven
Private Equity, Private Direct Real Estate, Early Stage Venture, Distressed Lending, Direct Lending, Impact Investing, Timberland, Water, Collectibles, etc.

FOR INTERNAL USE ONLY – NOT FOR REDISTRIBUTION TO CLIE NTS
WEALTH MANAGEMENT
GLOBAL INVESTMENT COMMITTEE FALL 2014
Which Alternatives Asset Classes You Add to the Portfolio Matters
19
Note: Annualized return and annualized risk are for the period 2000 through 2013. *60% S&P 500/Barclays Capital US Aggregate Bond Index.Alternative asset classes mentioned above are drawn from the framework on slide 22.
Source: Morgan Stanley Wealth Management GIC as of Dec. 31, 2013

FOR INTERNAL USE ONLY – NOT FOR REDISTRIBUTION TO CLIE NTS
WEALTH MANAGEMENT
GLOBAL INVESTMENT COMMITTEE FALL 2014
20
Comparing Alternative Mutual Funds and Private Offerings
Alternative Mutual Funds and ETFs Private Offerings
Investment
Style Varies by Strategy Varies by Strategy
Flexibility Limited Investment Flexibility Greater Investment Flexibility
Derivatives Limited Use of Derivatives Greater Ability to Use Derivatives
Leverage Limited Use of Leverage Greater Ability to Use Leverage
Transparency High Generally Low
Correlation Generally Higher to Traditional Investments Generally Lower to Traditional Investments
OperationsMinimums Low Minimums High/Private Investor Qualifications
Fees Typically Asset-Based Management Fees Typically Management and Performance Fees
Tax Reporting IRS Form 1099 Typically IRS Form K-1
Redemptions Generally Daily Limited Opportunity to Redeem
RegulatoryOversight 1940 Act Restrictions Limited SEC Oversight
Diversification Requirements Position Sizes, Sector Exposure, etc. None—Diversification Varies Widely
Source: Consulting Group Investment Advisor Research as of April 29, 2013

FOR INTERNAL USE ONLY – NOT FOR REDISTRIBUTION TO CLIE NTS
WEALTH MANAGEMENT
GLOBAL INVESTMENT COMMITTEE FALL 2014
The GIC’s New Framework Employs an Outcomes-OrientedApproach to Using Alternatives Investments
21
CapitalPreservation
Client Goals
Income
BalancedGrowth
MarketGrowth
OpportunisticGrowth
Cash,Money Market Fund
Short-DurationBonds
PrimaryTraditional Assets
Bonds, High YieldEquity,
Convertibles,Preferred Stock
60%/40%Equities /Bonds
S&P 500 Plus
80% Plus Equities
Inflation Protection
Alternatives’ PortfolioMain Purpose
Real Assets
AlternativeAssets
CPI Plus
Client Goal SuggestedBenchmark
Income/Cash Flow
Preservation
Total ReturnAssets
T-Bill orLIBOR Plus
Volatility Reduction
Equity HedgeAssets
Risk-Adjusted60/40
Equity Diversification
Equity ReturnAssets
Risk-AdjustedS&P 500 Plus
Growth Amplification
OpportunisticAssets Customized

FOR INTERNAL USE ONLY – NOT FOR REDISTRIBUTION TO CLIE NTS
WEALTH MANAGEMENT
GLOBAL INVESTMENT COMMITTEE FALL 2014
22
“If it walks like a duck…”
Our disciplinedapproach means
many funds previously categorized as
“Alternatives” will now be classified as “Other”
The Global Investment Committee’s Outcomes Framework for Alternatives is not provided as part of an investment advisory service offered by Morgan Stanley Wealth Management, is notavailable to be directly implemented as part of an investment advisory service and should not be regarded as a recommendation of any Morgan Stanley Wealth Management investmentadvisory service. Estimates of returns are in US dollars. The Outcomes Framework for Alternatives does not reflect the investment or performance of actual portfolios. Estimates of returns aregross figures, and as such, do not take into account fees and other expenses, the deduction of which, when compounded over a period of years, would decrease returns. Returns for periods oflonger than one year are annualized. Investment characteristics are derived from indexes published by Hedge Fund Research, Inc. See the index definitions starting on page 39. Estimates offuture performance are based on assumptions that may not be realized.*For more information about the risks to Master Limited Partnerships (MLPs) see Risk Considerations beginning on page 42.**NM = Not meaningful; †Corresponds to capital market assumptions as published in the GIC’s Strategic Asset Allocation Capital Markets Update, March 8, 2013Source: Morgan Stanley Wealth Management as of Dec. 31, 2013
INVESTMENT CHARACTERISTICS
CLIENT PRIMARYGOALS
PRIMARY ROLE OFALTERNATIVE INVESTMENT
NEW ALTERNATIVEASSET CATEGORY
CLIENT PRI MARYBENCHMARK
ANNUALVO LATILITY
(%)
CORRELATIONWITH GLOBAL
EQUITIES
CORRELATIONWITH US INV.
GRADE BONDS
GIC STRATEGICRET URN
EXPECTATIONS†
CapitalPreservation
InflationProtection Real Assets Real Return; CPI Plus 10 – 20 0.4 0 – 0.60 0.10 – 0.20 4 +
Commodities ex Precious Metals 15 – 20 0.30 – 0.45 5 – 6
Precious Metals/Gold 15 – 20 0.10 – 0.20 7 – 8
Master Limited Partnerships* 10 – 15 0.60 – 0.70 7 – 8
Global REITs 10 – 15 0.60 – 0.70 4 – 5
Income
Real ReturnEnhancement/Preservation Total Return Assets
Libor Plus; 3-MonthUS T-Bill Plus 300 bps 3 – 7 0.30 – 0.50 0.00 – 0.10 2 – 4
Equity Market Neutral 3 – 5 < 0.20 0.00 – 0.10 2 – 4
Relative Value StrategiesIncluding Credit Long/Short 5 – 7 0.50 – 0.60 0.10 2 – 4
BalancedGrowth
VolatilityManagement Equity Hedge Assets
Total Return; 60%Stocks/40% Bonds 6 – 8 < 0.50 0.20 – 0.30 3 – 5
Global Macro 8 – 10 0.20 – 0.30 0.20 – 0.30 4 – 6
Managed Futures 10 – 15 ± 0.10 0.20 – 0.30 2 – 4
Hedge Fund of Funds; Multistrategy Alts. 5 – 7 0.40 – 0.60 2 – 3
MarketGrowth
EquityDiversification Equity Return Assets S&P 500 10 – 20 0.6 5 – 0.90 0.00 – 0.10 4 – 8
Equity Long/Short 10 – 15 0.70 – 0.90 0.00 – 0.10 4 – 6
Event Driven 10 – 15 0.80 – 0.95 0.00 – 0.10 4 – 6
OpportunisticGrowth
GrowthAmplification Opportunistic Assets Mandate Specific NM ** NM** NM** 8 +
Private Equity 10 – 20 0.85 – 1.00
Private Direct Real Estate 10 – 15 0.65 – 0.85
Early Stage Venture, Distressed Lending, Direct Lending, Impact Investing, Timberland, Water, Collectibles
Our New Outcomes-Oriented Framework for Alternatives

FOR INTERNAL USE ONLY – NOT FOR REDISTRIBUTION TO CLIE NTS
WEALTH MANAGEMENT
GLOBAL INVESTMENT COMMITTEE FALL 2014
23
AlternativeMutual Funds/ETFs
All
Annual 1099; ETFCost-Basis Accounting
Transparent
Goal Based;Suitability-Driven
Approach
BusinessConsideration
Target Client Segment
Asset Allocation Approach
Traditional PrivateOfferings
Institutions; UHNW;Accredited and Qualified
Strategic
Role in Portfolio Opportunistic Growth;Volatility Mitigation
Tax Considerations K-1; Opaque and Delayed
Fee Considerations Potential for Layering
Accessibility – andLiquidity-Driven
Approach
The Increased Availability of Alternatives Mutual Funds/ETFsTransforms Our Approach to Asset Allocation
Strategic and Tactical
Goal Achievement and Tactical Risk Management
Hybrid alternatives solutions may commingletraditional privateofferings andalternative mutualfunds/ETFs

FOR INTERNAL USE ONLY – NOT FOR REDISTRIBUTION TO CLIE NTS
WEALTH MANAGEMENT
GLOBAL INVESTMENT COMMITTEE FALL 2014
24
Keep in Mind Liquidity Has a Price. Is Liquidity Overvalued by Investors?
*Based on Cliffwater study of managers who manage both private and alternative mutual funds/ETFs,which examined 149 pairs in June 2013Source: Cliffwater LLC as of June 2013. Performance data shown represents 10 years ending March 2013.
Investors Pay a Performance Price for Liquidity

FOR INTERNAL USE ONLY – NOT FOR REDISTRIBUTION TO CLIE NTS
WEALTH MANAGEMENT
GLOBAL INVESTMENT COMMITTEE FALL 2014
25
.
Investors Pay a Performance Price for Liquidity
Talent Differences also can Impact performance realization

FOR INTERNAL USE ONLY – NOT FOR REDISTRIBUTION TO CLIE NTS
WEALTH MANAGEMENT
GLOBAL INVESTMENT COMMITTEE FALL 2014
Conclusions
26
1. Alternatives are not necessarily what you think they are
2. The GIC believes that now is the time to seriously consider Alternatives− Cyclical reasons (Rates, Volatility)
− Secular reasons – new solutions are available to all
3. The GIC’s has a new Alternatives Asset Allocation Framework− Alternatives are not a single asset class
− Success is about aligning solutions with goals
4. The GIC believes not including Alternatives Strategies is a risk
− Alternatives plus traditional investments improve performance and risk management