an outlook on asia’s agricultural and rural …
TRANSCRIPT
ASIA AND THE PACIFIC DIVISION
AN OUTLOOK ON ASIA’S AGRICULTURAL AND RURAL TRANSFORMATIONProspects and options for making it an inclusive and sustainable one
International Fund for Agricultura l Development
Via Paolo di Dono, 44 - 00142 Rome, Italy
Tel: +39 06 54591 - Fax: +39 06 5043463
Email: [email protected]
www.ifad.org
twitter.com/ifad
youtube.com/user/ifadTV
facebook. com/ifad
instagram. com/ifadnews
linkedin.com/company/ifad

ASIA AND THE PACIFIC DIVISION
AN OUTLOOK ON ASIA’S AGRICULTURAL AND RURAL TRANSFORMATIONProspects and options for making it an inclusive and sustainable one

© 2019 by the International Fund for Agricultural Development (IFAD)
The opinions expressed in this publication are those of the authors and do not necessarily represent those of the International Fund for Agricultural Development (IFAD). The designations employed and the presentation of material in this publication do not imply the expression of any opinion whatsoever on the part of IFAD concerning the legal status of any country, territory, city or area or of its authorities, or concerning the delimitation of its frontiers or boundaries. The designations ‘developed’ and ‘developing’ countries are intended for statistical convenience and do not necessarily express a judgement about the stage reached by a particular country or area in the development process.
All rights reserved
ISBN 978-92-9072-879-5Printed June 2019
Authors: Fabrizio Bresciani, Thomas Chalmers, Dilva Terzano, Raghav Gaiha, Ganesh Thapa, and Nidhi Kaicker
Contributors: Roehl Briones, Katsushi S. Imai, Monica Romano, Mary Taylor
Reviewers: Doris Capistrano, Roshan Cooke, Kim Khoi Dang, Costanza Di Nucci, Tawfiq El Zabri, Sisira Jayasuriya, Avinash Kishore, Sattar Mandal, Tim Martyn, Sakphouseth Meng, Meera Mishra, Tung Nguyen Thanh, Qaim Shah, Aissa Toure, Marie Van Der Donckt

5
EXECUTIVE SUMMARY 6
LIGHTS AND SHADOWS OF ASIA’S DEVELOPMENT: INCLUSIVE BUT UNSUSTAINABLE 11
Setting the stage: achievements and challenges in economic and human development across Asia 11
Natural resource degradation, climate change 26
Annex: a note on regional and income-based classifications 45
AGRICULTURE, STRUCTURAL TRANSFORMATION AND THE GROWING IMPORTANCE OF THE AGRIFOOD SECTOR 47
What do growth and structural transformation tell us about the rural economy? 47
The growing importance of the agrifood sector 53
The rural non-farm economy and the agrifood sector 75
ASIA’S AGRICULTURAL TRANSFORMATION: UNDERMINING OR FOSTERING SUSTAINABLE DEVELOPMENT? 79
Agriculture’s contribution to the Asia’s natural resource and ecosystem service degradation 79
From agriculture’s to agribusiness’s role in poverty and malnutrition reduction 89
What role for agriculture and smallholders in the realization of Agenda 2030? 93
PROSPECTS FOR SUSTAINING THE TRANSFORMATION OF ASIA’S AGRICULTURE AND RURAL ECONOMY 97
Prospects for the rural non-farm economy and employment opportunities 98
Prospects for public and private investment in rural areas 100
Vulnerability of Asia’s agriculture to climate change 106
Prospects of Asia’s institutional and policy context in agriculture 111
Conclusions 115
ASIA’S PATHWAYS TOWARDS AN INCLUSIVE AND SUSTAINABLE AGRICULTURE AND RURAL TRANSFORMATION 117
Shifts in development strategies shaping Asia’s agriculture and rural transformation paradigm 117
Asia’s differentiated stages in the transformation of agriculture and the rural economy 122
Strategic thrusts for an Asian smallholder-centred agricultural and rural transformation agenda 125
Conclusions 146
REFERENCES 147
CONTENTS
6
EXECUTIVE SUMMARY
If the success of Asian countries in transforming their rural economy is measured by the extent to
which poverty has declined over the past 20 years, there is no question that their transformation
can be regarded as one of the major achievements in human history. The decline in extreme poverty
and hunger has been outstanding and today Asia is making steady progress towards eradicating
both by 2030.
Contrasting with these bright lights, though, are shadows dimming Asia’s development
performance. Environmental quality has worsened and continues to do so at a rapid pace. The
degradation of natural resources has reached worrying levels in most parts of Asia. Vulnerability to
climate change is increasing as concentrations of CO2 in the atmosphere increase. Inequality is on
the rise, both within rural and urban areas and between them. The gains made in poverty reduction
could easily be reversed, as mobility above the poverty line is constrained for too many households
and exposure to economic shocks and unstable food markets persists. Malnutrition is overtaking
undernourishment in the social development agenda, as diets provide insufficient nutrients for
large swathes of the urban and rural population or lead to excessive food consumption patterns.
New problems are overtaking the older ones and Asia is now entering a critical part of its history.
Agenda 2030 and the Sustainable Development Goals are challenging propositions for today’s
policymakers in Asia.
Against this background, the question is: what can agricultural and rural policies hope to
reasonably achieve to tackle the challenges faced by Asian countries today? Many of the countries
in this region remain majority-rural, but their agricultural sector weighs much less in total GDP
than it did just 10 years ago. The gap in labour productivity between agriculture and the rest of
the economy is large and growing in most countries. Agriculture has undergone its own structural
transformation with increasing shares of high-value crops in response to changing diets and export
opportunities. Its capital intensity has increased at a rapid pace and so has the intensity with which
it uses agrochemicals and water resources. Rural households are unquestionably deriving less than
half of their income from farming and for the poorest households that percentage is even less; in
fact, non-farm employment has grown across all Asia, a welcome development, particularly in
South Asia, in the face of the reduced capacity of industry and services to offer jobs to the growing
numbers of young people.
These considerations, though, need to be balanced against the appreciation of agriculture’s
linkages with the rest of the economy. When due consideration is given to the numerous forward
and backward linkages shaping today’s agrifood systems in Asia, we see that agriculture is a core
component of a broader agrifood system on the performance of which the employment and income
of a large part of the rural poor depend. For that agrifood system to grow over the long term and
generate employment opportunities, though, agriculture’s competitiveness is a key precondition.
So is agriculture successfully delivering on this specific role?
7
Agriculture remains a significant driver of poverty reduction in Asia, but the way in which its
growth leads to less poverty is now changing rapidly. Reductions in poverty and malnutrition are
increasingly associated with agriculture’s commercialization and the development of industries in
the downstream rather than with the more traditional channel represented by farm income. In other
words, agribusiness growth matters more than agricultural growth per se in today’s Asia.
While we are reassured that agriculture, as part of a broader agribusiness sector, retains a central
role in rural development and poverty reduction, there needs to be a realization that its current
mode of operation is contributing in an important way to the degradation of natural resources and
the environment generally observed across the region. Unless a shift from the traditional Green
Revolution paradigm to a more sustainable one is undertaken, there is a risk that, compounded
by climate change, the degradation of the natural resource base will undermine the sector’s
prospects. Herein lies a major challenge for agriculture’s role in delivering on Agenda 2030 given
the competitiveness-poverty-sustainability nexus. Furthermore, we see that this nexus is all the more
challenging given the prominence of smallholder agriculture in Asia. Provided that smallholder
agriculture is encouraged through the right mix of policies and investments, its contribution to the
realization of Agenda 2030 will be undeniable.
This report finds ground for a temperate optimism regarding the future role of smallholder
agriculture in helping Asian countries delivering on Agenda 2030. Growth rates of the region’s
major economies remain buoyant. Notwithstanding the risks associated with a new global crisis or
originating from the instability of financial markets, economic growth is expected to remain strong
in the decade to come. This will have positive influences on the rural economy, including the rural
non-farm sector, ensuring that it benefits from public investments in rural-urban connectivity made
possible by healthier public finances. Asian rural financial markets are now better integrated with
domestic financial markets, and through them with international financial markets, compared
with only 10 years ago. Public policies have shifted from taxing to supporting agriculture so that
incentives for agricultural producers are now relatively more favourable than those faced by other
sectors of the economy.
However, the report finds reason to moderate its optimism when it comes to climate change,
perhaps today’s most significant challenge for policymakers regarding the agricultural and rural
transformation. Furthermore, Asian policymakers will increasingly be brought to face the difficulty of
protecting smallholder agriculture while sustaining agriculture’s competitiveness. Land consolidation
will emerge as a policy leitmotif in several Asian economies where surplus rural labour has been
exhausted, rural wages are accelerating in the wake of the strong performance of industry and
services, and the rural population is starting to decline in absolute terms (i.e. China and large parts
of South-East Asia). Managing policies that simultaneously aim at supporting farm income and
keeping the cost of agricultural commodities for agro-industries and consumers in check will be
fiscally onerous. While land consolidation in Asia’s upper-middle-income countries will advance
mainly in lowland areas cultivated with grains, this will be less the case in upland areas and in areas
specializing in horticultural products. Upland areas may in fact lose population and witness growing
tracts of idle lands given the limits to expanding farm size in these areas. Faced with pressures for
land consolidation, policymakers could opt to have this driven either by the more competitive and
entrepreneurial smallholders or by fully liberalizing land rental and sales markets and favouring
large investors through attractive fiscal incentives. The choice will matter for the future of rural
communities and the dynamics of rural-urban inequality, as in the latter case it is unlikely that the
profits generated by the modernization of agriculture will be reinvested in the local economy.
8
How should policymakers envision Asia’s pathways towards an inclusive and sustainable agricultural and rural transformation?
First, an immediate consideration is that important shifts are taking place in national development
policy in several Asian countries, in themselves self-standing agendas: the greening of growth, the
scaling up of social protection programmes, the deepening of regional cooperation and trade
(e.g. the Association of Southeast Asian Nations Economic Community), and the scaling up of
nutrition. These increasingly influential development agendas will require a reconceptualization
of agricultural and rural policies, given the multifarious roles that smallholder agriculture plays
in each one of them. As the share of agriculture in GDP and that of farming in rural household
income decline, the focus of agricultural and rural development policies will increasingly need to
reflect the weight that society assigns to the quality of diets and of the environment, food safety,
and equity. As the structural transformation deepens, the design of agricultural and rural policies
will therefore become more complex rather than being simplified.
Second, agricultural and rural policies will need to be fine-tuned to the broader stage of
development achieved by a given country: the challenges and options will differ between those
that are in the middle of their modernization efforts and those that are in the process of sustaining
the gains from their earlier modernization efforts and are pressing ahead with the transformation
agenda. Countries that are in the process of intensifying and modernizing their agriculture, the
emphasis of agricultural and rural development strategies will be on fostering rural non-farm
employment, strengthening the linkages to the agro-industrial sector, stabilizing food prices
while increasing farm income, and increasing the efficiency in the use of natural resources in
the production process. Countries that sustaining and deepening the transformation of their
agriculture the emphasis will be on improving environmental quality, integrating lagging areas
into the national economy, upgrading their agrifood value chains through a greater focus on food
safety and environmental standards, and recognizing rural heritage as a key pillar of their national
cultural identities.
Third, specific investments and public interventions in the agricultural and rural economy will
need to be modulated to the specific types of rural landscapes being targeted within each country.
Such landscapes vary from those where agriculture is at an advanced stage of commercialization,
to those where such commercialization is incipient in spite of the favourable agroecological
conditions, to those characterized by abundant natural resources but limited production potential,
particularly upland areas. While the role of the private sector will have a comparative advantage
in leading the modernization of the commercially integrated productive areas, the existence of
transaction costs rooted in underdeveloped market institutions and limited transportation and
communication facilities imply a greater role of national governments and development partners.
Resource-abundant but structurally food-deficit rural landscapes offer significant opportunities for
local communities to realize the social value of natural resources through dedicated programmes
and investments, including through agro-tourism and stewardship of ecologically fragile and
cultural-rich territories. Although there is little role for agricultural and rural policies to lift people
out of poverty in resource-scarce, food deficit areas, they do play a precious role of establishing
viable local food systems on the basis of which policies aimed at an accelerated diversification out
of agriculture and outright migration can be undertaken.
9
Fourth, for inclusive agricultural and rural policies and interventions to be effective in
transforming agriculture and the rural economy they will need to be articulated into thrusts aimed
at three key interrelated objectives: (i) making commercialization work for smallholders and
rural producers, emphasizing the rural investment climate and market access infrastructure, and
strengthening rural producer organizations; (ii) enhancing the competitiveness of smallholders
and rural producers by fostering access to land (including degraded forest land), irrigation water,
technologies and financial services; and (iii) strengthening environmental sustainability and
climate resilience of smallholders and rural producers. Each thrust will require an articulation in
the form of national institutional and policy reforms complemented by investments tailored to
the three types of rural landscapes. While the agenda for national institutional and policy reforms
will respond to the stage of agricultural and rural transformation each country has achieved, the
success of local investment agendas will depend importantly on the capacity of local governments
and their ability to include local communities in large-scale agricultural and rural development
projects and to respond to their development needs. Over the last three decades several countries in
Asia have pursued a decentralization of administrative and programming responsibilities to local
governments. While this has on one side created an opportunity to better respond to the needs of
local communities, on the other protracted weakness of local governments has in many contexts
affected the implementation of agricultural and rural development projects. As commercialization
of agriculture deepens and the role of the private sector in promoting investments and influencing
marketing arrangements increases, enhancing the capacity of local governments to effectively
mediate the interest of poor rural communities in their jurisdictions and to promote their welfare
will be an important area for development assistance.
10
11
Setting the stage: achievements and challenges in economic and human development across Asia
Developing Asia has made great progress in reducing extreme poverty and moderate progress in reducing hungerAsian economies continue to drive global growth. In 2016, global GDP grew by 2.4 per cent,
while that of the Asia and Pacific region as a whole grew by 4.4 per cent. Among developing
Asian economies, this difference becomes even larger: East Asia, South Asia and South-East Asia
have grown by an average of 6.7, 0.8 and 4.9 per cent, respectively, during the past year. While
growth may moderate slightly in the years ahead, there is ample evidence that Asia’s growth rate
will remain far above the global average.1 As a result, Asian economies now comprise a significant
and ever-growing share of global GDP. In 2014, China became the world’s biggest economy in
purchasing power parity (PPP) terms, overtaking the United States for the first time in history.
LIGHTS AND SHADOWS OF ASIA’S DEVELOPMENT: INCLUSIVE BUT UNSUSTAINABLE
KEY MESSAGES
Developing economies across Asia are undergoing an important set of structural and demographic
changes: fast growth rates have coincided with urbanization, population ageing and accelerated structural
transformation out of agriculture. Reductions in poverty and hunger represent impressive achievements and
can be ascribed to the region’s growth.
The new Sustainable Development Goal (SDG) framework calls for an equitable and sustainable eradication
of extreme poverty and hunger in all their forms. As the number of Asia’s poor and hungry becomes smaller
and smaller, several new challenges stand in the way of achieving this. One is a growing set of inequalities in
income and capabilities in most middle-income Asian countries. Another is the persistence of malnutrition
and unequal health outcomes, even in places that have successfully eradicated hunger.
These challenges must be addressed in a rapidly changing socio-economic context. Poverty in Asia is
different from even 10 years ago. It continues to exist as a rural phenomenon that is concentrated more
and more in middle-income countries. The persistence of poverty in these countries points to a set of
disparities in income and capabilities among rural and marginalized groups including women, indigenous
peoples and ethnic minorities.
Asia has reached a critical point in its environmental history. As it is the world’s largest contributor to
greenhouse gas emissions from the agricultural sector, and home to some of the world’s largest tracts of
degraded land, environmental concerns for agriculture and rural people will become drastically larger
over the next several decades.
1. Here, we use the term “developing” to refer to all Asian economies that are classified as upper-middle-income or below by the latest revisions of the World Bank. Refer to the end of the chapter for more details. Weighted regional averages omit Iran, the Democratic People’s Republic of Korea and Myanmar. Calculations from World Bank (2017).
12
Fast rates of growth signal that an important set of changes are occurring across all levels
of economic life in Asia. Across almost every developing country in the region, rates of income
growth and urbanization have accelerated in tandem. Populations continue to shift out of rural
areas and out of agricultural work. Slowing population growth rates have led to a boom in the
proportion of Asia’s population that is of working age, raising the prospects for a continent-wide
demographic dividend. The structure of economic output across these countries has moved at an
even faster pace away from the agricultural sector towards services and, to a lesser degree, industry.
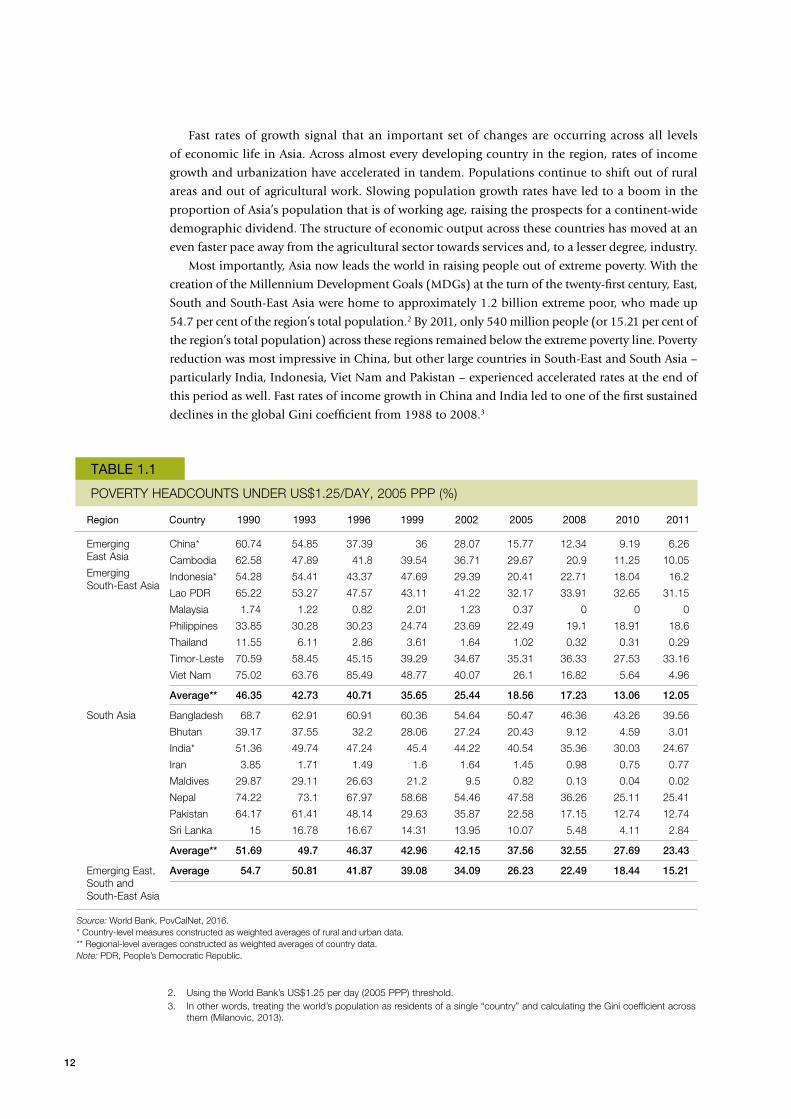
Most importantly, Asia now leads the world in raising people out of extreme poverty. With the
creation of the Millennium Development Goals (MDGs) at the turn of the twenty-first century, East,
South and South-East Asia were home to approximately 1.2 billion extreme poor, who made up
54.7 per cent of the region’s total population.2 By 2011, only 540 million people (or 15.21 per cent of
the region’s total population) across these regions remained below the extreme poverty line. Poverty
reduction was most impressive in China, but other large countries in South-East and South Asia –
particularly India, Indonesia, Viet Nam and Pakistan – experienced accelerated rates at the end of
this period as well. Fast rates of income growth in China and India led to one of the first sustained
declines in the global Gini coefficient from 1988 to 2008.3
TABLE 1.1
POVERTY HEADCOUNTS UNDER US$1.25/DAY, 2005 PPP (%)
Emerging East Asia
Emerging South-East Asia
South Asia
Emerging East, South and South-East Asia
China*
Cambodia
Indonesia*
Lao PDR
Malaysia
Philippines
Thailand
Timor-Leste
Viet Nam
Average**
Bangladesh
Bhutan
India*
Iran
Maldives
Nepal
Pakistan
Sri Lanka
Average**
Average
Region Country 1990 1993 1996 1999 2002 2005 2008 2010 2011
60.74 54.85 37.39 36 28.07 15.77 12.34 9.19 6.26
62.58 47.89 41.8 39.54 36.71 29.67 20.9 11.25 10.05
54.28 54.41 43.37 47.69 29.39 20.41 22.71 18.04 16.2
65.22 53.27 47.57 43.11 41.22 32.17 33.91 32.65 31.15
1.74 1.22 0.82 2.01 1.23 0.37 0 0 0
33.85 30.28 30.23 24.74 23.69 22.49 19.1 18.91 18.6
11.55 6.11 2.86 3.61 1.64 1.02 0.32 0.31 0.29
70.59 58.45 45.15 39.29 34.67 35.31 36.33 27.53 33.16
75.02 63.76 85.49 48.77 40.07 26.1 16.82 5.64 4.96
46.35 42.73 40.71 35.65 25.44 18.56 17.23 13.06 12.05
68.7 62.91 60.91 60.36 54.64 50.47 46.36 43.26 39.56
39.17 37.55 32.2 28.06 27.24 20.43 9.12 4.59 3.01
51.36 49.74 47.24 45.4 44.22 40.54 35.36 30.03 24.67
3.85 1.71 1.49 1.6 1.64 1.45 0.98 0.75 0.77
29.87 29.11 26.63 21.2 9.5 0.82 0.13 0.04 0.02
74.22 73.1 67.97 58.68 54.46 47.58 36.26 25.11 25.41
64.17 61.41 48.14 29.63 35.87 22.58 17.15 12.74 12.74
15 16.78 16.67 14.31 13.95 10.07 5.48 4.11 2.84
51.69 49.7 46.37 42.96 42.15 37.56 32.55 27.69 23.43
54.7 50.81 41.87 39.08 34.09 26.23 22.49 18.44 15.21
2. Using the World Bank’s US$1.25 per day (2005 PPP) threshold.3. In other words, treating the world’s population as residents of a single “country” and calculating the Gini coefficient across
them (Milanovic, 2013).
Source: World Bank, PovCalNet, 2016.* Country-level measures constructed as weighted averages of rural and urban data.** Regional-level averages constructed as weighted averages of country data. Note: PDR, People’s Democratic Republic.
13
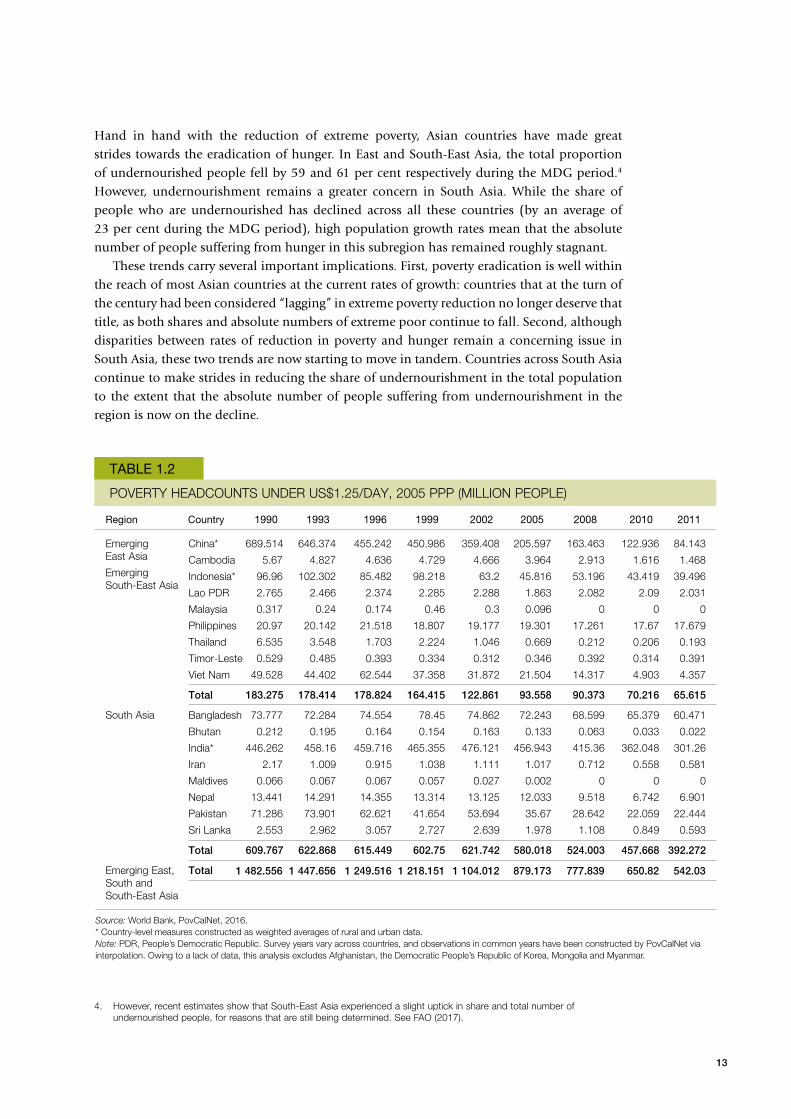
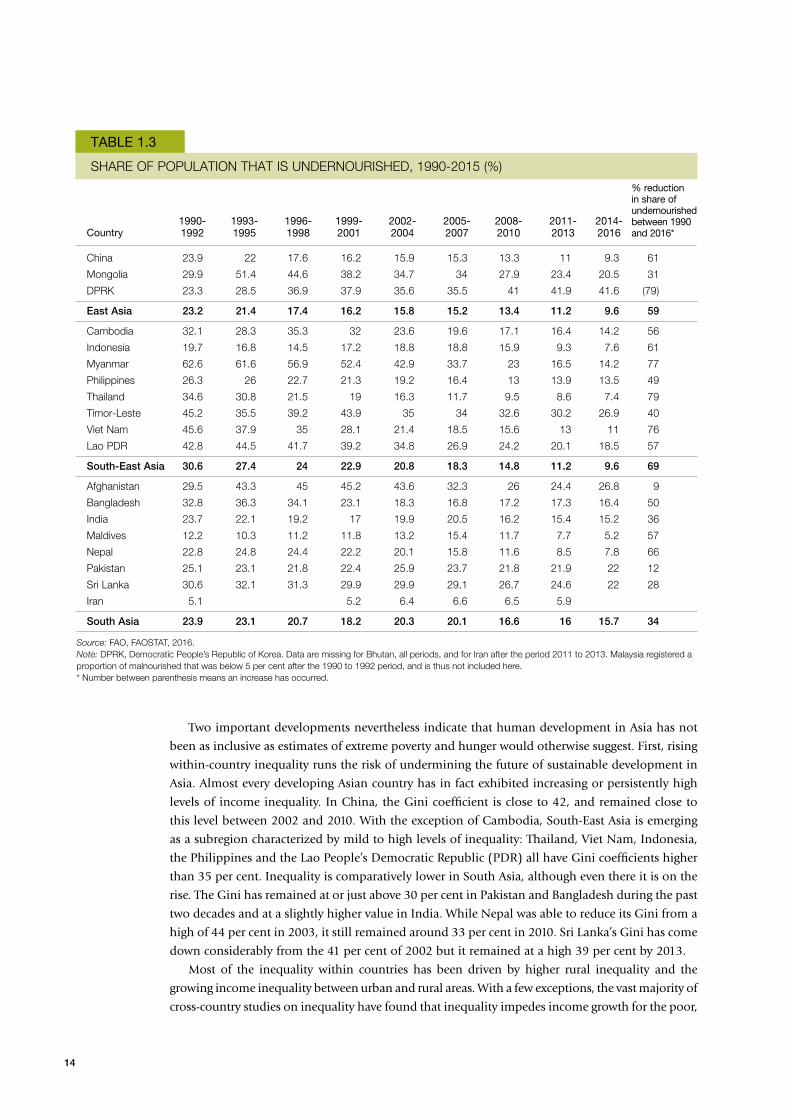
Hand in hand with the reduction of extreme poverty, Asian countries have made great strides towards the eradication of hunger. In East and South-East Asia, the total proportion of undernourished people fell by 59 and 61 per cent respectively during the MDG period.4
However, undernourishment remains a greater concern in South Asia. While the share of people who are undernourished has declined across all these countries (by an average of 23 per cent during the MDG period), high population growth rates mean that the absolute number of people suffering from hunger in this subregion has remained roughly stagnant.
These trends carry several important implications. First, poverty eradication is well within the reach of most Asian countries at the current rates of growth: countries that at the turn of the century had been considered “lagging” in extreme poverty reduction no longer deserve that title, as both shares and absolute numbers of extreme poor continue to fall. Second, although disparities between rates of reduction in poverty and hunger remain a concerning issue in South Asia, these two trends are now starting to move in tandem. Countries across South Asia continue to make strides in reducing the share of undernourishment in the total population to the extent that the absolute number of people suffering from undernourishment in the region is now on the decline.
4. However, recent estimates show that South-East Asia experienced a slight uptick in share and total number of undernourished people, for reasons that are still being determined. See FAO (2017).
TABLE 1.2
POVERTY HEADCOUNTS UNDER US$1.25/DAY, 2005 PPP (MILLION PEOPLE)
Emerging East Asia
Emerging South-East Asia
South Asia
Emerging East, South and South-East Asia
China*
Cambodia
Indonesia*
Lao PDR
Malaysia
Philippines
Thailand
Timor-Leste
Viet Nam
Total
Bangladesh
Bhutan
India*
Iran
Maldives
Nepal
Pakistan
Sri Lanka
Total
Total
Region Country 1990 1993 1996 1999 2002 2005 2008 2010 2011
689.514 646.374 455.242 450.986 359.408 205.597 163.463 122.936 84.143
5.67 4.827 4.636 4.729 4.666 3.964 2.913 1.616 1.468
96.96 102.302 85.482 98.218 63.2 45.816 53.196 43.419 39.496
2.765 2.466 2.374 2.285 2.288 1.863 2.082 2.09 2.031
0.317 0.24 0.174 0.46 0.3 0.096 0 0 0
20.97 20.142 21.518 18.807 19.177 19.301 17.261 17.67 17.679
6.535 3.548 1.703 2.224 1.046 0.669 0.212 0.206 0.193
0.529 0.485 0.393 0.334 0.312 0.346 0.392 0.314 0.391
49.528 44.402 62.544 37.358 31.872 21.504 14.317 4.903 4.357
183.275 178.414 178.824 164.415 122.861 93.558 90.373 70.216 65.615
73.777 72.284 74.554 78.45 74.862 72.243 68.599 65.379 60.471
0.212 0.195 0.164 0.154 0.163 0.133 0.063 0.033 0.022
446.262 458.16 459.716 465.355 476.121 456.943 415.36 362.048 301.26
2.17 1.009 0.915 1.038 1.111 1.017 0.712 0.558 0.581
0.066 0.067 0.067 0.057 0.027 0.002 0 0 0
13.441 14.291 14.355 13.314 13.125 12.033 9.518 6.742 6.901
71.286 73.901 62.621 41.654 53.694 35.67 28.642 22.059 22.444
2.553 2.962 3.057 2.727 2.639 1.978 1.108 0.849 0.593
609.767 622.868 615.449 602.75 621.742 580.018 524.003 457.668 392.272
Source: World Bank, PovCalNet, 2016.* Country-level measures constructed as weighted averages of rural and urban data.Note: PDR, People’s Democratic Republic. Survey years vary across countries, and observations in common years have been constructed by PovCalNet via interpolation. Owing to a lack of data, this analysis excludes Afghanistan, the Democratic People’s Republic of Korea, Mongolia and Myanmar.
1 482.556 1 447.656 1 249.516 1 218.151 1 104.012 879.173 777.839 650.82 542.03
14
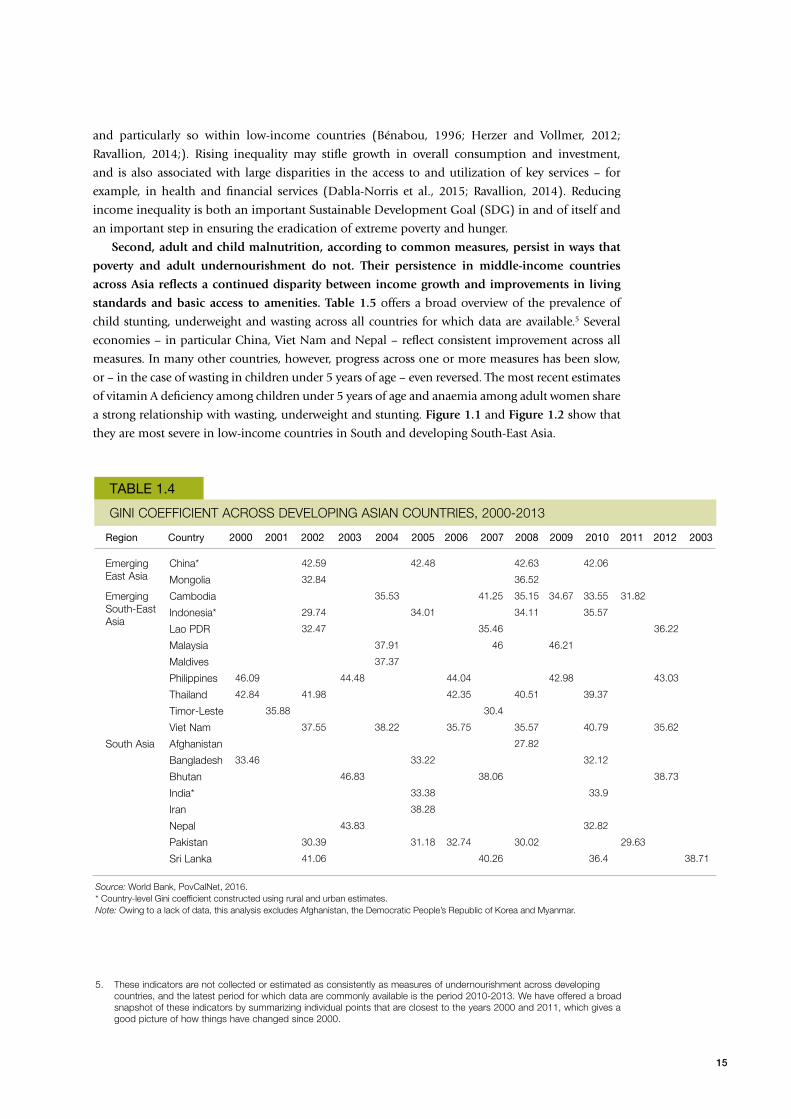
Two important developments nevertheless indicate that human development in Asia has not
been as inclusive as estimates of extreme poverty and hunger would otherwise suggest. First, rising
within-country inequality runs the risk of undermining the future of sustainable development in
Asia. Almost every developing Asian country has in fact exhibited increasing or persistently high
levels of income inequality. In China, the Gini coefficient is close to 42, and remained close to
this level between 2002 and 2010. With the exception of Cambodia, South-East Asia is emerging
as a subregion characterized by mild to high levels of inequality: Thailand, Viet Nam, Indonesia,
the Philippines and the Lao People’s Democratic Republic (PDR) all have Gini coefficients higher
than 35 per cent. Inequality is comparatively lower in South Asia, although even there it is on the
rise. The Gini has remained at or just above 30 per cent in Pakistan and Bangladesh during the past
two decades and at a slightly higher value in India. While Nepal was able to reduce its Gini from a
high of 44 per cent in 2003, it still remained around 33 per cent in 2010. Sri Lanka’s Gini has come
down considerably from the 41 per cent of 2002 but it remained at a high 39 per cent by 2013.
Most of the inequality within countries has been driven by higher rural inequality and the
growing income inequality between urban and rural areas. With a few exceptions, the vast majority of
cross-country studies on inequality have found that inequality impedes income growth for the poor,
TABLE 1.3
SHARE OF POPULATION THAT IS UNDERNOURISHED, 1990-2015 (%)
China
Mongolia
DPRK
East Asia
Cambodia
Indonesia
Myanmar
Philippines
Thailand
Timor-Leste
Viet Nam
Lao PDR
South-East Asia
Afghanistan
Bangladesh
India
Maldives
Nepal
Pakistan
Sri Lanka
Iran
South Asia
Country 1990-1992
1993-1995
1996-1998
1999-2001
2002-2004
2005-2007
2008-2010
2011-2013
2014-2016
% reduction in share of undernourished between 1990 and 2016*
23.9 22 17.6 16.2 15.9 15.3 13.3 11 9.3 61
29.9 51.4 44.6 38.2 34.7 34 27.9 23.4 20.5 31
23.3 28.5 36.9 37.9 35.6 35.5 41 41.9 41.6 (79)
23.2 21.4 17.4 16.2 15.8 15.2 13.4 11.2 9.6 59
32.1 28.3 35.3 32 23.6 19.6 17.1 16.4 14.2 56
19.7 16.8 14.5 17.2 18.8 18.8 15.9 9.3 7.6 61
62.6 61.6 56.9 52.4 42.9 33.7 23 16.5 14.2 77
26.3 26 22.7 21.3 19.2 16.4 13 13.9 13.5 49
34.6 30.8 21.5 19 16.3 11.7 9.5 8.6 7.4 79
45.2 35.5 39.2 43.9 35 34 32.6 30.2 26.9 40
45.6 37.9 35 28.1 21.4 18.5 15.6 13 11 76
42.8 44.5 41.7 39.2 34.8 26.9 24.2 20.1 18.5 57
30.6 27.4 24 22.9 20.8 18.3 14.8 11.2 9.6 69
29.5 43.3 45 45.2 43.6 32.3 26 24.4 26.8 9
32.8 36.3 34.1 23.1 18.3 16.8 17.2 17.3 16.4 50
23.7 22.1 19.2 17 19.9 20.5 16.2 15.4 15.2 36
12.2 10.3 11.2 11.8 13.2 15.4 11.7 7.7 5.2 57
22.8 24.8 24.4 22.2 20.1 15.8 11.6 8.5 7.8 66
25.1 23.1 21.8 22.4 25.9 23.7 21.8 21.9 22 12
30.6 32.1 31.3 29.9 29.9 29.1 26.7 24.6 22 28
5.1 5.2 6.4 6.6 6.5 5.9
23.9 23.1 20.7 18.2 20.3 20.1 16.6 16 15.7 34
Source: FAO, FAOSTAT, 2016.Note: DPRK, Democratic People’s Republic of Korea. Data are missing for Bhutan, all periods, and for Iran after the period 2011 to 2013. Malaysia registered a proportion of malnourished that was below 5 per cent after the 1990 to 1992 period, and is thus not included here.* Number between parenthesis means an increase has occurred.
15
and particularly so within low-income countries (Bénabou, 1996; Herzer and Vollmer, 2012;
Ravallion, 2014;). Rising inequality may stifle growth in overall consumption and investment,
and is also associated with large disparities in the access to and utilization of key services – for
example, in health and financial services (Dabla-Norris et al., 2015; Ravallion, 2014). Reducing
income inequality is both an important Sustainable Development Goal (SDG) in and of itself and
an important step in ensuring the eradication of extreme poverty and hunger.
Second, adult and child malnutrition, according to common measures, persist in ways that
poverty and adult undernourishment do not. Their persistence in middle-income countries
across Asia reflects a continued disparity between income growth and improvements in living
standards and basic access to amenities. Table 1.5 offers a broad overview of the prevalence of
child stunting, underweight and wasting across all countries for which data are available.5 Several
economies – in particular China, Viet Nam and Nepal – reflect consistent improvement across all
measures. In many other countries, however, progress across one or more measures has been slow,
or – in the case of wasting in children under 5 years of age – even reversed. The most recent estimates
of vitamin A deficiency among children under 5 years of age and anaemia among adult women share
a strong relationship with wasting, underweight and stunting. Figure 1.1 and Figure 1.2 show that
they are most severe in low-income countries in South and developing South-East Asia.
TABLE 1.4
GINI COEFFICIENT ACROSS DEVELOPING ASIAN COUNTRIES, 2000-2013
Emerging East Asia
Emerging South-East Asia
South Asia
China*
Mongolia
Cambodia
Indonesia*
Lao PDR
Malaysia
Maldives
Philippines
Thailand
Timor-Leste
Viet Nam
Afghanistan
Bangladesh
Bhutan
India*
Iran
Nepal
Pakistan
Sri Lanka
Region Country 2000 2001 2002 2003 2004 2005 2006 2007 2008 2009 2010 2011 2012 2003
42.59 42.48 42.63 42.06
32.84 36.52
35.53 41.25 35.15 34.67 33.55 31.82
29.74 34.01 34.11 35.57
32.47 35.46 36.22
37.91 46 46.21
37.37
46.09 44.48 44.04 42.98 43.03
42.84 41.98 42.35 40.51 39.37
35.88 30.4
37.55 38.22 35.75 35.57 40.79 35.62
27.82
33.46 33.22 32.12
46.83 38.06 38.73
33.38 33.9
38.28
43.83 32.82
30.39 31.18 32.74 30.02 29.63
41.06 40.26 36.4 38.71
Source: World Bank, PovCalNet, 2016.* Country-level Gini coefficient constructed using rural and urban estimates.Note: Owing to a lack of data, this analysis excludes Afghanistan, the Democratic People’s Republic of Korea and Myanmar.
5. These indicators are not collected or estimated as consistently as measures of undernourishment across developing countries, and the latest period for which data are commonly available is the period 2010-2013. We have offered a broad snapshot of these indicators by summarizing individual points that are closest to the years 2000 and 2011, which gives a good picture of how things have changed since 2000.

16
The World Health Organization (WHO) has paid particularly close attention to issues in
malnutrition, and has set a global target of reducing the prevalence of stunting in children under
5 years of age by 40 per cent by 2025. As is the case with hunger in the Sustainable Development
Agenda, only a minority of countries in Asia have experienced recent average annual rates of
reduction (AARRs) in the decline of stunting in children under 5 years of age that would satisfy
that target. Table 1.6 shows that in some countries – particularly Indonesia, the Philippines, India
and Sri Lanka – the most recently measured AARR is less than half of what would be required
by WHO. Pakistan and Thailand have, in fact, experienced recent increases in rates of stunting in
children under 5 years of age.
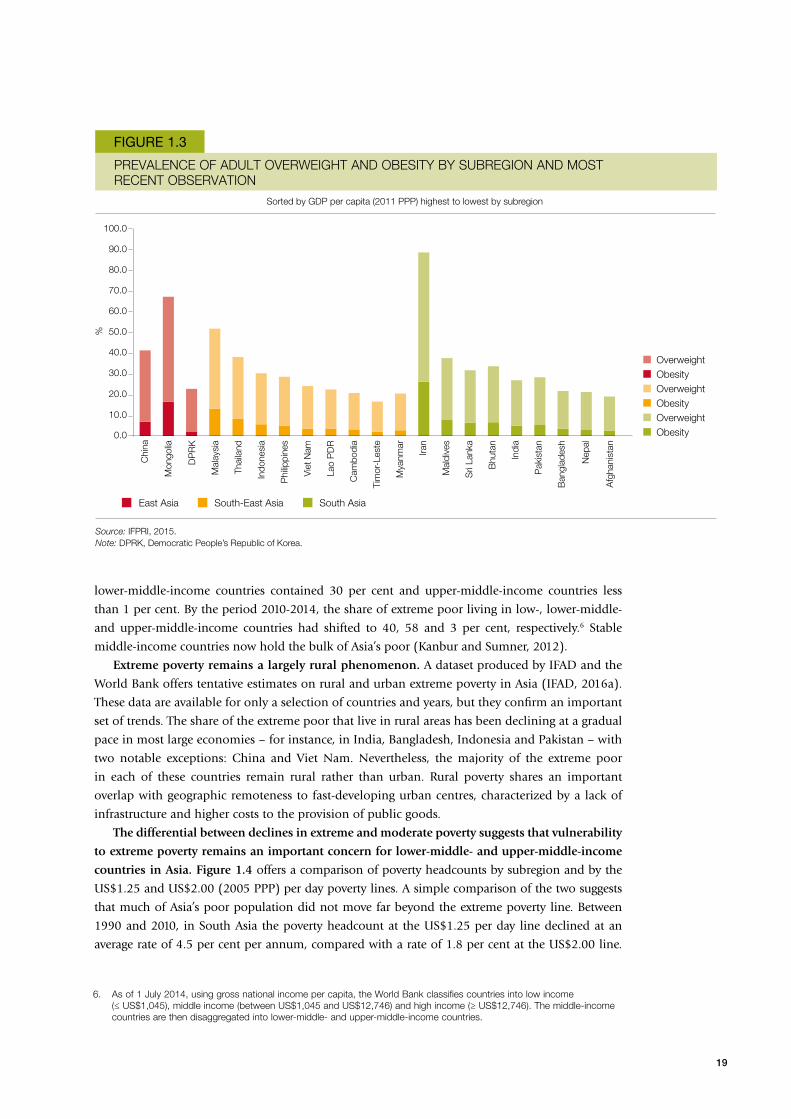
These trends provide yet another caveat to the story of growth and poverty reduction in Asia:
that of the double burden of malnutrition and obesity. Problems in malnutrition and obesity
exist not only within countries and communities but also within households and individuals,
who may have excess adiposity along with micronutrient deficiencies. As shown in Figure 1.3,
more than 25 per cent of people in many of Asia’s developing economies are now overweight or
obese, and that share has been growing consistently across each Asian subregion. The proliferation
of processed foods – especially those high in fat and carbohydrates – poses a large problem for
middle-income Asian countries that are still grappling with the persistence of micronutrient
deficiencies among large shares of their populations (FAO, 2016).
TABLE 1.5
PREVALENCE OF STUNTING, UNDERWEIGHT AND WASTING IN CHILDREN BELOW 5 YEARS OF AGE, CLOSEST OBSERVATIONS TO 2000 AND 2011 (%)
Developing East Asia
Developing South-East Asia
South Asia
China
DPRK
Mongolia
Cambodia
Indonesia
Lao PDR
Malaysia
Myanmar
Philippines
Thailand
Timor-Leste
Viet Nam
Afghanistan
Bangladesh
Bhutan
India
Iran
Maldives
Nepal
Pakistan
Sri Lanka
Region Country
Stunting Underweight Wasting
17.8 9.4 7.4 3.4 2.5 2.3
51 27.9 24.7 18.8 12.2 5.2
29.8 15.6 11.6 4.7 7.1 1.8
49.2 40.9 39.5 29 16.9 10.8
42.4 39.2 24.8 18.6 5.5 12.3
48.2 43.8 36.4 26.5 17.5 6.4
20.7 No obs. 16.7 No obs. 15.3 No obs.
40.8 35.1 30.1 22.6 10.7 7.9
38.3 33.6 20.7 20.2 8 7.3
No obs. 16.3 No obs. 9.2 No obs. 6.7
55.7 57.7 40.6 45.3 No obs. 18.9
43.4 23.3 26.7 12 6.1 4.4
53.2 No obs. 44.9 No obs. 18.2 No obs.
50.8 41.4 42.3 36.8 12.5 15.7
47.7 33.6 14.1 12.8 2.5 5.9
51 39* 44.4 No obs. 19.8 No obs.
20.4 No obs. 9.5 No obs. 6.1 No obs.
31.9 20.3 25.7 17.8 13.4 10.2
57.1 40.5 43 29.1 11.3 11.2
41.5 43 31.3 30.9 14.2 14.8
18.4 14.7 22.8 26.3 15.5 21.4
Source: FAO, FAOSTAT, 2016.* Supplemented from the International Food Policy Research Institute Global Nutrition Report (IFPRI, 2015).Note: DPRK, Democratic People’s Republic of Korea; obs., observation.
Closest to 2000
Closest to 2000
Closest to 2000
Closest to 2011
Closest to 2011
Closest to 2011

17
East Asia
East Asia
South-East Asia
South-East Asia
South Asia
South Asia
Source: IFPRI, 2015.
Source: IFPRI, 2015.Note: DPRK, Democratic People’s Republic of Korea.
Stunting Underweight Wasting Sorted by GDP per capita (2011 PPP) highest to lowest by subregion
VITAMIN A DEFICIENCIES IN PRESCHOOL-AGED CHILDREN BY SUBREGION AND MOST RECENT OBSERVATION
ANAEMIA AMONG ADULT WOMEN BY SUBREGION AND MOST RECENT OBSERVATION
FIGURE 1.1
FIGURE 1.2
%
Chi
na
Mon
golia
Afg
hani
stan
Mal
aysi
a
Thai
land
Indo
nesi
a
Phi
lippi
nes
Viet
Nam
Lao
PD
R
Cam
bodi
a
Tim
or-L
este
Mya
nmar
Iran
Mal
dive
s
Sri
Lank
a
Bhu
tan
Indi
a
Pak
ista
n
Ban
glad
esh
Nep
al
10.0
15.0
20.0
25.0
30.0
35.0
40.0
45.0
50.0
5.0
0.0
%
Chi
na
Mon
golia
Nep
al
Afg
hani
stan
DP
RK
Mal
aysi
a
Thai
land
Indo
nesi
a
Phi
lippi
nes
Viet
Nam
Lao
PD
R
Cam
bodi
a
Tim
or-L
este
Mya
nmar
Iran
Mal
dive
s
Sri
Lank
a
Bhu
tan
Indi
a
Pak
ista
n
Ban
glad
esh
10.0
20.0
30.0
40.0
50.0
0.0
60.0
Sorted by GDP per capita (2011 PPP) highest to lowest by subregion

18
TABLE 1.6
PROGRESS IN STUNTING IN CHILDREN UNDER 5 YEARS OF AGE IN RELATION TO THE WHO 2025 TARGET (A 40 PER CENT REDUCTION IN PREVALENCE)
Developing East Asia
Developing South-East Asia
South Asia
China
DPRK
Mongolia
Cambodia
Indonesia
Lao PDR
Malaysia
Myanmar
Philippines
Thailand
Timor-Leste
Viet Nam
Bangladesh
Bhutan
India
Iran
Maldives
Nepal
Pakistan
Sri Lanka
Region Country
Stunting
8.1 2.7 On
4.8 4.1 On
5.3 3.2 On
2.1 4.0 Off
0.5 3.0 Off
0.8 3.8 Off
2.6 4.6 Off
1.8 3.1 Off
0.8 4.6 Off
(0.6) 2.4 Off
(0.3) 5.4 Off
4.3 2.4 On
2.7 3.3 Off
3.2 3.3 Off
1.7 3.7 Off
0.6 3.0 Off
5.5 3.3 On
3.4 3.2 On
(0.6) 3.9 Off
1.3 2.8 Off
Source: IFPRI, 2015.Note: DPRK, Democratic People’s Republic of Korea.
Current AARR (%)
Required AARR (%)
On/off course
Childhood stunting and wasting are complex issues, and their causes – poor diet, poor sanitation
and a lack of access to health services – are themselves indicative of long-term states of poverty. The
fact that rates of malnutrition remain far above rates of poverty and undernourishment suggests
that more attention must be paid to non-income measures of well-being and to inequalities in
access to basic services in sanitation and health (Coffey and Spears, 2017).
Poverty and inequality in Asia todayBroad-based growth and impressive rates of poverty reduction do not equate to the complete
eradication of poverty in Asia. As poverty and malnutrition become less prevalent, they may also
become more localized within specific geographic areas, socio-economic groups or professions.
In this regard, four key trends jointly present a compelling picture of what it now means to be
poor in this region: (i) extreme poverty persists in many countries that have otherwise grown to
middle-income status; (ii) extreme poverty remains primarily a rural phenomenon; (iii) extreme
poverty is particularly acute among indigenous peoples (IPs); and (iv) in many countries, women
face significant inequalities in access to education, health services, finance and land, which in turn
exacerbate conditions of deprivation.
The majority of Asia’s extreme and moderate poor now reside in middle-income countries. As
per capita incomes rise, the density of Asia’s extreme poor moves from low-income towards lower-
middle and upper-middle-income countries – particularly with the reclassifications of China and
India. Between 2000 and 2004, low-income countries contained 69 per cent of Asia’s extreme poor,
19
Sorted by GDP per capita (2011 PPP) highest to lowest by subregion
PREVALENCE OF ADULT OVERWEIGHT AND OBESITY BY SUBREGION AND MOST RECENT OBSERVATION
FIGURE 1.3
%
Chi
na
Mon
golia
Nep
al
Afg
hani
stan
DP
RK
Mal
aysi
a
Thai
land
Indo
nesi
a
Phi
lippi
nes
Viet
Nam
Lao
PD
R
Cam
bodi
a
Tim
or-L
este
Mya
nmar
Iran
Mal
dive
s
Sri
Lank
a
Bhu
tan
Indi
a
Pak
ista
n
Ban
glad
esh
South AsiaSouth-East AsiaEast Asia
Source: IFPRI, 2015.Note: DPRK, Democratic People’s Republic of Korea.
20.0
30.0
40.0
50.0
60.0
70.0
80.0
90.0
100.0
10.0
0.0
OverweightObesityOverweightObesityOverweightObesity
lower-middle-income countries contained 30 per cent and upper-middle-income countries less
than 1 per cent. By the period 2010-2014, the share of extreme poor living in low-, lower-middle-
and upper-middle-income countries had shifted to 40, 58 and 3 per cent, respectively.6 Stable
middle-income countries now hold the bulk of Asia’s poor (Kanbur and Sumner, 2012).
Extreme poverty remains a largely rural phenomenon. A dataset produced by IFAD and the
World Bank offers tentative estimates on rural and urban extreme poverty in Asia (IFAD, 2016a).
These data are available for only a selection of countries and years, but they confirm an important
set of trends. The share of the extreme poor that live in rural areas has been declining at a gradual
pace in most large economies – for instance, in India, Bangladesh, Indonesia and Pakistan – with
two notable exceptions: China and Viet Nam. Nevertheless, the majority of the extreme poor
in each of these countries remain rural rather than urban. Rural poverty shares an important
overlap with geographic remoteness to fast-developing urban centres, characterized by a lack of
infrastructure and higher costs to the provision of public goods.
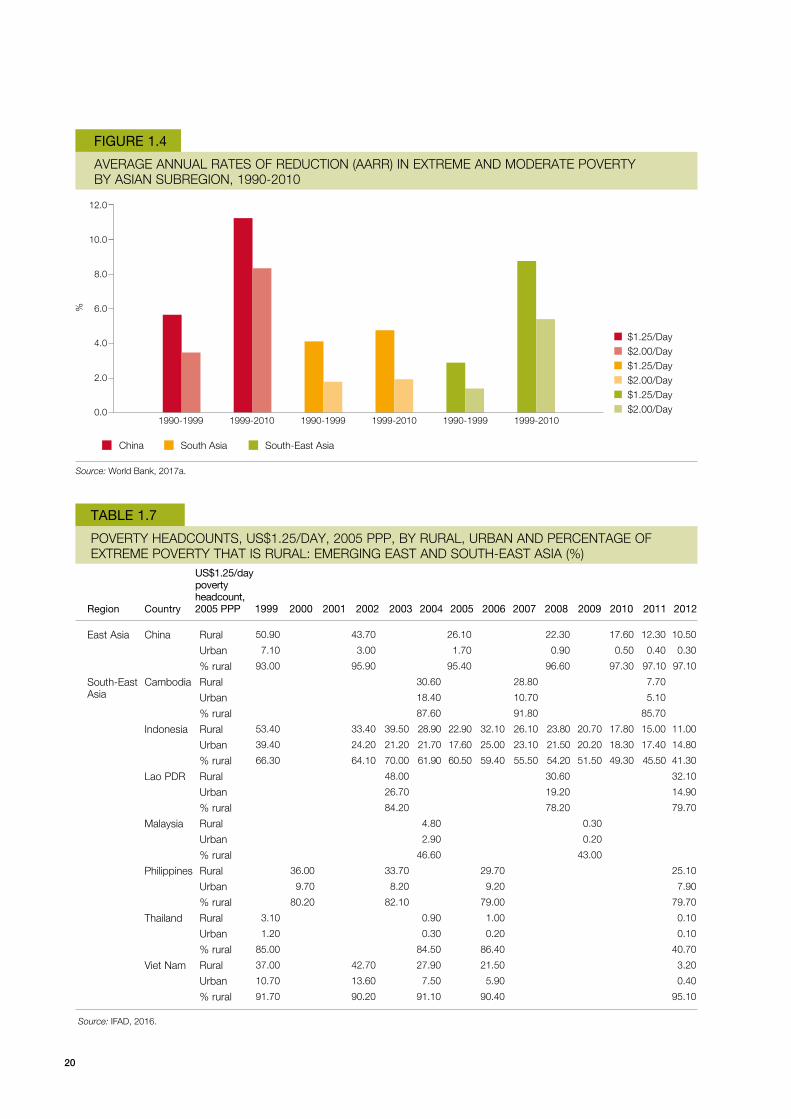
The differential between declines in extreme and moderate poverty suggests that vulnerability
to extreme poverty remains an important concern for lower-middle- and upper-middle-income
countries in Asia. Figure 1.4 offers a comparison of poverty headcounts by subregion and by the
US$1.25 and US$2.00 (2005 PPP) per day poverty lines. A simple comparison of the two suggests
that much of Asia’s poor population did not move far beyond the extreme poverty line. Between
1990 and 2010, in South Asia the poverty headcount at the US$1.25 per day line declined at an
average rate of 4.5 per cent per annum, compared with a rate of 1.8 per cent at the US$2.00 line.
6. As of 1 July 2014, using gross national income per capita, the World Bank classifies countries into low income (≤ US$1,045), middle income (between US$1,045 and US$12,746) and high income (≥ US$12,746). The middle-income countries are then disaggregated into lower-middle- and upper-middle-income countries.
20
AVERAGE ANNUAL RATES OF REDUCTION (AARR) IN EXTREME AND MODERATE POVERTY BY ASIAN SUBREGION, 1990-2010
FIGURE 1.4
%
1990-1999 1999-2010 1990-1999 1999-2010 1990-1999 1999-2010
2.0
4.0
6.0
8.0
10.0
0.0
12.0
China South Asia South-East Asia
Source: World Bank, 2017a.
$1.25/Day$2.00/Day$1.25/Day$2.00/Day$1.25/Day$2.00/Day
TABLE 1.7
POVERTY HEADCOUNTS, US$1.25/DAY, 2005 PPP, BY RURAL, URBAN AND PERCENTAGE OF EXTREME POVERTY THAT IS RURAL: EMERGING EAST AND SOUTH-EAST ASIA (%)
East Asia
South-East Asia
China
Cambodia
Indonesia
Lao PDR
Malaysia
Philippines
Thailand
Viet Nam
Region Country 1999 2000 2001 2002 2003 2004 2005 2006 2007 2008 2009 2010 2011 2012
50.90 43.70 26.10 22.30 17.60 12.30 10.50
7.10 3.00 1.70 0.90 0.50 0.40 0.30
93.00 95.90 95.40 96.60 97.30 97.10 97.10
30.60 28.80 7.70
18.40 10.70 5.10
87.60 91.80 85.70
53.40 33.40 39.50 28.90 22.90 32.10 26.10 23.80 20.70 17.80 15.00 11.00
39.40 24.20 21.20 21.70 17.60 25.00 23.10 21.50 20.20 18.30 17.40 14.80
66.30 64.10 70.00 61.90 60.50 59.40 55.50 54.20 51.50 49.30 45.50 41.30
48.00 30.60 32.10
26.70 19.20 14.90
84.20 78.20 79.70
4.80 0.30
2.90 0.20
46.60 43.00
36.00 33.70 29.70 25.10
9.70 8.20 9.20 7.90
80.20 82.10 79.00 79.70
3.10 0.90 1.00 0.10
1.20 0.30 0.20 0.10
85.00 84.50 86.40 40.70
37.00 42.70 27.90 21.50 3.20
10.70 13.60 7.50 5.90 0.40
91.70 90.20 91.10 90.40 95.10
Source: IFAD, 2016.
Rural
Urban
% rural
Rural
Urban
% rural
Rural
Urban
% rural
Rural
Urban
% rural
Rural
Urban
% rural
Rural
Urban
% rural
Rural
Urban
% rural
Rural
Urban
% rural
US$1.25/day poverty headcount, 2005 PPP

21
In other words, extreme poverty rates declined twice as quickly from year to year as moderate
ones. To a lesser extent, similar trends played out across China and South-East Asia. While
extreme poverty is fast on its way to eradication across many Asian countries, moderate rates of
poverty doggedly persist.
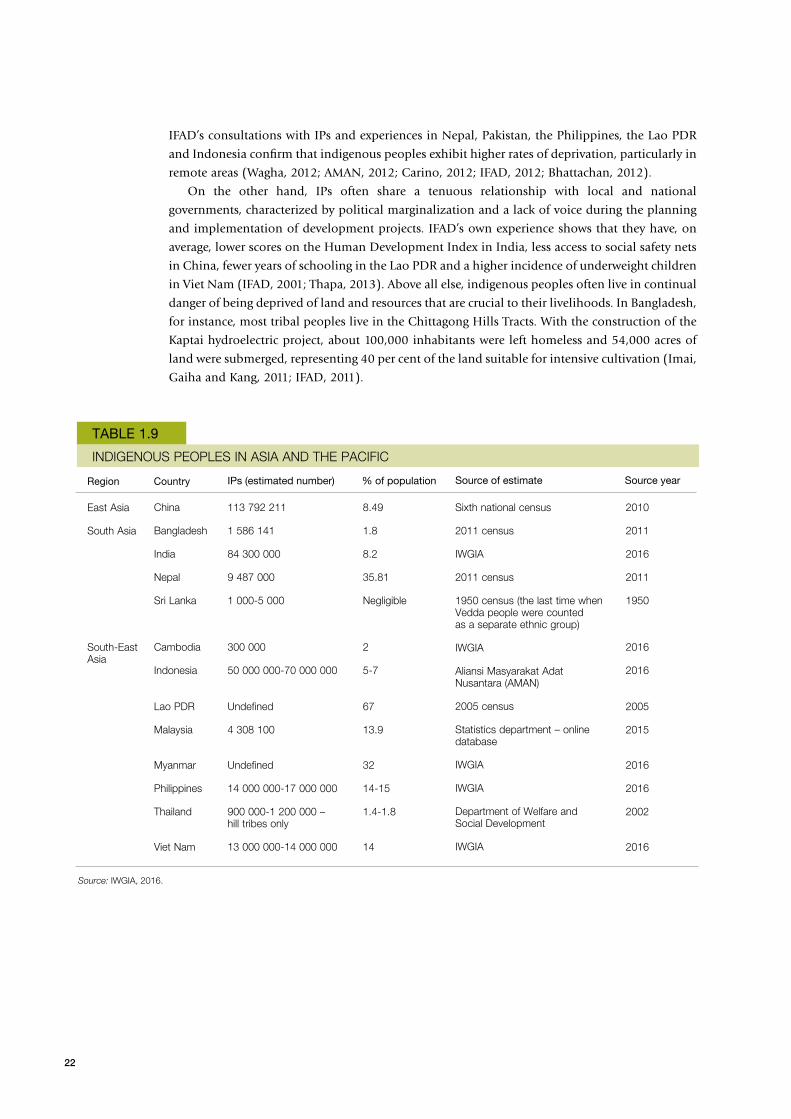
Poverty rates remain especially acute for indigenous peoples and ethnic minorities. The
International Working Group for Indigenous Affairs (IWGIA) contends that 70 per cent of the world’s
indigenous peoples (IPs) live in Asia and the Pacific (IWGIA, 2016). IPs in Asia represent a highly
diverse range of cultures, livelihoods and developmental experiences. However, a persistent and
common theme across these experiences is lack of development: in general, IPs have not benefited
as much from growth and structural transformation as have other segments of national populations.
On the one hand, indigenous peoples are overrepresented in national poverty estimates. In
China, for instance, members of more than 50 ethnic minority groups are concentrated in poor,
remote and mountainous regions. They comprise less than 9 per cent of the total population,
but represent about 40 per cent of those in absolute poverty. In Viet Nam, there are significant
disparities in the living standards of ethnic minority groups. These groups represent 14 per cent of
the population, but 29 per cent of poor people. Moreover, they remained trapped in poverty during
a period of otherwise pro-poor growth (Thapa, 2013; Imai, Gaiha and Kang, 2011; IFAD, 2011).
TABLE 1.8
POVERTY HEADCOUNTS, US$1.25/DAY, 2005 PPP, BY RURAL, URBAN AND PERCENTAGE OF EXTREME POVERTY THAT IS RURAL: SOUTH ASIA (%)
South Asia Bangladesh
Bhutan
India
Iran
Maldives
Nepal
Pakistan
Sri Lanka
Region Country 2000 2001 2002 2003 2004 2005 2006 2007 2008 2009 2010 2011 2012 2013
65.10 56.00 48.90
35.10 32.70 23.90
85.70 82.40 82.40
83.50 7.90 2.50
61.70 0.90 0.60
77.10 94.60 88.00
43.80 34.30 24.40
36.20 28.90 21.90
74.60 72.60 70.70
1.50 0.90 0.10
0.50 0.00 0.00
58.70 91.00 71.30
1.50
1.40
69.20
51.90 17.00
34.00 29.50
89.70 73.60
19.50 8.50
20.10 11.90
64.60 54.90
11.80 5.80 3.00
7.70 5.10 2.90
87.10 83.40 82.10
Source: IFAD, 2016.
Rural
Urban
% rural
Rural
Urban
% rural
Rural
Urban
% rural
Rural
Urban
% rural
Rural
Urban
% rural
Rural
Urban
% rural
Rural
Urban
% rural
Rural
Urban
% rural
US$1.25/day poverty headcount, 2005 PPP
22
TABLE 1.9
INDIGENOUS PEOPLES IN ASIA AND THE PACIFIC
East Asia
South Asia
South-East Asia
China
Bangladesh
India
Nepal
Sri Lanka
Cambodia
Indonesia
Lao PDR
Malaysia
Myanmar
Philippines
Thailand
Viet Nam
113 792 211
1 586 141
84 300 000
9 487 000
1 000-5 000
300 000
50 000 000-70 000 000
Undefined
4 308 100
Undefined
14 000 000-17 000 000
900 000-1 200 000 – hill tribes only
13 000 000-14 000 000
8.49
1.8
8.2
35.81
Negligible
2
5-7
67
13.9
32
14-15
1.4-1.8
14
Sixth national census
2011 census
IWGIA
2011 census
1950 census (the last time when Vedda people were counted as a separate ethnic group)
IWGIA
Aliansi Masyarakat Adat Nusantara (AMAN)
2005 census
Statistics department – online database
IWGIA
IWGIA
Department of Welfare and Social Development
IWGIA
2010
2011
2016
2011
1950
2016
2016
2005
2015
2016
2016
2002
2016
Region Country
Source: IWGIA, 2016.
IPs (estimated number) % of population Source of estimate Source year
IFAD’s consultations with IPs and experiences in Nepal, Pakistan, the Philippines, the Lao PDR
and Indonesia confirm that indigenous peoples exhibit higher rates of deprivation, particularly in
remote areas (Wagha, 2012; AMAN, 2012; Carino, 2012; IFAD, 2012; Bhattachan, 2012).
On the other hand, IPs often share a tenuous relationship with local and national
governments, characterized by political marginalization and a lack of voice during the planning
and implementation of development projects. IFAD’s own experience shows that they have, on
average, lower scores on the Human Development Index in India, less access to social safety nets
in China, fewer years of schooling in the Lao PDR and a higher incidence of underweight children
in Viet Nam (IFAD, 2001; Thapa, 2013). Above all else, indigenous peoples often live in continual
danger of being deprived of land and resources that are crucial to their livelihoods. In Bangladesh,
for instance, most tribal peoples live in the Chittagong Hills Tracts. With the construction of the
Kaptai hydroelectric project, about 100,000 inhabitants were left homeless and 54,000 acres of
land were submerged, representing 40 per cent of the land suitable for intensive cultivation (Imai,
Gaiha and Kang, 2011; IFAD, 2011).
23
Gender disparities persist across many countries, and share important linkages with poverty,
rurality and the marginalization of indigenous peoples. Disparities in school enrolment,
earnings, access to health care and rights to property all reflect deep formal and informal
patterns of discrimination that harm the development process for both women and men.
However, the last three decades have witnessed a marked improvement in basic indicators of
health, well-being and earning power for women across Asia. Table 1.10 offers a snapshot of basic
indicators – constructed as averages between 2011 and 2015 – in health and education, including
total fertility rate, sex ratio at birth, expected years of schooling and literacy rates. The story that
they tell is basic but compelling: women have the ability to access and utilize education and health
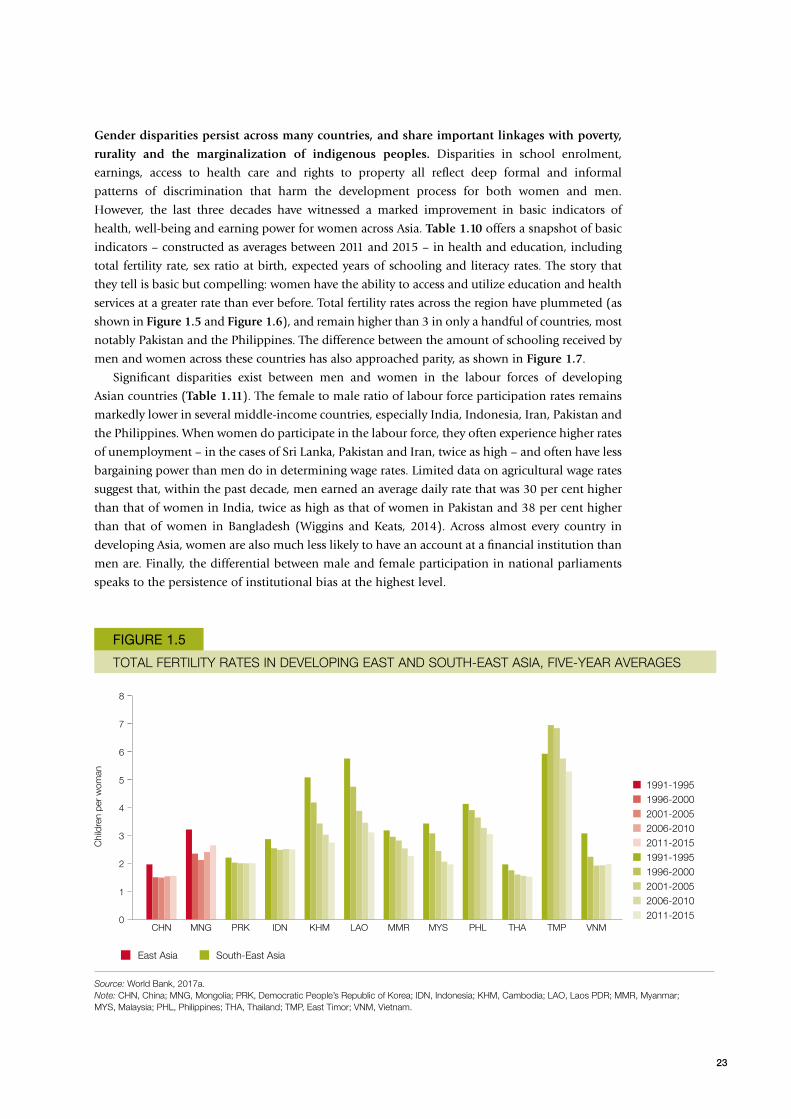
services at a greater rate than ever before. Total fertility rates across the region have plummeted (as
shown in Figure 1.5 and Figure 1.6), and remain higher than 3 in only a handful of countries, most
notably Pakistan and the Philippines. The difference between the amount of schooling received by
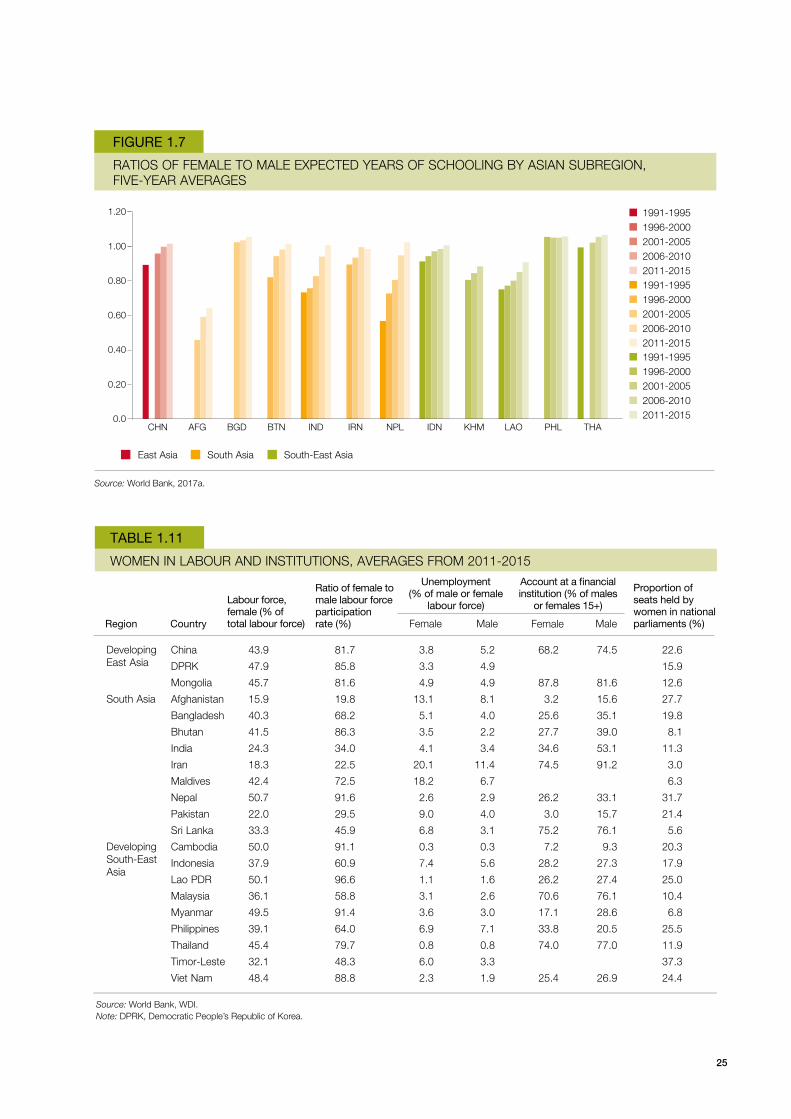
men and women across these countries has also approached parity, as shown in Figure 1.7.
Significant disparities exist between men and women in the labour forces of developing
Asian countries (Table 1.11). The female to male ratio of labour force participation rates remains
markedly lower in several middle-income countries, especially India, Indonesia, Iran, Pakistan and
the Philippines. When women do participate in the labour force, they often experience higher rates
of unemployment – in the cases of Sri Lanka, Pakistan and Iran, twice as high – and often have less
bargaining power than men do in determining wage rates. Limited data on agricultural wage rates
suggest that, within the past decade, men earned an average daily rate that was 30 per cent higher
than that of women in India, twice as high as that of women in Pakistan and 38 per cent higher
than that of women in Bangladesh (Wiggins and Keats, 2014). Across almost every country in
developing Asia, women are also much less likely to have an account at a financial institution than
men are. Finally, the differential between male and female participation in national parliaments
speaks to the persistence of institutional bias at the highest level.
TOTAL FERTILITY RATES IN DEVELOPING EAST AND SOUTH-EAST ASIA, FIVE-YEAR AVERAGES
FIGURE 1.5
Chi
ldre
n pe
r w
oman
CHN MNG PRK IDN KHM LAO MMR MYS PHL THA TMP VNM
1
2
3
4
5
0
6
7
8
East Asia
Source: World Bank, 2017a.Note: CHN, China; MNG, Mongolia; PRK, Democratic People’s Republic of Korea; IDN, Indonesia; KHM, Cambodia; LAO, Laos PDR; MMR, Myanmar; MYS, Malaysia; PHL, Philippines; THA, Thailand; TMP, East Timor; VNM, Vietnam.
South-East Asia
1991-19951996-20002001-20052006-20102011-2015
1991-19951996-20002001-20052006-20102011-2015

24
TOTAL FERTILITY RATES IN SOUTH ASIA, FIVE-YEAR AVERAGES
FIGURE 1.6
Source: World Bank, 2017a.Note: AFG, Afghanistan; BGD, Bangladesh; BTN, Bhutan; IND, India; IRN, Iran; LKA, Sri Lanka; MDV, Myanmar; NPL, Nepal, PAK, Pakistan.
Chi
ldre
n pe
r w
oman
1
2
3
4
5
0
6
7
8
South Asia
1991-19951996-20002001-20052006-20102011-2015
AFG BGD BTN IND IRN LKA MDV NPL PAK
TABLE 1.10
BIRTH AND EDUCATION STATISTICS BY GENDER: AVERAGES FROM 2011-2015
Developing East Asia
South Asia
Developing South-East Asia
China
DPRK
Mongolia
Afghanistan
Bangladesh
Bhutan
India
Iran
Maldives
Nepal
Pakistan
Sri Lanka
Cambodia
Indonesia
Lao PDR
Malaysia
Myanmar
Philippines
Thailand
Timor-Leste
Viet Nam
1.6 48.5 1.16 13.5 13.3 94.5 98.2
2.0 51.1 1.05 100.0 100.0
2.6 50.5 1.03 15.5 14.2 98.6 98.2
5.2 48.5 1.06 8.0 12.4 20.7 48.4
2.2 49.5 1.05 10.1 9.6 57.7 64.3
2.1 46.3 1.04 12.6 12.4 51.6 68.6
2.5 48.2 1.11 11.4 11.3 61.1 79.9
1.7 49.6 1.05 14.5 14.7 80.5 89.9
2.2 49.9 1.10 98.9 99.8
2.3 51.5 1.07 12.5 12.2 51.8 73.8
3.7 48.6 1.09 7.1 8.5 42.4 68.8
2.1 51.7 1.04 14.1 13.5 91.7 93.6
2.7 51.2 1.05 72.3 85.0
2.5 49.6 1.05 12.8 12.8 92.4 96.5
3.1 50.3 1.05 10.0 11.0 72.8 87.2
2.0 48.4 1.06 93.1 96.2
2.3 51.2 1.03 91.0 95.1
3.0 49.5 1.06 13.1 12.4 96.9 96.1
1.5 50.7 1.06 14.1 13.2 92.4 95.3
5.3 49.2 1.05 59.5 68.5
2.0 50.6 1.12 92.8 96.3
Region Country
Source: World Bank, WDI.Note: DPRK, Democratic People’s Republic of Korea.
Fertility rate, total (births per woman)
Population, female (% of total)
Sex ratio at birth (male births per female births)
Expected years of schooling
Adult literacy rate (%)
Female FemaleMale Male
25
RATIOS OF FEMALE TO MALE EXPECTED YEARS OF SCHOOLING BY ASIAN SUBREGION, FIVE-YEAR AVERAGES
FIGURE 1.7
0.20
0.40
0.60
0.80
1.00
0.0
1.20
East Asia South Asia South-East Asia
Source: World Bank, 2017a.
TABLE 1.11
WOMEN IN LABOUR AND INSTITUTIONS, AVERAGES FROM 2011-2015
1991-19951996-20002001-20052006-20102011-2015
Developing East Asia
South Asia
Developing South-East Asia
China
DPRK
Mongolia
Afghanistan
Bangladesh
Bhutan
India
Iran
Maldives
Nepal
Pakistan
Sri Lanka
Cambodia
Indonesia
Lao PDR
Malaysia
Myanmar
Philippines
Thailand
Timor-Leste
Viet Nam
43.9 81.7 3.8 5.2 68.2 74.5 22.6
47.9 85.8 3.3 4.9 15.9
45.7 81.6 4.9 4.9 87.8 81.6 12.6
15.9 19.8 13.1 8.1 3.2 15.6 27.7
40.3 68.2 5.1 4.0 25.6 35.1 19.8
41.5 86.3 3.5 2.2 27.7 39.0 8.1
24.3 34.0 4.1 3.4 34.6 53.1 11.3
18.3 22.5 20.1 11.4 74.5 91.2 3.0
42.4 72.5 18.2 6.7 6.3
50.7 91.6 2.6 2.9 26.2 33.1 31.7
22.0 29.5 9.0 4.0 3.0 15.7 21.4
33.3 45.9 6.8 3.1 75.2 76.1 5.6
50.0 91.1 0.3 0.3 7.2 9.3 20.3
37.9 60.9 7.4 5.6 28.2 27.3 17.9
50.1 96.6 1.1 1.6 26.2 27.4 25.0
36.1 58.8 3.1 2.6 70.6 76.1 10.4
49.5 91.4 3.6 3.0 17.1 28.6 6.8
39.1 64.0 6.9 7.1 33.8 20.5 25.5
45.4 79.7 0.8 0.8 74.0 77.0 11.9
32.1 48.3 6.0 3.3 37.3
48.4 88.8 2.3 1.9 25.4 26.9 24.4
Region Country
Source: World Bank, WDI.Note: DPRK, Democratic People’s Republic of Korea.
Labour force, female (% of total labour force)
Ratio of female to male labour force participation rate (%)
Proportion of seats held by women in national parliaments (%)
Unemployment (% of male or female
labour force)
Account at a financial institution (% of males
or females 15+)Female FemaleMale Male
CHN AFG BGD BTN IND IRN NPL IDN KHM LAO PHL THA
1991-19951996-20002001-20052006-20102011-2015
1991-19951996-20002001-20052006-20102011-2015

26
Natural resource degradation, climate change
While economic growth has brought to Asian economies many benefits through higher incomes
and employment, it also has resulted in unprecedented environmental damages, significantly
undermining natural resources and ecosystem services7 through habitat loss and degradation,
overexploitation, alien species invasion, climate change and pollution. Together, population
growth, industrialization and urbanization have encouraged the unsustainable use of natural
capital and the production of waste and greenhouse gas (GHG) emissions, ultimately threatening
the region’s prosperity, equity and sustainable development (ADB, 2011; UNEP, 2016).
Degradation of natural resources and environmental services in the Asia-Pacific regionOver the past four decades, the region’s consumption of four main types of material – biomass,
fossil fuels, metal ores and non-metallic minerals – has increased sharply, fostering environmental
degradation. Between 1995 and 2005, consumption grew by 50 per cent and accounted for well
over half of the global material use in 2015 (UNEP, 2015, 2016; United Nations and ADB,
2012) (Figure 1.8). Much of the increase in material use can be attributed to a small number of
countries, most notably the two mega-economies of China and India, with growing economies
such as Thailand, the Philippines, Viet Nam and Indonesia all projected to become locked into
high-carbon economic growth. The main drivers of accelerating domestic material consumption
are growing affluence of the expanding middle class and, to a lesser extent, population growth.
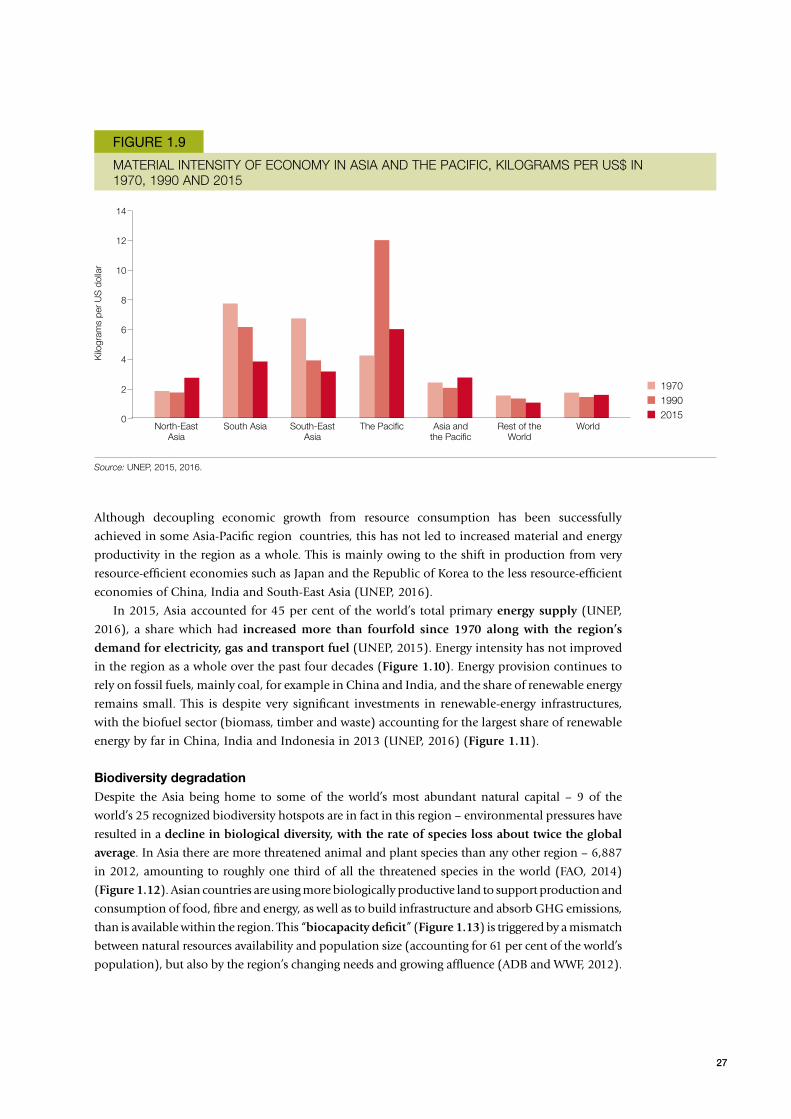
Over the past four decades, material intensity8 has increased significantly in many of the
region’s developing countries: in 2015, the region required four times the input of materials as
the rest of the world to produce US$1 of economic output (UNEP, 2013, 2016) (Figure 1.9).
7. Ecosystem services are the benefits people obtain from ecosystems. These include provisioning services such as food and water (maintenance of watershed services, soil fertility, pollination, seed dispersal, etc.), regulating services such as flood and pest and disease control, cultural services such as spiritual, recreational and cultural benefits, and supporting services, such as nutrient cycling, that maintain the conditions for life on Earth (http://www.unep.org/maweb/documents/document.300.aspx.pdf).
8. Material intensity is calculated as the domestic material extraction per unit of GDP.
DOMESTIC MATERIAL CONSUMPTION IN ASIA AND THE PACIFIC, TONS PER PERSON IN 1970, 1990 AND 2015
FIGURE 1.8
Tons
per
per
son
North-East Asia
South Asia South-East Asia
The Pacific Asia and the Pacific
Rest of the World
World
5
10
15
20
25
0
Source: UNEP, 2015, 2016.
197019902015
27
MATERIAL INTENSITY OF ECONOMY IN ASIA AND THE PACIFIC, KILOGRAMS PER US$ IN 1970, 1990 AND 2015
FIGURE 1.9
Kilo
gram
s pe
r U
S d
olla
r
North-East Asia
South Asia South-East Asia
The Pacific Asia and the Pacific
Rest of the World
World
2
4
6
8
10
0
12
14
Source: UNEP, 2015, 2016.
197019902015
Although decoupling economic growth from resource consumption has been successfully
achieved in some Asia-Pacific region countries, this has not led to increased material and energy
productivity in the region as a whole. This is mainly owing to the shift in production from very
resource-efficient economies such as Japan and the Republic of Korea to the less resource-efficient
economies of China, India and South-East Asia (UNEP, 2016).
In 2015, Asia accounted for 45 per cent of the world’s total primary energy supply (UNEP,
2016), a share which had increased more than fourfold since 1970 along with the region’s
demand for electricity, gas and transport fuel (UNEP, 2015). Energy intensity has not improved
in the region as a whole over the past four decades (Figure 1.10). Energy provision continues to
rely on fossil fuels, mainly coal, for example in China and India, and the share of renewable energy
remains small. This is despite very significant investments in renewable-energy infrastructures,
with the biofuel sector (biomass, timber and waste) accounting for the largest share of renewable
energy by far in China, India and Indonesia in 2013 (UNEP, 2016) (Figure 1.11).
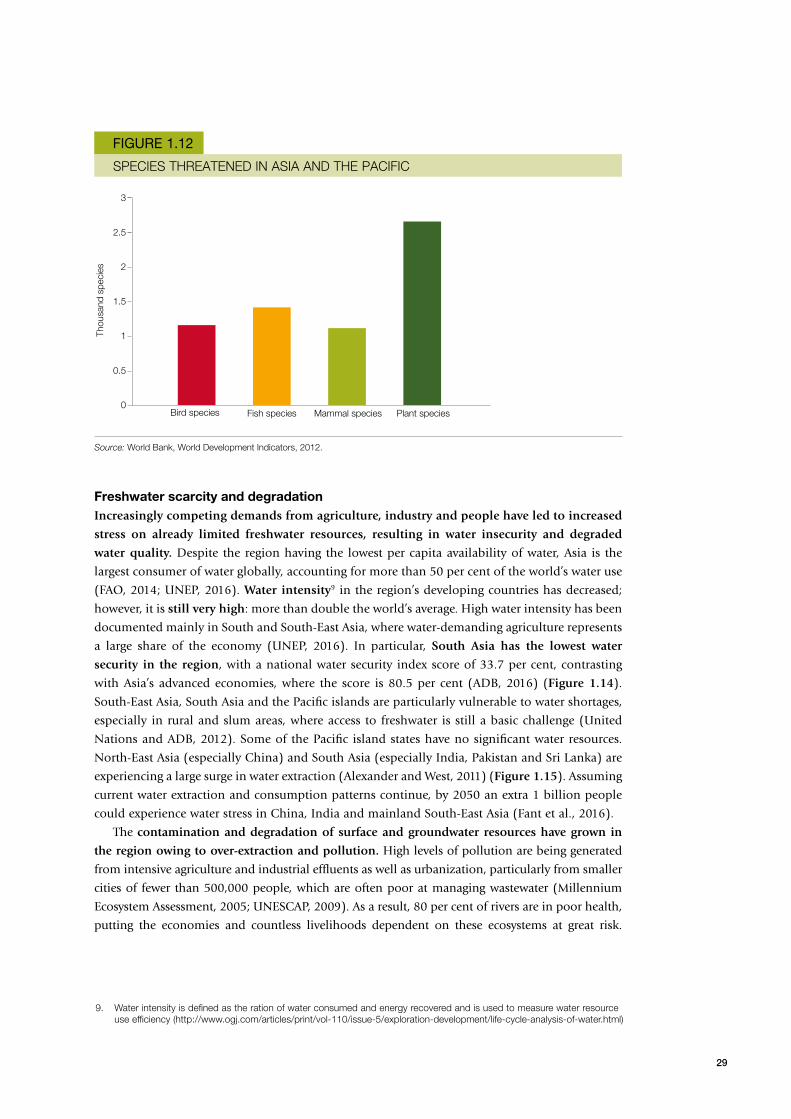
Biodiversity degradationDespite the Asia being home to some of the world’s most abundant natural capital – 9 of the
world’s 25 recognized biodiversity hotspots are in fact in this region – environmental pressures have
resulted in a decline in biological diversity, with the rate of species loss about twice the global
average. In Asia there are more threatened animal and plant species than any other region – 6,887
in 2012, amounting to roughly one third of all the threatened species in the world (FAO, 2014)
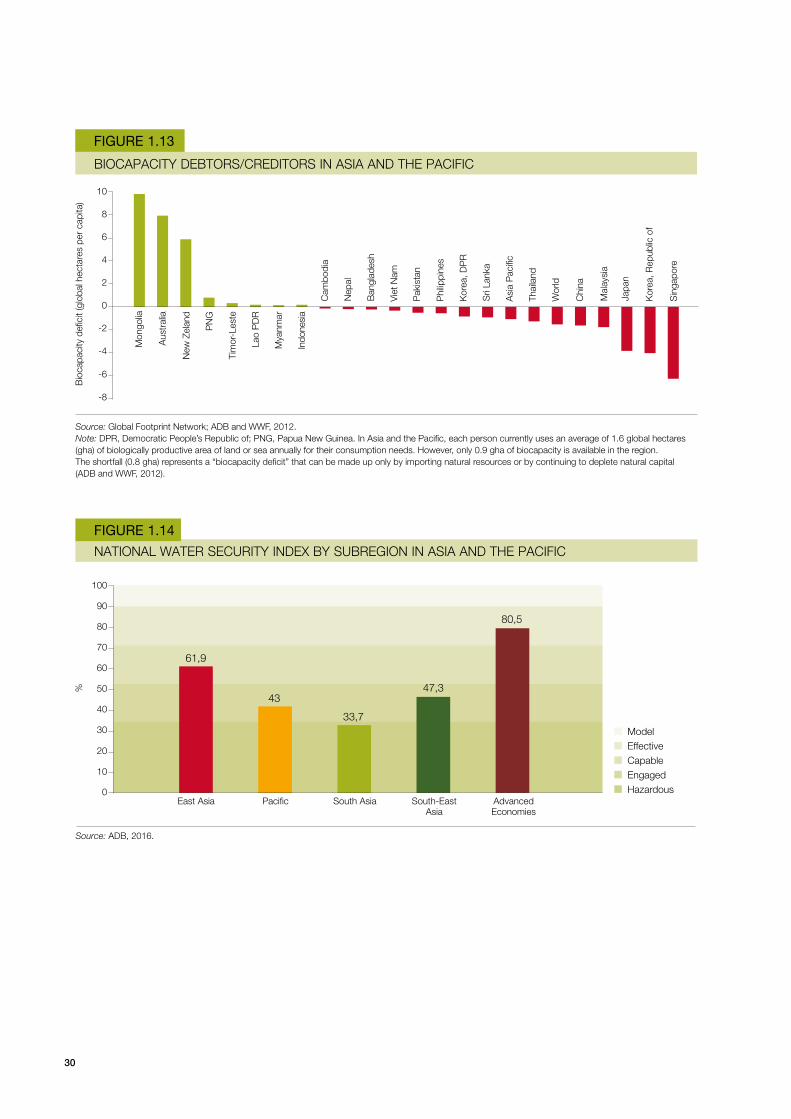
(Figure 1.12). Asian countries are using more biologically productive land to support production and
consumption of food, fibre and energy, as well as to build infrastructure and absorb GHG emissions,
than is available within the region. This “biocapacity deficit” (Figure 1.13) is triggered by a mismatch
between natural resources availability and population size (accounting for 61 per cent of the world’s
population), but also by the region’s changing needs and growing affluence (ADB and WWF, 2012).

28
SHARE OF RENEWABLE ENERGY IN INDONESIA, INDIA AND CHINA, PER CENT IN 1970, 1990 AND 2013
FIGURE 1.11
%
10
0
20
30
40
50
60
70
80
Source: UNEP, 2015, 2016.
197019902013
IndiaIndonesia China
ENERGY INTENSITY IN ASIA AND THE PACIFIC, MEGAJOULES PER US$ IN 1970, 1990 AND 2015
FIGURE 1.10
Meg
ajou
les
per
US
dol
lar
North-East Asia
South Asia South-East Asia
The Pacific Asia and the Pacific
Rest of the World
World
5
0
10
15
20
25
30
35
40
Source: UNEP, 2015, 2016.
197019902015
In 2011 Asia, the person fish consumption footprint was 94 per cent of the world average, the
cropland footprint 80 per cent, the forest footprint 63 per cent, the grazing footprint 31 per cent and
the built-up footprint 112 per cent, all causing degradation of ecosystem services (UNEP, 2016).
Natural ecosystems provide socially and economically valuable services – such as food and fibre
resources, clean water and climate regulation – that are fundamental to human welfare, but are
often overlooked in decision-making processes (ADB and WWF, 2012). The lack of understanding
of both the finite nature and the economic value of ecosystem services have exacerbated biodiversity
loss. The value of terrestrial ecosystem services in Asia will decline by US$3 trillion to
US$5 trillion from 2011 to 2050 under different scenarios, unless a transition towards sustainability
is adopted (Kubiszewski et al., 2016).
29
Freshwater scarcity and degradation Increasingly competing demands from agriculture, industry and people have led to increased
stress on already limited freshwater resources, resulting in water insecurity and degraded
water quality. Despite the region having the lowest per capita availability of water, Asia is the
largest consumer of water globally, accounting for more than 50 per cent of the world’s water use
(FAO, 2014; UNEP, 2016). Water intensity9 in the region’s developing countries has decreased;
however, it is still very high: more than double the world’s average. High water intensity has been
documented mainly in South and South-East Asia, where water-demanding agriculture represents
a large share of the economy (UNEP, 2016). In particular, South Asia has the lowest water
security in the region, with a national water security index score of 33.7 per cent, contrasting
with Asia’s advanced economies, where the score is 80.5 per cent (ADB, 2016) (Figure 1.14).
South-East Asia, South Asia and the Pacific islands are particularly vulnerable to water shortages,
especially in rural and slum areas, where access to freshwater is still a basic challenge (United
Nations and ADB, 2012). Some of the Pacific island states have no significant water resources.
North-East Asia (especially China) and South Asia (especially India, Pakistan and Sri Lanka) are
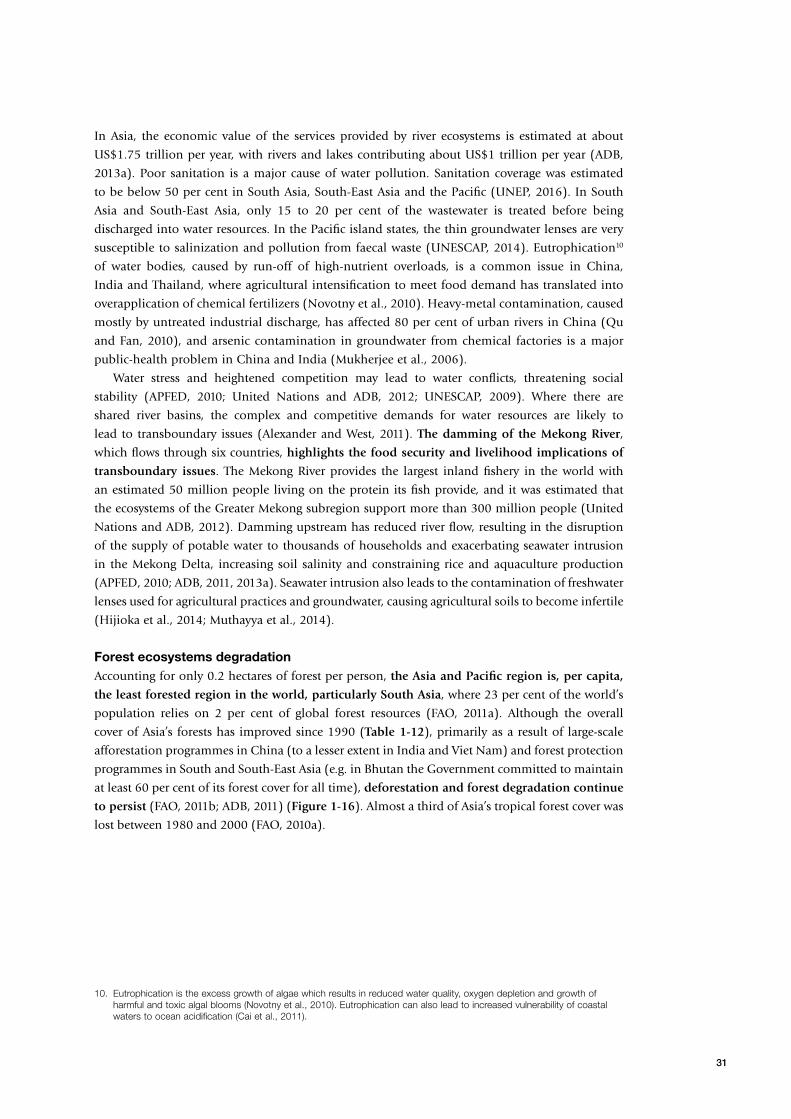
experiencing a large surge in water extraction (Alexander and West, 2011) (Figure 1.15). Assuming
current water extraction and consumption patterns continue, by 2050 an extra 1 billion people
could experience water stress in China, India and mainland South-East Asia (Fant et al., 2016).
The contamination and degradation of surface and groundwater resources have grown in
the region owing to over-extraction and pollution. High levels of pollution are being generated
from intensive agriculture and industrial effluents as well as urbanization, particularly from smaller
cities of fewer than 500,000 people, which are often poor at managing wastewater (Millennium
Ecosystem Assessment, 2005; UNESCAP, 2009). As a result, 80 per cent of rivers are in poor health,
putting the economies and countless livelihoods dependent on these ecosystems at great risk.
9. Water intensity is defined as the ration of water consumed and energy recovered and is used to measure water resource use efficiency (http://www.ogj.com/articles/print/vol-110/issue-5/exploration-development/life-cycle-analysis-of-water.html)
Thou
sand
spe
cies
SPECIES THREATENED IN ASIA AND THE PACIFIC
FIGURE 1.12
0.5
1
1.5
2
2.5
0
3
Source: World Bank, World Development Indicators, 2012.
Bird species Fish species Mammal species Plant species
30
BIOCAPACITY DEBTORS/CREDITORS IN ASIA AND THE PACIFIC
FIGURE 1.13
Bio
capa
city
defi
cit (
glob
al h
ecta
res
per
capi
ta)
Mon
golia
Aus
tral
ia
Chi
na
Kor
ea, R
epub
lic o
f
Mal
aysi
a
Sin
gapo
re
New
Zel
and
PN
G
Tim
or-L
este
Lao
PD
R
Mya
nmar
Indo
nesi
a
Cam
bodi
a
Nep
al
Ban
glad
esh
Vie
t Nam
Pak
ista
n
Phi
lippi
nes
Kor
ea, D
PR
Sri
Lank
a
Asi
a P
acifi
c
Thai
land
Wor
ld
Japa
n
Source: Global Footprint Network; ADB and WWF, 2012.Note: DPR, Democratic People’s Republic of; PNG, Papua New Guinea. In Asia and the Pacific, each person currently uses an average of 1.6 global hectares (gha) of biologically productive area of land or sea annually for their consumption needs. However, only 0.9 gha of biocapacity is available in the region. The shortfall (0.8 gha) represents a “biocapacity deficit” that can be made up only by importing natural resources or by continuing to deplete natural capital (ADB and WWF, 2012).
-6
-4
-2
0
2
4
6
8
10
-8
NATIONAL WATER SECURITY INDEX BY SUBREGION IN ASIA AND THE PACIFIC
FIGURE 1.14
%
East Asia Pacific South Asia South-East Asia
Advanced Economies
Source: ADB, 2016.
ModelEffectiveCapableEngagedHazardous
20
30
40
50
60
70
80
90
100
61,9
43
33,7
47,3
80,5
10
0
31
In Asia, the economic value of the services provided by river ecosystems is estimated at about
US$1.75 trillion per year, with rivers and lakes contributing about US$1 trillion per year (ADB,
2013a). Poor sanitation is a major cause of water pollution. Sanitation coverage was estimated
to be below 50 per cent in South Asia, South-East Asia and the Pacific (UNEP, 2016). In South
Asia and South-East Asia, only 15 to 20 per cent of the wastewater is treated before being
discharged into water resources. In the Pacific island states, the thin groundwater lenses are very
susceptible to salinization and pollution from faecal waste (UNESCAP, 2014). Eutrophication10
of water bodies, caused by run-off of high-nutrient overloads, is a common issue in China,
India and Thailand, where agricultural intensification to meet food demand has translated into
overapplication of chemical fertilizers (Novotny et al., 2010). Heavy-metal contamination, caused
mostly by untreated industrial discharge, has affected 80 per cent of urban rivers in China (Qu
and Fan, 2010), and arsenic contamination in groundwater from chemical factories is a major
public-health problem in China and India (Mukherjee et al., 2006).
Water stress and heightened competition may lead to water conflicts, threatening social
stability (APFED, 2010; United Nations and ADB, 2012; UNESCAP, 2009). Where there are
shared river basins, the complex and competitive demands for water resources are likely to
lead to transboundary issues (Alexander and West, 2011). The damming of the Mekong River,
which flows through six countries, highlights the food security and livelihood implications of
transboundary issues. The Mekong River provides the largest inland fishery in the world with
an estimated 50 million people living on the protein its fish provide, and it was estimated that
the ecosystems of the Greater Mekong subregion support more than 300 million people (United
Nations and ADB, 2012). Damming upstream has reduced river flow, resulting in the disruption
of the supply of potable water to thousands of households and exacerbating seawater intrusion
in the Mekong Delta, increasing soil salinity and constraining rice and aquaculture production
(APFED, 2010; ADB, 2011, 2013a). Seawater intrusion also leads to the contamination of freshwater
lenses used for agricultural practices and groundwater, causing agricultural soils to become infertile
(Hijioka et al., 2014; Muthayya et al., 2014).
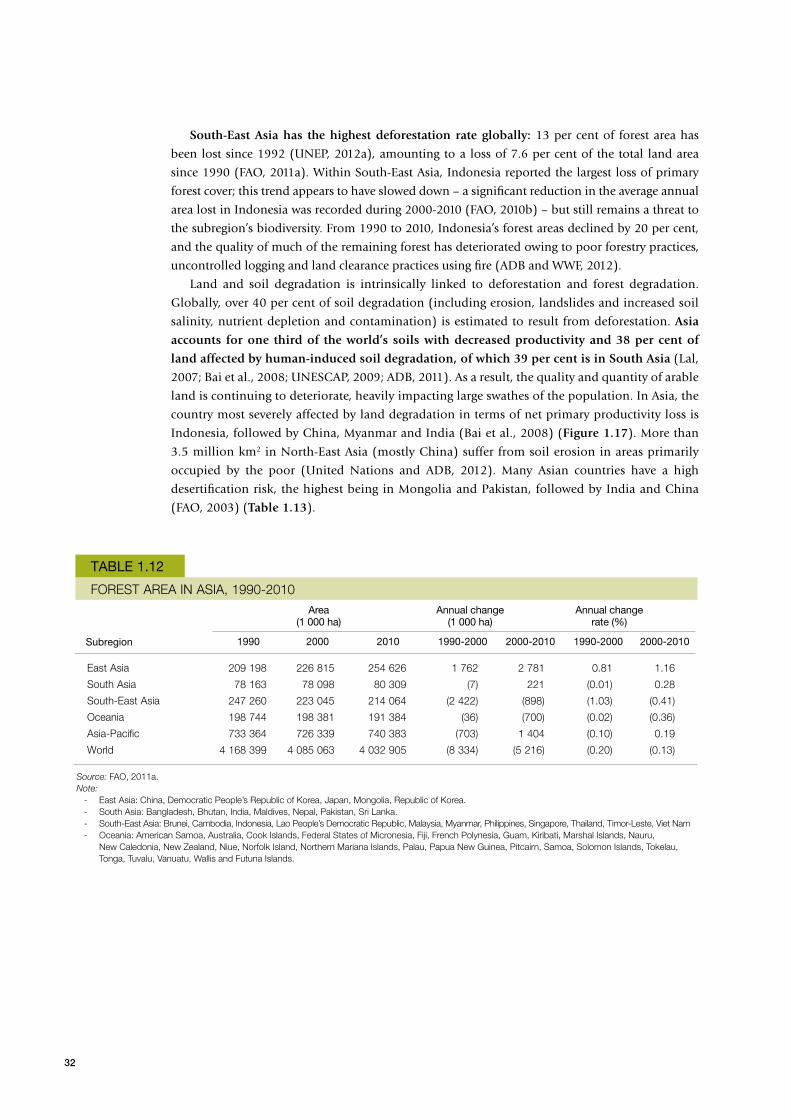
Forest ecosystems degradationAccounting for only 0.2 hectares of forest per person, the Asia and Pacific region is, per capita,
the least forested region in the world, particularly South Asia, where 23 per cent of the world’s
population relies on 2 per cent of global forest resources (FAO, 2011a). Although the overall
cover of Asia’s forests has improved since 1990 (Table 1-12), primarily as a result of large-scale
afforestation programmes in China (to a lesser extent in India and Viet Nam) and forest protection
programmes in South and South-East Asia (e.g. in Bhutan the Government committed to maintain
at least 60 per cent of its forest cover for all time), deforestation and forest degradation continue
to persist (FAO, 2011b; ADB, 2011) (Figure 1-16). Almost a third of Asia’s tropical forest cover was
lost between 1980 and 2000 (FAO, 2010a).
10. Eutrophication is the excess growth of algae which results in reduced water quality, oxygen depletion and growth of harmful and toxic algal blooms (Novotny et al., 2010). Eutrophication can also lead to increased vulnerability of coastal waters to ocean acidification (Cai et al., 2011).
32
South-East Asia has the highest deforestation rate globally: 13 per cent of forest area has
been lost since 1992 (UNEP, 2012a), amounting to a loss of 7.6 per cent of the total land area
since 1990 (FAO, 2011a). Within South-East Asia, Indonesia reported the largest loss of primary
forest cover; this trend appears to have slowed down – a significant reduction in the average annual
area lost in Indonesia was recorded during 2000-2010 (FAO, 2010b) – but still remains a threat to
the subregion’s biodiversity. From 1990 to 2010, Indonesia’s forest areas declined by 20 per cent,
and the quality of much of the remaining forest has deteriorated owing to poor forestry practices,
uncontrolled logging and land clearance practices using fire (ADB and WWF, 2012).
Land and soil degradation is intrinsically linked to deforestation and forest degradation.
Globally, over 40 per cent of soil degradation (including erosion, landslides and increased soil
salinity, nutrient depletion and contamination) is estimated to result from deforestation. Asia
accounts for one third of the world’s soils with decreased productivity and 38 per cent of
land affected by human-induced soil degradation, of which 39 per cent is in South Asia (Lal,
2007; Bai et al., 2008; UNESCAP, 2009; ADB, 2011). As a result, the quality and quantity of arable
land is continuing to deteriorate, heavily impacting large swathes of the population. In Asia, the
country most severely affected by land degradation in terms of net primary productivity loss is
Indonesia, followed by China, Myanmar and India (Bai et al., 2008) (Figure 1.17). More than
3.5 million km2 in North-East Asia (mostly China) suffer from soil erosion in areas primarily
occupied by the poor (United Nations and ADB, 2012). Many Asian countries have a high
desertification risk, the highest being in Mongolia and Pakistan, followed by India and China
(FAO, 2003) (Table 1.13).
Annual change rate (%)
TABLE 1.12
FOREST AREA IN ASIA, 1990-2010
East Asia
South Asia
South-East Asia
Oceania
Asia-Pacific
World
209 198 226 815 254 626 1 762 2 781 0.81 1.16
78 163 78 098 80 309 (7) 221 (0.01) 0.28
247 260 223 045 214 064 (2 422) (898) (1.03) (0.41)
198 744 198 381 191 384 (36) (700) (0.02) (0.36)
733 364 726 339 740 383 (703) 1 404 (0.10) 0.19
4 168 399 4 085 063 4 032 905 (8 334) (5 216) (0.20) (0.13)
Subregion
Source: FAO, 2011a.Note:
- East Asia: China, Democratic People’s Republic of Korea, Japan, Mongolia, Republic of Korea.- South Asia: Bangladesh, Bhutan, India, Maldives, Nepal, Pakistan, Sri Lanka.- South-East Asia: Brunei, Cambodia, Indonesia, Lao People’s Democratic Republic, Malaysia, Myanmar, Philippines, Singapore, Thailand, Timor-Leste, Viet Nam- Oceania: American Samoa, Australia, Cook Islands, Federal States of Micronesia, Fiji, French Polynesia, Guam, Kiribati, Marshal Islands, Nauru,
New Caledonia, New Zealand, Niue, Norfolk Island, Northern Mariana Islands, Palau, Papua New Guinea, Pitcairn, Samoa, Solomon Islands, Tokelau, Tonga, Tuvalu, Vanuatu, Wallis and Futuna Islands.
Annual change (1 000 ha)
Area (1 000 ha)
1990 2000 2010 1990-2000 2000-2010 1990-2000 2000-2010
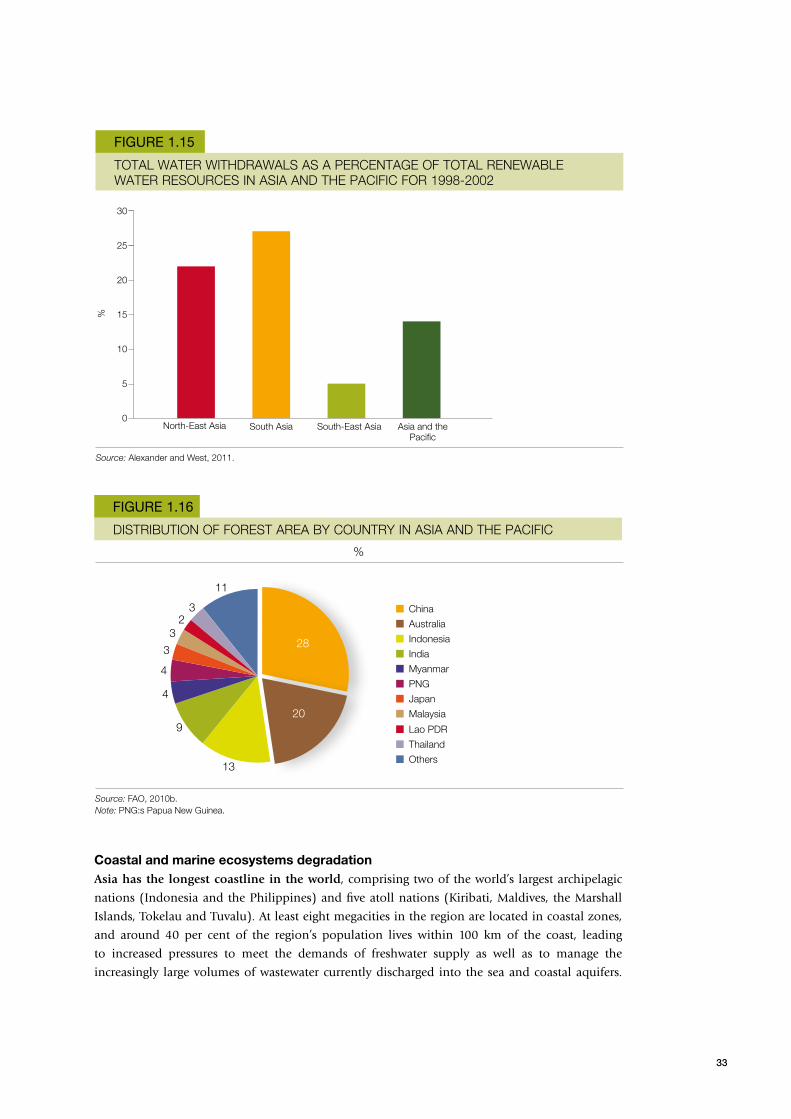
33
%
TOTAL WATER WITHDRAWALS AS A PERCENTAGE OF TOTAL RENEWABLE WATER RESOURCES IN ASIA AND THE PACIFIC FOR 1998-2002
FIGURE 1.15
5
10
15
20
25
0
30
Source: Alexander and West, 2011.
North-East Asia South Asia South-East Asia Asia and the Pacific
DISTRIBUTION OF FOREST AREA BY COUNTRY IN ASIA AND THE PACIFIC
FIGURE 1.16
%
Coastal and marine ecosystems degradation Asia has the longest coastline in the world, comprising two of the world’s largest archipelagic
nations (Indonesia and the Philippines) and five atoll nations (Kiribati, Maldives, the Marshall
Islands, Tokelau and Tuvalu). At least eight megacities in the region are located in coastal zones,
and around 40 per cent of the region’s population lives within 100 km of the coast, leading
to increased pressures to meet the demands of freshwater supply as well as to manage the
increasingly large volumes of wastewater currently discharged into the sea and coastal aquifers.
Source: FAO, 2010b.Note: PNG:s Papua New Guinea.
China
Australia
Indonesia
India
Myanmar
PNG
Japan
Malaysia
Lao PDR
Thailand
Others13
9
4
4
3
32
3
11
28
20
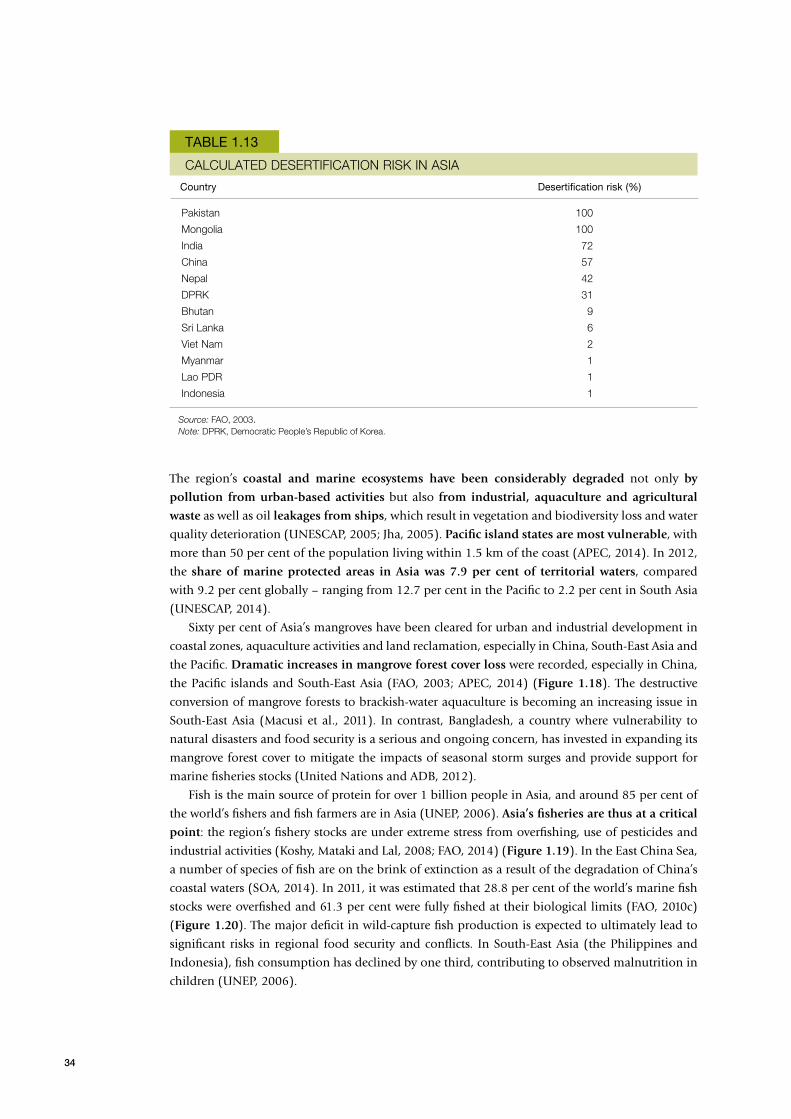
34
The region’s coastal and marine ecosystems have been considerably degraded not only by
pollution from urban-based activities but also from industrial, aquaculture and agricultural
waste as well as oil leakages from ships, which result in vegetation and biodiversity loss and water
quality deterioration (UNESCAP, 2005; Jha, 2005). Pacific island states are most vulnerable, with
more than 50 per cent of the population living within 1.5 km of the coast (APEC, 2014). In 2012,
the share of marine protected areas in Asia was 7.9 per cent of territorial waters, compared
with 9.2 per cent globally – ranging from 12.7 per cent in the Pacific to 2.2 per cent in South Asia
(UNESCAP, 2014).
Sixty per cent of Asia’s mangroves have been cleared for urban and industrial development in
coastal zones, aquaculture activities and land reclamation, especially in China, South-East Asia and
the Pacific. Dramatic increases in mangrove forest cover loss were recorded, especially in China,
the Pacific islands and South-East Asia (FAO, 2003; APEC, 2014) (Figure 1.18). The destructive
conversion of mangrove forests to brackish-water aquaculture is becoming an increasing issue in
South-East Asia (Macusi et al., 2011). In contrast, Bangladesh, a country where vulnerability to
natural disasters and food security is a serious and ongoing concern, has invested in expanding its
mangrove forest cover to mitigate the impacts of seasonal storm surges and provide support for
marine fisheries stocks (United Nations and ADB, 2012).
Fish is the main source of protein for over 1 billion people in Asia, and around 85 per cent of
the world’s fishers and fish farmers are in Asia (UNEP, 2006). Asia’s fisheries are thus at a critical
point: the region’s fishery stocks are under extreme stress from overfishing, use of pesticides and
industrial activities (Koshy, Mataki and Lal, 2008; FAO, 2014) (Figure 1.19). In the East China Sea,
a number of species of fish are on the brink of extinction as a result of the degradation of China’s
coastal waters (SOA, 2014). In 2011, it was estimated that 28.8 per cent of the world’s marine fish
stocks were overfished and 61.3 per cent were fully fished at their biological limits (FAO, 2010c)
(Figure 1.20). The major deficit in wild-capture fish production is expected to ultimately lead to
significant risks in regional food security and conflicts. In South-East Asia (the Philippines and
Indonesia), fish consumption has declined by one third, contributing to observed malnutrition in
children (UNEP, 2006).
TABLE 1.13
CALCULATED DESERTIFICATION RISK IN ASIA
Pakistan
Mongolia
India
China
Nepal
DPRK
Bhutan
Sri Lanka
Viet Nam
Myanmar
Lao PDR
Indonesia
100
100
72
57
42
31
9
6
2
1
1
1
Country Desertification risk (%)
Source: FAO, 2003.Note: DPRK, Democratic People’s Republic of Korea.

35
Source: Bai et al., 2008. Note: PNG, Papa New Guinea.
COUNTRIES MOST AFFECTED BY LAND DEGRADATION IN ASIA AND THE PACIFIC IN TERMS OF NET PRIMARY PRODUCTION (NPP) LOSS (LEFT) AND NUMBER OF PEOPLE AFFECTED (RIGHT)
FIGURE 1.17
Tota
l NP
P lo
ss (m
illion
tons
of C
/23
year
s)
10
20
30
40
60
50
70
0
80
Num
ber o
f pe
ople
affe
cted
(milli
ons)
100
150
200
250
300
350
400
450
500
50
0
Chi
na
Mal
aysi
a
Thai
land
Indo
nesi
a
Phi
lippi
nes
Laos
PN
G
Mya
nmar
Indi
a
Total NPP lossAffected people
On top of the local threats to coastal and marine ecosystems, climate-change-induced coral
bleaching and ocean acidification can reduce coral growth rates. South-East Asia is home to
40 per cent of the world’s coral reef areas (Hijioka et al., 2014), 95 per cent of which are threatened,
with almost 50 per cent of these areas in high or very high threat categories. Over the past 40 years,
in the Indo-Pacific Coral Triangle11 – recognized as the global centre of marine biodiversity and
goods and services value – 40 per cent of coral reefs have been lost and 80 per cent of the spawning
aggregations of reef fish have disappeared or declined, affecting an estimated 150 million people
(ADB, 2011; ADB and WWF, 2012; United Nations and ADB, 2012; APEC, 2014).
CHANGE IN MANGROVE FOREST COVER BY COUNTRY IN ASIA AND THE PACIFIC (1990-2000)
FIGURE 1.18
Source: FAO, 2003.Note: PNG, Papa New Guinea.
%
Chi
na
Viet
Nam
Indi
a
Ban
glad
esh
Vanu
atu
Sam
oa
Tuva
lu
Indo
nesi
a
Tim
or-L
este
Paki
stan
Cam
bodi
a
Fiji
Sri
Lank
a
PN
G
Phi
lippi
nes
Sol
omon
Isla
nds
Mya
nmar
Mal
aysi
a
Thai
land
Bru
nei
Kiri
bati
-50
-40
-30
-20
-10
0
10
20
11. Area encompassing the tropical waters of Indonesia, Malaysia, Papua New Guinea, the Philippines, Solomon Islands and Timor-Leste.
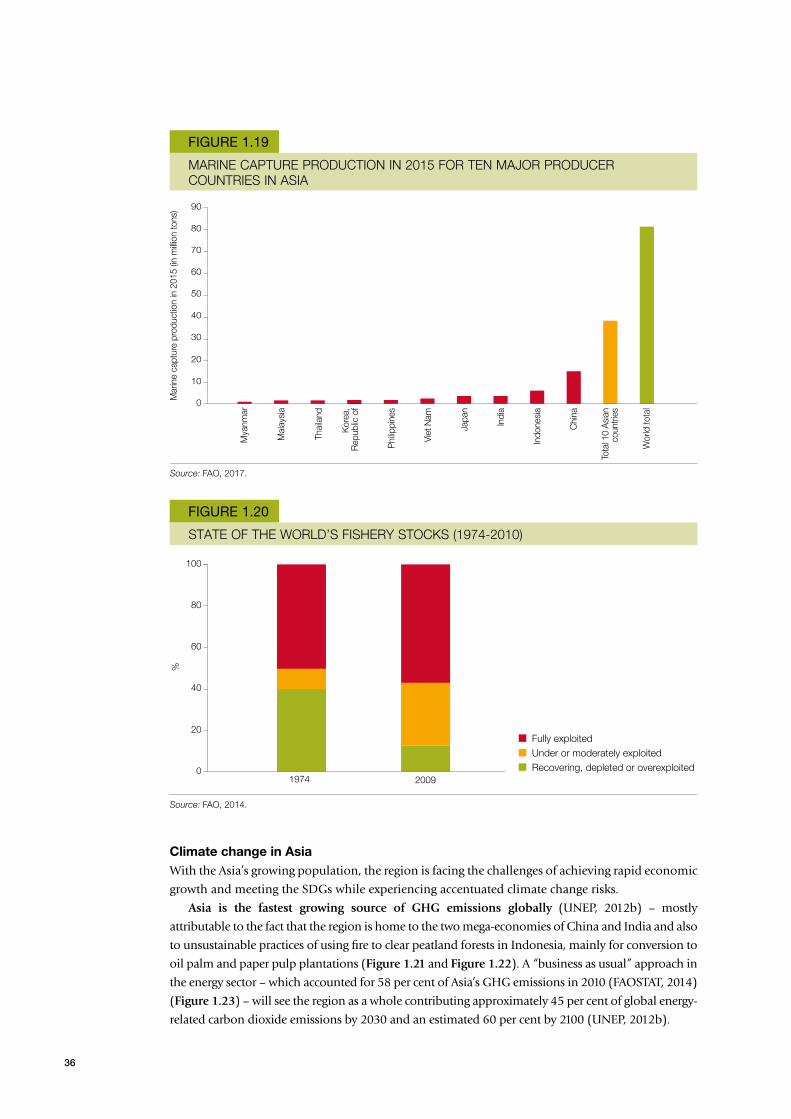
36
Source: FAO, 2017.
MARINE CAPTURE PRODUCTION IN 2015 FOR TEN MAJOR PRODUCER COUNTRIES IN ASIA
FIGURE 1.19
Mar
ine
capt
ure
prod
uctio
n in
201
5 (in
milli
on to
ns)
Mya
nmar
Mal
aysi
a
Thai
land
Kor
ea,
Rep
ublic
of
Phi
lippi
nes
Viet
Nam
Japa
n
Indi
a
Indo
nesi
a
Chi
na
Tota
l 10
Asia
n co
untri
es
Wor
ld to
tal
20
30
40
50
60
70
80
90
10
0
%
STATE OF THE WORLD’S FISHERY STOCKS (1974-2010)
FIGURE 1.20
20
40
60
80
100
0
Source: FAO, 2014.
1974 2009
Fully exploitedUnder or moderately exploitedRecovering, depleted or overexploited
Climate change in AsiaWith the Asia’s growing population, the region is facing the challenges of achieving rapid economic
growth and meeting the SDGs while experiencing accentuated climate change risks.
Asia is the fastest growing source of GHG emissions globally (UNEP, 2012b) – mostly
attributable to the fact that the region is home to the two mega-economies of China and India and also
to unsustainable practices of using fire to clear peatland forests in Indonesia, mainly for conversion to
oil palm and paper pulp plantations (Figure 1.21 and Figure 1.22). A “business as usual” approach in
the energy sector – which accounted for 58 per cent of Asia’s GHG emissions in 2010 (FAOSTAT, 2014)
(Figure 1.23) – will see the region as a whole contributing approximately 45 per cent of global energy-
related carbon dioxide emissions by 2030 and an estimated 60 per cent by 2100 (UNEP, 2012b).

37
Evidence accumulated over the past century is pointing to warming trends, increasing
temperature extremes, changing rainfall patterns, rising sea level, and intensifying natural hazards
and disasters which have been observed across most of the region (Hijioka et al., 2014; Nurse et al.,
2014). By 2030, Asia is projected to experience a regional temperature increase of around 0.5-2° C
in addition to a global sea level rise of approximately 3-16 centimetres, and potentially more intense
tropical cyclones and changes in climate variability, such as El Niño-Southern Oscillation (AASA,
2012) (Table 1.14). These trends make climate change the foremost threat to Asia’s sustainable
development. Climate change impacts tend to reinforce existing inequalities, disrupt the social
fabric of cities and exacerbate poverty, as they will have different weights across regions and cities,
sectors of the economy and socio-economic groups (Hijioka et al., 2014; Nurse et al., 2014).
Asia has the highest number of reported weather- and climate-related disasters or
extreme events12 in the world (Hijioka et al., 2014), encompassing 6 of the 10 countries most
affected by increasing weather events globally (Kreft et al., 2017) (Table 1.15) and having
experienced 7 out of the 10 worst natural disasters of the twenty-first century (Alcántara-Ayala
et al., 2015). The impacts of such disasters range from food insecurity and malnutrition to
loss of human lives, income or livelihoods as well as increased susceptibility to diseases in
vulnerable groups, such as diarrhoeal diseases, dengue fever and malaria (Hijioka et al., 2014;
UNEP, 2016). Asia is the region where the most people have been killed or affected by natural
disasters, accounting for 57 per cent of total fatalities (over 2 million) and 88 per cent of total
affected people (over 2 billion) since 1970 (UNESCAP, 2015). The region accounts for 6 of the
top 10 countries with the highest disaster-related fatalities, all of which, excluding China, are
low-income countries (CRED and UNISDR, 2015).
12. Such as heat waves, tropical cyclones, prolonged droughts, intense rainfall and floods, snow avalanches, landslides and severe dust storms.
TOP 10 EMITTERS BASED ON THEIR TOTAL ANNUAL GHG EMISSIONS IN 2011
FIGURE 1.21
Source: World Research Institute, Data Beta (2017). Note: EU, European Union.
GtC
O2,
201
1
2
4
6
8
12
10
0
Japa
n
EU (2
8)
Indi
a
Can
ada
Mex
ico
Chi
na
US
A
Rus
sia
Bra
sil
Indo
nesi
a
Total GHG emissions excluding LUCF
Total GHG emissions including LUCF
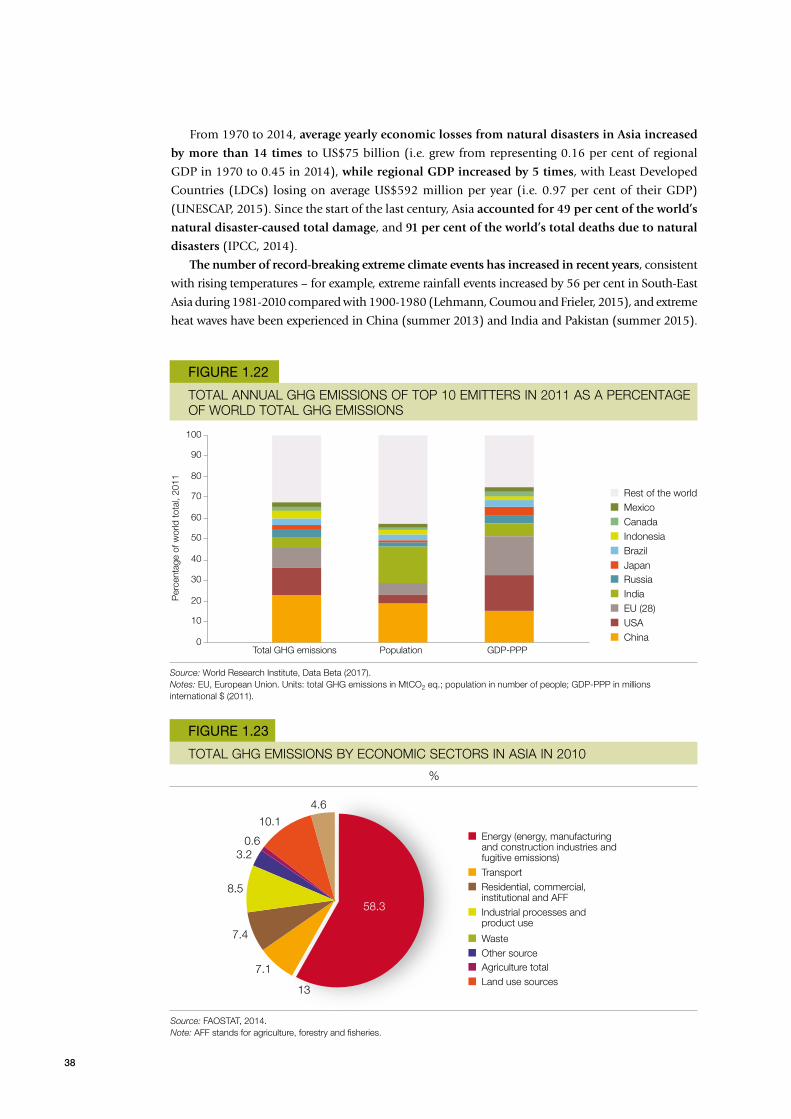
38
From 1970 to 2014, average yearly economic losses from natural disasters in Asia increased
by more than 14 times to US$75 billion (i.e. grew from representing 0.16 per cent of regional
GDP in 1970 to 0.45 in 2014), while regional GDP increased by 5 times, with Least Developed
Countries (LDCs) losing on average US$592 million per year (i.e. 0.97 per cent of their GDP)
(UNESCAP, 2015). Since the start of the last century, Asia accounted for 49 per cent of the world’s
natural disaster-caused total damage, and 91 per cent of the world’s total deaths due to natural
disasters (IPCC, 2014).
The number of record-breaking extreme climate events has increased in recent years, consistent
with rising temperatures – for example, extreme rainfall events increased by 56 per cent in South-East
Asia during 1981-2010 compared with 1900-1980 (Lehmann, Coumou and Frieler, 2015), and extreme
heat waves have been experienced in China (summer 2013) and India and Pakistan (summer 2015).
TOTAL GHG EMISSIONS BY ECONOMIC SECTORS IN ASIA IN 2010
FIGURE 1.23
%
Source: FAOSTAT, 2014.Note: AFF stands for agriculture, forestry and fisheries.
13
7.1
7.4
8.5
3.20.6
10.1
4.6
58.3
TransportResidential, commercial, institutional and AFFIndustrial processes and product use
WasteOther sourceAgriculture totalLand use sources
Energy (energy, manufacturing and construction industries and fugitive emissions)
Per
cent
age
of w
orld
tota
l, 20
11
TOTAL ANNUAL GHG EMISSIONS OF TOP 10 EMITTERS IN 2011 AS A PERCENTAGE OF WORLD TOTAL GHG EMISSIONS
FIGURE 1.22
20
40
60
80
100
0
30
50
70
90
10
Source: World Research Institute, Data Beta (2017).Notes: EU, European Union. Units: total GHG emissions in MtCO2 eq.; population in number of people; GDP-PPP in millions international $ (2011).
Total GHG emissions Population GDP-PPP
MexicoCanadaIndonesiaBrazilJapanRussiaIndiaEU (28)USAChina
Rest of the world

39
TABLE 1.14
KEY CLIMATE TRENDS AND VARIABILITY IN ASIA
East Asia
South Asia
South-East Asia
Warming during last 50 years, more pronounced in winter than summer; rate of increase more pronounced in minimum than maximum temperature
About 1.0°C rise in twentieth century; 2° C to 3° C rise in large cities
0.23° C rise in annual mean temperature per decade; increase in diurnal range
0.68° C increase per century; increasing trends in annual mean temperature; warming more pronounced post monsoon and during winter
0.09° C rise per year in the Himalayas and 0.04° C rise in the Terai region; greater in winter
0.6° C to 1.0° C rise in mean temperature in coastal areas since the early 1900s
An increase trend of about 1.0° C in May and 0.5° C in November during the 14-year period from 1985 to 1998
0.016° C increase per year between 1961 to 1990 over the entire country; 2° C increase per year in Central Highlands
0.1° C to 0.3° C increase per decade reported between 1951 to 2000
Homogeneous temperature data were not available
Increase in mean annual, maximum and minimum temperatures by 0.14° C between 1971 to 2000
Annual rainfall declined in past decade in north-east and north China and increased in western China, Changjiang River and along the south-east coast
No significant trend in the twentieth century, although fluctuations increased
More frequent heavy rain in recent years
Increase in extreme rains in the north-west during the summer monsoon in recent decades; lower number of rainy days along the east coast
No distinct long-term trends in precipitation records for 1948 to 1994
10 to 15 per cent decrease in coastal belt and hyper-arid plains; increase in summer and winter precipitation over the last 40 years in northern Pakistan
Decadal rain anomalies above long-term averages since 1960s
Increase trend in February and decrease trend in June
Decreasing trend between 1961 and 1998. Number of rainy days has declined throughout South-East Asia
Decline in rainfall in southern region and increase in northern region
Increase in annual mean rainfall since the 1980s and in number of rainy days since the 1900s; increase in inter-annual variability of onset rainfall
Hurricanes and typhoons are migrating from the tropics towards the poles, and storms are peaking at
higher latitudes compared with 30 years ago, especially in the Pacific Ocean and southern Indian
Ocean. Analyses of these observed extreme events and simulations indicated that human-caused
climate change has increased the likelihood of such events happening, and that these events are
projected to increase in frequency and intensity (Kossin, Emanuel and Vecchi, 2014).
The impacts of natural disasters are likely to increase with the increase in population, change in
settlement patterns, and rapid and unplanned urbanization, influencing vulnerability and exposure
to climate extremes, as well as climate variability affecting extreme food price fluctuations, financial
shocks and weak governance systems (Alcántara-Ayala et al., 2015). Asia’s urban and peri-urban
vulnerability and exposure to climate change has increased owing to the region’s rapid urban growth.
For example, more than 90 per cent of Asia’s population is exposed to tropical cyclones (IPCC, 2012).
Industrial and agricultural production as well as infrastructures are directly affected (Hijioka et al., 2014).
Region Country Change in temperature Change in precipitation
China
Japan
Republic of Korea
India
Nepal
Pakistan
Bangladesh
Sri Lanka
General
Indonesia
Philippines
Source: IPCC, 2007; UNESCAP, 2009.

40
Disruption of basic services such as water supply, sanitation, energy provision and transportation
systems has implications for local economies and strips populations of their assets and livelihoods,
in some cases, leading to mass migration (UN-HABITAT, 2010). Projections have estimated
increasing vulnerability and exposure of highly urbanized coastal areas in countries such as China,
India and Thailand. By 2070, the largest populations exposed to coastal flooding are projected to be
in Guangzhou and Shanghai (China), Dhaka (Bangladesh), Mumbai and Kolkata (India), Yangon
(Myanmar), Bangkok (Thailand), and Ho Chi Minh City and Hai Phòng (Viet Nam) (Hanson et
al., 2011; UNEP, 2016).
Climate change is expected to adversely affect the sustainable development capabilities
of most Asian developing countries by aggravating pressures on natural resources and the
environment (Hijioka et al., 2014), such as the challenges already facing the freshwater resources
sector. About 90 per cent of disasters in Asia are water-related (hydrometeorological), including
floods, storm surges droughts and landslides (Figure 1.24 and Figure 1.25) causing 115,000
fatalities from 1970 to 2014, i.e. 54 per cent of total natural-disaster-related fatalities in the region
(UNESCAP, 2015). In 2013, over 17,000 people died from water-related disasters in the region,
accounting for 90 per cent of all water-related disaster deaths globally (CRED, 2014; ADB, 2016).
Asia is the global hotspot13 for water insecurity, with many countries in Asia experiencing
increasing water shortages due to climate change, negatively affecting national socio-economic,
agricultural and environmental conditions (ADB, 2016; IPCC, 2012). In many parts of Asia, climate
change combined with population growth, increasing demand arising from higher standards of
living, highly uneven water availability, decreasing water quality, lack of good management and
heavy economic dependence on agriculture could further worsen water security (UNESCAP, 2013;
Hijioka et al., 2014). Climate variability will affect watershed hydrology through reduced river
flows and replenishment of groundwater and increased flood and drought frequency, which will
in turn impact water availability (ADB, 2016). In 2050, an estimated 3.4 billion people could live
in water-stressed areas in Asia (Wiberg et al., 2017), with Afghanistan, China, India, Pakistan and
Singapore projected to have the lowest water availability per capita (ADB, 2016). Water demand
in Asia is projected to increase by 30-40 per cent by 2050 for agricultural, industry and domestic
sectors (Wiberg et al., 2017).
TABLE 1.15
LONG-TERM CLIMATE RISK INDEX (CRI) OF THE SIX ASIAN COUNTRIES MOST AFFECTED FROM 1996 TO 2015 (ANNUAL AVERAGES)
2
5
6
7
8
10
Myanmar 14.17 7 145 14.71 1 300.74 0.737 41
Philippines 21.33 861 1.00 2761.53 0.628 283
Bangladesh 25.00 679 0.48 2 283.38 0.732 185
Pakistan 30.50 504 0.32 3823.17 0.647 133
Viet Nam 31.33 339 0.41 2119.37 0.621 206
Thailand 34.83 140 0.22 7 574.62 1.004 136
CRI, 1996-2015
Source: Kreft et al., 2017.
Country CRI score Death toll
Deaths per 100 000 inhabitants
Total losses in millions US$ PPP
Total losses per uni GDP (%)
Number per event (total, 1996-2015)
13. Defined as areas or ecosystems with overlapping challenges of poor access to water and sanitation, deteriorating water quality, inadequate water availability and increased exposure to climate change and water-related disasters (UNESCAP, 2013).

41
Increasing water stress and heightened competition in cross-border river basins are likely to
lead to a rise in transboundary water conflicts, threatening social stability (Alexander and West,
2011; United Nations and ADB, 2012). Multi-decadal accelerating glacial mass loss and area losses
have been documented in the Hindu Kush Himalayan region, and this is projected to continue in the
upcoming decades, with the highest relative loss projected in the Mekong Basin (-39 to -68 per cent),
and the largest ice quantity loss in the Indus River Basin. Warmer temperatures will result in more
precipitation falling as rain, not snow, undermining ice sheet replenishment (Shrestha et al., 2015).
Shrinking glaciers in the Himalayas affect water, food and energy provision for nearly 4 billion
people in China and South and South-East Asia through variability of water availability and
increased natural hazard occurrence (e.g. glacial lake outburst floods). Extended periods of drought
will worsen this situation and raise tensions in the Tibetan Plateau and generally in Asia, as 10 of
the largest and longest rivers in the region originate in the Himalayas. China’s dam-building and
water-diverting projects remain a major concern for downstream neighbours, considering it holds
these rivers’ headwaters (Pomeranz et al., 2013).
In addition to the impact on freshwater resources, terrestrial ecosystems in the region
have been affected by climate change. Permanent shifts in precipitation and temperature
patterns have altered the phenology, growth rates and distributions of plant species as
well as permafrost degradation, resulting in changes in forest ecosystem structure and
functioning (FAO, 2010a; Hijioka et al., 2014). The increasing frequency of El Niño events
over recent decades and the associated dry periods have had a devastating impact on the
subregion’s forests, particularly in Myanmar, the Lao PDR and Viet Nam (Cruz et al., 2007).
AVERAGE YEARLY OCCURRENCE OF NATURAL DISASTER EVENTS IN ASIA AND THE PACIFIC BY CATEGORY,1970-2014
FIGURE 1.24
1970-1979 1980-1989 1990-1999 2000-2009 2010-2014 Total 1970-2014
50
150
200
250
300
400
0
350
450
500
Source: UNESCAP, 2015.
Hydro-meteorological eventsGeophysical eventsBiological events
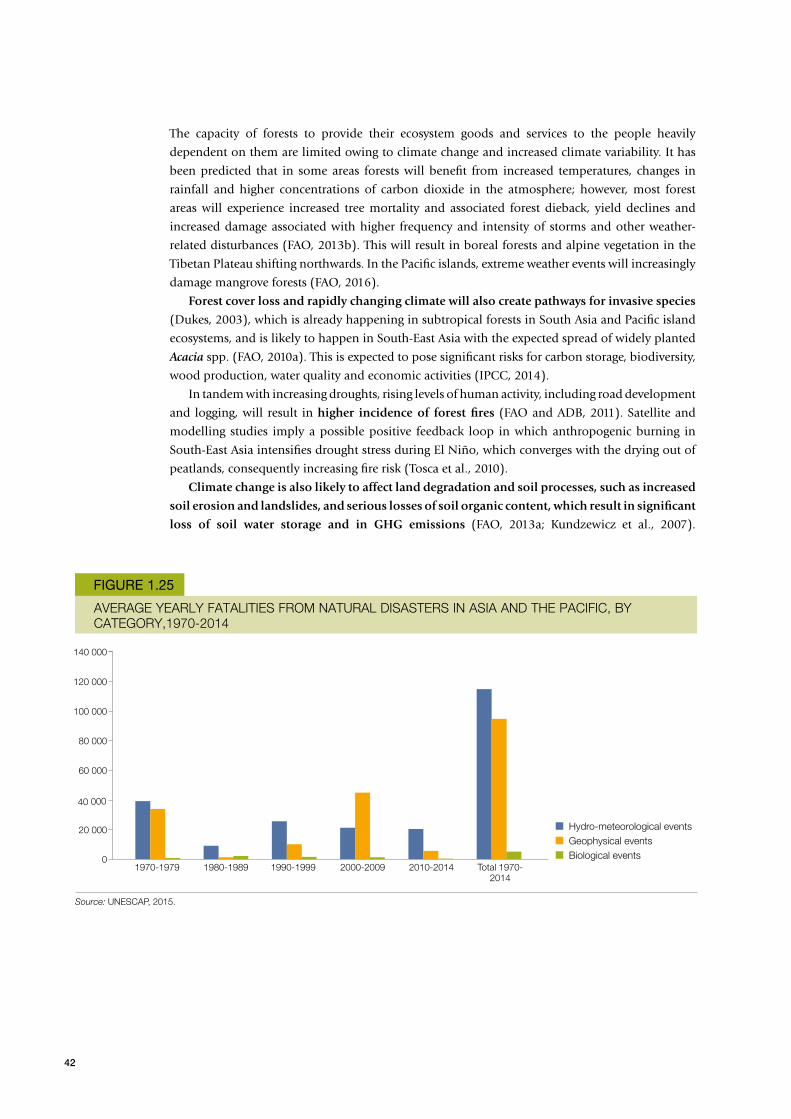
42
The capacity of forests to provide their ecosystem goods and services to the people heavily
dependent on them are limited owing to climate change and increased climate variability. It has
been predicted that in some areas forests will benefit from increased temperatures, changes in
rainfall and higher concentrations of carbon dioxide in the atmosphere; however, most forest
areas will experience increased tree mortality and associated forest dieback, yield declines and
increased damage associated with higher frequency and intensity of storms and other weather-
related disturbances (FAO, 2013b). This will result in boreal forests and alpine vegetation in the
Tibetan Plateau shifting northwards. In the Pacific islands, extreme weather events will increasingly
damage mangrove forests (FAO, 2016).
Forest cover loss and rapidly changing climate will also create pathways for invasive species
(Dukes, 2003), which is already happening in subtropical forests in South Asia and Pacific island
ecosystems, and is likely to happen in South-East Asia with the expected spread of widely planted
Acacia spp. (FAO, 2010a). This is expected to pose significant risks for carbon storage, biodiversity,
wood production, water quality and economic activities (IPCC, 2014).
In tandem with increasing droughts, rising levels of human activity, including road development
and logging, will result in higher incidence of forest fires (FAO and ADB, 2011). Satellite and
modelling studies imply a possible positive feedback loop in which anthropogenic burning in
South-East Asia intensifies drought stress during El Niño, which converges with the drying out of
peatlands, consequently increasing fire risk (Tosca et al., 2010).
Climate change is also likely to affect land degradation and soil processes, such as increased
soil erosion and landslides, and serious losses of soil organic content, which result in significant
loss of soil water storage and in GHG emissions (FAO, 2013a; Kundzewicz et al., 2007).
AVERAGE YEARLY FATALITIES FROM NATURAL DISASTERS IN ASIA AND THE PACIFIC, BY CATEGORY,1970-2014
FIGURE 1.25
1970-1979 1980-1989 1990-1999 2000-2009 2010-2014 Total 1970-2014
20 000
40 000
60 000
80 000
100 000
140 000
0
120 000
Source: UNESCAP, 2015.
Hydro-meteorological eventsGeophysical eventsBiological events
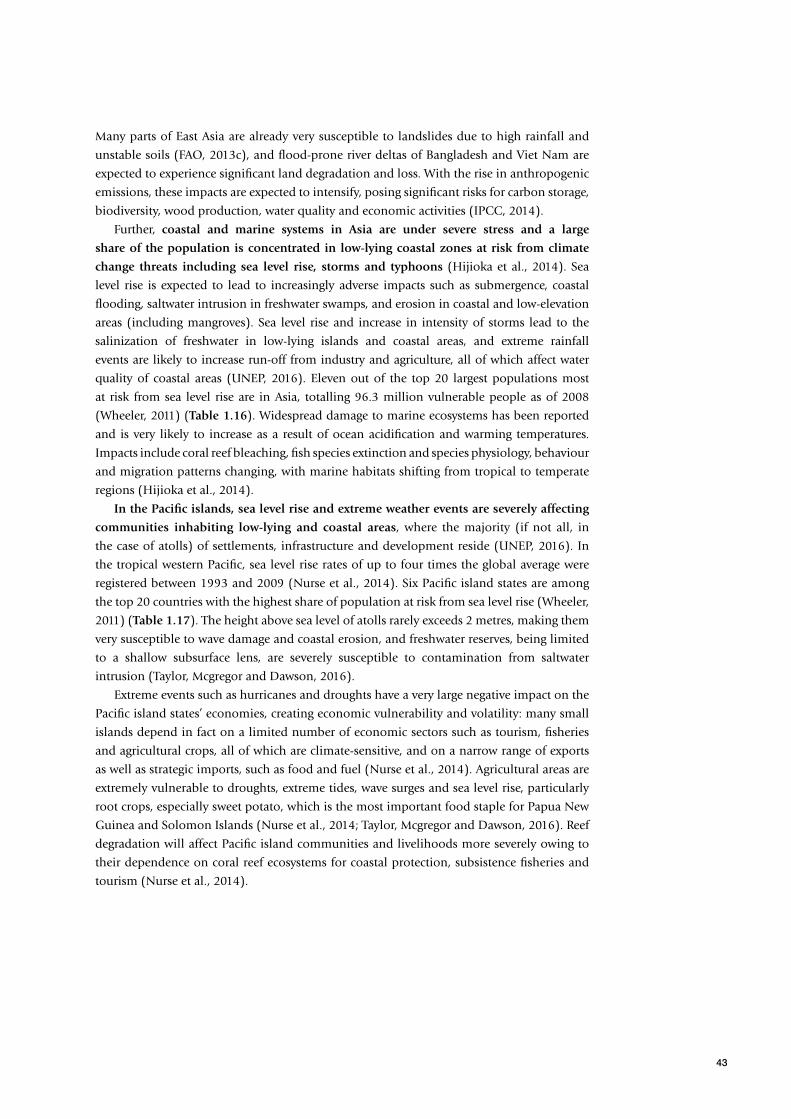
43
Many parts of East Asia are already very susceptible to landslides due to high rainfall and
unstable soils (FAO, 2013c), and flood-prone river deltas of Bangladesh and Viet Nam are
expected to experience significant land degradation and loss. With the rise in anthropogenic
emissions, these impacts are expected to intensify, posing significant risks for carbon storage,
biodiversity, wood production, water quality and economic activities (IPCC, 2014).
Further, coastal and marine systems in Asia are under severe stress and a large
share of the population is concentrated in low-lying coastal zones at risk from climate
change threats including sea level rise, storms and typhoons (Hijioka et al., 2014). Sea
level rise is expected to lead to increasingly adverse impacts such as submergence, coastal
flooding, saltwater intrusion in freshwater swamps, and erosion in coastal and low-elevation
areas (including mangroves). Sea level rise and increase in intensity of storms lead to the
salinization of freshwater in low-lying islands and coastal areas, and extreme rainfall
events are likely to increase run-off from industry and agriculture, all of which affect water
quality of coastal areas (UNEP, 2016). Eleven out of the top 20 largest populations most
at risk from sea level rise are in Asia, totalling 96.3 million vulnerable people as of 2008
(Wheeler, 2011) (Table 1.16). Widespread damage to marine ecosystems has been reported
and is very likely to increase as a result of ocean acidification and warming temperatures.
Impacts include coral reef bleaching, fish species extinction and species physiology, behaviour
and migration patterns changing, with marine habitats shifting from tropical to temperate
regions (Hijioka et al., 2014).
In the Pacific islands, sea level rise and extreme weather events are severely affecting
communities inhabiting low-lying and coastal areas, where the majority (if not all, in
the case of atolls) of settlements, infrastructure and development reside (UNEP, 2016). In
the tropical western Pacific, sea level rise rates of up to four times the global average were
registered between 1993 and 2009 (Nurse et al., 2014). Six Pacific island states are among
the top 20 countries with the highest share of population at risk from sea level rise (Wheeler,
2011) (Table 1.17). The height above sea level of atolls rarely exceeds 2 metres, making them
very susceptible to wave damage and coastal erosion, and freshwater reserves, being limited
to a shallow subsurface lens, are severely susceptible to contamination from saltwater
intrusion (Taylor, Mcgregor and Dawson, 2016).
Extreme events such as hurricanes and droughts have a very large negative impact on the
Pacific island states’ economies, creating economic vulnerability and volatility: many small
islands depend in fact on a limited number of economic sectors such as tourism, fisheries
and agricultural crops, all of which are climate-sensitive, and on a narrow range of exports
as well as strategic imports, such as food and fuel (Nurse et al., 2014). Agricultural areas are
extremely vulnerable to droughts, extreme tides, wave surges and sea level rise, particularly
root crops, especially sweet potato, which is the most important food staple for Papua New
Guinea and Solomon Islands (Nurse et al., 2014; Taylor, Mcgregor and Dawson, 2016). Reef
degradation will affect Pacific island communities and livelihoods more severely owing to
their dependence on coral reef ecosystems for coastal protection, subsistence fisheries and
tourism (Nurse et al., 2014).
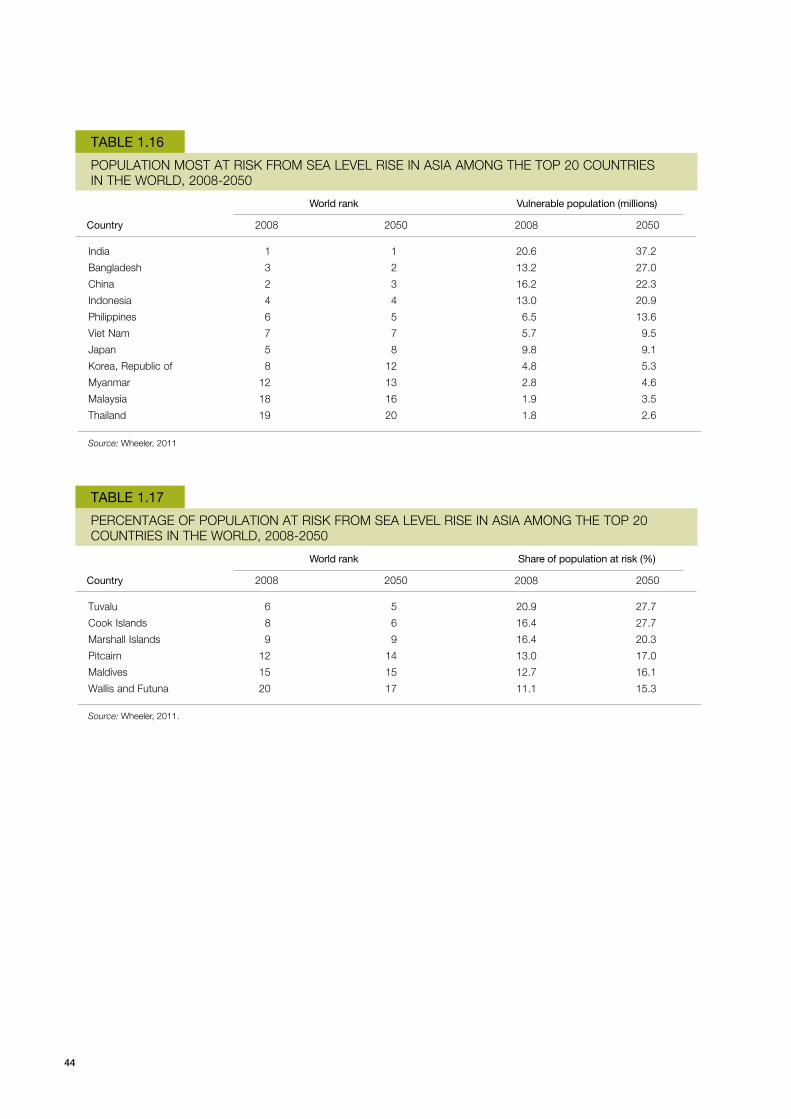
44
TABLE 1.16
POPULATION MOST AT RISK FROM SEA LEVEL RISE IN ASIA AMONG THE TOP 20 COUNTRIES IN THE WORLD, 2008-2050
Source: Wheeler, 2011
India
Bangladesh
China
Indonesia
Philippines
Viet Nam
Japan
Korea, Republic of
Myanmar
Malaysia
Thailand
1 1 20.6 37.2
3 2 13.2 27.0
2 3 16.2 22.3
4 4 13.0 20.9
6 5 6.5 13.6
7 7 5.7 9.5
5 8 9.8 9.1
8 12 4.8 5.3
12 13 2.8 4.6
18 16 1.9 3.5
19 20 1.8 2.6
Country
World rank Vulnerable population (millions)
2008 20082050 2050
TABLE 1.17
PERCENTAGE OF POPULATION AT RISK FROM SEA LEVEL RISE IN ASIA AMONG THE TOP 20 COUNTRIES IN THE WORLD, 2008-2050
Source: Wheeler, 2011.
Tuvalu
Cook Islands
Marshall Islands
Pitcairn
Maldives
Wallis and Futuna
6 5 20.9 27.7
8 6 16.4 27.7
9 9 16.4 20.3
12 14 13.0 17.0
15 15 12.7 16.1
20 17 11.1 15.3
Country
World rank Share of population at risk (%)
2008 20082050 2050

45
Annex: a note on regional and income-based classifications
This report focuses on developing countries in East, South and South-East Asia. Here,
“developing” refers to countries whose per capita incomes are classified as low, lower-middle or
upper-middle by the latest revisions of the World Bank. These income classifications rely on per
capita gross national income (GNI) calculations that use the World Bank’s Atlas method (World
Bank, 2017b).
• Low income: GNI per capita below US$1,005;
• Lower-middle income: GNI per capita between US$1,006 and US$3,955;
• Upper-middle income: GNI per capita between US$3,956 and US$12,235;
• High income: GNI per capita above US$12,236.
Regional classifications follow the guidelines set by the United Nations Statistical Division
(UNSD) (UNSD, 2017).
Based on these classifications of region and income, this publication focuses on the following
countries, whenever data are available.
• China
• Democratic People’s Republic of Korea (DPRK)
• Mongolia
• Afghanistan
• Bangladesh
• Bhutan
• India
• Iran
• Maldives
• Nepal
• Pakistan
• Sri Lanka
• Cambodia
• Indonesia
• Lao People’s Democratic Republic (Lao PDR)
• Malaysia
• Myanmar
• Philippines
• Thailand
• Timor-Leste
• Viet Nam
East Asia South Asia South-East Asia

46
Nepal

47
What do growth and structural transformation tell us about the rural economy?
Throughout developing Asia, the centre of economic gravity will continue to shift from agriculture
to industry and – even more so – services. Structural transformation is the fundamental process
that ties economic growth with human development, both of which have been impressive by
historical standards in Asia, as reviewed in chapter 1. Structural transformation entails two
important economic processes. The first is within-sector improvements in factor productivity, most
commonly through the adoption of new technologies, the upgrading of human capital, education
and infrastructural improvement. The second process is the movement of factors of production
(e.g. land, labour and capital) from relatively low-productivity sectors (such as agriculture) to
higher-productivity sectors – in other words, a more efficient reallocation of resources towards
high-output activities, often through key institutional reforms, increased openness to trade and
financial integration. Inherent in both of these processes is a set of profound changes in the
geography and demography of Asia’s populations, which are steadily urbanizing and ageing.
This section provides a broad picture of what structural transformation in Asia means for
rapid poverty reduction among the region’s agricultural population – in other words, the majority
of rural people and of the extreme poor. While the structural transformation process in Asia
remains tilted towards lower-productivity services sectors rather than industry and manufacturing,
contrasting with the past experience of industrialized countries, sustained poverty reduction in
rural areas points to a new mix of agricultural and non-agricultural activities in rural areas. The
vitality of the rural non-farm economy (RNFE) is itself indicative of the emergence of a complex
new set of activities and opportunities for rural people in Asia.
AGRICULTURE, STRUCTURAL TRANSFORMATION AND THE GROWING IMPORTANCE OF THE AGRIFOOD SECTOR
KEY MESSAGES
The growth and structural transformation process has profoundly affected poverty reduction and human
development in Asia: rather than being a direct driver of poverty reduction, agricultural productivity growth
exists as one option out of many for rural people in the context of a growing and vibrant non-farm economy.
Agricultural transformation in Asia is a complex, multi-causal process that has its roots in rising incomes
and the changing nature of demand for agricultural products. It entails significant changes in the structure
of agricultural input and output, the commercialization of products through emerging value chains, and the
integration of production and retail at the national and international levels.
The development of the rural non-farm sector is an integral part of the agricultural and structural
transformation process. Non-agricultural growth in rural areas still shares an important relationship
with agricultural productivity through upstream and downstream linkages between agriculture, services
and manufacturing.
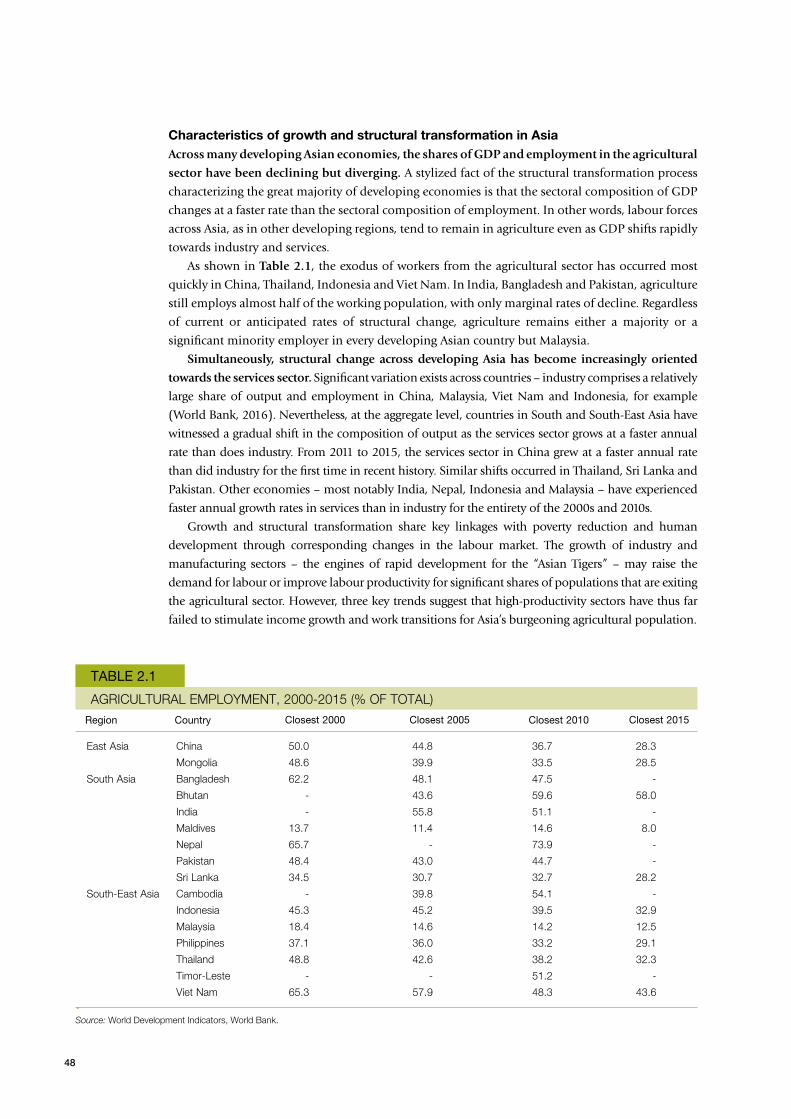
48
Characteristics of growth and structural transformation in AsiaAcross many developing Asian economies, the shares of GDP and employment in the agricultural
sector have been declining but diverging. A stylized fact of the structural transformation process
characterizing the great majority of developing economies is that the sectoral composition of GDP
changes at a faster rate than the sectoral composition of employment. In other words, labour forces
across Asia, as in other developing regions, tend to remain in agriculture even as GDP shifts rapidly
towards industry and services.
As shown in Table 2.1, the exodus of workers from the agricultural sector has occurred most
quickly in China, Thailand, Indonesia and Viet Nam. In India, Bangladesh and Pakistan, agriculture
still employs almost half of the working population, with only marginal rates of decline. Regardless
of current or anticipated rates of structural change, agriculture remains either a majority or a
significant minority employer in every developing Asian country but Malaysia.
Simultaneously, structural change across developing Asia has become increasingly oriented
towards the services sector. Significant variation exists across countries – industry comprises a relatively
large share of output and employment in China, Malaysia, Viet Nam and Indonesia, for example
(World Bank, 2016). Nevertheless, at the aggregate level, countries in South and South-East Asia have
witnessed a gradual shift in the composition of output as the services sector grows at a faster annual
rate than does industry. From 2011 to 2015, the services sector in China grew at a faster annual rate
than did industry for the first time in recent history. Similar shifts occurred in Thailand, Sri Lanka and
Pakistan. Other economies – most notably India, Nepal, Indonesia and Malaysia – have experienced
faster annual growth rates in services than in industry for the entirety of the 2000s and 2010s.
Growth and structural transformation share key linkages with poverty reduction and human
development through corresponding changes in the labour market. The growth of industry and
manufacturing sectors – the engines of rapid development for the “Asian Tigers” – may raise the
demand for labour or improve labour productivity for significant shares of populations that are exiting
the agricultural sector. However, three key trends suggest that high-productivity sectors have thus far
failed to stimulate income growth and work transitions for Asia’s burgeoning agricultural population.
TABLE 2.1
AGRICULTURAL EMPLOYMENT, 2000-2015 (% OF TOTAL)
Source: World Development Indicators, World Bank.
China
Mongolia
Bangladesh
Bhutan
India
Maldives
Nepal
Pakistan
Sri Lanka
Cambodia
Indonesia
Malaysia
Philippines
Thailand
Timor-Leste
Viet Nam
East Asia
South Asia
South-East Asia
50.0 44.8 36.7 28.3
48.6 39.9 33.5 28.5
62.2 48.1 47.5 -
- 43.6 59.6 58.0
- 55.8 51.1 -
13.7 11.4 14.6 8.0
65.7 - 73.9 -
48.4 43.0 44.7 -
34.5 30.7 32.7 28.2
- 39.8 54.1 -
45.3 45.2 39.5 32.9
18.4 14.6 14.2 12.5
37.1 36.0 33.2 29.1
48.8 42.6 38.2 32.3
- - 51.2 -
65.3 57.9 48.3 43.6
CountryRegion Closest 2000 Closest 2010Closest 2005 Closest 2015

49
SHARES OF AGRICULTURE IN TOTAL GDP AND EMPLOYMENT AGAINST PER CAPITA INCOME, ASIAN COUNTRIES, 1994-2013
FIGURE 2.1
%
Note: ag., agriculture.
-60
-80
-40
-20
0
20
40
60
80
100
-100
Share of ag. in employment, 5 year averages 1994 - 2013Share of ag. value added in GDP, 5 year averages 1994 - 2013Share of ag. value added in GDP-Share of ag. in employment
2.90 3.10 3.30 3.70 3.90 4.103.50 4.30 4.50
First, the divergence between the shares of agriculture in output and employment suggests
that labour productivity is rising faster in non-agricultural sectors than in agriculture. The most
important implication of the divergence between agriculture as an employer and agriculture as a
share of GDP is a widening gap in the ratio of non-agricultural to agricultural labour productivity.
This gap has increased in almost every developing Asian economy.14 For example, by 2011-2013,
non-agricultural workers were more productive than agricultural ones by a factor of 5.1 in China, 4.9
in Bangladesh, 4 in India, 3.7 in Indonesia, 3.6 in the Philippines and 3.8 in Viet Nam. In a country
without any sectoral disparities in labour productivity, workers across all sectors are paid the value
of their marginal product, and firms hire up to the point at which the marginal product of labour
is equal to the wages that they receive. A gap in labour productivity between agriculture and non-
agriculture thus reflects the extent to which surplus labour in the agricultural sector has not been
reallocated in accordance with the relative growth of non-agricultural output (UNESCAP, 2016).
Second, aggregate labour productivity has been increasing in developing Asian economies
at a much faster rate than the world average, but most of this growth is mainly due to within-
sector improvements. Data compiled by the United Nations Economic and Social Commission for
Asia and the Pacific (UNESCAP) show that, between 2000 and 2013, low-income, lower-middle-
income and upper-middle-income Asian countries experienced average labour productivity growth
rates of 4.1, 4.4 and 7.2 per cent respectively.15 These rates stand high above the averages for the
world (1.2 per cent), Africa (1.5 per cent) and Latin America and the Caribbean (0.9 per cent)
during the same time period. However, a decomposition of aggregate labour productivity growth,
as shown in Table 2.3, reveals that in almost every developing Asian economy the within-sector
productivity growth effects vastly outweighed the effects of the reallocation of labour from one
sector to another (UNESCAP, 2016). In other words, technological improvements and increased
capital intensity are driving economy-wide productivity growth more than the reallocation of
workers from low-productivity sectors to higher-productivity sectors.
14. With the exceptions of Cambodia and Thailand.15. However, some of these aggregate measures contain countries that are located in Western and Central Asia, according
to United Nations region classifications.

50
TABLE 2.2
AVERAGE ANNUAL GROWTH RATES IN INDUSTRY AND SERVICES, 2000-2015 (%)
Source: World Bank, 2016.
China
Mongolia
Bangladesh
Bhutan
India
Maldives
Nepal
Pakistan
Sri Lanka
Cambodia
Indonesia
Lao PDR
Malaysia
Myanmar
Philippines
Thailand
Viet Nam
East Asia
South Asia
South-East Asia
9.1 8.4 9.4 9.0 5.9 6.4
5.8 6.6 2.0 7.3 10.2 5.3
5.4 4.2 6.0 4.5 7.3 4.7
6.3 8.3 11.7 7.1 4.5 3.7
6.8 7.4 6.1 8.7 4.6 7.0
12.0 3.3 0.7 6.5 4.5 2.7
1.7 2.0 1.8 4.7 2.8 4.2
6.9 4.9 2.8 3.0 2.5 3.6
3.7 5.3 5.2 4.8 3.9 5.1
11.5 7.8 3.0 4.7 8.3 6.4
3.3 5.3 3.4 6.3 3.4 4.9
9.6 5.6 10.7 5.7 6.9 6.7
4.3 5.4 (0.4) 7.2 4.0 4.9
18.9 11.2 17.7 8.9 8.0 8.0
3.3 4.7 3.9 4.4 6.1 5.4
5.9 4.3 3.4 2.6 2.3 3.5
6.9 1.3 2.8 5.7 5.2
CountryRegion
2011-2015
Services
2006-2010
Industry
2001-2005
Services ServicesIndustry Industry
Third, at the country level, changes in employment have become less responsive to increases in
the growth of industry and services. A simple and effective method of observing this trend involves
employment elasticities to economic growth across a panel of developing economies in East, South
and South-East Asia (Imai, Gaiha and Breciani, 2016). These coefficients estimate the percentage
change in total employment given a 1 per cent increase in the output of a given sector.
At the aggregate level, the employment elasticity of agriculture improved during the period
2000 to 2012 while the elasticity for non-agricultural sectors (in other words, industry and services)
decreased to the extent that it was negative. These trends suggest that industry and services sectors
across developing Asia may be relying more and more on labour-saving technologies, while the
prospects of the agricultural sector for absorbing labour during the growth process remain relatively
unchanged. Correspondingly, the share of labour income in industry and manufacturing value
added has declined consistently since the mid-1990s (Zhuang, Kanbur and Rhee, 2014).
Structural transformation and rural non-farm employment in Asia todayThese trends paint a broad but compelling picture of how agricultural labour markets fit into the
structural transformation process across low- and middle-income Asian countries. At the country
level, the non-agricultural sectors are becoming more capital-intensive, and their capacity to generate
employment in response to growth is decreasing; as a result, growth in the non-farm economy in
many Asian countries is increasingly unable to absorb surplus agricultural (and implicitly rural)
labour to an extent that would allow equalization of productivity rates across sectors. Agricultural
labour productivity continues to diverge from labour productivity in industry and services,
reconverging only in countries that are past the upper-middle-income stage of development. Many
lower-middle-income Asian countries therefore remain majority-rural, contradicting trends in fast
urbanization and industrial growth that defined the “Asian Tigers” of the twentieth century.

51
TABLE 2.3
DECOMPOSITION OF AGGREGATE LABOUR PRODUCTIVITY GROWTH IN SELECTED ASIAN COUNTRIES BETWEEN 1990s AND 2000s (LATEST YEAR)
Within-sector effect
Reallocation- level effect
Reallocation growth effect
Source: UNESCAP, 2016.Note: According to the UNESCAP (2016) analysis:
Decomposition of aggregate labour productivity growth is based on the traditional decomposition formula (TRAD method). Output is valued at constant prices, 2005, at the production price. Labour productivity is measured as the ratio of GDP at production prices, 2005 constant prices, and the total number of employed persons. Within-sector effect measures the contribution to aggregate productivity growth due solely to productivity increases experienced within individual sectors. Reallocation level effect measures the contribution to productivity growth due to labour movements from sectors with below-average productivity levels to sectors with above-average labour productivity levels, the sector labour productivity level being constant. Reallocation growth effect measures the contribution to labour productivity growth due to labour movements towards sectors with positive labour productivity growth (or away from sectors with negative labour productivity growth).
Bangladesh
China
India
Indonesia
Malaysia
Mongolia
Nepal
Pakistan
Philippines
Sri Lanka
Thailand
105.24 (0.22) (5.02) 2.52 15.94
179.67 (13.03) (66.64) 1.09 86.37
75.28 11.66 13.06 5.64 27.50
53.75 36.76 9.49 4.61 42.66
89.79 2.93 7.28 (3.31) 29.79
96.91 0.54 2.55 (12.67) 41.45
48.23 168.33 (116.56) 1.17 27.06
77.88 19.18 2.94 9.86 36.09
64.61 31.02 4.37 0.76 24.90
85.09 8.38 6.53 3.87 32.83
38.79 52.76 8.45 4.10 42.97
Country Agriculture Industry
In and of itself, the persistence of low-productivity agricultural work in Asia relative to
manufacturing and services should be a signal of persistent rural poverty. As shown in the previous
chapter, however, extreme rural poverty rates across Asia have declined at an accelerated pace and
continue to do so. The dynamics of employment in the rural non-farm sector help us to understand
this apparent paradox. Recent cross-country data on rural employment patterns are difficult to
collect and to compare across countries. Nevertheless, a comprehensive dataset assembled during
the early 2000s (the RIGA dataset) shows that, among five developing Asian countries, non-farm
production had already been an important, if not dominant, source of income of rural households
for some time. In three countries (Bangladesh, Pakistan and Indonesia) the majority share of
income is from non-farm sources; in a fourth (Nepal), half of income is from non-farm sources.
Among the non-agricultural sources, wage employment accounts for a similar share of income to
transfers and others (20 per cent), whereas self-employment is a smaller contributor.16
TABLE 2.4
PROSPECTS OF ABSORPTION OF GROWTH OF RURAL LABOUR FORCE IN MANUFACTURING AND SERVICES, AND OTHER ACTIVITIES
Agriculture (βA)Industry and services (βN)
0.1 0.161 0.19
(0.035) 0.005 (0.073)
Sector 1990-2012 2000-20121990-2000
Source: Imai, Gaiha and Bresciani, 2016.
16. For a more detailed analysis, see the background study by Imai, Malaeb and Bresciani (2016).
52
More recent surveys also confirm that non-farm employment (RNFE) has comprised an
increasingly high share of rural employment and income across most of Asia. A comprehensive
study (Davis et al., 2009) finds that income from the RNFE is 40 per cent of total rural incomes and
migration income is an additional 11 per cent, so that, combined, these two add up to 51 per cent
of total rural income. RNFE activities tend to be mainly in services (commerce/transport, repairs or
tailoring, and construction) and about one quarter to one third in manufacturing. Returns typically
vary widely across these activities. Casual wage jobs and self-employment (in microenterprises)
have low returns while salaried employment normally offers high returns (Briones, 2016).
There is also a gendered dimension to employment in the non-farm economy. In 2009,
48.2 per cent of female workers were in agriculture, compared with only 38.9 per cent of male
workers (ILO and ADB, 2011). Shares over time are available for rural areas of the state of
Maharashtra in India. The share of female workers in non-farm employment is declining slightly
over time; that of men, however, is rising, together with the overall share of non-farm employment
for both sexes. Female workers show much lower participation rates in non-farm employment;
they are concentrated in manufacturing, trade and other services. Employment shares of females
for these sectors are rising over time, excluding manufacturing. Male workers, in contrast, exhibit
higher shares than female workers for transport and communication (Briones, 2016).
Why do so few standardized surveys of rural non-farm economic activity exist across Asia?
Enterprise-level data for rural areas suggest that a large share of non-farm work is informal in
nature and local in scope. Rural small and medium-sized enterprises (SMEs) share many of the
characteristics of urban SMEs. By 2009, more than 30 per cent of all non-agricultural workers were
self-employed in Bangladesh, Indonesia, India, Pakistan, the Philippines and Thailand; of these,
more than 90 per cent were own-account workers, i.e. worked in their own or a family-owned
enterprise, most probably a microenterprise. Across very diverse economic contexts (Sri Lanka,
Pakistan and Indonesia), some patterns emerge among rural enterprise indicators. One is average
firm size (two to three workers); an overwhelming majority are microenterprises (80 per cent have
no more than two workers); and the majority are engaged in services and trade (60 to 90 per cent)
(for further details, see Briones, 2016). For rural Indonesia, only 2.1 per cent of enterprises are
registered; given that the bulk are in trade and services, it is easy to see why close to 80 per cent are
supplied within the same subdistrict (Kecamatan). Even for enterprises involved in production,
the products of 75 per cent are consumed in the same district (Kabupaten) (Deininger, Jin and Sur,
2007; Sur, Zhang and Chen, 2014; World Bank, 2006).
These sources of information are far from comprehensive: the informality of rural services and
industry acts as a barrier to consistent data collection, particularly across countries. But independent
surveys have thus far provided an important piece of the puzzle as to why rural poverty reduction
has persisted alongside a lag in agricultural income growth and relatively slow urbanization rates.
The agricultural sector is but one of many sources of income for rural people in Asia. Its importance
to rural households – particularly those that own smaller parcels of land – may be decreasing over
time. To understand how agriculture across Asia is modernizing and adapting to new opportunities
and constraints, it must be viewed in the context of an integrated rural economy among other
competing income sources for the rural poor.
53
The growing importance of the agrifood sector
The decline of agriculture as a source of income and as a share of national output is well-recorded,
if not consistently, across countries and time periods. Nevertheless, agriculture remains a vital force
for rural people, national markets and international trade. In Asia more than in other regions of
the world, agricultural production over the long term has grown at impressive rates. Between 1970
and 2014, real global value added in the agriculture, forestry and fisheries (AFF) sector rose from
US$0.7 trillion to US$1.9 trillion (constant 2005 US$). In 1970, the main contributors to global
AFF value added were Asia and the Pacific (34.9 per cent) and Europe (27.2 per cent), with the Other
Developed region17 closing in on the leading trio with a contribution of 12.3 per cent. By 2014, Asia
and the Pacific contributed 49.3 per cent of the sector’s global value added, while the shares for
Europe and the Other Developed region had fallen to 15.9 and 4.6 per cent respectively (FAO, 2017).
Fundamental changes to agricultural production and smallholders’ livelihoods drive this
impressive growth, particularly in middle-income Asian countries. Known as agricultural
transformation, this growth process is easy to observe on the ground. However, it is difficult to
offer a comprehensive definition for what it entails because patterns of production, input use,
market interaction and trade share complex and multidirectional relationships with one another.
This report defines agricultural transformation as a series of fundamental changes in agricultural
production and the livelihoods of rural people that can be observed through three key lenses:
1. changes in the structure of agricultural input use and in technology, and corresponding
changes in output;
2. changes in the commercialization of agricultural input and output markets – in other
words, the integration of agriculture into modern value chains;
3. changes in agricultural trade, openness and the integration of domestic value chains into
international markets.
This next section offers a brief glimpse at how these three sets of changes have played out across
Asia over the past several decades.
A prelude: structural changes in the demand for food across AsiaOne of the most important drivers of the three sets of changes mentioned above is the rapidly
shifting set of demands levied upon Asia’s agricultural sector. Across many middle-income
Asian countries, urbanization and rising incomes have completely transformed the kinds of
foods that consumers demand as well as they ways in which they prefer to buy it. At the heart
of the commercialization of Asian agriculture is a movement away from the consumption of
cereals towards higher-value food products. Between 1990 and 2013, the total per capita daily
food supplies (measured in kilocalories) across China, South Asia and South-East Asia rose by 65,
44 and 22 per cent respectively. During the same time period, per capita consumption of animal
products across these areas rose by 156, 90 and 46 per cent, and that of fruits and vegetables rose
by 260, 68 and 68 per cent. Meanwhile, per capita consumption of cereals fell slightly in China
and South Asia, rising slightly in only South-East Asia (FAO, 2017).
Cereals have thus been falling as a share of total food consumption, while animal fats, vegetable
oils and sugars are now becoming a growing component of the Asian diet. Integral to these changes
are improved purchasing power and a wider variety of options for in- and out-of-home consumption.
17. The Other Developed region comprises Australia, Japan and New Zealand.
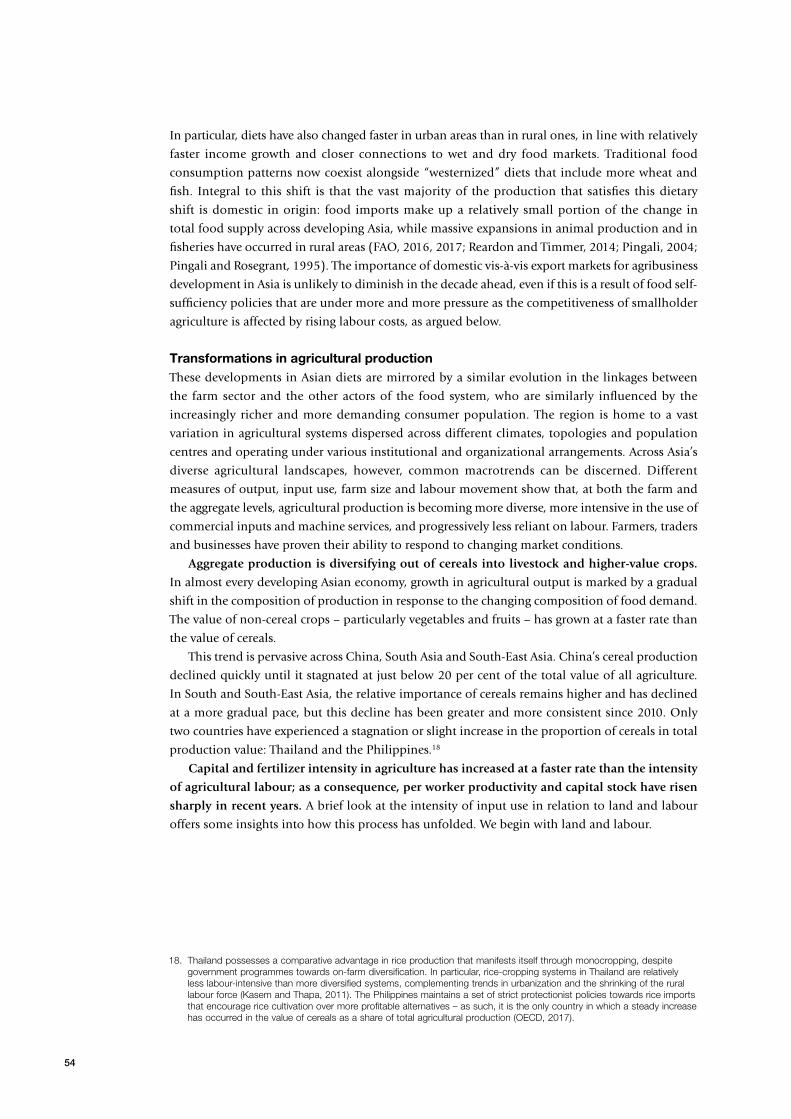
54
In particular, diets have also changed faster in urban areas than in rural ones, in line with relatively
faster income growth and closer connections to wet and dry food markets. Traditional food
consumption patterns now coexist alongside “westernized” diets that include more wheat and
fish. Integral to this shift is that the vast majority of the production that satisfies this dietary
shift is domestic in origin: food imports make up a relatively small portion of the change in
total food supply across developing Asia, while massive expansions in animal production and in
fisheries have occurred in rural areas (FAO, 2016, 2017; Reardon and Timmer, 2014; Pingali, 2004;
Pingali and Rosegrant, 1995). The importance of domestic vis-à-vis export markets for agribusiness
development in Asia is unlikely to diminish in the decade ahead, even if this is a result of food self-
sufficiency policies that are under more and more pressure as the competitiveness of smallholder
agriculture is affected by rising labour costs, as argued below.
Transformations in agricultural productionThese developments in Asian diets are mirrored by a similar evolution in the linkages between
the farm sector and the other actors of the food system, who are similarly influenced by the
increasingly richer and more demanding consumer population. The region is home to a vast
variation in agricultural systems dispersed across different climates, topologies and population
centres and operating under various institutional and organizational arrangements. Across Asia’s
diverse agricultural landscapes, however, common macrotrends can be discerned. Different
measures of output, input use, farm size and labour movement show that, at both the farm and
the aggregate levels, agricultural production is becoming more diverse, more intensive in the use of
commercial inputs and machine services, and progressively less reliant on labour. Farmers, traders
and businesses have proven their ability to respond to changing market conditions.
Aggregate production is diversifying out of cereals into livestock and higher-value crops.
In almost every developing Asian economy, growth in agricultural output is marked by a gradual
shift in the composition of production in response to the changing composition of food demand.
The value of non-cereal crops – particularly vegetables and fruits – has grown at a faster rate than
the value of cereals.
This trend is pervasive across China, South Asia and South-East Asia. China’s cereal production
declined quickly until it stagnated at just below 20 per cent of the total value of all agriculture.
In South and South-East Asia, the relative importance of cereals remains higher and has declined
at a more gradual pace, but this decline has been greater and more consistent since 2010. Only
two countries have experienced a stagnation or slight increase in the proportion of cereals in total
production value: Thailand and the Philippines.18
Capital and fertilizer intensity in agriculture has increased at a faster rate than the intensity
of agricultural labour; as a consequence, per worker productivity and capital stock have risen
sharply in recent years. A brief look at the intensity of input use in relation to land and labour
offers some insights into how this process has unfolded. We begin with land and labour.
18. Thailand possesses a comparative advantage in rice production that manifests itself through monocropping, despite government programmes towards on-farm diversification. In particular, rice-cropping systems in Thailand are relatively less labour-intensive than more diversified systems, complementing trends in urbanization and the shrinking of the rural labour force (Kasem and Thapa, 2011). The Philippines maintains a set of strict protectionist policies towards rice imports that encourage rice cultivation over more profitable alternatives – as such, it is the only country in which a steady increase has occurred in the value of cereals as a share of total agricultural production (OECD, 2017).

55
SHARE OF CEREALS IN TOTAL AGRICULTURAL PRODUCTION AGAINST PER CAPITA INCOME, 1990-2013
FIGURE 2.2
%
Source: FAO, FAOSTAT.
20.0
10.0
30.0
40.0
50.0
60.0
70.0
80.0
90.0
100.0
0.0
Excludes small island states (Maldives)
Log of GDP per capita (Constant 2005 USD)
4 4.5 5 6 6.5 75.5 7.5 8.58 9
BOX 2.1
INDUSTRIAL CROPS IN ASIA
The past 20 years have witnessed a significant expansion of the production of industrial crops across Asia. Between 1990 and 2013, total harvest area of all crops grew moderately in South and East Asia and significantly in South-East Asia. While the distribution of harvest area by industrial and food crops has remained roughly constant in South Asia and East Asia (at 12 per cent and 10 per cent of total harvest area, respectively), it has risen moderately in South-East Asia, from 25 per cent in 1990 to just over 30 per cent in 2013 (FAO, 2017). The gross production values of industrial and food crops tell a similar story. Both China and South Asia emerge as strong producers of cotton and sugar. In China, these crops constitute roughly 30 per cent and 40 per cent of the total value of industrial crop production, respectively. In South Asia, they constitute 38 per cent and 25 per cent. Industrial crop production in South-East Asia, on the other hand, remains highly concentrated in oil palm and rubber. Oil palm constitutes 44 per cent of the total value of industrial crop production, while rubber constitutes almost 25 per cent.
The distribution of industrial crop cultivation across this region is itself somewhat skewed. In the Philippines, the value of industrial crop production has remained relatively steady. In Cambodia, it has increased at a rate slower than that of food production. In Indonesia, Malaysia and Thailand, however, it constitutes a significant share of the total value of crop production. The composition of industrial crop production in these three countries then contributes greatly to the figures that we have observed at the subregional level: palm oil and rubber have become important sources of value for Malaysian, Indonesian and Thai producers.
Hayami (2010) makes the case that the economies of scale associated with large plantations – processing, packaging and marketing perishable crops – are not as great as had previously been estimated. Byerlee (2014) likewise contends that the “economic fundamentals” of industrial crop production – especially the supervision costs associated with overseeing land and hired labour – favour smallholders, especially in the context of falling commodity prices. While recent commodity price increases, large land concessions and blurry private partnerships have led to a resurgence of larger plantations in mainland South-East Asia, Byerlee concludes that smallholders have a comparative advantage in the production of plantation crops that could be better realized through changes in local and national political economy.
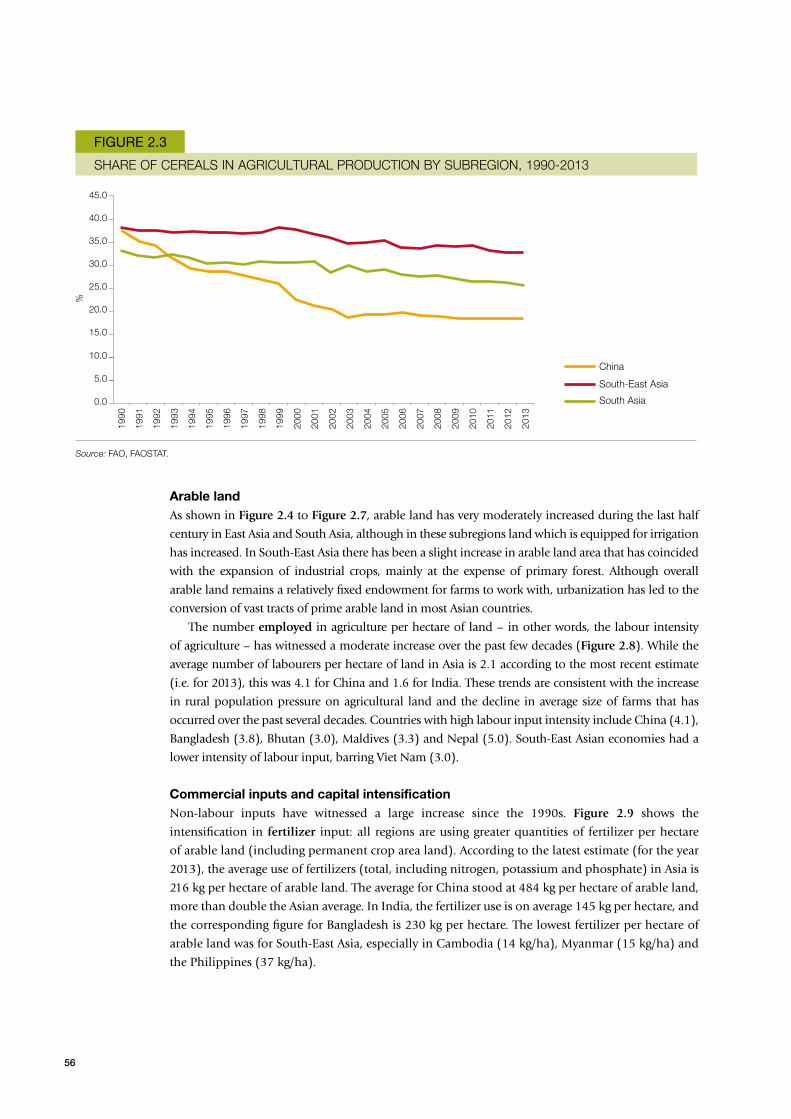
56
SHARE OF CEREALS IN AGRICULTURAL PRODUCTION BY SUBREGION, 1990-2013
FIGURE 2.3
%
Source: FAO, FAOSTAT.
10.0
5.0
15.0
20.0
25.0
30.0
35.0
40.0
45.0
0.0
China
South-East Asia
South Asia
1990
1991
1992
1993
1994
1995
1996
1997
1998
1999
2000
2001
2002
2003
2004
2005
2006
2007
2008
2009
2010
2011
2012
2013
Arable landAs shown in Figure 2.4 to Figure 2.7, arable land has very moderately increased during the last half
century in East Asia and South Asia, although in these subregions land which is equipped for irrigation
has increased. In South-East Asia there has been a slight increase in arable land area that has coincided
with the expansion of industrial crops, mainly at the expense of primary forest. Although overall
arable land remains a relatively fixed endowment for farms to work with, urbanization has led to the
conversion of vast tracts of prime arable land in most Asian countries.
The number employed in agriculture per hectare of land – in other words, the labour intensity
of agriculture – has witnessed a moderate increase over the past few decades (Figure 2.8). While the
average number of labourers per hectare of land in Asia is 2.1 according to the most recent estimate
(i.e. for 2013), this was 4.1 for China and 1.6 for India. These trends are consistent with the increase
in rural population pressure on agricultural land and the decline in average size of farms that has
occurred over the past several decades. Countries with high labour input intensity include China (4.1),
Bangladesh (3.8), Bhutan (3.0), Maldives (3.3) and Nepal (5.0). South-East Asian economies had a
lower intensity of labour input, barring Viet Nam (3.0).
Commercial inputs and capital intensificationNon-labour inputs have witnessed a large increase since the 1990s. Figure 2.9 shows the
intensification in fertilizer input: all regions are using greater quantities of fertilizer per hectare
of arable land (including permanent crop area land). According to the latest estimate (for the year
2013), the average use of fertilizers (total, including nitrogen, potassium and phosphate) in Asia is
216 kg per hectare of arable land. The average for China stood at 484 kg per hectare of arable land,
more than double the Asian average. In India, the fertilizer use is on average 145 kg per hectare, and
the corresponding figure for Bangladesh is 230 kg per hectare. The lowest fertilizer per hectare of
arable land was for South-East Asia, especially in Cambodia (14 kg/ha), Myanmar (15 kg/ha) and
the Philippines (37 kg/ha).
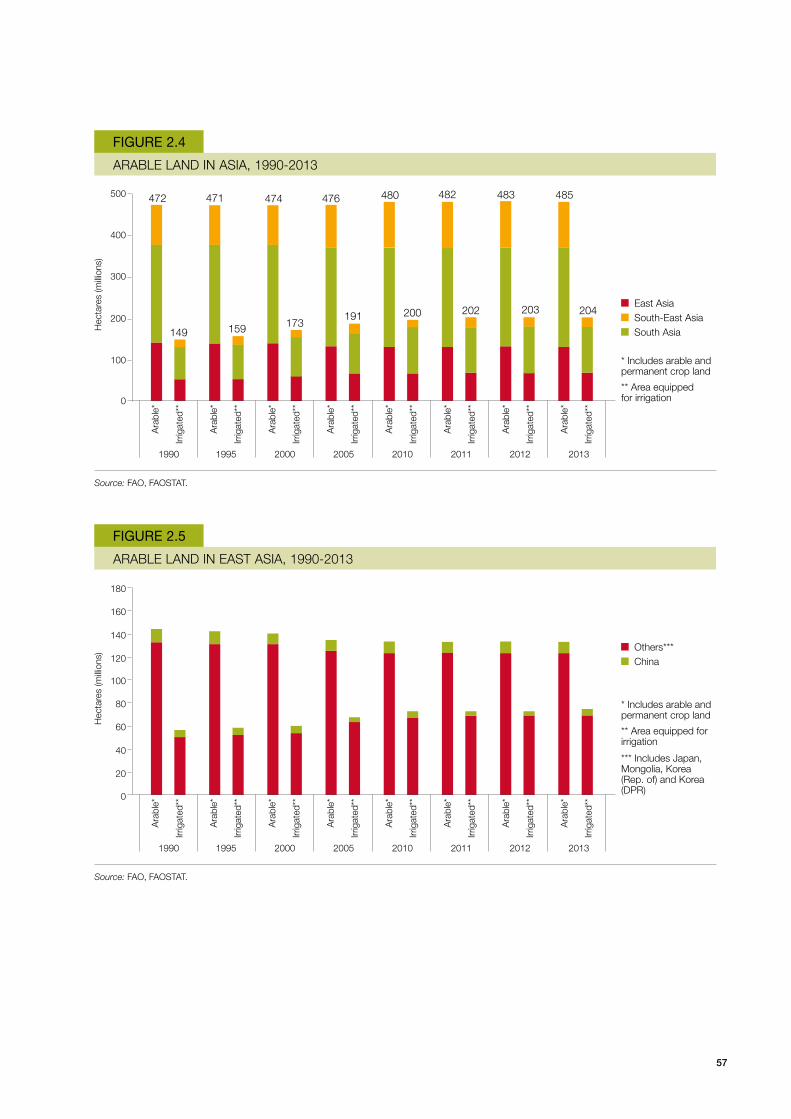
57
ARABLE LAND IN ASIA, 1990-2013
FIGURE 2.4
Hec
tare
s (m
illion
s)
Ara
ble*
Ara
ble*
Ara
ble*
Ara
ble*
Ara
ble*
Ara
ble*
Ara
ble*
Ara
ble*
Irrig
ated
**
Irrig
ated
**
Irrig
ated
**
Irrig
ated
**
Irrig
ated
**
Irrig
ated
**
Irrig
ated
**
Irrig
ated
**
Source: FAO, FAOSTAT.
200
300
400
1990 1995 2000 2005 2010 2011 2012 2013
500
100
0
East AsiaSouth-East AsiaSouth Asia
* Includes arable and permanent crop land
** Area equipped for irrigation
472 471 474 476 480 482 483 485
149 159 173191 200 202 203 204
ARABLE LAND IN EAST ASIA, 1990-2013
FIGURE 2.5
Hec
tare
s (m
illion
s)
Ara
ble*
Ara
ble*
Ara
ble*
Ara
ble*
Ara
ble*
Ara
ble*
Ara
ble*
Ara
ble*
Irrig
ated
**
Irrig
ated
**
Irrig
ated
**
Irrig
ated
**
Irrig
ated
**
Irrig
ated
**
Irrig
ated
**
Irrig
ated
**
Source: FAO, FAOSTAT.
1990 1995 2000 2005 2010 2011 2012 2013
40
60
80
100
20
0
140
160
180
120Others***China
* Includes arable and permanent crop land
** Area equipped for irrigation
*** Includes Japan, Mongolia, Korea (Rep. of) and Korea (DPR)

58
ARABLE LAND IN SOUTH ASIA, 1990-2013
FIGURE 2.6
Hec
tare
s (m
illion
s)
Ara
ble*
Ara
ble*
Ara
ble*
Ara
ble*
Ara
ble*
Ara
ble*
Ara
ble*
Ara
ble*
Irrig
ated
**
Irrig
ated
**
Irrig
ated
**
Irrig
ated
**
Irrig
ated
**
Irrig
ated
**
Irrig
ated
**
Irrig
ated
**
Source: FAO, FAOSTAT.
1990 1995 2000 2005 2010 2011 2012 2013
100
150
200
250
50
0
300
Others***India
* Includes arable and permanent crop land
** Area equipped for irrigation
*** Includes Afghanistan, Bangladesh, Bhutan, Maldives, Sri Lanka, Pakistan, Iran, Nepal
A more complete analysis of capital intensity in agriculture would require looking at the use of
agricultural machinery per hectare of land, or number of workers per agricultural machine. Owing
to paucity of data, however, we rely on related indicators based on gross capital formation (GCF),
such as trends in total GCF, GCF per economically active population in agriculture and GCF per
hectare of arable land (FAO, 2017). A rising trend in GCF is observed for all subregions of Asia
and the Pacific. Figure 2.10 reflects this trend on a per worker basis, and Figure 2.11 reflects it on
a per hectare basis.
Countries with high GCF per hectare of arable land include China (US$588 at 2005 prices),the
Republic of Korea (US$2,114), Maldives (US$1,594) and Malaysia (US$433). The average for
South Asian economies is US$203 per hectare, with Nepal and Pakistan spending less than US$100
per hectare. The average for South-East Asian economies is US$156, with Cambodia, the Lao PDR,
Myanmar and Timor-Leste spending less than US$100 per hectare (2013 estimates). In Asia, the
average GCF per economically active worker in agriculture is US$153, primarily because of the very
high contribution of Japan and the Republic of Korea. If we look at the developing countries, most
invest less than US$150 per worker, including China, India, Pakistan, Sri Lanka, Indonesia and
the Philippines. Countries spending less than US$100 include Viet Nam, Timor-Leste, Myanmar,
the Lao PDR, Cambodia, Nepal, Bhutan and Bangladesh. Thailand does better than all these
economies (US$208 per worker).
The rate of GCF has increased in recent years in Asia. In the decade ended 2000, GCF per worker
increased by 15 per cent and GCF per hectare of arable land increased by 23 per cent. In the next
decade (2001-2010), GCF per worker increased by 70 per cent and GCF per hectare of arable land
increased by 76 per cent. Between 2010 and 2013, in just three years, the GCF per worker increased
by 24 per cent and GCF per hectare of arable land increased by 23 per cent. It is striking that growth
in GCF per worker in South Asia has been higher than in other subregions. These figures indicate
the growing capital intensity of agriculture in Asia, which is correlated quite expectedly with that
in manufacturing and services.

59
ARABLE LAND IN SOUTH-EAST ASIA, 1990-2013
FIGURE 2.7
Hec
tare
s (m
illion
s)E
mpl
oym
ent i
n ag
ricul
ture
per
hec
tare
of a
rabl
e la
nd
Ara
ble*
Ara
ble*
Ara
ble*
Ara
ble*
Ara
ble*
Ara
ble*
Ara
ble*
Ara
ble*
Irrig
ated
**
Irrig
ated
**
Irrig
ated
**
Irrig
ated
**
Irrig
ated
**
Irrig
ated
**
Irrig
ated
**
Irrig
ated
**
Source: FAO, FAOSTAT.
Source: FAO, FAOSTAT.
1990 1995 2000 2005 2010 2011 2012 2013
40
60
80
100
20
0
140
120
* Includes arable and permanent crop land
** Area equipped for irrigation
*** Includes Cambodia, Laos, Malaysia, Myanmar, Philippines, Timor-Leste and Viet Nam
Others***ThailandIndonesia
EMPLOYMENT PER HECTARE OF LAND,* 1990-2013
FIGURE 2.8
1990 1995 2000 2005 2010 2011 2012 2013
1.5
1.5
2.0
2.5
0.5
0
3.5
4.0
4.5
3.0
China
India
South-East Asia
East Asia
South Asia
Asia
* Includes land under permanent crop area
2.01.9 2.0 2.1 2.1 2.1 2.1 2.1
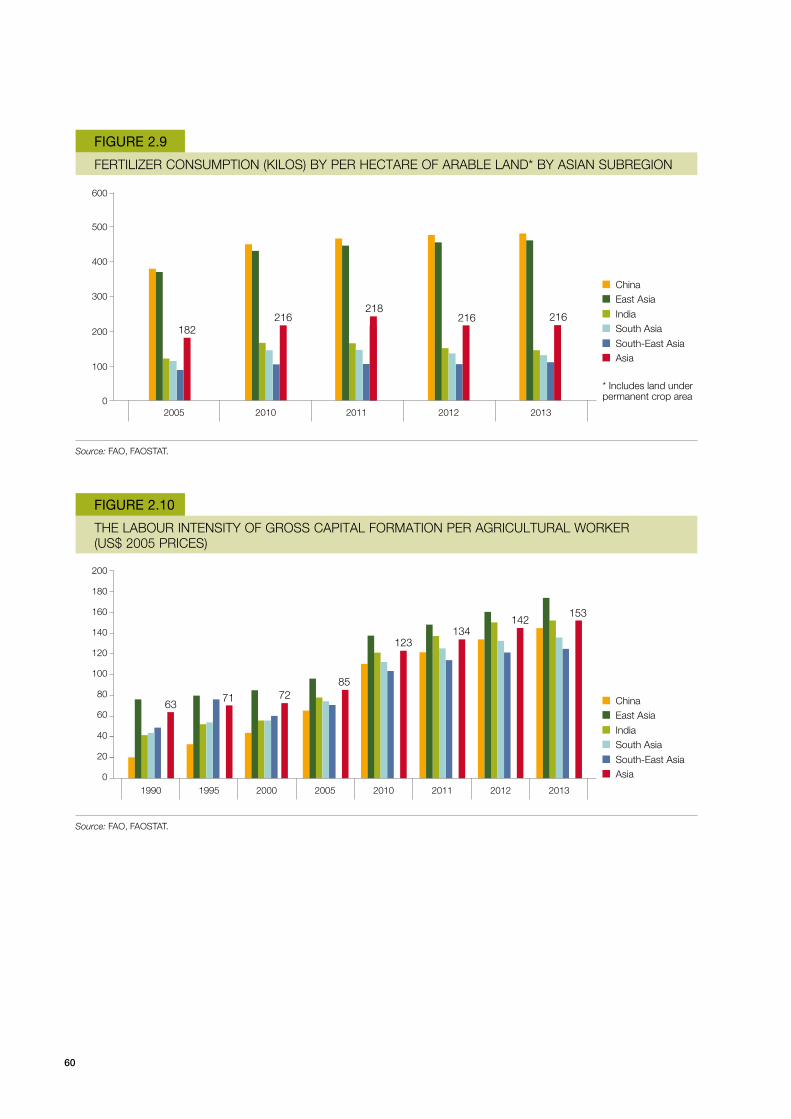
60
Source: FAO, FAOSTAT.
Source: FAO, FAOSTAT.
FERTILIZER CONSUMPTION (KILOS) BY PER HECTARE OF ARABLE LAND* BY ASIAN SUBREGION
THE LABOUR INTENSITY OF GROSS CAPITAL FORMATION PER AGRICULTURAL WORKER (US$ 2005 PRICES)
FIGURE 2.9
FIGURE 2.10
China
India
South-East Asia
East Asia
South Asia
Asia
China
India
South-East Asia
East Asia
South Asia
Asia
* Includes land under permanent crop area
2005 2010 2011 2012 2013
216182
218216 216
200
300
400
500
100
0
600
1990 1995 2000 2005 2010 2011 2012 2013
7163
7285
123134
142153
40
20
60
80
100
120
140
160
180
200
0

61
Input intensification is not the only source of the rapid growth in agricultural output on
existing farmland across Asia – the other is an increase in total factor productivity (TFP), which
measures the efficiency with which observed inputs are transformed into outputs. Factors that lead
to TFP improvements include technological improvements, improved efficiency in resource use
and scale economies. Cross-country data on TFP yield some surprising findings (Figure 2.12).19
First, while the rate of growth of output is more or less stable, TFP’s relative contribution to this
growth has itself increased. TFP growth now comprises 75 per cent of growth in agricultural output,
and TFP growth in Asian agriculture has in fact surpassed that of every other developing region.
Second, within Asia the output growth came primarily from China and South-East Asia, followed
by South Asia. Third, Figure 2.13 to Figure 2.15 show the growth of agricultural output in various
subregions of Asia and the Pacific, and the contribution of TFP growth is the same. The difference
between the two is the growth in inputs (intensification).
Agricultural labour and rural Across Asia as a whole, urbanization and slowing population growth are an inevitable facet of
structural transformation. In East Asia, total population is projected to fall from 1.6 billion today
to 1.5 billion between now and 2050. Meanwhile, its rural population is expected to drop sharply
from roughly 650 million to 350 million. In South-East Asia, while total population will continue to
grow from 640 million to 790 million, the rural population will peak at 330 million in 2018 before
declining to 280 million by 2050. South Asia will then bear the bulk of the region’s population
growth. Total population will rise from 1.8 billion today to 2.4 billion in 2050. Meanwhile, its
rural population is expected to peak in 2030 at 1.2 billion and decrease very slowly thereafter.
Nevertheless, developing Asia today remains majority-rural. In South Asia in particular, only one
third of the total population currently lives in urban areas.
Source: FAO, FAOSTAT.
THE LAND INTENSITY OF GROSS CAPITAL FORMATION, PER HECTAR OF ARABLE LAND* (US$ 2005 PRICES)
FIGURE 2.11
China
India
South-East Asia
East Asia
South Asia
Asia
* Includes land under permanent crop area
1990 1995 2000 2005 2010 2011 2012 2013
140118146
175
256 279301
315
200
100
300
400
500
600
700
0
19. Fuglie (2015) has constructed agricultural TFP indices for world agriculture based on data from the Food and Agricultural Organization of the United Nations (FAO). The data include crop and livestock output, and inputs including land, labour, machinery, fertilizers, livestock and animal feed for the period 1960-2012.
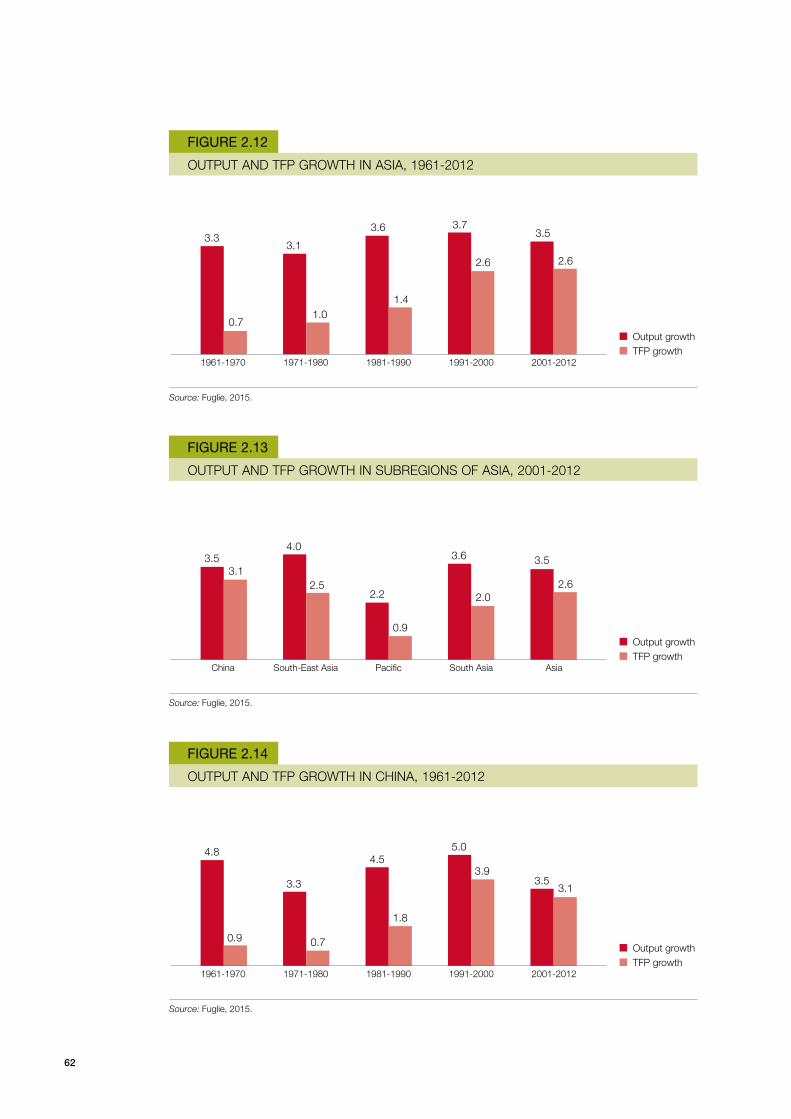
62
OUTPUT AND TFP GROWTH IN ASIA, 1961-2012
OUTPUT AND TFP GROWTH IN SUBREGIONS OF ASIA, 2001-2012
OUTPUT AND TFP GROWTH IN CHINA, 1961-2012
FIGURE 2.12
FIGURE 2.13
FIGURE 2.14
1961-1970
China
1961-1970
1971-1980
South-East Asia
1971-1980
1981-1990
Pacific
1981-1990
1991-2000
South Asia
1991-2000
2001-2012
Asia
2001-2012
Source: Fuglie, 2015.
Source: Fuglie, 2015.
Source: Fuglie, 2015.
Output growth
Output growth
Output growth
TFP growth
TFP growth
TFP growth
3.3
3.5
4.8
0.7
3.1
0.9
3.1
4.0
3.3
1.0
2.5
0.7
3.6
2.2
4.5
1.4
0.9
1.8
2.6
2.0
3.9
3.73.5
3.5
3.5
3.6
5.0
2.6
2.6
3.1

63
OUTPUT AND TFP GROWTH IN SOUTH-EAST ASIA, 1961-2012
FIGURE 2.15
1961-1970 1971-1980 1981-1990 1991-2000 2001-2012
Source: Fuglie, 2015.
Output growthTFP growth
2.6
0.5
3.9
1.9
3.3
0.4
1.4
4.0
2.53.0
For the most part, lower-middle-income countries in Asia have not yet experienced a
mass exodus from agricultural work and a sustained increase in rural wages accompanied by
a reduction in the urban-rural wage gap. However, there are signs that, amid declining rural
population growth (or an absolute decline in rural population itself), labour markets may soon
tighten. This is already the case in China, Malaysia, Thailand and Sri Lanka. Asia’s middle-income
countries will approach the point where urban and rural labour markets are perfectly integrated
and rural wages will respond to labour shortages in urban areas. Three important observations shed
light on this possibility.
First, measures of agricultural labour productivity (Figure 2.17) have displayed a rapidly
increasing trend in the last two decades in Asia. The highest agricultural value added per worker
is in South-East Asia and the lowest is in South Asia. The countries which displayed the highest
growth in agricultural value added per worker between 1990 and 2013 are China (an increase
of 137 per cent) and the Republic of Korea (341 per cent). For Asia overall, the agricultural
value added per worker grew by 77 per cent between 1990 and 2013. For India, it grew by just
52 per cent. Growth in agricultural labour productivity plays a key role in explaining the pace of
poverty reduction in rural Asia.
Second, rural wage rates have risen at an accelerated pace alongside value added per agricultural
worker. As with mechanization and farm machinery, internationally comparable data on rural
wages are scarce. Data in Figure 2.18 suggest that an increase in rural wages in the 2000s has been
observed in almost all Asian countries (Wiggins and Keats, 2014). In China and India in particular,
the increase accelerated in the second half of the 2000s. The increase between 2005 and 2012 in
India was about 35 per cent and in China about 92 per cent. As shown in Figure 2.18, similar
trends are observed in most of the other Asian countries. Examining the case of Bangladesh more
closely, the gap between urban and rural wages has narrowed as a result of rise in rural wages
(Zhang et al., 2013).
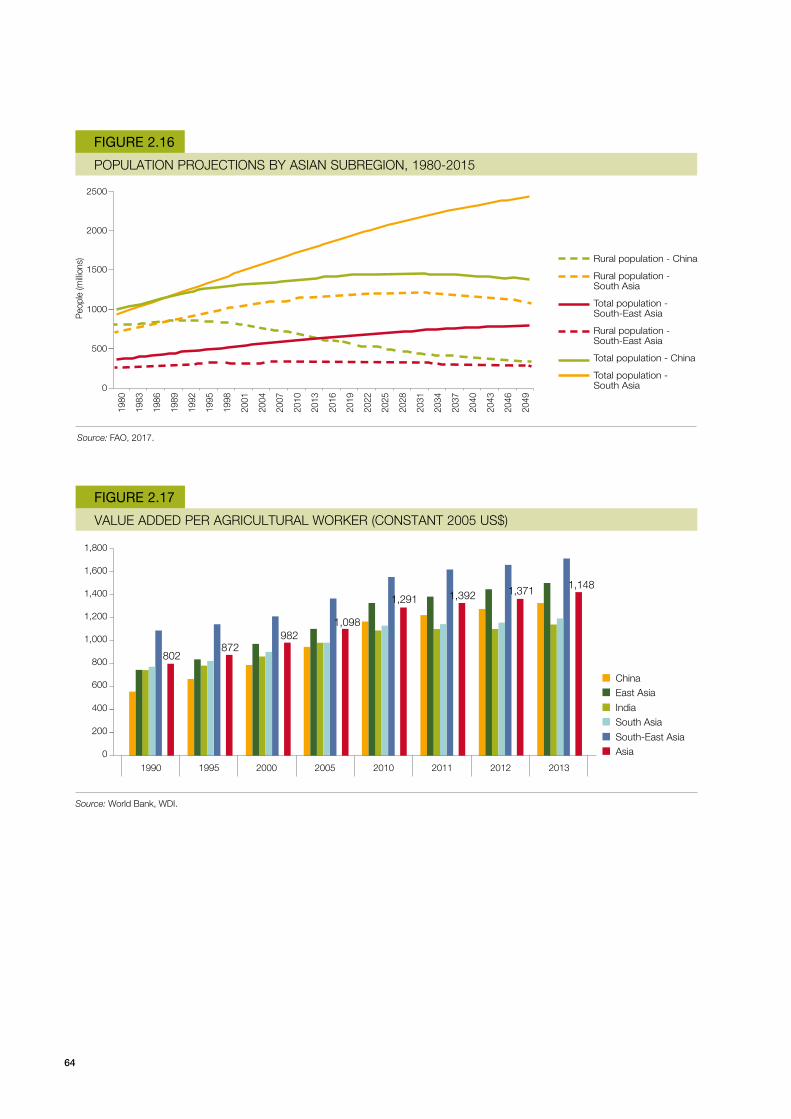
64
POPULATION PROJECTIONS BY ASIAN SUBREGION, 1980-2015
FIGURE 2.16
Source: FAO, 2017.
Peo
ple
(milli
ons)
1000
500
1500
2000
2500
0
Rural population - China
Rural population - South Asia
Total population - South-East Asia
Rural population - South-East Asia
Total population - China
Total population - South Asia
1980
1983
1986
1989
1992
1995
1998
2001
2004
2007
2010
2013
2016
2019
2022
2025
2028
2031
2034
2037
2040
2043
2046
2049
Source: World Bank, WDI.
VALUE ADDED PER AGRICULTURAL WORKER (CONSTANT 2005 US$)
FIGURE 2.17
China
India
South-East Asia
East Asia
South Asia
Asia
1990 1995 2000 2005 2010 2011 2012 2013
872802
9821,098
1,291 1,392 1,371 1,148
400
200
600
800
1,000
1,200
1,400
1,600
1,800
0

65
Third, farm fragmentation (as measured by the average size of farms) across Asia has been slowing
down in lower-middle-income countries, and has been reversing towards consolidation in upper-
middle-income countries. Figure 2.19 portrays the size of landholdings per farming household
across all Asian countries for which data are available. For the most part, the decline in average
farm size corresponds to rising population pressure, particularly in lower-middle-income countries
across South and South-East Asia. In India, for instance, average landholding sizes decreased by 0.4
and 0.3 hectares per decade from 1970 to 1990, but by 0.2 hectares per decade from 1990 to 2010.
The most striking examples of this phenomenon can be found in South-East Asia, where average
landholdings per household have increased slightly in the Lao PDR, Myanmar and Indonesia while
remaining roughly stagnant in Thailand.20
The process of transformation of Asia’s rural areas reached different stages depending on
initial conditions and importantly on the extent to which the broader economy has been driven
by industrialization. Migration from rural areas and changing occupations have transformed rural
labour markets to the point that in some of the more dynamic Asian economies rural wages have
showed signs of sustained growth, signalling the exhaustion of surplus labour in rural areas and the
elimination of disguised unemployment.
20. The increase in average farm size that has occurred in the Lao PDR and Myanmar is largely attributed to agricultural extensification and the expansion of large-scale plantations.
Transformations in the agrifood value chainsAgricultural production across Asia has grown substantially – it is now more diversified, more capital
intensive and less dependent on rural labour in relation to other inputs. However, these changes
are only one part of the story. Within the greater process of structural transformation, they are
indicative of a rapidly evolving series of relationships between producers, retailers and consumers
best characterized as agricultural commercialization. As discussed above, changing consumption
patterns are fundamentally altering the structure of the agrifood sector (Reardon et al., 2009) with
consumption moving away from staples and other basic food items towards fruits, vegetables and
processed foods. Together with technological change in packaging and logistics, these shifts favour
the expansion and increasing sophistication of food and beverages, and agricultural inputs and
services such as transportation, storage and marketing.
Agrifood value chains are undergoing a process of vertical and horizontal integration that
has responded heavily to changing food demand. Wholesale buyers are dealing more and more
directly with farmers, “disintermediating” the supply chain by displacing traditional village traders.
Looking at traditional crops such as rice, the transformation of supply chains has led to a rapid
decline of village mills, while small- but especially medium- and large-scale mills have expanded
their presence, mainly in larger rural towns. Traditional village traders/brokers/processors have
declined while small and medium-sized firms have proliferated, with eventual domination by
large domestic firms and multinationals (Reardon and Timmer, 2014). For example, the number
of rice mills has declined rapidly in several countries. Medium- and large-scale mills have emerged,
mostly located in rural towns. A comprehensive Asian Development Bank (ADB) report on food
security draws attention to some contrasts between Bangladesh and India in rice supply chains
(ADB, 2013b). The role of the village trader, for example, has shrunk, controlling only 7 per cent of
farms and sales in Bangladesh and 38 per cent of farms and 18 per cent of sales in India.

66
US
$, c
onst
ant 2
010
PP
P
CHANGES IN REAL DAILY WAGES FOR AGRICULTURAL LABOUR IN FOUR ASIAN COUNTRIES (CONSTANT 2010 US$ PPP)
FIGURE 2.18
6
7
8
9
10
11
12
13
14
15
4
5
Source: Wiggins and Keats, 2014.
China, 5 province average
Bangladesh, national, peak season
India, national
Nepal, national1998 2003 2007 2000/
20012005/ 2006
2012/ 2013
2000 2005 2010 1995/ 1996
2003/ 2004
2010/ 2011
6.17
7.626.84 6.9
9.34
6.05 6.05
8.76
4.6
5.72
7.34
14.66
Consistent with changes in supply chains and changes in the output of the agrifood industry, a
very large share of food in Asia is now processed in some form. Grain milled rice is made into bread
or polished rice, for example. The rapid growth of food processing is driven by increases in income,
urbanization, women’s participation in the labour force and more generally dietary shifts, promoted
in part by modern retail. The retail segment has transformed rapidly in the last 10 years. Many
governments that used to support public sector cum cooperative retail ventures (e.g. India, Viet Nam
and China) have dismantled these in the wake of broader structural adjustment and liberalization
policies. The supermarket “revolution” has also been a catalyst for these changes. Supermarket
chains seldom buy fresh produce directly from farmers. Instead, they tend to buy from wholesale
markets or from specialized wholesalers who in turn buy from preferred suppliers.
Since the late 1980s, the rapid growth in the food-processing sector has been characterized by
investments by multinational firms, consolidation and technological and organizational changes.
This process has had two sets of consequences. One is the proliferation of SMEs, grain mills, and
dairy, meat and fish processing, induced by market deregulation and delicensing of processing. An
example of such proliferation is rice mills and potato cold stores in India, Bangladesh and China.
Another is that, following widespread liberalization of foreign direct investment in processing, a
large inflow of foreign direct investment (FDI) and private and state investment occurred. Starting
with Nestlé, Kraft and Danone, regional giants such as Thailand’s CP (Charoen Pokphand) or
Singapore’s Wilmar have expanded in China, other South-East Asian countries and India. While
the food-processing sector has expanded, the massive investments by domestic and foreign firms,
creating or enlarging large-scale processors, have wiped out many small and medium-sized firms.

67
AVERAGE FARM SIZE BY COUNTRY AND FOOD AND AGRICULTURE ORGANIZATION (FAO) WORLD PROGRAMME FOR THE CENSUS OF AGRICULTURE (WCA) ROUND
FIGURE 2.19
Hec
tare
s
2
1
3
4
5
6
7
0
2000
2010
1980
2000
2010
1970
1980
1990
2000
2010
1990
2000
2010
1970
1980
1990
2000
2010
1970
1980
1990
2000
2010
1970
1990
2000
2010
2000
2010
1990
2000
2010
1970
1980
1990
2000
1980
1990
2000
2010
1990
2000
2010
CHN BSD IND IRN NPL PAK IDN MMR PHL THA VNMLAO
East Asia South Asia South-East Asia
Source: FAO, 2015.Note: BGD, Bangladesh; CHN, China; EA, East Asia; IDN, Indonesia; IND, India; IRN, Iran; LAO, Laos PDR; MMR, Myanmar; NPL, Nepal; PAK, Pakistan; PHL, Philippines; SA, South Asia; SEA, South-East Asia; THA, Thailand; VNM, Viet Nam.
Likewise, the retail sector has also transformed rapidly since 2010. Many governments
(e.g. India, Viet Nam and China) had public sector cum cooperative retail ventures. With structural
adjustment and liberalization, most were dismantled or privatized. While a substantial amount
of literature documents with detailed data the extent to which the supermarket revolution of
the 1990s and 2000s has resulted in a growing share of food sales becoming controlled by large
retail chains spurred by FDI, there is less evidence on the extent to which supermarkets directly
procure fresh produce from farmers (Reardon and Timmer, 2014; Reardon, Timmer and Minten,
2012; Reardon et al., 2009; Timmer, 2009). In fact, this still appears to be a rare phenomenon
in most Asian countries. Rather, supermarket chains still tend to buy either from wholesale
markets or fresh produce from specialized wholesalers who in turn buy from preferred suppliers.
Various “off-market” actors have in fact begun to emerge, specialized in meeting the sourcing
requirements of modern processors and supermarkets – most notably the “dedicated wholesalers”
(such as Bimandiri in Indonesia). They typically confine their activities to either one company or a
segment (such as modern retail). Another is modern logistics companies, undertaking wholesaling,
warehouse management, information and communications technology (ICT) system integration
into the retail and distribution networks of companies, and cold chain development. FDI has
played an important role in their growth.
68
All of these components of the agrifood industry tell us that the typical supply chain in Asia
seems to be restructuring itself in two ways. First, it is “lengthening” geographically, implying
that food markets are integrating across zones/states in a country to the extent that private
sector investment is progressively modernizing its storage and transport facilities. Second, it is
“shortening” intermediationally, or simply comprises “fewer hands in the chain”. As consolidation
takes place at the processing, wholesaling and retailing levels by taking advantage of economies of
scale made possible by lower transportation costs and growing urban markets, domestic small and
medium-sized firms become unprofitable. Improved storage and transportation capacity also imply
“de-seasonalization” of the market.21
Transformations in agrifood trade and the evolution of competitivenessDeveloping Asian economies have become important players in global trade. Exports from these
countries contribute almost 40 per cent of the global total, and this share has been rising over time
(Figure 2.20). The rising importance of Asian imports and exports also signals that these economies
have become more integrated into the global economy: trade flows as shares of GDP have increased
substantially across most countries, with recent (but slight) declines in larger middle-income
countries such as China and Malaysia. The nature and structure of agricultural trade has changed
significantly across these countries largely in line with the growth and transformation process
described above, though not always in predictable ways.
Agricultural exports across developing Asian countries have tended to lose their relevance
both within total exports and as a source of foreign exchange. The share of agricultural exports (raw
material) in total merchandise exports ranges from less than 1 per cent in Afghanistan and China to
slightly more than 5 per cent in Mongolia and Fiji. In South and South-East Asian countries – India,
Pakistan, Sri Lanka, Malaysia and the Philippines – the share of agriculture exports in total exports is
between 1 and 3 per cent. In China – as shown in Figure 2.21 – this share has consistently declined
(albeit marginally) in the last 15 years. In India, on the other hand, it increased before declining
again. A similar pattern was observed in Thailand and Viet Nam as well.
The volume of agricultural exports relative to agricultural GDP has not always increased during
the commercialization process. Figure 2.22 offers a snapshot of this measure among countries for
which data are most available. Agricultural exports are high relative to agricultural GDP in a handful
of large economies – most notably Malaysia, Thailand and Viet Nam. In others, they have either
increased at a relatively slow pace or stagnated.
The composition of agrifood exports remains heavily slanted towards food products, with a
few notable exceptions (Figure 2.23). Food products make up more than 70 per cent of agrifood
exports in the vast majority of large Asian economies. Cereal exports remain a minority across every
country but Pakistan, in line with common policy priorities in ensuring food self-sufficiency. In China,
Bangladesh, the Philippines, Thailand and Viet Nam, non-cereal-based foods – particularly fruits and
vegetables – now comprise an increasing share of agricultural exports. Non-food products such as plant
fibres, vegetable oils, rubber and cotton are becoming increasingly prominent in South-East Asia. In
Indonesia, Malaysia and the Philippines, oil-based crop products make up the largest single category
of agricultural exports, while Cambodia exports a large amount of timber and fibrous products.
The rising importance of fruits, vegetables and industrial crops in agricultural exports is a further
indicator of the deepening of the commercialization process characterizing Asia’s agrifood systems.
21. A case in point is the potato market in India, China and Bangladesh.

69
ASIA’S SHARE IN GLOBAL EXPORTS, 2000-2016
FIGURE 2.20
%
Source: UNCTAD, 2016.
10.0
15.0
20.0
35.0
25.0
40.0
5.0
0
50.0
30.0
45.0
2000
2002
2004
2006
2008
2010
2012
2014
2001
2003
2005
2007
2009
2011
2013
2015
2016
Developing economies: East Asia
Developing economies: South-East Asia
Developingeconomies: South Asia
AGRICULTURAL EXPORTS IN TOTAL EXPORTS ACROSS CHINA AND INDIA, 2000-2016
FIGURE 2.21
Source: UNCTAD, UNCTADSTAT.
%
4.0
10.0
2.0
6.0
12.0
8.0
14.0
16.0
0
China
India
2000
2001
2002
2003
2004
2005
2006
2007
2008
2009
2010
2011
2012
2013
2014
2015
2016
70
22. Distortions to agricultural trade are greater in Asia than they are in many other parts of the world: Hayami and Anderson (1986) lay the foundations for analysing them, noting that trade barriers, subsidies and price controls have become popular tools in response to rapid income growth and structural adjustment. In particular, concerns over cereal self-sufficiency have prompted the governments of many Asian countries to heavily subsidize their agricultural sectors while maintaining import tariffs on basic staples (Hayami, 2007; Anderson and Martin, 2009). With these conditions in mind, this section offers a useful general picture of comparative advantage across Asian countries, but it does not yet estimate the ways that these measures might be distorted by barriers and incentives to agricultural trade in the region.
23. The United Nations Comtrade database, provided by the United Nations Statistics Division, offers a comprehensive, harmonized set of data on imports and exports by country and product classification. Comtrade converts annually reported trade data from national governments into a set of standardized weights and monetary values.
24. See the appendix for a specific description of the methodology.
Competitive advantage in agriculture and food manufacturing in AsiaBroadly, comparative advantage in trade is a manifestation of cost of production, exchange rate,
global/regional market structure (e.g. whether or not it is confined to a few exporters as in the
case of rice) and bilateral or multilateral trading blocs (e.g. the Association of Southeast Asian
Nations [ASEAN]). Their effects, however, are difficult to assess empirically. For this reason, we
build proximate measures of the trade structure and competitiveness of agriculture across Asia
using two indices of comparative advantage, one relying on trade shares of food products and the
other relying on trade shares of agricultural products that have undergone primary processing.
Looking at these indices of comparative advantage between two period averages – first from 2001
to 2007 and second from 2008 to 2014 – also provides important insights into how the structure
and direction of agricultural trade has changed for large agricultural producers before and after the
food price crisis.
In particular, large agricultural producers such as India, Thailand and Viet Nam continue
to display a strong comparative advantage on the international market both in agrifood and in
unprocessed products, while upper-middle- to upper-income countries such as China, Japan,
Korea and Malaysia have experienced declines in the same measures across primary agricultural
products, processed food products or both. Because this exercise does not take into account tariffs
and non-tariff measures of trade protection, its results should be treated with some caution, as
the level of changes in competitiveness may be more a reflection of policies than a response to
countries’ specific comparative advantages in agriculture and agribusiness.22 A brief description of
the data and methodology follows below.23
Calculating measures of competitiveness:24 the relative export advantage (RXA) index takes
into account comparative advantage (or disadvantage) in both imports and exports and under
some assumptions is a useful variant of the more commonly used revealed comparative
advantage (RCA) index originally developed by Balassa (1965). In intuitive terms, this index
measures the degree to which a country is exporting any given product relative to the degree to
which other countries are exporting it. For any given trade product, an RXA score that is above
0 indicates a country’s competitive advantage, which may not necessarily imply a comparative
advantage given the influence of agricultural and trade policies. Conversely, if the RXA score
lies below 0, then the country displays a competitive disadvantage in exporting that product.
A further variant of this index – the relative trade advantage (RTA) index – was developed by
Vollrath (1991) to take into account both competitive advantage and disadvantage in driving
imports. Tables 2.5 and 2.6 depict period averages in measures of competitive advantage for the
periods 2001-2007 and 2008-2014 for both primary agricultural products and processed food. RXA
and RTA values are shown for both primary agricultural materials and processed food products.

71
20.0
40.0
60.0
80.0
100.0
0.0
30.0
50.0
70.0
90.0
10.0
AGRICULTURAL EXPORTS BY STANDARD INTERNATIONAL TRADE CLASSIFICATION, FIVE-YEARS AVERAGES, 2001-2015
FIGURE 2.23
%
East Asia South Asia South-East Asia
Source: UN COMTRADE, 2017.
2001
-200
5
2006
-201
0
2011
-201
5
2001
-200
5
2006
-201
0
2011
-201
5
2001
-200
5
2006
-201
0
2011
-201
5
2001
-200
5
2006
-201
0
2011
-201
5
2001
-200
5
2001
-200
5
2001
-200
5
2001
-200
5
2001
-200
5
2001
-200
5
2006
-201
0
2006
-201
0
2006
-201
0
2006
-201
0
2006
-201
0
2006
-201
0
2011
-201
5
2011
-201
5
2011
-201
5
2011
-201
5
2011
-201
5
2011
-201
5
China Bangladesh India Pakistan Indonesia Cambodia Malaysia Philippines Thailand Viet Nam
Cereals and cereal products
Animal products and seafood
Non-cereal food and food products
Beverages and tobacco
Crude non-food agr. products
Animal and veg. oils and fats
AGRICULTURAL EXPORTS AS A SHARE OF AGRICULTURAL VALUE ADDED, FIVE-YEARS AVERAGES, 1991-2015
FIGURE 2.22
20.0
40.0
60.0
80.0
100.0
0.0
120.0
East Asia South Asia South-East Asia
Source: UN COMTRADE, 2017.Note: SITC, Standard International Trade Classification.
1991-19951996-20002001-20052006-20102011-20151991-19951996-20002001-20052006-20102011-2015
1991-19951996-20002001-20052006-20102011-2015
%
Chi
na
Ban
glad
esh
Indi
a
Sri
Lank
a
Nep
al
Pak
ista
n
Indo
nesi
a
Cam
bodi
a
Mal
aysi
a
Phi
lippi
nes
Thai
land
Viet
Nam
Under the SITC 3 Revision, agricultural exports include SITC codes 0, 1, 2 (excluding 27 and 28), and 4

72
TABLE 2.6
MEASURES OF COMPETITIVENESS AND CORRESPONDING COUNTRY GROUPINGS, PRIMARY PRODUCTS VERSUS PROCESSED FOODS, 2008-2014
RTA: all primary agricultural products
RXA: all primary agricultural products
Competitiveness groupings: primary agricultural products
RXA: processed food products
Source: UN COMTRADE, 2017.
AFG
CHN
IDN
IND
JPN
KOR
LKA
MDV
MYS
NPL
PAK
PHL
THA
VNM
25.96 25.48 3 0.02 (2.21) 1
0.29 (1.21) 1 0.32 (0.15) 1
2.25 0.64 3 3.27 2.39 3
1.80 1.18 3 1.25 0.79 3
0.05 (1.14) 1 0.09 (1.09) 1
0.08 (0.71) 1 0.15 (0.46) 1
9.27 7.28 3 0.86 (0.82) 1
7.11 5.29 3 81.79 78.30 3
0.68 (0.60) 1 2.37 1.31 3
5.88 3.52 3 1.57 (0.47) 2
1.65 (0.79) 2 3.26 1.79 3
0.97 0.11 2 1.19 (0.51) 2
1.66 1.04 3 2.58 1.85 3
3.01 1.64 3 2.37 1.29 3
Country code
RTA: processed food products
Competitiveness groupings: processed food products
TABLE 2.5
MEASURES OF COMPETITIVENESS AND CORRESPONDING COUNTRY GROUPINGS, PRIMARY PRODUCTS VERSUS PROCESSED FOODS, 2001-2007
RTA: all primary agricultural products
RXA: all primary agricultural products
Competitiveness groupings: primary agricultural products
RXA: processed food products
Source: UN COMTRADE, 2017.
BGD
CHN
IDN
IND
JPN
KOR
LKA
MDV
MNG
MYS
PAK
PHL
THA
VNM
0.91 (3.71) 1 1.10 (1.48) 2
0.53 (0.70) 1 0.52 0.07 2
2.18 (0.12) 2 2.03 0.93 3
1.95 0.96 3 1.41 0.83 3
0.04 (1.62) 1 0.08 (1.56) 1
0.13 (0.84) 1 0.18 (0.53) 1
8.94 7.08 3 0.98 (0.79) 1
8.79 6.98 3 41.82 38.60 3
1.34 0.21 3 0.70 (1.80) 1
0.74 (0.22) 1 1.52 0.87 3
1.11 (1.73) 2 2.13 0.75 3
0.79 0.04 2 0.79 (0.26) 1
1.78 1.10 3 2.69 1.97 3
4.27 3.20 3 3.23 2.32 3
Country code
RTA: processed food products
Competitiveness groupings: processed food products

73
2001-2007
2008-2014
2001-2007
2008-2014
Bangladesh, China, Japan, Korea, Malaysia
China, Japan, Korea, Malaysia
Japan, Korea, Philippines, Sri Lanka
China, Japan, Korea, Sri Lanka
Indonesia, Pakistan, Philippines
Pakistan, Philippines
Bangladesh, China
Philippines, Nepal
India, Sri Lanka, Thailand, Viet Nam
India, Indonesia, Nepal, Thailand, Viet Nam
India, Indonesia, Malaysia, Pakistan, Thailand, Viet Nam
India, Indonesia, Malaysia, Pakistan, Thailand, Viet Nam
Time period
Time period
Category 1: uncompetitive
Category 1: uncompetitive
Category 2: mixed competitiveness
Category 2: mixed competitiveness
Category 3: competitive
Category 3: competitive
Primary agricultural products
Processed food products
Within both the primary agricultural and processed food trade, countries are then placed into one
of three categories, depending on their level of competitiveness. Category 1 contains countries
whose RXA is less than 1 and whose RTA is less than 0. In other words, these countries consistently
manifest a lack of competitiveness in exports. Category 2 contains countries that exhibit mixed
measures of competitiveness: the RXA is above 1 but the RTA is below 0, or the RXA is below 1 but
the RTA is above 0. Category 3 contains countries whose RXA is above 1 and whose RTA is above
0, indicating consistency in measures of overall competitiveness. These thresholds for comparative
(dis)advantage produce the following groups of countries across Asia.
There are important insights that can be derived from this analysis. First, that the Republic of
Korea and Japan both exhibit a consistent lack of competitiveness in both primary agricultural
products and processed food across both periods. These countries are in fact net importers of
both agricultural products and processed food. The outcome relative to this group of countries is
consistent with the notion that lack of competitiveness in primary agricultural products (including
fisheries) results in a similar outcome for processed foods.
Second, in contrast to the previous case, there exists a cluster of countries in South and South-
East Asia that possess a consistently competitive edge in both primary agricultural products and
processed food. In South Asia, India exhibits high RXAs and RTAs. In South-East Asia, Thailand
and Viet Nam possess consistent comparative advantages in unmilled and milled rice, seafood and
other industrial cash crops.25
Third, with the exception of Sri Lanka, there is no country that is both consistently competitive
in primary agriculture and consistently uncompetitive in processed food.
Fourth and finally, the opposite may hold: Malaysia is an example of a country that is
uncompetitive in primary agriculture, most likely because of its high cost of labour, but competitive in
processed food products. Investments in the development of the oil palm sector explain this specific
configuration. Expansion of palm oil has been accelerating in Indonesia between the two periods
and the country has acquired a competitive edge in both primary agriculture and processed food.
25. It is worth noting that Thailand’s comparative advantage in processed foods outstrips that of Viet Nam after 2008.

74
A combination of strong investments in processing capacity and supportive trade policies may also
underlie the Philippines’ performance, where competitiveness in food processing has improved
between the two periods without any discernible improvement in competitiveness at primary
production stage.
The findings of this exercise correspond with established viewpoints on the relationship between
economic development and agricultural trade: comparative advantages in primary agricultural
products are most prevalent in low- to lower-middle-income countries with large endowments of
land and rural labour (Anderson, 1983; Martin and Warr, 1993; Timmer, 1988; Otsuka, 2013. In
particular, a decline in measures of comparative advantage across agricultural products in China,
Thailand and Viet Nam suggests that the competitiveness of agricultural exports is converging with
those of other sectors within each country. Conversely, trends in export specialization in Sri Lanka
(with tea), Indonesia and Malaysia (both with palm oil) correspond with increases in comparative
advantage in corresponding categories of product processing. It is important to underline, though,
that Indonesia’s and Malaysia’s competitiveness in food processing is driven mainly by the boom
that has characterized the palm oil market up to the start of the current decade.
Finally, the results are also consistent with the notion that long-term competitiveness in food
processing benefits from the competitiveness of the underlying primary agricultural sector.
REAL GDP PER CAPITA VERSUS FOOD PROCESSING-TO-AGRICULTURE VALUE ADDED RATIO BY REGION
FIGURE 2.24
0.5
1.0
1.5
2.0
2.5
0.0
0.5
1.0
1.5
2.0
2.5
0.0
Source: FAO, 2017.Note: FBT, food, beverage and tobacco; VA, value added.
Rat
io, V
A F
BT
over
VA
AFF
4 4 46 6 68 8 810 10 1012 12 12
4 4 46 6 68 8 810 10 1012 12 12
Log of GDP per capita (constant 2005 USD)
AFRICA ASIA & PACIFIC EUROPE
LATIN AMERICA & CARIBBEAN NORTH AMERICA OTHER DEVELOPED
75
Although competitiveness in food processing depends on a host of other factors, including
industrial policy interventions and level of infrastructural development, a competitive agricultural
sector is of fundamental importance from the early stages of development. In countries where the
cost of labour is increasing rapidly and smallholders are losing their competitive edge vis-à-vis
larger farmers, policymakers will be confronted with the dilemma of how to support prices of key
commodities, in particular grains, to protect farm income without increasing costs for the agro-
industry and consumers. Where support prices are higher than the price of imports, stocks will
accumulate to massive levels, as China’s recent experience with maize shows. Where support prices
are changed for deficiency payments based on target prices, fiscal outlays will quickly become very
onerous. An option is to switch to income support measures delinked from yields achieved by
farmers. This is indeed the direction that China’s agricultural policy is pursuing. For it to work,
though, it requires establishing a farmer registry to ensure an accurate target for income transfers.
The rural non-farm economy and the agrifood sector
Linkages between agriculture, industry and servicesCase studies from developing Asian countries highlight the importance of the forward
and backward linkages that lead to agriculture’s indirect effect on the economy. At the
aggregate level, the ratio of value added in food and beverage manufacturing to that of
agriculture has increased across many middle-income countries. A first step to evaluating the
presence and progress of agrifood commercialization in Asia is to look at its aggregate effects on
national economies. When taken alone, agricultural production understates the sector’s overall
contribution to economic output. Through its links to numerous industries such as fertilizer
production, food processing and manufacturing, transportation, wholesale, retail distribution
and finance, the agrifood industry generates large spillover effects.
A first attempt to tackle this issue is to consider the evolution of the food-processing sector vis-à-vis
that of agriculture and to focus on the respective contributions to GDP. Benchmarking with countries
from other regions provides a sharper picture of trends and of the relevance of interlinkages over time.
For a select number of countries, Figure 2.24 displays the trends in agriculture and food-processing
value added (with units reported on the x-axis) from 1990 to 2014, unless otherwise specified. The
stacked areas provide an idea of how the two sectors compare in terms of size. For ease of reading, the
food processing-to-agriculture value added ratio is also displayed (with units reported on the y-axis).
The relative size of the food-processing sector varies substantially from country to country;
while the food-processing sector value added well surpasses that of the agricultural sector in the
United States, it remains small compared with total agriculture in other countries. Cross-country
differences also appear in the trends of the food-to-agriculture value added ratio. From 1990 to
2014, the ratio remained quite stable in the United States and Spain but showed upward patterns
in Brazil, India and Turkey, suggesting an increasing size of the food-processing sector compared
with agriculture. Kenya is among the few countries included in the dataset which actually saw a
decrease in the food-processing-to-agriculture ratio.
The total effects of linkages between agriculture and agrifood manufacturing (measured as a
share of total GDP) remain significant, though they decrease alongside overall development. A
different measurement approach relies on input-output tables to examine the consolidated relevance
of direct and indirect linkages between agriculture and the rest of the economy, where indirect
linkages refer to “transactions” between non-agricultural sectors that are connected, further down
the chain, with transactions involving agricultural products. Computations could be carried out
for China, India and Indonesia using the World Input-Output Tables for the period 1995 to 2011.

76
Results show that agriculture starts out with a sizeable share in GDP for India and even China in
1995, though its share was already down to 15 per cent in Indonesia (Briones, 2017). Including
indirect contributions, the share of the consolidated agribusiness sector (i.e. agriculture plus the
share of value added in non-agricultural sectors activated by transactions with the agricultural
sectors) in GDP rises by 3.7 percentage points in Indonesia and up to 7.4 percentage points in
China. Importantly, the size of the indirect contribution relative to the direct contribution is rising
across all three countries; this implies that the character of the contribution of agriculture to the
economy is evolving from mostly direct to mostly indirect. The fastest increase in the ratio is in
Indonesia, while the slowest is in India.
Farm-driven linkages and the development of agrifood supply chainsProduction linkages spearheaded by agroprocessing was a critical phase in agriculture-led rural
industrialization in East Asia. In the case of Taiwan and the Republic of Korea, in the early stage
of economic development, agriculture-led rural industrialization was observed in the development
of food processing (Otsuka, 2007). Similarly, Japan has been cited as a case of agri-based
industrialization. Early development literature was quick to identify the numerous innovations
and transformations in Japanese agriculture that preceded the rapid industrialization of the country
(Johnston, 1951). The development of agriculture contributed directly in capital accumulation by
providing savings; it also indirectly contributed by freeing up labour for industries and supplying
food at low cost for manufacturing workers.
Transformation of traditional agricultural value chains has been observed for China and, beyond
East Asia, in India and Bangladesh (Reardon, Timmer and Minten, 2012). In rice milling, enterprises
have evolved from small to medium-sized and large mills using more modern equipment. While
chains have lengthened geographically, as larger mills require more sources of supply to meet
throughput, they have shortened “transactionally”: the traditional role of the village trader (engaging
in tied output-credit purchases) has been declining as rice mills and wholesalers increasingly source
paddy rice directly from farmers. The staple has shown improved quality and better packaging, now
available in branded and labelled bags. Farmers in Bangladesh are shifting from coarse-grade rice to
medium-grade rice. At the level of the farm, there is evidence of a more active land and input market,
and greater access to finance, owing in part to increased participation in non-farm employment.
One advantage favouring agrifood supply chains is reliance on availability of flexible work
arrangements, including deployment of women and young workers. Returning to the Japanese
example, a driver of early industrialization was the establishment of the putting-out/homework
system. This system actively employed women, and allowed industrialization to advance without
massive rural-urban migration (Francks, 2002). The flexibility of rural-based industry has also
been shown in the example of the Cirebon district of Indonesia (SMERU Institute, 2003). In the
case of Buyut village, the rattan industry employs about 600 workers and hosts 15 subcontractors.
Workshops are located near the owners’ homes; subcontractors and their workers are paid per piece.
Orders tend to fluctuate and continuity of work is not guaranteed; rattan workers earn from as little
as 12,000 Rp/week (the farm wage prevailing before the rattan cluster grew was 12,000 Rp/day);
however, the pay can be as high as 200,000 Rp/week depending on the order and pace of work.
Workers are able to manage their own hours; many housewives and students are employed in the
putting-out (i.e. subcontracted homeworker) system.
77
Agricultural multipliers Estimates of explicit or implicit agricultural growth multipliers fall over a wide range –
including negative values – with varying implications for the underlying scarcity of labour in
rural areas. The preceding application of input-output analysis (section 3.2) to quantify the indirect
contribution of agriculture has been more systematically applied towards estimation of macro- and
meso-level multipliers derived from social accounting matrices (SAMs). Assuming linear inter-
industry and final demand relations with no price adjustment, the key indicator that emerges is the
multiplier. This is the value of additional output generated by stimulating production in a particular
sector or group of sectors. For agriculture, indicative magnitudes of growth multipliers range from
1.9 to 2.8; the bulk of the additional rounds of spending is due to stimulation of consumption
linkages (Haggblade et al., 2007).
These estimates, though, assume that resources, particularly labour, are in perfectly elastic supply
– a rather extreme assumption. Empirical studies tend to somewhat inelastic supply responses; for
instance, a study of selected Asian countries (Bangladesh, Cambodia, China, India, Indonesia, Nepal,
Pakistan, the Philippines, Sri Lanka and Thailand) found that own-price supply elasticity can go from
as low as 0.18 (vegetables) to 0.61 (fruit), while rice is only 0.44 and maize is 0.28; the exception is
wheat, which exhibits elastic own-price response (Imai et al., 2012). In a static sense, the idea of a
perfectly elastic supply may be inaccurate. However, the idea of a “slack” in the rural economy may
make perfect sense on a more dynamic perspective. Surplus labour in rural areas need not literally
be unemployed, but rather be disguised in the form of redundant, low-productivity employment in
agriculture and some types of community and personal services. Development in agriculture accelerates
the shift of surplus labour to non-agricultural employment and to urban areas, which accounts for the
dynamic complementarity between growth in agricultural and non-agricultural sectors.
An alternative approach based on capturing more directly the interaction between agricultural
and non-agricultural sectors shows the positive growth elasticity of agriculture on non-agriculture
in both developing and developed countries (see Tiffin and Irz, 2006). A commonly cited set of
estimates lie in the range of 0.12 to 0.148 from agricultural to non-agricultural GDP for developing
countries but are negative in developed countries (Valdes and Foster, 2010). Others find that
substantial growth linkages from agriculture to non-agricultural sectors are found only in low-
income countries, e.g. in sub-Saharan Africa (Christiansen, Demery, and Kuhl, 2011).
The latter set of evidence opens the possibility that substitution rather than complementarity
may characterize the interaction between agriculture and non-agriculture, at least for certain types of
economies. Exploring the nature of this interaction at the subnational level was the motivation for the
oft-cited study of Foster and Rosenzweig (2004), which found (contra the multiplier literature) that
the rapid growth of rural industry in India occurred in areas with the lowest rates of improvements
in crop yields, consistent with a model in which industrial capital is mobile and seeks low-wage
areas (Foster and Rosenzweig, 2004). In other words, within-country rural industrialization and
agricultural development may act as substitutes rather than complements.
78
Philippines
79
Agriculture’s contribution to Asia’s natural resource and ecosystem service degradation
While growth in food production is on track to meet the growth in demand, environmental
stresses are inevitably going to emerge. It was estimated that annual global crop and livestock
production will need to increase by 60 per cent compared with 2006 levels to meet food demand
in 2050. To meet this global challenge of increasing food production by 60 per cent, approximately
80 per cent of the required increase will need to come from higher yields and 10 per cent from
increased numbers of cropping seasons per year (Alexandratos and Bruinsma, 2012; FAO, 2016).
Food production in Asia has increased at an average of 1.6 per cent since 2005, slightly ahead of
the compound growth rate of 1.4 per cent required to meet the 60 per cent increase target, and
has increased a little faster than population growth in recent decades, resulting in increased food
availability (UNESCAP, 2009). While these trends provide some reassurance in terms of food security,
they do not show the environmental costs of the intensification of Asia’s agricultural systems.
In the past 50 years, in response to the increasing food demand, agricultural productivity
has been intensified and unsustainable production systems have been employed, resulting
in dramatic environmental damage affecting the functioning quality of ecosystems. Extensive
evidence demonstrates that the intensification and industrialization of agriculture has been putting
a lot of pressure on the region’s natural resources and ecosystem services, resulting in decreased
soil productivity, depleted groundwater, decreased freshwater availability, deforestation and
forest degradation, increased pest invasions, and modified soil and freshwater salinity, ultimately
threatening sustainability and food security (Wassmann et al., 2009a; ADB, 2017).
ASIA’S AGRICULTURAL TRANSFORMATION: UNDERMINING OR FOSTERING SUSTAINABLE DEVELOPMENT?
KEY MESSAGES
Agricultural production in Asia acts as a major driver of natural resource degradation and increases in
greenhouse gas emissions. Increasing food demand, growing intensity in input use and limits to land
expansion will bring about new challenges in ensuring that food production remains both secure and
remunerative for rural people across the region.
Agriculture remains a significant driver of poverty reduction in Asia, but the way in which it reduces poverty
is now changing rapidly. Reductions in rural poverty and malnutrition are increasingly associated with
agriculture’s commercialization and the development of downstream industries rather than with the Green
Revolution model of agricultural productivity increases. In other words, the focal point of rural development
is now shifting from agriculture to agribusiness.
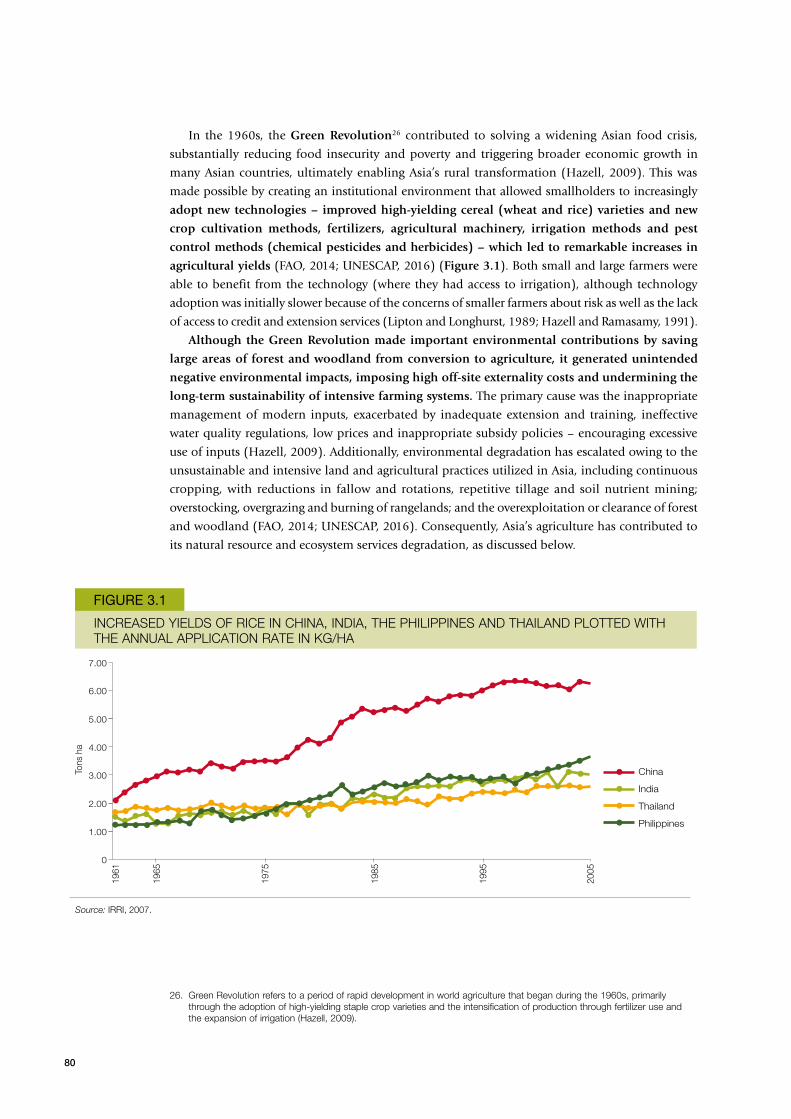
80
In the 1960s, the Green Revolution26 contributed to solving a widening Asian food crisis,
substantially reducing food insecurity and poverty and triggering broader economic growth in
many Asian countries, ultimately enabling Asia’s rural transformation (Hazell, 2009). This was
made possible by creating an institutional environment that allowed smallholders to increasingly
adopt new technologies – improved high-yielding cereal (wheat and rice) varieties and new
crop cultivation methods, fertilizers, agricultural machinery, irrigation methods and pest
control methods (chemical pesticides and herbicides) – which led to remarkable increases in
agricultural yields (FAO, 2014; UNESCAP, 2016) (Figure 3.1). Both small and large farmers were
able to benefit from the technology (where they had access to irrigation), although technology
adoption was initially slower because of the concerns of smaller farmers about risk as well as the lack
of access to credit and extension services (Lipton and Longhurst, 1989; Hazell and Ramasamy, 1991).
Although the Green Revolution made important environmental contributions by saving
large areas of forest and woodland from conversion to agriculture, it generated unintended
negative environmental impacts, imposing high off-site externality costs and undermining the
long-term sustainability of intensive farming systems. The primary cause was the inappropriate
management of modern inputs, exacerbated by inadequate extension and training, ineffective
water quality regulations, low prices and inappropriate subsidy policies – encouraging excessive
use of inputs (Hazell, 2009). Additionally, environmental degradation has escalated owing to the
unsustainable and intensive land and agricultural practices utilized in Asia, including continuous
cropping, with reductions in fallow and rotations, repetitive tillage and soil nutrient mining;
overstocking, overgrazing and burning of rangelands; and the overexploitation or clearance of forest
and woodland (FAO, 2014; UNESCAP, 2016). Consequently, Asia’s agriculture has contributed to
its natural resource and ecosystem services degradation, as discussed below.
26. Green Revolution refers to a period of rapid development in world agriculture that began during the 1960s, primarily through the adoption of high-yielding staple crop varieties and the intensification of production through fertilizer use and the expansion of irrigation (Hazell, 2009).
INCREASED YIELDS OF RICE IN CHINA, INDIA, THE PHILIPPINES AND THAILAND PLOTTED WITH THE ANNUAL APPLICATION RATE IN KG/HA
FIGURE 3.1
Source: IRRI, 2007.
Tons
ha
China
India
Thailand
Philippines
2.00
5.00
1.00
3.00
6.00
4.00
7.00
0
1961
1965
1975
1985
1995
2005

81
Agriculture-driven GHG emissionsAgriculture is responsible for a significant proportion of global GHG emissions and is consequently
an important driver of global warming. Globally, it has been estimated that the agriculture, forestry
and other land use (AFOLU) sector is responsible for 24 per cent (about 10-12 GtCO2eq/year) of
anthropogenic GHG emissions (IPCC, 2014), approximately half of which were from agricultural
production during 2000-2010 (Smith et al., 2014). In 2011, 44 per cent of agriculture-related GHG
outputs occurred in Asia, compared with 38 per cent in 1990, making the region the largest
contributor of emissions from the agricultural sector (Tubiello et al., 2014). These emissions are
mainly from deforestation, livestock, and soil and nutrient management (Figure 3.2).
Asia is the main source of enteric methane (CH4) emissions,27 accounting for 33 per cent of
the global share, and enteric methane emissions represent the greatest share of Asia’s agricultural
emissions (34 per cent) (FAOSTAT, 2014) (Figure 3.3), Asia being one of the fastest-growing meat-
consuming regions in the world with proportionate increases in GHG emissions (Gerber et al.,
2013). In Asia, total meat consumption has increased by 30 times and per capita meat consumption
by 15 times since 1961. This pronounced shift in diets towards meat and dairy products is driving
animal production in Asia, with poultry meat production rising at a faster rate than that of beef or pig
meat in the period 2000-2011 (FAO, 2014). In China, both total and per capita meat consumption
have grown by 165 per cent and 130 per cent respectively since 1990, making China a major source
of enteric emissions globally (UNEP, 2012b).
Asia also contributes a 22 per cent share of global emissions from forestry and other land use
(FOLU). Most of Asia’s FOLU emissions are from South-East Asia, where emissions from FOLU
are roughly three times the agriculture-related emissions (Tubiello et al., 2014) (Figure 3.4). This is
attributable to anthropogenic forest degradation and biomass burning (forest and peatland fires and
agricultural burning), especially in the case of Indonesia.
27. Emissions from enteric fermentation consist of methane gas (CH4) produced in digestive systems of ruminants and to a lesser extent of non-ruminants (Tubiello et al., 2014).
TOTAL GHG EMISSIONS BY ECONOMIC SECTORS IN ASIA IN 2010
FIGURE 3.2
%
Source: FAOSTAT, 20143.
11.81
20.04
15.82
34,29
Manure applied to soils
Manure management
Manure left on pastureRice cultivation
Synthetic fertilizersBurning - crop residues Burning - savanna
Cultivation of organic soilsCrop residues
Enteric fermentation
34.29
7.023.70
0.29 4.712.23
0.63

82
Agriculture-driven forest and land degradationBetween 1990 and 2006, Asia’s share in global forest sector value added increased from about 20.5 to
24.4 per cent. Most of this growth has been in the pulp and paper and wood processing subsectors,
while increases in the value added of forestry (mainly wood production from natural and planted
forests) have been relatively modest (FAO, 2011a). Dependency on wood as a source of energy is
very high in the region. In South-East Asia and South Asia, firewood accounts for 72 and 93 per cent
respectively of all harvested wood (FAO, 2010a). Improved road access has supported the growing
trade in and commercialization of non-timber forest products (NTFPs),28 fostering forest degradation
(Sodhi and Brook, 2006). In terms of total value, the region accounts for 40 per cent of the global
NTFP trade. The domestication and commercial cultivation of wild NTFPs such as bamboo or rattan
is partially attributable to decreasing forest area and the resulting decline in supply. An estimated
200 million people depend on NTFPs for income as well as for subsistence needs including
medicine, food, fuel and construction materials (FAO, 2010b).
Land-clearing practices using fire are considered the fastest and cheapest way to make land
available for new plantations, and were initially utilized because traditional methods of jhum (slash
and burn) improved the soil structure, reduced weed, pest and disease occurrence, and had a positive
fertilizer effect due to the burned ash (Ketterings et al., 1999; Ketterings, Noordwijk and Bigham,
2002) – however, there is a need to distinguish these ecologically sound jhum practices from current
unsustainable practices (Yadav, Kapoor and Sarma, 2012). Other reasons for this practice include
land tenure insecurity (Larson and Bromley, 1990), population pressure (Adesina et al., 2000) and
misguided government policies (Deacon, 1995).
28. Non-timber forest products or non-wood forest products are any product or service other than timber that is produced in forests, including fruits, nuts, vegetables, game and fish, medicinal and aromatic plants, resins, essences, barks, fibres such as bamboo and rattan, fungi and palms (http://www.cifor.org/Publications/Corporate/FactSheet/ntfp.htm).
SHARE OF GLOBAL GHG EMISSIONS FROM ENTERIC FERMENTATION (MILLION TONS OF CO2eq/YEAR)
FIGURE 3.3
%
Latin America
Middle East
Africa
Western Europe
North America
Non EU former Soviet
Australia/New Zealand
Eastern Europe
Asia
China
India
Rest of Asia
33
24
1
15
8
7 5 5 2
40
33
27
Source: UNEP, 2012b.
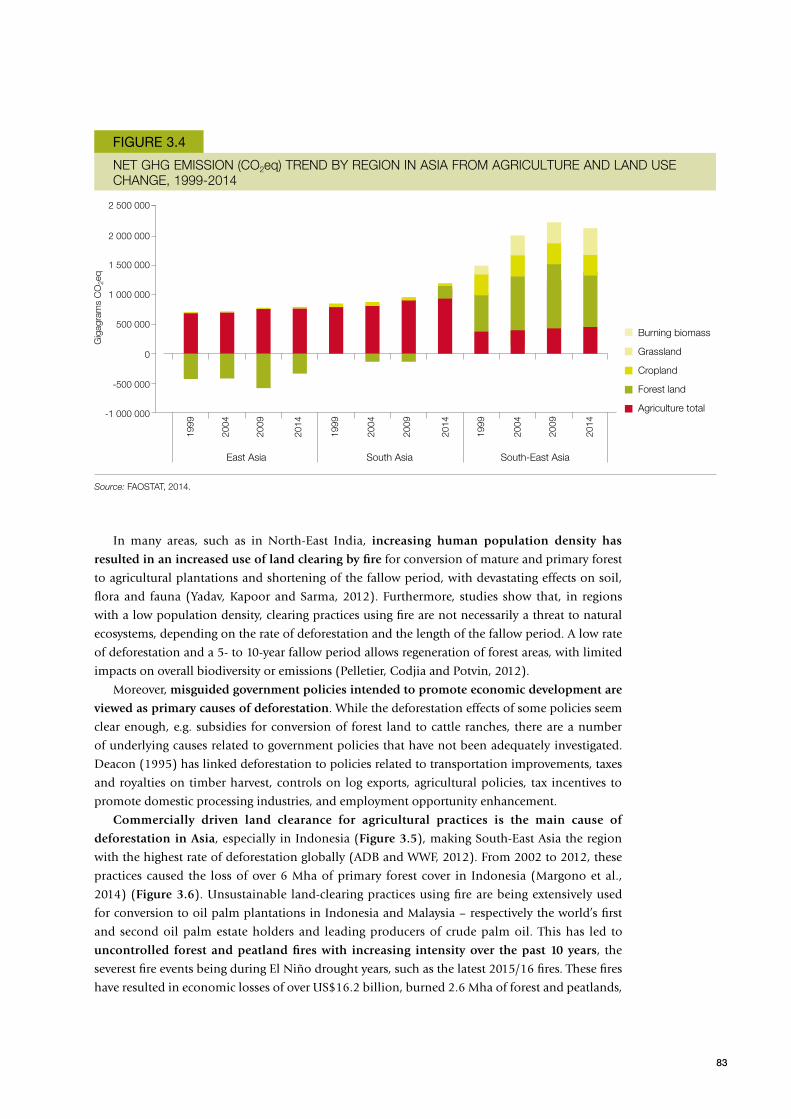
83
NET GHG EMISSION (CO2eq) TREND BY REGION IN ASIA FROM AGRICULTURE AND LAND USE CHANGE, 1999-2014
FIGURE 3.4
Gig
agra
ms
CO
2eq
Source: FAOSTAT, 2014.
Burning biomass
Grassland
Cropland
Forest land
Agriculture total
East Asia South Asia South-East Asia
0
500 000
1 000 000
2 500 000
1 500 000
-500 000
-1 000 000
2 000 000
1999
2009
1999
2009
1999
2009
2004
2014
2004
2014
2004
2014
In many areas, such as in North-East India, increasing human population density has
resulted in an increased use of land clearing by fire for conversion of mature and primary forest
to agricultural plantations and shortening of the fallow period, with devastating effects on soil,
flora and fauna (Yadav, Kapoor and Sarma, 2012). Furthermore, studies show that, in regions
with a low population density, clearing practices using fire are not necessarily a threat to natural
ecosystems, depending on the rate of deforestation and the length of the fallow period. A low rate
of deforestation and a 5- to 10-year fallow period allows regeneration of forest areas, with limited
impacts on overall biodiversity or emissions (Pelletier, Codjia and Potvin, 2012).
Moreover, misguided government policies intended to promote economic development are
viewed as primary causes of deforestation. While the deforestation effects of some policies seem
clear enough, e.g. subsidies for conversion of forest land to cattle ranches, there are a number
of underlying causes related to government policies that have not been adequately investigated.
Deacon (1995) has linked deforestation to policies related to transportation improvements, taxes
and royalties on timber harvest, controls on log exports, agricultural policies, tax incentives to
promote domestic processing industries, and employment opportunity enhancement.
Commercially driven land clearance for agricultural practices is the main cause of
deforestation in Asia, especially in Indonesia (Figure 3.5), making South-East Asia the region
with the highest rate of deforestation globally (ADB and WWF, 2012). From 2002 to 2012, these
practices caused the loss of over 6 Mha of primary forest cover in Indonesia (Margono et al.,
2014) (Figure 3.6). Unsustainable land-clearing practices using fire are being extensively used
for conversion to oil palm plantations in Indonesia and Malaysia – respectively the world’s first
and second oil palm estate holders and leading producers of crude palm oil. This has led to
uncontrolled forest and peatland fires with increasing intensity over the past 10 years, the
severest fire events being during El Niño drought years, such as the latest 2015/16 fires. These fires
have resulted in economic losses of over US$16.2 billion, burned 2.6 Mha of forest and peatlands,
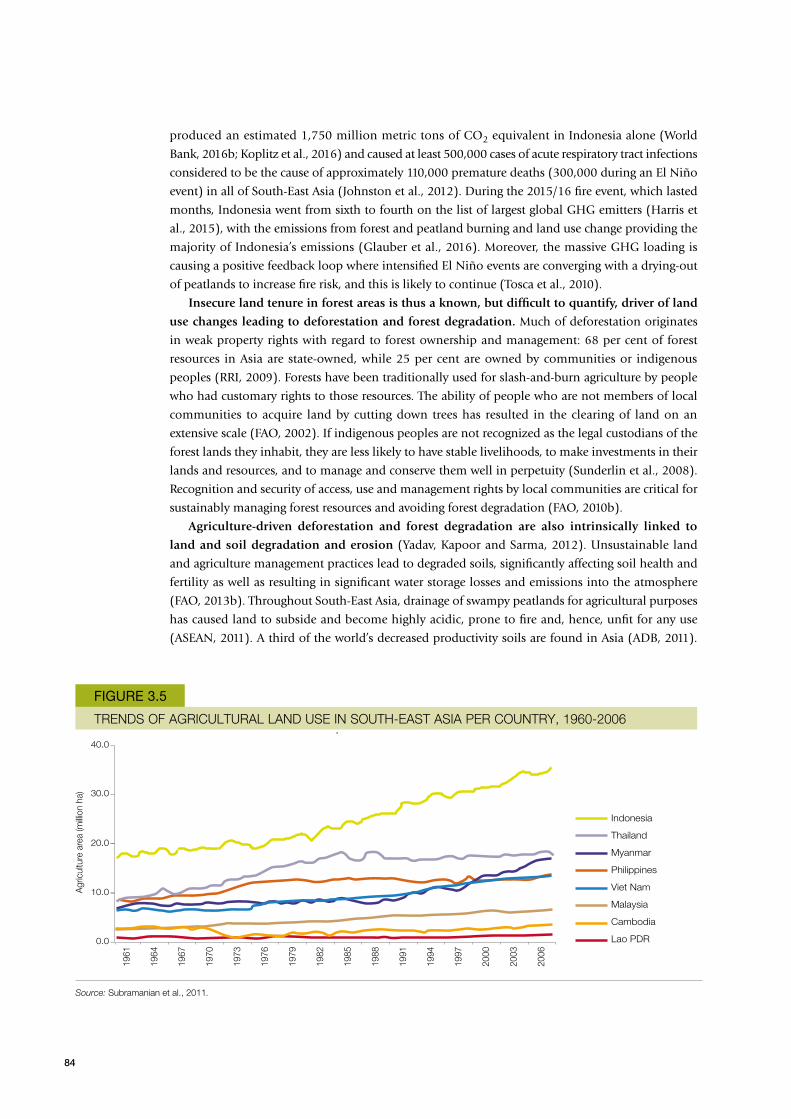
84
produced an estimated 1,750 million metric tons of CO2 equivalent in Indonesia alone (World
Bank, 2016b; Koplitz et al., 2016) and caused at least 500,000 cases of acute respiratory tract infections
considered to be the cause of approximately 110,000 premature deaths (300,000 during an El Niño
event) in all of South-East Asia (Johnston et al., 2012). During the 2015/16 fire event, which lasted
months, Indonesia went from sixth to fourth on the list of largest global GHG emitters (Harris et
al., 2015), with the emissions from forest and peatland burning and land use change providing the
majority of Indonesia’s emissions (Glauber et al., 2016). Moreover, the massive GHG loading is
causing a positive feedback loop where intensified El Niño events are converging with a drying-out
of peatlands to increase fire risk, and this is likely to continue (Tosca et al., 2010).
Insecure land tenure in forest areas is thus a known, but difficult to quantify, driver of land
use changes leading to deforestation and forest degradation. Much of deforestation originates
in weak property rights with regard to forest ownership and management: 68 per cent of forest
resources in Asia are state-owned, while 25 per cent are owned by communities or indigenous
peoples (RRI, 2009). Forests have been traditionally used for slash-and-burn agriculture by people
who had customary rights to those resources. The ability of people who are not members of local
communities to acquire land by cutting down trees has resulted in the clearing of land on an
extensive scale (FAO, 2002). If indigenous peoples are not recognized as the legal custodians of the
forest lands they inhabit, they are less likely to have stable livelihoods, to make investments in their
lands and resources, and to manage and conserve them well in perpetuity (Sunderlin et al., 2008).
Recognition and security of access, use and management rights by local communities are critical for
sustainably managing forest resources and avoiding forest degradation (FAO, 2010b).
Agriculture-driven deforestation and forest degradation are also intrinsically linked to
land and soil degradation and erosion (Yadav, Kapoor and Sarma, 2012). Unsustainable land
and agriculture management practices lead to degraded soils, significantly affecting soil health and
fertility as well as resulting in significant water storage losses and emissions into the atmosphere
(FAO, 2013b). Throughout South-East Asia, drainage of swampy peatlands for agricultural purposes
has caused land to subside and become highly acidic, prone to fire and, hence, unfit for any use
(ASEAN, 2011). A third of the world’s decreased productivity soils are found in Asia (ADB, 2011).
TRENDS OF AGRICULTURAL LAND USE IN SOUTH-EAST ASIA PER COUNTRY, 1960-2006
FIGURE 3.5
Source: Subramanian et al., 2011.
Agr
icul
ture
are
a (m
illion
ha)
20.0
10.0
30.0
40.0
0.0
Indonesia
Thailand
Myanmar
Philippines
Viet Nam
Malaysia
Cambodia
Lao PDR
1961
1964
1967
1970
1973
1976
1979
1982
1985
1988
1991
1994
1997
2000
2003
2006

85
Severe degradation in 75 per cent of agricultural land has been registered in South and South-
East Asia. In India, the Lao PDR, Myanmar, the Philippines, Sri Lanka, Thailand and Viet Nam,
37 per cent of degraded soil is due to agricultural practices (UNESCAP, 2009). The desertification
risk that exists in many Asian countries is mainly a result of large-scale intensive monocultures. For
example, intensive rice monocultures have contributed to India’s and Pakistan’s high desertification
risk of 72 and 100 per cent respectively (FAO, 2003). With about 850 million hectares in the region
affected by some form of land degradation, the quality and quantity of arable land are continuing to
deteriorate, affecting a large swathe of the population (Bai et al., 2008; Howes and Wyrwoll, 2012).
Of critical importance is the threat to sustainable agriculture and food security due to land
degradation. To meet basic needs, smallholders and the rural poor growing annual food crops
such as maize have been pushed into using ecologically fragile areas and forced to grow crops
intensively on steep slopes vulnerable to erosion. For example, in Fiji, sugar cane plantations on
sloping land in locations that receive high-intensity rainfall cause extensive soil erosion and yield
declines (Ram et al., 2007).
Agriculture-driven freshwater degradationIntensive agricultural development negatively affects the water resources of the region. In Asia,
agriculture is the main reason for freshwater extraction, accounting for 70 per cent of yearly
average water withdrawals (over 90 per cent of total water withdrawals in South Asian countries),
compared with just 20 per cent in Europe (UNESCAP, 2014) (Figure 3.7). For example, agriculture
represents 98 per cent of water abstraction in Nepal, 94 per cent in Pakistan and Bhutan, and
90 per cent in India (World Bank, 2013a). This has resulted in depleted aquifers, with groundwater
withdrawals exceeding natural replenishment rates, particularly in South Asia – where groundwater is
a major source for irrigation – and China, and reduction in flow of major rivers such as the Ganges,
Yellow River, Amu Darya, Syr Darya and Chao Phraya (World Bank, 2007; Shah, 2009). However,
agricultural productivity remains significantly low, often because of the inefficiency of irrigation
systems and water wastages. This is also attributable to the fact that Asia’s main staple food, rice,
requires two or three times more water for cultivation than other cereals. Moreover, demand for food
and animal feed crops is predicted to grow by 70-100 per cent over the next 50 years (ADB, 2013a).
ANNUAL PRIMARY FOREST COVER LOSS FOR INDONESIA AS A WHOLE AND PER ISLAND GROUP, 2000-2012
FIGURE 3.6
Source: Margono et al., 2014.
Are
a (m
illion
ha)
0.4
0.2
0.6
0.8
0
0.5
0.3
0.7
0.9
0.1
Indonesia
Sumatra
Kalimantan
Papua
Sulawesi
Maluku
Java and Bali
Nusa Tenggara
2001
2002
2003
2004
2005
2006
2007
2008
2009
2010
2011
2012

86
Water use for livestock production is projected to increase by 50 per cent by 2025 and increasing
meat consumption has been identified as the main cause of the worsening water scarcity in China
(Liu, Yang and Savenije, 2008).
Government policies in Asia have not helped to improve water use efficiency. In many
developing countries, governments provide irrigation systems, along with fuel and electricity supplies,
at subsidized rates to support agricultural development, tempting farmers to extract too much water
from rivers, overpump groundwater and generally waste freshwater resources through inefficient and
ineffective application on crops. For example, during the last 40 years in India, the governments of
Rajasthan, Haryana and Punjab supported irrigation agriculture by subsidizing diesel and electricity.
With irrigation encouraged by low costs, groundwater levels dropped dramatically and, in some parts
of Rajasthan, wells dried up completely. Farmers, especially smallholders, rarely have the financial
resources and information to invest in relatively expensive water-saving technologies in response,
such as drip irrigation infrastructure or storage (UNESCAP, 2009; Howes and Wyrwoll, 2012).
Furthermore, the contamination and degradation of surface and groundwater resources is
growing owing to agricultural overextraction and high levels of pollution (UNESCAP, 2009),
especially in South-East Asia, where agriculture-driven deterioration of rivers is threatening the
livelihoods of tens of millions of people. Water contamination through saltwater intrusion inland
from rising sea levels and reduced river flow is disrupting the supply of potable water to thousands of
households, increasing soil salinity and constraining agricultural production, such as in the Mekong
Delta and low-lying islands of the Pacific (ADB, 2013a). Viet Nam’s rice sector is under threat from
climate change, and soil and water salinization, as rice is very vulnerable to salt stress in its early stage
of growth. During the 2015/16 cropping season, El Niño caused the worst salinity issues in the past
century, resulting in severe damages to rice crops and harvest reduction by 4 per cent below 2015 levels.
FRESHWATER WITHDRAWALS BY AGRICULTURE AS PERCENTAGE OF TOTAL WITHDRAWALS, 2000-2010
FIGURE 3.7
Source: FAO, 2014.
%
Afg
hani
stan
Nep
al
Viet
Nam
Bhu
tan
Cam
bodi
a
Pak
ista
n
Lao
PD
R
Tim
or-L
este
Indi
a
Thai
land
Mya
nmar
Ban
glad
esh
Sri
Lank
a
Phi
lippi
nes
Indo
nesi
a
Kor
ea, D
PR
90
80
100
70
95
85
75

87
It was estimated that 15 per cent of the high-yielding rice paddies in the Mekong River Delta are at
high risk of saltwater intrusion during dry season, and Viet Nam could even become a net importer
if it fails to properly address this salinization issue, which in turn would impact South-East Asia’s
overall food supply (OECD and FAO, 2017). The steady increase in inland aquaculture, due in part
to farmers who no longer want to pursue agriculture, also contributes to the contamination of water
resources. Some aquaculture enterprises, such as intensive shrimp farms, can render land too saline
to ever be used for agriculture again (FAO, 2010c).
Additionally, Asia is the largest consumer of fertilizers in the world, and it is estimated
that the demand for fertilizer will grow by 1.7 per cent during 2014-2018. Total fertilizer nutrient
consumption in Asia accounts for 58.5 per cent of the world total, the bulk of which is in East
Asia and South Asia (FAO, 2015b). Specifically, since 1980, fertilizer consumption per hectare
in Indonesia, Malaysia and China has more than doubled, whereas consumption has increased
more than threefold in Bangladesh, India and Pakistan, and fourfold in Thailand and Viet Nam
(FAOSTAT, 2014) (Figure 3.8). India and China, currently the largest users of water for irrigation
purposes, have seen their surface water quality diminishing owing to eutrophication and pesticide
and nitrate contamination. In China, 60 per cent of nitrate and phosphate loads in surface water is
attributable to excessive fertilizer application rates, and 70 per cent of lakes and reservoirs exhibit
excessive eutrophication levels. In some regions of India, such as Punjab, excess nitrogen application
rates have been linked to groundwater nitrate pollution, and an average groundwater nitrate
level exceeding the WHO guideline limit for nitrate in drinking water29 was recorded in 11 states
(Novotny et al., 2010).
Agriculture-driven degradation of coastal and marine ecosystemsCoastal and marine environments have been considerably degraded by pollution from land-based
aquaculture and agriculture waste and runoff. Significant contributions to aquatic pollution from
agricultural sources are made by a few Asian countries with higher agricultural crop productions,
for example Bangladesh, India, Myanmar, Indonesia and China (Islam and Tanaka, 2004). About
9,000 metric tons of different pesticides and more than 2 million metric tons of fertilizers are used
annually in Bangladesh and at present about 1,800 tons per year of pesticide residues are added to
the coastal waters through runoff. Similar figures can be expected from India, Myanmar, Indonesia
and China. Sediment load in the coastal zones of South Asia is also high, mainly as a result of soil
erosion caused by poor land-use practices on coastlines (UNESCAP, 2005; Jha, 2005).
Aquaculture is the fastest-growing food sector in the world and is projected to account for
57 per cent of total fish production for human consumption by 2022 (FAO, 2014) (Figure 3.9). This
trend is mostly due to the major deficit in wild-capture fish production resulting from overfishing
to meet growing demand and ocean acidification (UNEP, 2006). In South and South-East Asian
countries, the increasing popularity of aquaculture has led to land degradation in coastal areas once
that land is abandoned (UNESCAP, 2009). Aquaculture enterprises, especially coastal and inland
shrimp farms, heavily contribute to the contamination of water resources and can render land too
saline for any uses (FAO, 2010c). Shrimp ponds use copious amounts of artificial feed, pesticides,
chemical additives and antibiotics, and when the wastewater, which also has shrimp excrement
and is high in organic matter, is pumped into the surrounding environment it pollutes coastal
waterways and groundwater, poisoning native flora and fauna and making alternative cropping
nearly impossible (UNESCAP, 2009).
29. WHO guideline limit for nitrate in drinking water: 50 mg NO3 L-1 (Novotny et al., 2010).

88
Furthermore, in South-East Asia, 50-80 per cent of the depletion of mangrove inter-tidal areas is
due to conversion to aquaculture ponds, most commonly for shrimp farms (FAO, 2010b). Mangroves
provide a multitude of important ecosystem services, including carbon storage, salinity regulation,
nutrient cycling and fish habitat provision. Indonesia, particularly in Sumatra and Borneo, and
Myanmar, particularly in Rakhine state, are two of the countries with the largest loss of mangrove
area globally during 2000-2010 (FAO, 2010b). Cambodia, Indonesia and the Philippines are currently
hotspots of aquaculture-driven mangrove conversion, where aquaculture production is projected to
expand by 47, 37 and 25 per cent respectively over the next decade, especially in coastal areas. Rice
production expansion accounted for much of Myanmar’s mangrove conversion from 2000 to 2012,
whereas in Malaysia and Indonesia it is attributable to palm oil plantations (OECD and FAO, 2017).
FERTILIZER CONSUMPTION TRENDS IN 10 MAJOR ASIAN USER COUNTRIES, 1979-2014
FIGURE 3.8
Tons
(NP
K) p
er h
ecta
res
of a
rabl
e an
d pe
rman
ent c
ropl
and
50
100
150
200
250
0
300
350
10
20
30
40
50
0
60
70
Source: FAOSTAT, 2014.Note: NPK = nitrogen fertilizers (N total nutrients) + phosphate fertilizers (P2O5 total nutrients) + potash fertilizers (K2O total nutrients).
1989-19941994-19991999-20042004-20092009-2014
1979-19841984-1989
CHN BGD IND LKA PAK IDN MYS PHL THA VNM
AQUACULTURE FISH PRODUCTION PER CAPITA IN ASIA, BY SUBREGION, 2000-2011
FIGURE 3.9
Source: FAO, 2014.
Aqu
acul
ture
fish
pro
duct
ion
per c
apita
(kg/
cap)
East Asia
South and South-West Asia
South-East Asia
Pacific Islands
Asia and the Pacific
Developed countries
2000
2001
2002
2003
2004
2005
2006
2007
2008
2009
2010
2011
89
Most agriculture-driven environmental challenges discussed here will be further compounded
by climate change, affecting farmers both directly through extreme weather events and indirectly
through the effect of a changing climate on a fragile ecological landscape. For smallholder farmers
generally, climate change impacts will further aggravate the stresses already associated with
subsistence production, such as isolated location, small farm size, informal land tenure, low levels
of technology and narrow employment options (ABD, 2013; IFAD, 2008). Activities at the margin
of climatic suitability will be the most affected by climate change, such as subsistence farming under
severe water stress in semi-arid regions of South Asia (IPCC, 2014).
From agriculture’s to agribusiness’s role in poverty and malnutrition reduction
The role of agriculture in reducing poverty in Asia remains significant because of its continuing
role as a source of livelihood for many rural poor. First, extreme poverty remains concentrated
in rural areas. As shown in the first chapter, the rural share of the extreme poor remains above
90 per cent in China and Viet Nam, above 80 per cent in Cambodia, Bangladesh and Sri Lanka,
and above 70 per cent in India, Nepal, the Lao PDR and the Philippines. Second, the vast majority
of agricultural workers in Asia remain either landless or smallholders, residing on small plots of
land that are cultivated part- or full-time. Chapter 2 highlighted that the steady decline in average
farm size across developing Asian countries has slowed down and even reversed in recent years,
but a majority of the region’s agricultural population farms less than 1 hectare of land apiece,
including over 90 per cent of farmers in China, over 80 per cent in Nepal and Viet Nam, and over
60 per cent in India and Indonesia. Owners of large farms make up fewer than 5 to 10 per cent
of agricultural land owners/operators in almost every Asian country (FAO, 2010d).30 Even if the
relationship between agricultural income and poverty reduction is weakening, the vast majority of
smallholders in Asia rely on working small plots of land, either as a significant source of income or
as a marginal activity that absorbs non-agricultural income shocks.
Nevertheless, although poverty remains concentrated in rural areas, it has declined
significantly as a direct result of past broad-based agricultural growth – growth that was made
possible by the Green Revolution. In Asia, the spread of the Green Revolution led to a sustained
increase in yields that far outpaced performance in other parts of the world. Between 1965 and
1980, cereal yields grew by an average annual rate of 3.1 per cent in East Asia, 2.7 per cent in
South Asia and 2.4 per cent in South-East Asia, compared with an average of 1.4 per cent in LDCs
globally (FAO, 2017).31 Scientists and farmers also began to apply yield-improving techniques and
technologies to higher-value products beyond cereals, including vegetables, fruits and plantation
crops. Between 1980 and 2004, Asian economies contributed more than two thirds of the total
growth in the world’s agricultural sector, growing at an average of 2.8 per cent yearly compared with
a global average of 2.6 per cent (Dethier and Effenberger, 2012). Deliberate and targeted policies
drove this growth. More so than governments in other regions of the world, Asian governments
provided significant public support and investment towards research and development (R&D), the
proliferation of new seed varieties, and the affordable provision of irrigation and fertilizers – often
through heavy use of subsidies (Hazell, 2009; Dethier and Effenberger, 2012).
30. Here, agricultural censuses generally define large farms as possessing over 10 hectares of land. Indonesia represents an exception to the low prevalence of large farms. There, they make up around 12 per cent of the total, primarily owing to the expansion of plantations.
31. A category of low-income states that is regularly defined and updated by the United Nations Economic and Social Council.
90
The Green Revolution also precipitated a profound shift in how economists and development
thinkers characterized agriculture within the greater development process. Early development
literature viewed agriculture in the initial stages of growth as a repository for low-productivity,
surplus labour. During the early stages of development, agricultural growth would facilitate the
transfer of this labour supply to higher-productivity urban industry and service sectors (Lewis, 1954;
Ranis and Fei, 1961). Beyond direct improvements to agricultural productivity and smallholder
incomes, another strand of research demonstrated that agricultural growth shares an important
set of production and consumption linkages with other sectors in the economy. Backward and
forward production linkages develop, respectively, as farmers include commercial inputs, employ
machinery and hire external services in their production processes and as agricultural output
itself becomes an input into post-harvest and downstream transformation processes along supply
chains in which both manufacturing and services businesses are involved. Commercialization of
agriculture in this regard reinforces production linkages with services and the broader industry. It
sparks the transformation of agriculture by increasing agricultural labour productivity and freeing
up capital and labour necessary for direct investment in rural and urban services. Consumption
linkages, on the other hand, appear when higher farm incomes lead to an increased demand for
consumer goods and non-tradeable services produced in rural areas. Through the combined effect
of production and consumption linkages, agricultural growth may generate a sizeable “multiplier
effect” on economic growth as a whole (Johnston and Mellor, 1961; Adelman, 1984; Timmer, 2008;
Dethier and Effenberger, 2012; Barrett et al., 2010).
A large number of empirical studies confirm that, during and after the Green Revolution,
agricultural growth has both directly and indirectly spurred income growth and poverty reduction,
and especially so in Asia. At the broadest level, productivity growth in agriculture has a strongly
positive impact on poverty reduction in low- and lower-middle-income Asian economies, while
productivity growth in industry and services does not.32 One study in particular estimates that,
through both direct effects on income and indirect effects on other sectors, agricultural productivity
growth is 3.2 times more effective at reducing extreme poverty in low-income countries than
growth in other sectors. This relationship is mediated by the higher participation of poor people
in agriculture and, as such, it disappears at higher income levels and at higher poverty thresholds
(Christiaensen, Demery and Kuhl, 2010).
The connection between agricultural productivity growth and the participation of poor people
in agriculture is especially relevant in Asia. Across Asian countries, elasticities of agricultural labour
productivity and poverty reduction have been historically quite high, because the Green Revolution
has enabled a form of intensification and rapid growth that itself absorbed surplus labour (Janvry
and Sadoulet, 2009). As agricultural land productivity grew at a faster rate than agricultural labour
productivity, agricultural sectors across Asia were able to maintain high growth rates while remaining
labour intensive, raising rural incomes and strengthening important linkages with other rural sectors.
As the agricultural transformation process continues, and the majority of Asian
countries move up the development ladder, the relationship between agricultural growth
and poverty reduction will become less and less direct. Two important components of the
agricultural transformation process underlie this shift. First, agricultural sectors as shares of
GDP are shrinking across every developing country in Asia. The agricultural sectors of these
countries have grown at slower paces than those of services and industry. Correspondingly,
agriculture has contributed less and less to both total GDP and total GDP growth (Figure 3.10).
32. See Ravallion and Datt’s (1996) seminal study on India as well as Thirtle, Lin and Piesse (2003). Bresciani and Valdés (2007) provide a broad review of the existing empirical evidence on the importance of agricultural growth in poverty reduction. See Sumarto and Suryahadi (2007) on Indonesia, and Balisacan et al. (2010) on the Philippines.
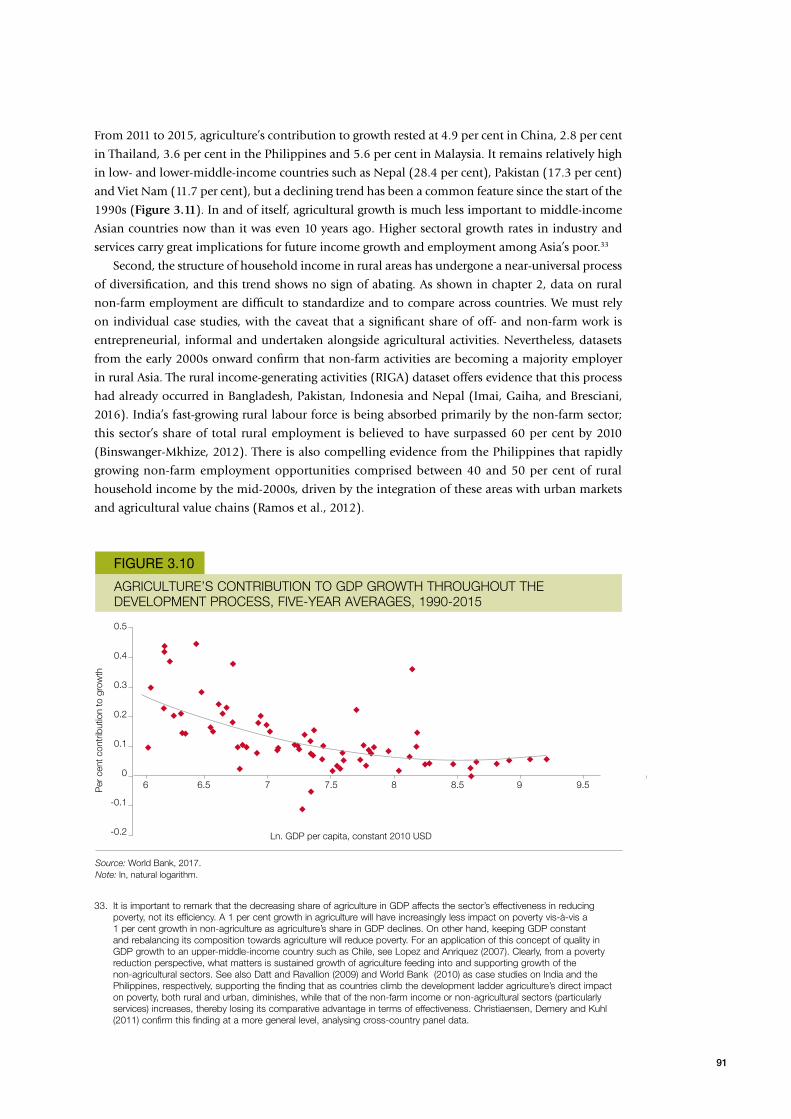
91
33. It is important to remark that the decreasing share of agriculture in GDP affects the sector’s effectiveness in reducing poverty, not its efficiency. A 1 per cent growth in agriculture will have increasingly less impact on poverty vis-à-vis a 1 per cent growth in non-agriculture as agriculture’s share in GDP declines. On other hand, keeping GDP constant and rebalancing its composition towards agriculture will reduce poverty. For an application of this concept of quality in GDP growth to an upper-middle-income country such as Chile, see Lopez and Anriquez (2007). Clearly, from a poverty reduction perspective, what matters is sustained growth of agriculture feeding into and supporting growth of the non-agricultural sectors. See also Datt and Ravallion (2009) and World Bank (2010) as case studies on India and the Philippines, respectively, supporting the finding that as countries climb the development ladder agriculture’s direct impact on poverty, both rural and urban, diminishes, while that of the non-farm income or non-agricultural sectors (particularly services) increases, thereby losing its comparative advantage in terms of effectiveness. Christiaensen, Demery and Kuhl (2011) confirm this finding at a more general level, analysing cross-country panel data.
From 2011 to 2015, agriculture’s contribution to growth rested at 4.9 per cent in China, 2.8 per cent
in Thailand, 3.6 per cent in the Philippines and 5.6 per cent in Malaysia. It remains relatively high
in low- and lower-middle-income countries such as Nepal (28.4 per cent), Pakistan (17.3 per cent)
and Viet Nam (11.7 per cent), but a declining trend has been a common feature since the start of the
1990s (Figure 3.11). In and of itself, agricultural growth is much less important to middle-income
Asian countries now than it was even 10 years ago. Higher sectoral growth rates in industry and
services carry great implications for future income growth and employment among Asia’s poor.33
Second, the structure of household income in rural areas has undergone a near-universal process
of diversification, and this trend shows no sign of abating. As shown in chapter 2, data on rural
non-farm employment are difficult to standardize and to compare across countries. We must rely
on individual case studies, with the caveat that a significant share of off- and non-farm work is
entrepreneurial, informal and undertaken alongside agricultural activities. Nevertheless, datasets
from the early 2000s onward confirm that non-farm activities are becoming a majority employer
in rural Asia. The rural income-generating activities (RIGA) dataset offers evidence that this process
had already occurred in Bangladesh, Pakistan, Indonesia and Nepal (Imai, Gaiha, and Bresciani,
2016). India’s fast-growing rural labour force is being absorbed primarily by the non-farm sector;
this sector’s share of total rural employment is believed to have surpassed 60 per cent by 2010
(Binswanger-Mkhize, 2012). There is also compelling evidence from the Philippines that rapidly
growing non-farm employment opportunities comprised between 40 and 50 per cent of rural
household income by the mid-2000s, driven by the integration of these areas with urban markets
and agricultural value chains (Ramos et al., 2012).
AGRICULTURE’S CONTRIBUTION TO GDP GROWTH THROUGHOUT THE DEVELOPMENT PROCESS, FIVE-YEAR AVERAGES, 1990-2015
FIGURE 3.10
Per
cen
t con
trib
utio
n to
gro
wth
Ln. GDP per capita, constant 2010 USD
Source: World Bank, 2017.Note: ln, natural logarithm.
-0.2
-0.1
0
0.1
0.2
0.3
0.4
0.5
6 6.5 7 8 8.5 97.5 9.5
92
Declining farm sizes and declining commodity prices share a positive relationship with
propensity to engage in off- and non-farm work. Most empirical studies confirm that a household’s
ability to benefit from the non-farm economy generally depends on initial wealth, asset ownership
and access to quality education (Briones, 2016). However, there is now compelling evidence that
highly impoverished and marginal areas have witnessed the fastest growth in the relative importance
of non-farm work to total household income. For example, non-farm sources of income were
found to comprise larger shares in total marginalized areas of north-east Thailand, Bangladesh,
the Philippines and Tamil Nadu, India. Surprisingly, all these areas experienced a common trend
in employment diversification and rapid income growth precisely because a lack of agricultural
competitiveness incentivized branching out into other areas of work (Otsuka, 2013). In other words,
the drivers of poverty reduction are rapidly changing in accordance with changing comparative
advantages in agricultural production and the integration of lagging rural areas into the structural
transformation process.
Despite its decline as a share of GDP and of household income, the agricultural sector remains
a significant driver of rural income growth and poverty reduction because of the increased
importance of forward and backward linkages with other sectors. Chapter 2 demonstrated that,
during the growth process, agrifood manufacturing and processing become larger and larger relative
to the size of the agricultural sector. While agricultural production in and of itself may become a
smaller and smaller component of economic activity, the industries with which it has upstream and
downstream linkages remain significant. At the level of individual value chains, these trends imply
that a larger and larger share of agricultural GDP becomes “commercialized” in response to the
growing demand for food from urban areas and from households that do not have access to land.
Commercialization in this context carries important implications for smallholders, who are faced
with a new set of costs and incentives for changing cropping patterns, adopting new technologies
and input mixes, and working through new organizational forms such as contract farming (Reardon,
Timmer and Minten, 2012; Reardon and Timmer, 2014; Barrett et al., 2012).
An empirical study commissioned specifically for this outlook examines the impacts of three
different measures of commercialization among smallholders on poverty reduction and changes in
income inequality across a panel of Asian countries. These three measures comprise:
1. the diversification of agricultural production out of cereals;
2. the growth in linkages from agricultural production to downstream food processing;
3. integration into international markets.
Three important findings emerge from this exercise. First, if the ratio of commercialized output
is associated with an increase of 1 per cent, agricultural value added per capita will increase by
0.47 per cent the next year, corresponding to a 1.22 per cent reduction in poverty the next year.34
A similar pattern of results on rural poverty is obtained with the product diversity index. Second,
if the ratio of commercialized output is associated with an increase of 1 per cent, agricultural
value added per capita will increase by 0.47 per cent the next year, corresponding to 1.22 per cent
reduction in poverty the next year.35 Third, agricultural growth also reduces urban poverty in terms
of the share of poor people, depth of urban poverty and inequality among the urban poor.36
34. Based on the mean value of rural poverty headcount (e.g. 20 % to 19.76 % = 20 % - 20 x 1.22 %). 35. Based on the mean value of rural poverty headcount (e.g. 20 % to 19.76 % = 20 % - 20 x 1.22 %).36. Poverty depth is based on the poverty gap index; inequality among the poor is instead based on the squared poverty gap
index, a weighted sum of poverty gaps where the weights are the proportionate poverty gaps themselves.
93
37. One channel through which agriculture reduces child undernutrition is the income effect. If this involves higher female earnings, this reinforces the income effect through better food for children.
38. See UNESCAP (2016), which traces the current baseline of Asian countries in the SDG agenda and identifies through a consultative approach areas where progress is on track, where acceleration is needed and where there is a demand for an inversion of trends.
For instance, a 1 per cent increase in agricultural value added is associated with a 2.73 per cent decrease
in the poverty headcount ratio. Agricultural growth tends to reduce child underweight prevalence: a
1 per cent increase in agricultural value added is associated with a reduction in child underweight
prevalence of 0.89 per cent.37
It is therefore the very nature of agriculture’s transformation that mediates the sector’s impact on
poverty and undernutrition across Asian countries. Beyond and above agriculture’s GDP growth, it is
agriculture’s very transformation that leads to a discrete impact on poverty and undernourishment.
What role for agriculture and smallholders in the realization of Agenda 2030?
The achievement of the 17 Sustainable Development Goals under Agenda 2030 has become a
powerful long-term driver of development policy across the whole of Asia. The SDGs not only carry
forward the unfinished MDGs agenda but also address the additional challenges of inclusiveness,
equity, urbanization and environment sustainability. Further, the SDGs call for greater cooperation
and partnerships in the process of development, including a decisive role for the private sector and
civil society organizations (CSOs). As SDGs are universal in character, they need to be adapted to
national contexts, according to specific sets of constraints and opportunities, and therefore become
more attuned to national self-determination.
Although Asia has been an early achiever in meeting targets such as reducing poverty, attaining
gender parity in education and reducing prevalence of deadly diseases, progress has been slow for
other targets such as reducing hunger, increasing school completion rates, improving child and
maternal health, and improving basic sanitation. A recent review of Asia’s current achievements38
shows that meeting the SDGs will require an inversion of trends in areas such as renewable energy,
GDP growth in LDCs, labour productivity and share of labour in national income, material
footprint, and degradation and erosion of natural forest areas. An acceleration of progress is needed
in areas such as agricultural investments and food production, undernourishment, employment,
inclusion of youth and women, the share of manufacturing in total GDP, CO2 emissions reduction,
R&D investments and upgrading of urban slums.
To achieve the SDGs, and work on the unfinished MDGs, Agenda 2030 suggests several drivers
pertaining to inclusiveness and those that call for investments in institutions. While the scope
and interrelatedness of such drivers indeed resemble those of the SDGs, the transformation of
agriculture and of the rural economy could play four significant roles in realizing the goals of
Agenda 2030. First, closing the labour productivity gap between agriculture and the rest of the
economy will help accelerate overall growth, realize the demographic dividend and reduce the
risk of a middle-income trap. Second, a growing supply of nutritious and safe food at stable prices
will contribute to an enabling environment for industrialization, attract investments and provide a
fundamental contribution to the eradication of malnutrition and the improvement of health. Third,
more opportunities for rural employment will help reduce disparities, manage the urban transition,
prevent downward flexibility of real rural wages and reduce dependence on social transfers.

94
Fourth, climate-smart and resilient agriculture will contribute to food systems’ long-term
competitiveness and environmental quality. From this perspective, a successful agricultural and
rural transformation is one that delivers on food price stability, improving diversity and quality
of food, a closing gap in labour productivity, growing and remunerative rural employment, and a
reversal in natural resource and ecosystem services degradation.
Yet, although the transformation of agriculture and the rural economy has the potential to raise
the pace of progress towards the SDG, its realization will require shaping the agricultural and rural
development policy agenda towards fundamental choices. Of paramount importance is the role
that agricultural and rural development policies assign to smallholder agriculture in contributing
and benefiting from a successful agricultural and rural transformation. The World Development
Report 2008 (World Bank, 2008) assigned importance to smallholder agriculture as a pathway out
of poverty. The argument was that stimulating agricultural growth is “vital for stimulating growth
in other parts of the economy” and that smallholders are at the core of this strategy. In fact, the
pervasiveness of smallholder participation in high-value food chains – especially in vegetables and
fruits, milk and dairy products and meat – is much higher than generally expected. But there are
barriers, too, that need to be overcome: lack of access to technology, credit markets, economies of
scale in marketing and ways of meeting stringent food quality standards. Central to this vision is
the inculcation of entrepreneurial skills among smallholders – especially young men and women –
making sure that land, labour, credit and output markets function more efficiently.
Given their sheer number and dominant role in agriculture, smallholders in Asia will be critical to
achieving many SDGs and targets on time, despite the many challenges they face. Figure 3-12 offers
a schematic view of policy interventions, gains to smallholders and other disadvantaged groups
(including women and indigenous peoples) and particular SDGs (see Nwanze and Fan, 2016).
Smallholders have the potential to contribute to the attainment of the SDGs related to poverty
alleviation, education, gender equality, water use, energy use, economic growth and employment,
sustainable consumption and production, and ecosystem management, including a reduction in
GHG emissions and the preservation of biodiversity. Smallholders also often produce higher output
per unit of land than large farms, reducing pressure for agricultural land expansion. In fact, enabling
a shift from traditional subsistence farming to high-value, climate-smart and nutrition-driven
agriculture for smallholders will help the attainment of several SDGs (1, 2 and 13).
Crucial to this shift are sustained policy, institutional support and sufficient investments in
key areas, including financial facilities and risk management tools, knowledge and technical skills,
market access and social safety nets for smallholders. Further, in pursuit of the SDGs, Asian countries
must adopt context-specific policies that are inclusive of all smallholders, including women, youth
and indigenous peoples. Women tend to be more disadvantaged in terms of ownership of assets,
access to credit and new technologies. Despite the emergence of high-value chains in rural areas, the
young tend to abandon agriculture and seek jobs in cities.
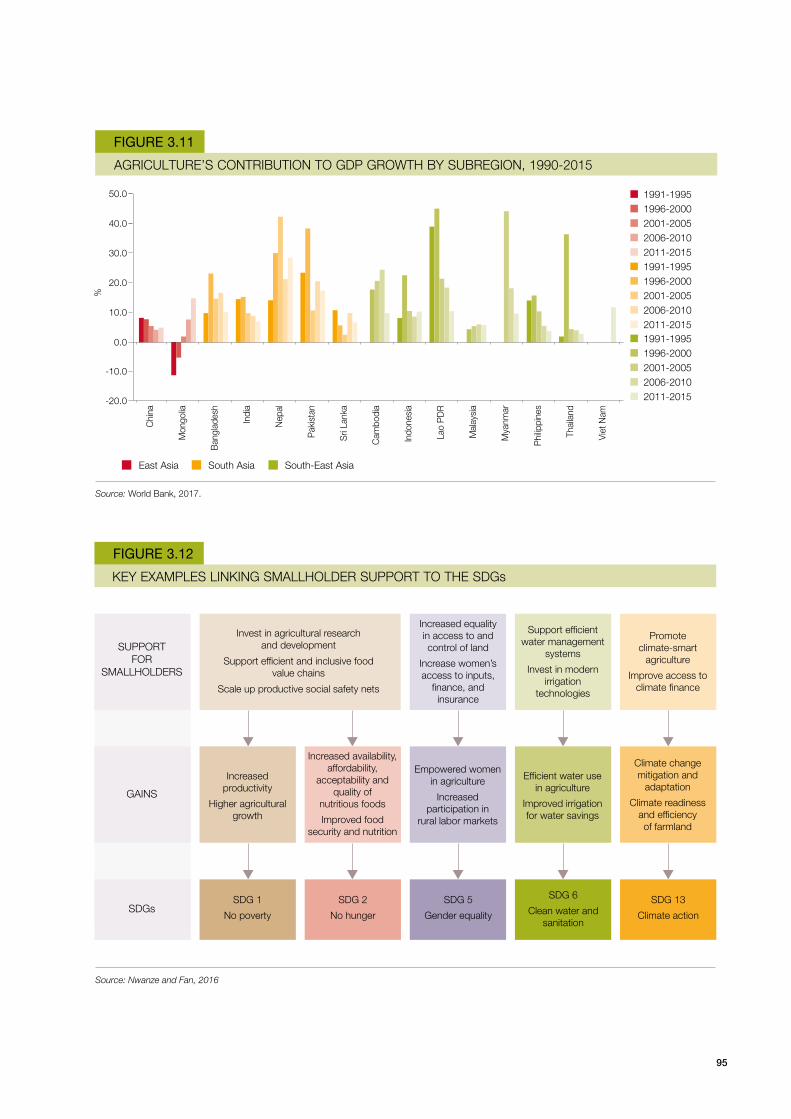
95
KEY EXAMPLES LINKING SMALLHOLDER SUPPORT TO THE SDGs
FIGURE 3.12
AGRICULTURE’S CONTRIBUTION TO GDP GROWTH BY SUBREGION, 1990-2015
FIGURE 3.11
East Asia South Asia South-East Asia
Source: World Bank, 2017.
Source: Nwanze and Fan, 2016
1991-19951996-20002001-20052006-20102011-20151991-19951996-20002001-20052006-20102011-2015
1991-19951996-20002001-20052006-20102011-2015
%
0.0
-10.0
10.0
20.0
30.0
40.0
-20.0
50.0
Chi
na
Mon
golia
Ban
glad
esh
Indi
a
Nep
al
Pak
ista
n
Sri
Lank
a
Cam
bodi
a
Indo
nesi
a
Lao
PD
R
Phi
lippi
nes
Mal
aysi
a
Thai
land
Mya
nmar
Viet
Nam
SUPPORT FOR
SMALLHOLDERS
Invest in agricultural research and development
Support efficient and inclusive food value chains
Scale up productive social safety nets
Increased equality in access to and control of land
Increase women’s access to inputs,
finance, and insurance
Increased productivity
Higher agricultural growth
SDG 1
No poverty
SDG 2
No hunger
SDG 5
Gender equality
SDG 6
Clean water and sanitation
SDG 13
Climate action
Increased availability, affordability,
acceptability and quality of
nutritious foods
Improved food security and nutrition
Empowered women in agriculture
Increased participation in
rural labor markets
Efficient water use in agriculture
Improved irrigation for water savings
Climate change mitigation and
adaptation
Climate readiness and efficiency of farmland
Support efficient water management
systems
Invest in modern irrigation
technologies
Promote climate-smart
agriculture
Improve access to climate finance
GAINS
SDGs
96

97
Can Asia’s rural and agricultural transformation be expected to continue at its current pace in the
decade to come? And will it continue being inclusive of the poor and of marginalized groups in the
same way as it has been so far? This will depend not only on the right policy choices being made but
also on a favourable development context. This chapter focuses on the future context and prospects
for the agricultural and rural transformation from four angles. First, can the non-farm economy be
expected to grow so as to generate enough rural employment given that agriculture will shed rather
than create jobs? Second, private investments in agriculture and agribusiness will be required for
value chains to transform and agriculture to evolve. Will there be sufficient private funds to make
such investments happen over the long term? Will incentives for investing in agriculture, as shaped
by public investments and policies, be attractive enough for investors? Third, how seriously will
climate change and natural resource degradation threaten returns to investment in agriculture and
agribusiness? Finally, how will policymakers look at the nexus between agriculture modernization
and sustainable development, given their immediate concerns in ensuring stable food markets?
PROSPECTS FOR SUSTAINING THE TRANSFORMATION OF ASIA’S AGRICULTURE AND RURAL ECONOMY
KEY MESSAGES
Although slightly tempered by the recent global crisis, strong economic growth rates will persist across
developing Asian countries in the medium to long term and Asia’s rural non-farm economy is poised
to benefit.
Rural economies have benefited greatly as a result of national growth and integration. In particular,
financial markets and liquidity are not as constraining for the rural economy as they were at the time of
the Green Revolution.
The fiscal space for agricultural policies has improved in most Asian countries as a result of sustained
macroeconomic growth and recent increases in general public expenditures.
Climate change is currently the most relevant threat to a sustained inclusive transformation of agriculture
and the rural economy in Asia.
Policymakers will increasingly shift away from viewing agricultural growth as a “standalone” driver of
human development in rural areas. The focus will gradually shift from farming to agribusiness, where the
emphasis is more on agriculture’s forward and backward linkages with the rest of the economy.
In response to rising labour costs, smallholders will participate more strongly in the process of
mechanization and land consolidation that is currently under way in several parts of Asia.
98
Prospects for the rural non-farm economy and employment opportunities
Growth in rural non-farm employment opportunities will continue to facilitate the reallocation
of labour from agriculture to non-farm jobs in rural areas; this will be important for sustaining
rural poverty reduction while raising labour productivity in agriculture and avoiding excessive
urbanization. Understanding how the relationship between agriculture and the non-farm economy
will change in the coming years thus stands as a vital concern for policymakers in Asia.
Although tempered by the recent global crisis, moderate to strong economic growth rates
will persist across most developing Asian countries in the medium to long term. Asia’s rural
non-farm economy is poised to benefit from this trend in four main ways. First, buoyant
economic growth will create fiscal space in middle-income economies for needed investments in
rural infrastructure and public services – particularly transportation, electricity, communications,
schools and health care. Strengthening the connectivity between urban and rural areas represents in
fact a policy priority for governments in the region. Second, as transportation costs decline and the
quality of communications improves, urban-based industries will find it more profitable to relocate
some or all of their activities to peri-urban rural areas and the hinterland. Incentives will become
particularly strong for industries that derive fewer benefits from the agglomeration economies
driven by proximity to other urban industries and for which the cost of land is significant. Third,
agro-industrial development in rural areas will continue to benefit from the strong growth in the
demand for processed and packaged food. Finally, the demand for tourism and recreational services
in rural areas can also be expected to grow as urban incomes rise.
Faced with this changing set of pressures, the rural non-farm economy will change greatly
in structure and spatial distribution. It will change in structure because only the more competitive
firms will survive competition from urban-based industries. As rural-urban transport costs decline
and other market imperfections recede, uncompetitive rural enterprises will be driven out of the
market unless they modernize. For example, it has been empirically shown for the Philippines that,
while rural non-farm activities have benefited from the development and rehabilitation of local
roads, investments in national road networks have often had a negative impact, particularly for rural
manufacturing enterprises (see Balisacan et al., 2011).39 Services and trading activities may enjoy a
greater amount of protection due to their specificity to the local economy. The structure of the rural
non-farm economy is therefore likely to shift towards agro-industrial enterprises or micro, small and
medium-sized enterprises (MSMEs) that are vertically integrated with urban-based manufacturing
industries. Adjusting the non-farm economy to the competition from urban-based industries will
require public investments in education and human capital, support for the establishment of viable
industrial clusters and access to credit to promptly adopt new technologies.40
In terms of spatial distribution, the ways in which the non-farm economy will evolve are less clear.
Farm and non-farm activities rearrange themselves according to a variety of structural conditions:
transportation costs, changing rent gradients, basic agroecological conditions, population density
and many more. These conditions themselves result from the web of structural and agricultural
transformation processes that have been outlined in this report. More than anything else, however,
they share an important relationship with the expansion of public investments in rural areas.
Immense variation in all of these factors – particularly in the context of uneven public investments –
makes it difficult to predict exactly how the spatial distribution of the non-farm economy will change
as Asian countries progress through the middle-income stage of development.
39. This is in fact a well-known issue debated for instance in the World Bank’s World Development Report 2009 (World Bank, 2009) on economic geography.
40. See Otsuka and Sonobe’s (2012) comparison of the experience of rural industrial clusters in Asia and Africa.
99
41. The importance of transportation and communication costs and of the business environment could reconcile the two contradictory findings. While the cost of labour plays a key role in determining a firm’s decision on where to locate a production plant, transportation costs and access to supporting services are similarly, if not more, important. A process of cumulative causation could follow therefore from an early take-off in local agricultural productivity driven for example by the introduction of new agricultural technologies or investments in irrigation infrastructure, followed first by public investments improving connectivity with urban centres and subsequently by waves of private investment in manufacturing and services. Early investments to raise agricultural productivity in lagging areas with favourable agroecological conditions could therefore be instrumental in creating the conditions for their subsequent industrialization.
42. These features have already been noted above for paper manufacturing clusters in Viet Nam as well as machinery manufacturing in Indonesia. Likewise, garments manufacturing in Bangladesh tends to cluster around major cities, e.g. Dhaka and Chitaggong. Subcontracting is also prevalent, accounting for an estimated 67 per cent of employed workers (see Ahmed, 2013).
43. For instance, in the Philippines the central city of Cebu hosts the large processing factories for seaweed and dried mango; other processors (e.g. of banana chips, meat) are also found in cities. In the case of Thailand, by 1990 the share of industry in GDP had reached 27 per cent, of which food processing accounted for about a quarter, while textiles and wearing apparel accounted for over a fifth. Nonetheless, about 78 per cent of manufacturing was located in the Bangkok Metropolitan Region; only a sprinkling of raw materials processing was found in outer provinces (see Siamwalla, 1994).
Two important questions emerge at the forefront of the transformation of on- and off-farm
work. First, to what extent will farming and rural manufacturing act as complementary or substitute
activities? Second, to what extent will rural enterprises cluster together when growing? Investigations
into the question of complementarity versus substitution have so far yielded conflicting findings.
Initial results from a study on India suggest that investments in manufacturing in rural areas are
directed towards areas with lower wages (Rosenzweig and Foster, 2004); these are areas where
agricultural development has lagged behind and where the demand for labour has remained weak.
From this perspective, manufacturing and farming are substitutes rather than complementary. On
the other hand, recent work on the Philippines has concluded that employment in manufacturing is
correlated at the provincial level with growth in agricultural productivity (World Bank, 2010). One
important result that emerges from the Philippines study is that investments in national roads and
telecommunications have prioritized dynamic rather than lagging areas, thereby intensifying rather
than ameliorating regional disparities.41
In exceptional cases, expansion of the rural non-farm sector will be pioneered by urban-linked
manufacturing; rural-based agroprocessing will nonetheless remain a prominent feature of the non-
farm economy. The experience of the dynamic East Asian economies (i.e. Japan, the Republic of Korea,
Taiwan and now China) has fundamentally shaped the narrative of rapid industrialization and rural
development. For the rest of developing Asia, there may be similar instances of rural-based yet urban-
linked industrialization, though these will be highly country- and sector-specific. Where dynamic rural
industrialization is replicated, features such as clustering and subcontracting will probably be along
the lines of East Asia’s experience.42 As these industrial clusters tend towards production of tradable
goods, they may potentially find in export markets a promising pathway for growth. On the other
hand, traditional agro-based manufacturing (e.g. in making banana chips, raw sugar, crude coconut
and palm oil, and crumb rubber) benefits from proximity to farms (to reduce transport and logistics
costs) and can afford to be spatially dispersed in the absence of strong agglomeration economies. An
interesting question therefore is if agroprocessing can act as an embryo for the development of rural
industrial clusters. The potential for rural-based agroprocessing cannot be denied, but whether or not
rural-based clusters will follow is a different matter. Agroprocessing clusters tend rather to be located
in urban areas, mainly to benefit from proximity to ports and marketing outlets.43
On the whole, the main pathway for rural non-farm growth in developing Asia is expansion
in non-tradable activities, mainly in the services sector. The rise of rural industrial clusters,
however, appears to be the exceptional case; non-tradable activities and services will continue to
be the mainstay of the rural non-farm economy. As rural-based services are tied to demand both
locally and in nearby urban centres (if any), expansion of these activities may be more gradual than
expansion of competitive industrial clusters. Nonetheless, such growth is likely to be sustained in
pace with urbanization.

100
Prospects for public and private investment in rural areas
In the medium to long term, agricultural and food prices in Asia will continue their decline in
the face of sustained increase in productivity, slower growth in global food demand and weak
demand for biofuels. According to the 2017-2026 estimates of the OECD-FAO Agricultural Outlook,
China and India along with the whole of sub-Saharan Africa will act as the foremost drivers of
long-term developments in agricultural markets. With its population expected to reach 1.5 billion,
India will account for 27 per cent of the increase in rice consumption. China and South-East Asia
will account for an additional 16 per cent and 25 per cent respectively. India will lead globally
in the increase in the consumption of fresh dairy and vegetable oil, while China will lead global
consumption growth in meat and fish as a result of significant increases in per capita consumption.
The growth in consumption of meat- and fish-based proteins in China and India will cause a
concomitant increase in the demand for cereals used in the production of feed, mainly soybean,
maize and, to some extent, wheat. The demand for vegetable oil will grow at half the current rate
as a result of the low global demand for biofuels;44 production of palm oil in South-East Asia will
therefore decelerate and will be mainly driven for food consumption purposes by population growth
and improved affluence.
Asian developing countries have experienced sustained integration in domestic financial
markets, domestic labour markets and international financial markets. Domestic financial
markets have expanded in two important ways. First, almost every emerging economy across Asia
has witnessed a rapid expansion in the provision of financial services to individuals and businesses,
including the poorest members of society. Table 4.1 displays measures of the outreach of financial
institutions, normalized by population size. In several lower-middle-income and upper-middle-
income countries – particularly China, Mongolia, Malaysia and Thailand – financial institutions
now provide accounts to an overwhelming majority of the population, and even to the poorest
40 per cent. In other lower-middle-income countries, however, this coverage is significantly lacking
for the poor. Viet Nam, the Philippines and Indonesia are all fast-growing economies in the middle-
income stage, but only 19 per cent, 15 per cent and 22 per cent respectively of the poorest segments
of their populations hold bank accounts. In South Asia, the expansion of financial services to
individuals has occurred at a moderate pace, though bank account-holders still constitute fewer
than 25 per cent of the poor in Bangladesh, Nepal and Pakistan.
Second, the breadth and depth of financial activity in each of these economies has also
grown substantially in line with their engagement with larger numbers of the poor. As shown in
Table 4.2, increases in the provision of credit and in measures of market capitalization are
particularly noticeable in China and middle-income ASEAN members. In 2014, domestic credit
provided to the private sector amounted to 100 per cent of the GDP of Viet Nam, 120 per cent of
the GDP of Malaysia, 142 per cent of the GDP of China and nearly 150 per cent of the GDP of
Thailand. In several larger economies – most notably India, Indonesia and Pakistan – the volumes
of credit provided and of stocks traded remained relatively low.
44. A key assumption here is that oil prices will remain at the current levels.
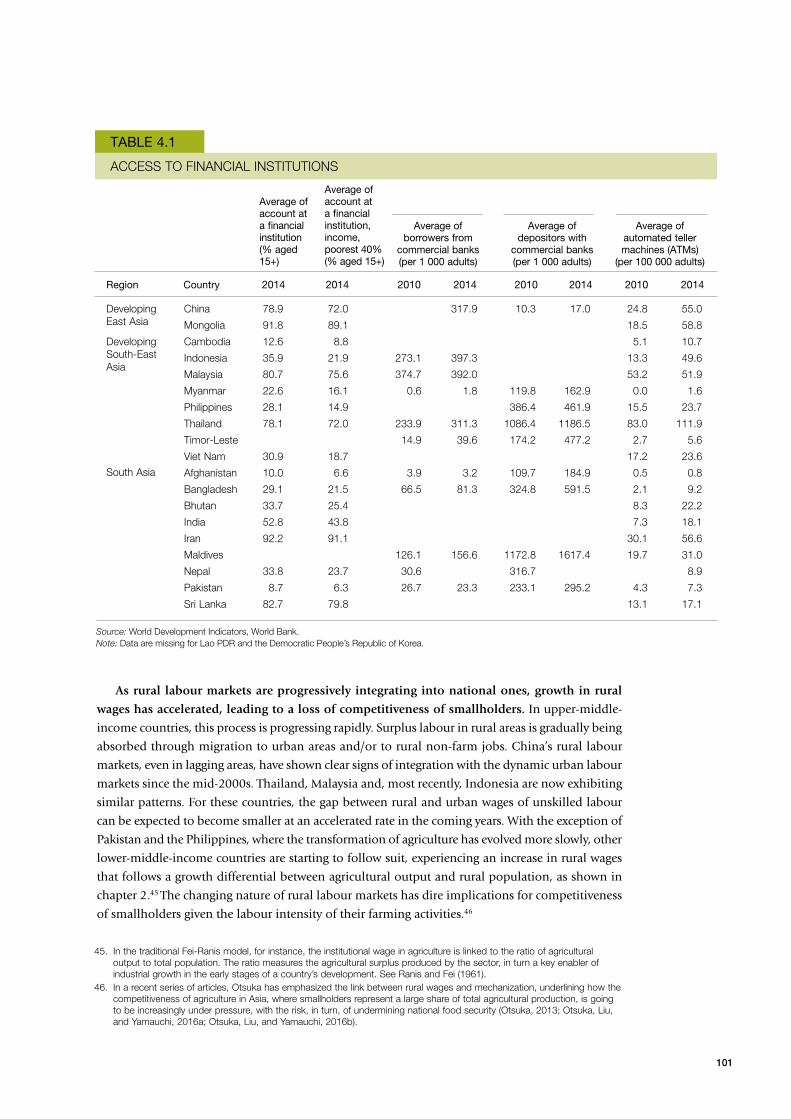
101
45. In the traditional Fei-Ranis model, for instance, the institutional wage in agriculture is linked to the ratio of agricultural output to total population. The ratio measures the agricultural surplus produced by the sector, in turn a key enabler of industrial growth in the early stages of a country’s development. See Ranis and Fei (1961).
46. In a recent series of articles, Otsuka has emphasized the link between rural wages and mechanization, underlining how the competitiveness of agriculture in Asia, where smallholders represent a large share of total agricultural production, is going to be increasingly under pressure, with the risk, in turn, of undermining national food security (Otsuka, 2013; Otsuka, Liu, and Yamauchi, 2016a; Otsuka, Liu, and Yamauchi, 2016b).
TABLE 4.1
ACCESS TO FINANCIAL INSTITUTIONS
Developing East Asia
Developing South-East Asia
South Asia
China
Mongolia
Cambodia
Indonesia
Malaysia
Myanmar
Philippines
Thailand
Timor-Leste
Viet Nam
Afghanistan
Bangladesh
Bhutan
India
Iran
Maldives
Nepal
Pakistan
Sri Lanka
Region Country 2014 2014 2010 2014 2010 2014 2010 2014
78.9 72.0 317.9 10.3 17.0 24.8 55.0
91.8 89.1 18.5 58.8
12.6 8.8 5.1 10.7
35.9 21.9 273.1 397.3 13.3 49.6
80.7 75.6 374.7 392.0 53.2 51.9
22.6 16.1 0.6 1.8 119.8 162.9 0.0 1.6
28.1 14.9 386.4 461.9 15.5 23.7
78.1 72.0 233.9 311.3 1086.4 1186.5 83.0 111.9
14.9 39.6 174.2 477.2 2.7 5.6
30.9 18.7 17.2 23.6
10.0 6.6 3.9 3.2 109.7 184.9 0.5 0.8
29.1 21.5 66.5 81.3 324.8 591.5 2.1 9.2
33.7 25.4 8.3 22.2
52.8 43.8 7.3 18.1
92.2 91.1 30.1 56.6
126.1 156.6 1172.8 1617.4 19.7 31.0
33.8 23.7 30.6 316.7 8.9
8.7 6.3 26.7 23.3 233.1 295.2 4.3 7.3
82.7 79.8 13.1 17.1
Source: World Development Indicators, World Bank.Note: Data are missing for Lao PDR and the Democratic People’s Republic of Korea.
Average of account at a financial institution (% aged 15+)
Average of account at a financial institution, income, poorest 40% (% aged 15+)
Average of borrowers from
commercial banks (per 1 000 adults)
Average of depositors with
commercial banks (per 1 000 adults)
Average of automated teller machines (ATMs)
(per 100 000 adults)
As rural labour markets are progressively integrating into national ones, growth in rural
wages has accelerated, leading to a loss of competitiveness of smallholders. In upper-middle-
income countries, this process is progressing rapidly. Surplus labour in rural areas is gradually being
absorbed through migration to urban areas and/or to rural non-farm jobs. China’s rural labour
markets, even in lagging areas, have shown clear signs of integration with the dynamic urban labour
markets since the mid-2000s. Thailand, Malaysia and, most recently, Indonesia are now exhibiting
similar patterns. For these countries, the gap between rural and urban wages of unskilled labour
can be expected to become smaller at an accelerated rate in the coming years. With the exception of
Pakistan and the Philippines, where the transformation of agriculture has evolved more slowly, other
lower-middle-income countries are starting to follow suit, experiencing an increase in rural wages
that follows a growth differential between agricultural output and rural population, as shown in
chapter 2.45 The changing nature of rural labour markets has dire implications for competitiveness
of smallholders given the labour intensity of their farming activities.46
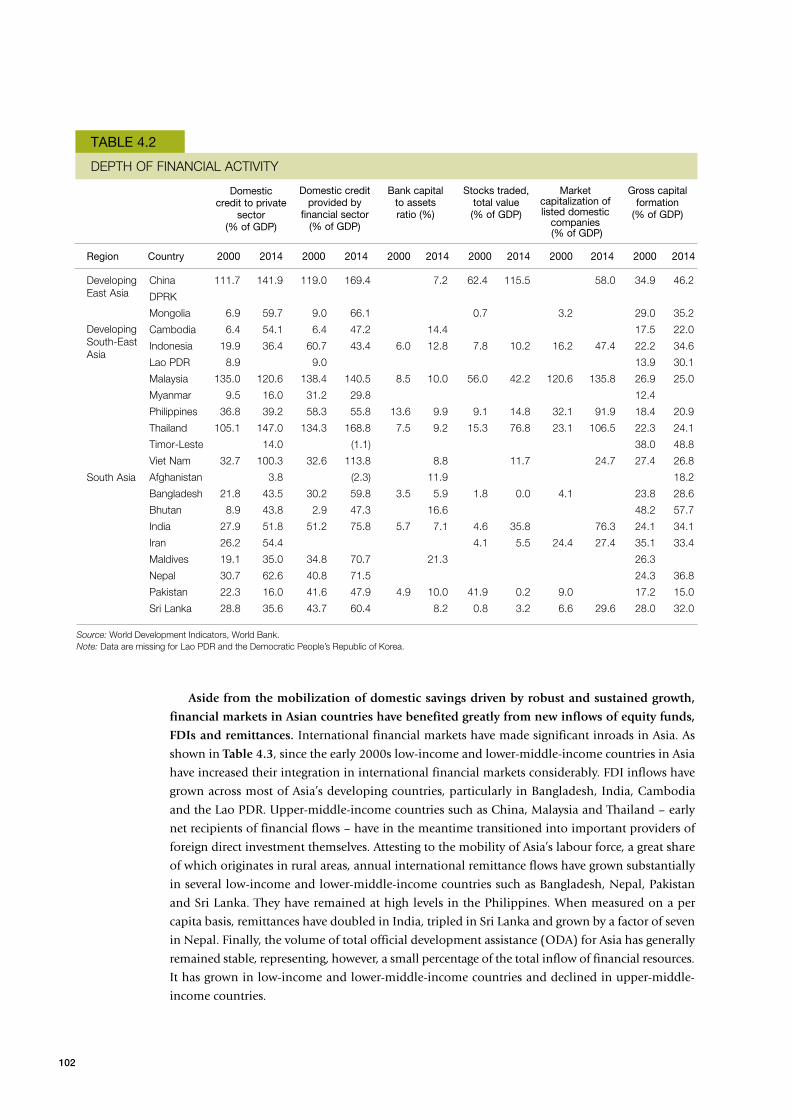
102
TABLE 4.2
DEPTH OF FINANCIAL ACTIVITY
Developing East Asia
Developing South-East Asia
South Asia
China
DPRK
Mongolia
Cambodia
Indonesia
Lao PDR
Malaysia
Myanmar
Philippines
Thailand
Timor-Leste
Viet Nam
Afghanistan
Bangladesh
Bhutan
India
Iran
Maldives
Nepal
Pakistan
Sri Lanka
Region Country 2000 2014 2000 2014 2000 2014 2000 2014 2000 2014 2000 2014
111.7 141.9 119.0 169.4 7.2 62.4 115.5 58.0 34.9 46.2
6.9 59.7 9.0 66.1 0.7 3.2 29.0 35.2
6.4 54.1 6.4 47.2 14.4 17.5 22.0
19.9 36.4 60.7 43.4 6.0 12.8 7.8 10.2 16.2 47.4 22.2 34.6
8.9 9.0 13.9 30.1
135.0 120.6 138.4 140.5 8.5 10.0 56.0 42.2 120.6 135.8 26.9 25.0
9.5 16.0 31.2 29.8 12.4
36.8 39.2 58.3 55.8 13.6 9.9 9.1 14.8 32.1 91.9 18.4 20.9
105.1 147.0 134.3 168.8 7.5 9.2 15.3 76.8 23.1 106.5 22.3 24.1
14.0 (1.1) 38.0 48.8
32.7 100.3 32.6 113.8 8.8 11.7 24.7 27.4 26.8
3.8 (2.3) 11.9 18.2
21.8 43.5 30.2 59.8 3.5 5.9 1.8 0.0 4.1 23.8 28.6
8.9 43.8 2.9 47.3 16.6 48.2 57.7
27.9 51.8 51.2 75.8 5.7 7.1 4.6 35.8 76.3 24.1 34.1
26.2 54.4 4.1 5.5 24.4 27.4 35.1 33.4
19.1 35.0 34.8 70.7 21.3 26.3
30.7 62.6 40.8 71.5 24.3 36.8
22.3 16.0 41.6 47.9 4.9 10.0 41.9 0.2 9.0 17.2 15.0
28.8 35.6 43.7 60.4 8.2 0.8 3.2 6.6 29.6 28.0 32.0
Source: World Development Indicators, World Bank.Note: Data are missing for Lao PDR and the Democratic People’s Republic of Korea.
Domestic credit to private
sector (% of GDP)
Domestic credit provided by
financial sector (% of GDP)
Bank capital to assets ratio (%)
Stocks traded, total value (% of GDP)
Market capitalization of listed domestic
companies (% of GDP)
Gross capital formation
(% of GDP)
Aside from the mobilization of domestic savings driven by robust and sustained growth,
financial markets in Asian countries have benefited greatly from new inflows of equity funds,
FDIs and remittances. International financial markets have made significant inroads in Asia. As
shown in Table 4.3, since the early 2000s low-income and lower-middle-income countries in Asia
have increased their integration in international financial markets considerably. FDI inflows have
grown across most of Asia’s developing countries, particularly in Bangladesh, India, Cambodia
and the Lao PDR. Upper-middle-income countries such as China, Malaysia and Thailand – early
net recipients of financial flows – have in the meantime transitioned into important providers of
foreign direct investment themselves. Attesting to the mobility of Asia’s labour force, a great share
of which originates in rural areas, annual international remittance flows have grown substantially
in several low-income and lower-middle-income countries such as Bangladesh, Nepal, Pakistan
and Sri Lanka. They have remained at high levels in the Philippines. When measured on a per
capita basis, remittances have doubled in India, tripled in Sri Lanka and grown by a factor of seven
in Nepal. Finally, the volume of total official development assistance (ODA) for Asia has generally
remained stable, representing, however, a small percentage of the total inflow of financial resources.
It has grown in low-income and lower-middle-income countries and declined in upper-middle-
income countries.
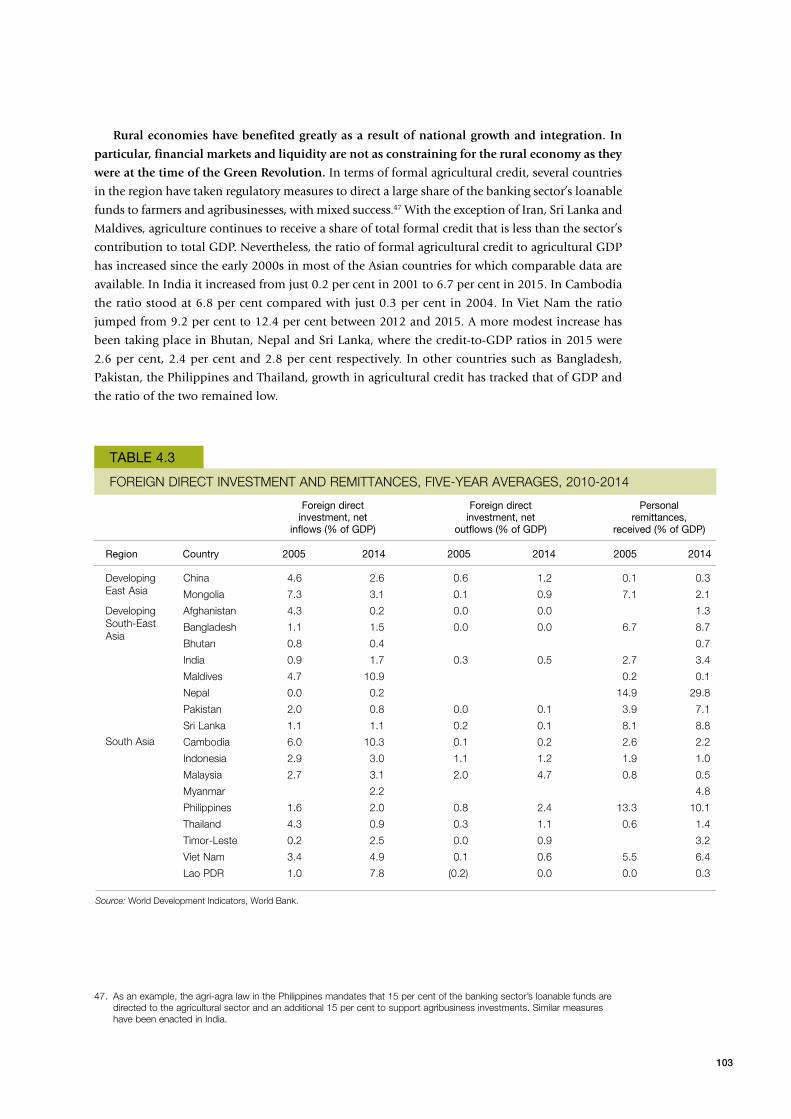
103
Rural economies have benefited greatly as a result of national growth and integration. In
particular, financial markets and liquidity are not as constraining for the rural economy as they
were at the time of the Green Revolution. In terms of formal agricultural credit, several countries
in the region have taken regulatory measures to direct a large share of the banking sector’s loanable
funds to farmers and agribusinesses, with mixed success.47 With the exception of Iran, Sri Lanka and
Maldives, agriculture continues to receive a share of total formal credit that is less than the sector’s
contribution to total GDP. Nevertheless, the ratio of formal agricultural credit to agricultural GDP
has increased since the early 2000s in most of the Asian countries for which comparable data are
available. In India it increased from just 0.2 per cent in 2001 to 6.7 per cent in 2015. In Cambodia
the ratio stood at 6.8 per cent compared with just 0.3 per cent in 2004. In Viet Nam the ratio
jumped from 9.2 per cent to 12.4 per cent between 2012 and 2015. A more modest increase has
been taking place in Bhutan, Nepal and Sri Lanka, where the credit-to-GDP ratios in 2015 were
2.6 per cent, 2.4 per cent and 2.8 per cent respectively. In other countries such as Bangladesh,
Pakistan, the Philippines and Thailand, growth in agricultural credit has tracked that of GDP and
the ratio of the two remained low.
TABLE 4.3
FOREIGN DIRECT INVESTMENT AND REMITTANCES, FIVE-YEAR AVERAGES, 2010-2014
Developing East Asia
Developing South-East Asia
South Asia
China
Mongolia
Afghanistan
Bangladesh
Bhutan
India
Maldives
Nepal
Pakistan
Sri Lanka
Cambodia
Indonesia
Malaysia
Myanmar
Philippines
Thailand
Timor-Leste
Viet Nam
Lao PDR
Region Country 2005 2014 2005 2014 2005 2014
4.6 2.6 0.6 1.2 0.1 0.3
7.3 3.1 0.1 0.9 7.1 2.1
4.3 0.2 0.0 0.0 1.3
1.1 1.5 0.0 0.0 6.7 8.7
0.8 0.4 0.7
0.9 1.7 0.3 0.5 2.7 3.4
4.7 10.9 0.2 0.1
0.0 0.2 14.9 29.8
2.0 0.8 0.0 0.1 3.9 7.1
1.1 1.1 0.2 0.1 8.1 8.8
6.0 10.3 0.1 0.2 2.6 2.2
2.9 3.0 1.1 1.2 1.9 1.0
2.7 3.1 2.0 4.7 0.8 0.5
2.2 4.8
1.6 2.0 0.8 2.4 13.3 10.1
4.3 0.9 0.3 1.1 0.6 1.4
0.2 2.5 0.0 0.9 3.2
3.4 4.9 0.1 0.6 5.5 6.4
1.0 7.8 (0.2) 0.0 0.0 0.3
Source: World Development Indicators, World Bank.
Foreign direct investment, net
inflows (% of GDP)
Foreign direct investment, net
outflows (% of GDP)
Personal remittances,
received (% of GDP)
47. As an example, the agri-agra law in the Philippines mandates that 15 per cent of the banking sector’s loanable funds are directed to the agricultural sector and an additional 15 per cent to support agribusiness investments. Similar measures have been enacted in India.

104
In terms of foreign financial resources to agriculture and food, ODA and FDI flows have undergone
an important series of changes during the last two decades. ODA to agriculture has increased in
USD terms by 40 per cent in Asia’s low-income and lower-middle-income countries since 2000,
while it has decreased by almost 60 per cent in upper-middle-income countries, a divergence in
trends that became more pronounced after the 2008 food crisis. Data on FDI in agriculture and in
the food-manufacturing sector are patchy. Yet available evidence shows that in several countries,
including India, Cambodia and Thailand, the food manufacturing sector attracts more investments
than agriculture in view of the more favourable risk-return profile it offers. In China the flow of
FDI in the two sectors has recently followed suit. Aggregate flows of FDI to the agrifood sector,
while quite erratic in the official statistics, have shown a tendency to increase since the 2007/08
food crisis.48 Investment funds focusing on agriculture in developing countries have also been on
the rise, including equity, debt and guarantee funds (FAO, 2012). These investment funds play an
important role in addressing the needs of farms and MSMEs that are too large to borrow from
monetary financial institutions (MFIs), too small to qualify for lending from commercial banks
or not innovative enough to attract the attention of venture capitalists. Between 2008 and 2014,
private equity funds focusing on agriculture totalled US$2.1 billion in developing Asia. Interestingly
enough, most of the equity funds are keen on ensuring that social and environmental safeguards are
in place and enforced in the operations they invest in (Credit Suisse et al., 2015).
The fiscal space for agricultural policies has improved in most Asian countries as a result
of sustained macroeconomic growth and recent increases in general public expenditures.
Governments can transfer resources to the farm sector through farm programmes, services and
measures that influence the market prices of agricultural products. Public expenditures on
agriculture have grown across Asia since 2000, with the exceptions of Thailand and Myanmar. For
instance, by 2012 China and Bangladesh allocated to agriculture six and five times the budget they
allocated in 2000 respectively. Nepal tripled and India more than doubled the size of its budget for
agriculture. The Philippines reversed the decline of its budget for agriculture after the 2007/08 food
price crisis by doubling it with respect to the pre-crisis level.
However, across many countries in Asia, agriculture benefited less from the general increase
in budget than did other key sectors. As the International Food Policy Research Institute (IFPRI)’s
analysis of development budget expenditures shows, between 2000 and 2010 agriculture was able
to capture a larger share in China and South Asian countries. In countries such as Myanmar and
Viet Nam, on the other hand, agriculture’s share in development expenditures in fact declined
quite considerably over that period. FAO’s data on the share of agriculture in total government
outlays between 2000 and 2013/15 show a similar picture. A review of the agriculture orientation
index (i.e. the share of public outlays to the agricultural sector weighted by the sector’s share in
GDP) during the same period confirms that across Asia agriculture as a sector has been receiving
until now only a fraction of the sector’s contribution to GDP. These trends do not necessarily spell
bad news. In agriculture, the private sector typically plays a prominent role in the “production”
of GDP compared with other sectors such as defence, education, health and social protection.
48. A variety of large-scale agribusiness FDI models exist, from pure acquisition of land and engagement of smallholders as wage workers to contract farming and inclusion of smallholders as company shareholders. Available evidence suggests that the more inclusive models are the ones with the highest likelihood of delivering jobs, food security and improved social conditions at the community level (see Trends and Impacts of Foreign Investment in Developing Country Agriculture (FAO, 2013)). A recent review of 39 large-scale agribusiness investments in sub-Saharan Africa and Southeast Asia concludes that direct and indirect employment effects of such investments have been favourable overall, although there is substantial room for host governments to screen prospective investors and improve both technology transfer and socio-economic benefits at the community level (see The Practice of Responsible Investment Principles in Larger-Scale Agricultural Investments: Implications for Corporate Performance and Impact on Local Communities, World Bank Report Number 86175-GLB (World Bank, 2014)).

105
Furthermore, public expenditures on development programmes in health, education, transport
and communications positively impact agricultural development by improving the sector’s human
resources and by helping to create an environment of more easy investment for agriculture and
downstream industries, particularly for farmers themselves. Skills and infrastructure development
are in fact important complements of on-farm investment by smallholders.
Through new programmes and trade measures, government support comprises a significant
share of the increase in farmers’ gross revenues across Asia’s food-importing countries.
Protective measures have become more prominent in several Asian countries since 2000, possibly
to counteract declining international competitiveness in the agricultural sector caused by rising
labour costs. Rising labour costs particularly affect labour-intensive crops – including rice and sugar
cane – that play important roles in food security and self-sufficiency.
As agriculture’s shares in GDP and total employment diminish, efficiency losses from
protection become more diluted among consumers and taxpayers; as a result, demand for
protectionist measures and subsidies tend to find less resistance among policymakers concerned
with the growing income gap between rural and urban areas.49 According to the Organisation
for Economic Co-operation and Development (OECD)’s estimates, market price support and farm
programmes in China were the source of 15 per cent of total farm revenues in 2013-2015, against
3 per cent during 1995-1997. In Indonesia, producer support amounted to 3 per cent in 1995-1997,
increasing to 25 per cent in 2013-2015. Similarly, in the Philippines producer support was quite
substantial already in 2000-2002, amounting to 20 per cent of farm revenues and increasing further
to 25 per cent in 2014-2016. These figures still remain far below those of the Republic of Korea and
Japan, where 49 per cent and 47 per cent of the farm revenues were generated by producer support
measures.50 Common to all of these countries is the focus of support on cereals, which are at the
heart of the national food security priorities. In Viet Nam, on the other hand, farm revenues enjoy
no noticeable support through agricultural policies. While Vietnamese rice farmers have recently
been implicitly “taxed” by low domestic relative to international prices, producers of maize and
sugar have enjoyed substantial border protection. Administrative measures limit the options of
Vietnamese farmers for crop diversification.51
In spite of the many improvements, the transformation of smallholder agriculture and
of rural MSMEs has suffered from the slow pace with which governments in the region have
reformed their intervention in the agricultural sector. Public support to agriculture across the
region remains oriented towards Green Revolution crops. Simultaneously, it underinvests in
horticulture, fisheries and livestock. Traditional models of public assistance continue to prioritize
the transfer of private goods (e.g. fertilizers, seeds, machinery) to the detriment of public goods
such as irrigation, feeder roads, R&D, extension, laboratories and quarantine services, although
recent reforms in China suggest that new approaches in supporting the farm sector are being
explored. Rural financial markets have also expanded during the last two decades and liquidity in
rural areas has generally become more abundant. Unfortunately, improved liquidity has not meant
that small poor farmers have been able to overcome the traditional barriers to access to credit.
49. With regard to the rising agricultural protectionism in Asia, see Hayami (2007).50. Interestingly, for both Korea and Japan the share of producer support measures in farm revenues has been declining
since 1986-1988, when they amounted to 64 per cent and 70 per cent respectively. In both Indonesia and the Philippines, support to farm revenues has become more distortionary (i.e. output-linked) than in Korea and Japan. In China distortionary measures have been increasing since the late 1990s and now represent 74 per cent of the support to farm revenues.
51. A rationale explaining these differing approaches in agricultural support lies in competitiveness in grain, the dominant subsector given its importance in national food security. In food deficit countries, where irrigated agricultural land is in scarce supply relative to population, and grain production is not competitive (e.g. China, Indonesia and the Philippines), protection focuses on this subsector. Where grain production is competitive, such as in Viet Nam and Thailand, protection is not a priority from a food security perspective and farm programmes are mainly directed at promoting rural livelihoods.
106
It points, though, to the potential for scalable progress that exists in expanding credit access by the
rural poor provided that suitable business models are identified. However limited in its capacity to
reach the poorest of the poor, the microfinance sector has also helped broaden access to finance by
poor rural households.
Vulnerability of Asia’s agriculture to climate change
Climate change already affects Asia’s agriculture, posing a major and growing threat to
the region’s food security and nutrition. Asia is predominantly agrarian, with 58 per cent of
its population living in rural areas, of whom 81 per cent are dependent on agriculture for their
livelihoods (Hijioka et al., 2014). Asia’s agriculture is affected by increased temperatures and
temperature variability, changes in rainfall levels and frequency, increased droughts frequency,
increasing intensity of extreme weather events, rising sea level, and freshwater and arable land
salinization (FAO, 2016). Therefore, Asian countries with a large portion of their economy invested
in agriculture face significant exposure to climate change (IFAD, 2008), for example Pakistan, where
agriculture contributed 25 per cent of national GDP in 2014 (World Bank, 2016). Furthermore, Asia
accounts for an estimated 500 million rural poor, the majority of whom are subsistence farmers
residing mainly in rainfed land – for example, in India 60 per cent of agriculture is rainfed (Green
et al., 2011; Government of India, 2012) – and who are among the most vulnerable to climate
change (AASA, 2012).
Observed impacts on crop production are evident in many parts of Asia, with a prevalence
of negative impacts compared with positive ones (FAO, 2016). Within Asia, research has shown
regional differences in the impacts of climate change on food production (Hijioka et al., 2014).
For example, in mid- and high-latitude regions of north-east China, warming has benefited rice
production in some cases (Zhang, Zhu and Wassmann, 2010; Tao and Zhang, 2013); however,
evidence already shows considerable negative impacts on wheat and maize yields in South-East
Asia (Schleussner et al., 2016), and South Asia (Nelson et al., 2009).
It is projected that both biophysical impacts on food production and resulting impacts on
development are likely to be substantial, especially in South and South-East Asia (World Bank,
2013b, 2014; Vinke et al., 2017; Hijioka et al., 2014). Despite these regional differences, projections
show that impacts tend to be more severe with increased warming; hence, in the longer term, negative
impacts on crop yields will become increasingly severe and potentially disastrous in some areas.
Once optimal crop growth level is exceeded, or if water and nutrients are insufficient, crop yields
are likely to drop. Additionally, considering that crop production tends to suffer more in the tropics
than in higher latitudes, tropical regions of South and South-East Asia will become particularly
critical, considering projected trends in population growth (FAO, 2016; Porter et al., 2014). By 2080,
estimated average yield losses could be as severe as 23 per cent for South Asia and 17 per cent
for East Asia and the Pacific (Hallegatte et al., 2016). Changes in rainfall patterns, temperature
and wind direction could also result in a higher desertification risk and in the establishment and
introduction of pests and diseases, threatening crop production (Hijioka et al., 2014).
In South Asia, beyond a projected regional 2° C temperature increase, the negative impacts on rice
and wheat yields would no longer be counteracted by positive CO2 fertilization effects (Lal, 2011).
Rice yield reduction is of particular importance, as it is a strategic commodity in many Asian countries,
e.g. 70 per cent of calories consumed in rural Bangladesh come from rice, as it is a rice-growing52
country (IFPRI, 2015). However, current temperatures are already reaching the heat stress limit for rice,
52. Such as China (July/August), East India/Bangladesh (March-June), Indonesia (August), Myanmar/Thailand/Lao PDR/Cambodia (March/June), Pakistan/North India (October), Philippines (April/June), South India (April/August) and Viet Nam (April/August) (Wassmann et al., 2009a and b).

107
and this is likely to cause major rice declines over a large portion of Asia (Wassmann et al., 2009a
and b). South Asia was identified as the subregion that would suffer greatest negative impacts on
several important crops (Lobell et al., 2008), with an estimated 8 per cent negative yield change of
all crops by 2050, including 16 and 11 per cent reductions in maize and sorghum yields respectively
(Knox et al., 2012). Similarly, in South-East Asia many studies have projected a decline in crop
yields, especially for rice (Wassmann et al., 2009a; World Bank, 2010b; USAID, 2013). In the
Mekong River Delta, an important rice production area, rice yield declines are projected to range
between 6 and 12 per cent by 2050, compared with 3 to 26 per cent for other crops (World Bank,
2010b). In some countries of South-East Asia, namely Indonesia, the Philippines, Thailand and Viet
Nam, the lack of appropriate adaptation measures and technological improvements will cause rice
yields to decrease by up to 50 per cent by 2100, based on 1990 levels, threatening the subregion’s
food security (ADB, 2009).
Extreme climate and weather events, sea level rise, floods and increased intensity of tropical
cyclones will negatively impact crop, livestock, fisheries and forestry production (IPCC, 2012;
Porter et al., 2014; Hijioka et al., 2014). It was shown that in Asia, between 2003 and 2013, crop
and livestock production losses caused by medium- to large-scale climate-related disasters were due
mainly to floods (86 per cent), followed by droughts (10 per cent) and storms (4 per cent) (FAO,
2015a). South-East Asia is projected to face the strongest increase in land area covered by heat extremes
(Schleussner et al., 2016), and these extremes are predicted to cause lower rice yields (Mohammed
and Tarpley, 2009; Tian et al., 2010). Increasing heat waves are also likely to increase the vulnerability
of livestock to disease, reducing fertility and meat and milk production (FAO, 2016). Sea level rise
will inundate low-elevation areas, such as in coastal and deltaic areas of Bangladesh, Myanmar and
Viet Nam, threatening rice production (Dasgupta et al., 2009; Wassmann et al., 2009b).
In southern Bangladesh 40 per cent of agricultural productive areas could be lost for a projected
65 cm sea level rise by 2080. In Bangladesh, rice and wheat yield reductions of up to 100 per cent
have been registered in some areas when coastal flooding causes the plants to be submerged for
more than 15 days (Yu et al., 2010). It was found that the combination of mean changes in floods,
inundation and sea level rise, in addition to projected temperature and precipitation changes, could
result in a rice yield reduction of approximately 80 million tons by 2050 in Bangladesh (World
Bank, 2010a). Furthermore, in Bangladesh increased soil salinity due to coastal saltwater intrusion
from sea level rise and cyclones decreased land suitability for rice cultivation (Dasgupta et al., 2014;
Rabbani, Rahman and Mainuddin, 2013), with 70 per cent of farmers abandoning agriculture in
some sites (Shameem, Momtaz and Rauscher, 2014) (Figure 4.1). Owing to its low elevation, the
Mekong River Delta is also threatened by sea level rise: it was predicted that a 30 cm sea level rise
could result in more than 7 per cent of the deltaic area becoming unsuitable for agriculture owing
to increased salinity by 2050. This would cause rice production to decline annually by 2.6 million
tons, based on 2010 rice productivity levels, amounting to a direct economic loss in export revenue
of US$1.22 billion, based on 2011 prices (World Bank, 2010b).
In many Pacific islands, agricultural areas will be heavily affected. Pacific islands are
vulnerable to climate change and a large share of the territory is dedicated to agriculture – more
than 60 per cent in the Marshall Islands and Tuvalu, and more than 40 per cent in Kiribati and
Tonga – with limited possibilities to expand or shift agricultural areas (ADB, 2017). These impacts
might amount to losses of up to 36 per cent for rainfed cassava yields in Fiji by 2050, or 19 per cent
for rainfed taro yields in Solomon Islands (ADB, 2013c).

108
Additionally, crop yield impacts will also reflect water resource availability and reliability,
which in turn is affected by climate change. Asia is the largest user of water by volume for
irrigation – surface water withdrawals for agriculture nearly tripled in the second half of the
twentieth century (ADB, 2017). Increasing water use, expanding urban clusters and changing
climate will result in major freshwater shortages. By 2050, it has been projected, 94 million people
will be living in cities with continuing water shortages (McDonald et al., 2011). Agricultural zones
have been predicted to potentially shift northwards owing to freshwater scarcity in South, East and
South-East Asia (FAO, 2016).
Climate change will also exacerbate the stresses faced by fisheries and aquaculture (FAO,
2016; Hallegatte et al., 2016) through the alarming effects of ocean acidification and warming,
threatening marine ecosystems (Lough, 2012; Meissner, Lippmann and Sen Gupta, 2012). Among
the countries most vulnerable to climate change impacts on their fisheries are Bangladesh, Cambodia
and Pakistan, being fishing-dependent countries where fishing activities are poorly regulated (Allison
et al., 2009). Climate change will increasingly damage fish stocks, force species to shift their ranges
northward and increase risks of diseases throughout the production chain (Hijioka et al., 2014).
In India, climate change has led to a reduction in fish availability in the River Ganges and reduced
the availability of fish spawn for aquaculture (Vass et al., 2009). By 2050, under a high-emission
scenario, marine fish body weight is likely to fall by up to 24 per cent globally, particularly in the
tropics (Cheung, Watson and Pauly, 2013). Some studies indicate that pelagic fish production might
increase in some areas (FAO, 2007), such as the northern South China Sea (Qiu, Lin and Wang,
2010); however, this is unlikely to benefit small-scale fishers, since it is expected to occur in deeper
waters out of their reach (Williams and Rota, 2010).
In the Coral Triangle,53 100 million people living in the coastal zones of South-East Asia are
dependent on the marine ecosystem services for coastal protection, tourism and food production.
An increasing share of the GDP of countries within the Coral Triangle is related to tourism (Hoegh-
Guldberg et al., 2009). Their livelihoods will be severely affected, as ocean acidification and ocean
warming are likely to result in reduced coral growth, weakened coral skeleton and bleached corals,
53. An area encompassing the tropical waters of Indonesia, Malaysia, Papua New Guinea, the Philippines, Solomon Islands and Timor-Leste.
RICE PRODUCTION AND THE EXTENT OF FLOODING IN BANGLADESH
FIGURE 4.1
Source: IFPRI, 2015.
Am
an ri
ce p
rodu
ctio
n (1
,000
mt)
% food-affected area
2004
Lowess smoothing
2007
19981997
0 10 20 30 40 50 60 70
8 000
9 000
10 000
11 000
12 000
7 000
13 000
109
which in turn will be associated with reduced species richness and with species extinction (Kroeker
et al., 2013; World Bank, 2013b). Sea surface temperature increases of 1° C to 4° C are already
projected in the area by 2100 (Hoegh-Guldberg, 2014), with coral reefs expected to decrease by
10 to 30 per cent even under a 2° C warming (low emissions) scenario (Hoegh-Guldberg et al.,
2009), with significant consequences for all marine ecosystems by 2050 in the entire Coral Triangle
(Meissner, Lippmann and Sen Gupta, 2012). Within the Western Pacific region, the most vulnerable
reefs are projected to be in the eastern Philippines (Mcleod et al., 2010). In South-East Asia, it was
estimated that for each square kilometre of healthy reefs the total potential net benefit per year is
between US$23,100 and US$270,000 (Burke, Selig and Spalding, 2002). Conversely, the estimated
cumulative value loss of reef fish is approximately US$58 billion for 2000-2050 under a business-
as-usual scenario (Brander and Eppink, 2012).
This trend will also lead to a further expansion of aquaculture industry to cover gaps in wild fish
capture, meet demand for fish and compensate for agriculture livelihood losses, with consequent
environmental impacts. On top of this, aquaculture, mangroves and coastal fisheries will be affected
by the increased intensity and frequency of extreme weather events, such as coastal flooding, storms,
cyclones and hurricanes, and aquaculture will face major freshwater scarcity risks (FAO, 2016).
In some Asian countries and social groups, rural poverty could be affected by climate change
as a result of a combination of decreasing rice crop yields and increasing food prices and living
costs. Studies have predicted that temperature and rainfall changes will result in food price volatility
(Porter et al., 2014) and potentially food price increases of 5 and 25 per cent in 2030 and 2080
respectively in the worst case scenario for rice, wheat, maize and soybean, and that increased feed
prices will lead to higher meat prices (Nelson et al., 2009). Rural poor are the most vulnerable
to food price variability, being the most dependent on agricultural and ecosystem-based incomes
(Hallegatte et al., 2016). However, this poverty impact will be heterogeneous, depending on where
poor households earn their income and the scale of impacts on crop yields, with poverty rates
increased by 20 to 50 per cent in some non-agricultural households in parts of Asia, and falling in
some agriculture-specialized households in other parts of Asia (Hertel et al., 2010). Bangladesh will
probably experience a 15 per cent net increase in poverty by 2030 as a response to global food prices
increasing (Hertel et al., 2010).
Most projections indicate that climate change effects may increase the demand for food
imports, ultimately resulting in food price increases (ADB, 2017). This will affect food availability
for poor households, reduce smallholder farmers’ income and increase the number of people living
in extreme poverty in low- and middle-income countries (Ivanic, Martin and Zaman, 2011; Porter
et al., 2014). However, climate change is often not taken into account in many projection studies
that predict no changes or slight declines in world prices for commodities such as cereals, dairy
and oilseeds in the medium term (Ivanic, Martin and Zaman, 2011; Porter et al., 2014). South Asia
is the most vulnerable subregion to climate-induced increases in crop prices (Hallegatte et al.,
2016), where it was projected that, under a 2° C warming scenario, imports in 2050 might be about
20 per cent of production, which would represent an annual increase in import costs of up to
US$15 billion, compared with US$2 billion under a no-climate-change scenario (Nelson et al.,
2009). For example, when major floods or droughts lead to substantial rice crop losses, Bangladesh
responds by increasing imports from neighbours and increasing the following season’s production;
this rapidly increases rice prices, ultimately affecting consumers (Rabbani Mondal et al., 2010).
On the other hand, food-exporting countries that have a large proportion of poor people in
agriculturally dependent households and small yield impacts, might benefit from rising global food
prices, resulting in reduced poverty rates in the agricultural sector and overall poverty reduction
(Hertel et al., 2010). In these countries the positive income benefits may outweigh the costs of
higher food prices and reduced poverty (Porter et al., 2014).
110
Climate change will further aggravate rural poverty, food insecurity and malnutrition (Hijioka
et al., 2014). Most poor countries have a larger proportion of their population inhabiting rural areas,
where poverty rates tend to be higher, by slight margins in South Asia (IFAD, 2011b) and by large
margins in China (Ravallion and Chen, 2007). The main explanation behind rising extreme poverty
resulting from climate change is reduced agriculture-related incomes, because the most severe food
production decreases and food price increases are projected in countries, such as India, that account
for a large share of the global poor. Other explanations include climate change impacts on health
and labour productivity (FAO, 2016b). A high-impact climate change scenario is projected to increase
the number of extremely poor in South Asia, where more than 75 per cent of rural poor depend on
rainfed agriculture, livestock and forestry (Knox et al., 2012). It was estimated that, under the worst-
case scenario, South Asia will be the subregion accounting for 51 per cent (62 million) of the global
forecasted increase in the number of people living below the poverty line by 2030.
Agriculture is the main channel through which climate change forces people into poverty
in all South Asian countries. The most vulnerable will be India, which will see an additional
45 million people in extreme poverty by 2030, 58 per cent of which will be due to impacts on
agriculture and 24 per cent of which will be due to impacts on health. In the same scenario, out of
the 13 million people pushed into poverty by climate change in East Asia, the largest shares will
be in China (46 per cent), the Philippines (23 per cent), Indonesia (15 per cent) and Viet Nam
(8 per cent). In Cambodia, Indonesia, the Lao PDR, Papua New Guinea and the Philippines, the
poorest 40 per cent of the population could lose up to 5 per cent of their income due to climate
change (Rozenberg and Hallegatte, 2015). The impact of climate change on crop productivity is
expected to particularly affect the semi-arid regions of South Asia, where the largest number of
food-insecure people reside – roughly 300 million undernourished (FAO, WFP and IFAD, 2012) –
and where farmers are already operating at the margin of climatic suitability (IPCC, 2014). In the
river basins of the Brahmaputra, Ganges and Indus, 63 million people could struggle to meet their
caloric intake by 2050 owing to the reduction of water available for agriculture resulting from a
temperature increase of 2° C to 2.5° C (Immerzeel, van Beek and Bierkens, 2010). Climate change
will have a substantial negative impact on availability of calories per capita, resulting in childhood
undernutrition and related child mortality (FAO, 2016). In South Asia, availability of calories per
capita could decline by nearly 8 per cent compared with 2000 levels (Nelson et al., 2010) and could
increase by 7 million the number of undernourished children aged under 5 years compared with a
scenario with no climate change (Nelson et al., 2009; Nelson et al., 2010). By 2050, South Asia will
experience a projected increase in severe stunting by 62 per cent due to climate change, amounting
to an additional 7 million children affected (Lloyd, Kovats and Chalabi, 2011). In India, stunting
varies significantly based on the month of birth, underlining the important influence that climate
seasonality has on nutrition (Lokshin and Radyakin, 2012) (Figure 4.2). In Bangladesh, increased
rice prices have led to spending declines for micronutrient-rich non-rice food and higher numbers
of underweight children aged under 5 years (Torlesse, Kiess and Bloem, 2003).
Nutrition will be affected through impacts of seasonal variations and climate shocks on food
supply, disease levels and patterns, and water safety and sanitation (IFPRI, 2015). Additionally,
climate change may affect food quality through the impact on the nutritional properties of some
crops – in 2050, declines in zinc, iron and protein content in wheat, rice and soybean are projected
as a result of increased CO2 emissions (Myers et al., 2014) – and may compromise food safety
through increases in waterborne diseases and foodborne pathogens (Kelly-Hope and Thomson,
2008; Tirado et al., 2010). Reduced rainfall and increased salinity of coastal waters threatens the
quality and quantity of water used for food production (irrigation), processing (energy production)
and consumption (washing and sanitation, cooking and drinking) (IFPRI, 2015).

111
Prospects of Asia’s institutional and policy context in agriculture
Policymakers will increasingly shift away from viewing agricultural growth as a “standalone”
driver of human development in rural areas. For many middle-income Asian economies,
agriculture is gradually exhausting its traditional poverty-reducing role based on increasing yields
and farm income. Although agriculture continues to retain its comparative advantage and efficiency
in terms of poverty reduction, the sector’s declining share in GDP makes agricultural growth
less effective in that regard. As we saw, this does not mean that agriculture will lose relevance.
The focus will gradually shift from farming to agribusiness, where the emphasis is more on the sector’s
forward and backward linkages with the rest of the economy. Agriculture will continue to be at the centre
of inclusive growth strategies but the sector’s ability to improve its competitiveness will be increasingly
central in the effort to ensure that the growth and transformation of the agrifood economy will be pro poor.
Job creation and SME growth in downstream segments of value chains, development and instilment
of an entrepreneurial culture among farmers, particularly among the youth, and diversification into
high-value crops will continue to drive the focus of policymakers, therefore complementing more
traditional concerns regarding food security.
Smallholder agriculture will face increasing competitive pressure for two important reasons.
The first involves the changing relationship between scale economies in the agricultural sector and
scale economies elsewhere in the agricultural value chain. Agricultural production technologies
will continue to reflect constant returns to scale. However, the realization of scale economies at the
marketing and processing stage – mainly driven by commercialization opportunities – will outpace
the improved returns smallholders could derive from improved access to technology and financial
services. Second, as noted earlier in this chapter, rising rural wages are increasing the cost of hired
labour and the opportunity cost of family labour employed on the farm. Smallholders, given their
relatively intensive use of labour, will therefore face the pressure of declining margins and a loss of
competitiveness vis-à-vis larger farms. Given the dominance of smallholders in the production of
rice, rice-importing countries will have a harder time in diminishing their dependence on imports
(see Otsuka, 2013; Otsuka et al., 2016a and 2016b).
-0.8
-0.6
-0.4
-0.2
0.0
-1.0
0.2
HOW STUNTING VARIES BY MONTH OF BIRTH FOR INDIAN CHILDREN AGED UNDER 3 YEARS
FIGURE 4.2
Source: Lokshin and Radyakin, 2012.
Gei
ght-
for-
age
of c
hild
ren
unde
r age
3,
rela
tive
to D
ecem
ber
Month of birth
Janu
ary
Febr
uary
Mar
ch
Apr
il
May
June
July
Aug
ust
Sep
tem
ber
Oct
ober
Nov
embe
r
Dec
embe
r
1992
1998
2005

112
In response to changing economies of scale, commercialized smallholders and their
organizations will therefore experience increasing pressure to access R&D and advisory services
that provide solutions to problems related to climate change, degradation of natural resource
assets and market demand for specific attributes of crops. Three possible trends may become
important in this regard. First, smallholders may become more frequent users of ICT as a means
of receiving extension and advisory services. Second, a wave of institutional reforms in the public
sector may reorient extension services away from the current top-down train and visit (T&V)
approach. Instead, extension services may evolve towards farmer-driven and pluralistic agribusiness
innovation systems where the public extension agent will play the role of a broker of innovations
and services. The private sector will continue increasing its share of investments in agricultural R&D
while suppliers of agrochemicals and seeds will provide advisory services linked to their sales.
In response to rising labour costs, smallholders will participate more strongly in the process
of mechanization and land consolidation that is currently under way in several parts of Asia.54
For most middle-income countries, mechanization with land consolidation will become an
indispensable pathway to follow to sustain the competitiveness of their agriculture. Land markets
will become increasingly active in the more dynamic agribusiness areas, provided that investments
in land institutions enhancing individual land rights are undertaken. Such pathways may or may not
favour smallholder agriculture and rural communities according to whether or not mechanization
is associated with a consolidation of operational landholdings driven by corporate farms
(i.e. externally driven consolidation) rather than by the more dynamic and entrepreneurial smallholders
(i.e. internally driven consolidation). Policymakers will be confronted with two alternative
approaches to land consolidation: the “corporate farming” and the “smallholder-entrepreneurial”
approach, differing in terms of their implications for the local rural economy.
Under the corporate farming approach, out-competed smallholders rent or sell their land
to external investors, with the option of then becoming employees. For instance, the Federal
Land Consolidation and Rehabilitation Authority (FELCRA)-managed Seberang Perak rice scheme
in Malaysia was established on about 20,000 hectares within the Muda Agricultural Development
Authority. The estate has achieved a constant cropping intensity of more than 200 per cent since
1986 and yields that are on average 50 per cent higher than the national average (see Najim et al.,
2007). The consolidation of small farms into an estate such as this one relies on the premise that
economies of scale would result from greater investments in mechanization, uniform adoption of
high-quality seeds and appropriate fertilization practices, and improved coordination with large-
scale mills. In theory, smallholders would benefit from the lease of their farmland and employment
on the estate. Similar scenarios have started to emerge in lower-middle-income countries. In
the case of the Philippines, legislation has recently been proposed to promote estate farming.55
Proponents of estate farming argue that it would lead to more favourable market access, improved
credit and financial intermediation, increased income from the cultivation of non-traditional crops
(e.g. organic rice), reduction in the risk of price fluctuations and reduction in the production risk
for farmers. In Indonesia, however, an attempt to form a consortium of agrochemical and seed
state-owned enterprises out of many smallholders failed to materialize, mainly owing to the poor
status of the farms’ land records.
54. In this connection, it seems that the second Lewis turning point (LTP) is being reached at lower levels of per capita income by rapidly transforming countries, such as Cambodia and Viet Nam. This is being triggered by the rapid achievement of an agricultural surplus so that the movement of labour from agriculture to industry and services beyond the first LTP but before the second LTP takes place with minimal pressure on the manufacturing to agricultural terms of trade.
55. Corporate Farming Act: House Bill 8076, House of Representatives, Congress of the Philippines.

113
56. The strength of this particular type of multiplier hinges though on the extent to which the local labour market is integrated with the national one. As discussed, the latter is typically the case in most UMICs and increasingly so in several LMICS.
A key question policymakers will confront is the extent to which a corporate farming
approach may undermine the long-term viability of rural communities. Promoting estate
farming may prove to be a more effective strategy to attract capital and technology available from
national and international private investors; yet, generated profits are typically “syphoned” out
of the rural areas where they are produced. Land use may also be much less efficient, with larger
landholdings leaving a portion of their land uncultivated. These large investments therefore run the
risk of impoverishing the rural communities who host them. A different dynamic occurs when the
more entrepreneurial smallholders drive the consolidation process. The “entrepreneurial” pathway
to consolidation allows communities to retain the benefits of agricultural commercialization.
The modest consolidation of farmland allows a local process of endogenous development that
stimulates non-farm growth through two channels. First, farm households will spend a part of
their income on locally produced goods.56 Second, farm households will have cash in hand to
overcome liquidity constraints and invest in the diversification into non-farm MSMEs, with positive
impacts on the local labour market. Diversification of the local economy will in turn strengthen its
resilience, leading to an inclusive investment environment.
Finally, an increasing use of contract and corporate farming arrangements will complement
changing scale economies, use of land and growing integration in international food markets.
Contract farming follows the spread of modern downstream food retail models, including
supermarkets and specialized wholesalers. It is characterized by large-scale procurement and
processing and the supply of investment capital by larger domestic and foreign investors.
It offers an opportunity for smallholders to overcome barriers related to scale economies. In
particular, the standardization of contractual arrangements minimizes negotiation, supervision
and the enforcement costs associated with procuring from a large number of smallholders.
It can also better facilitate farmers’ efforts in meeting quality requirements. Contract farming
will become more prevalent for farmers of commodities for which quality critically affects
price, commercialization is advancing faster and smallholders represent a significant share of
total production. Poultry, pork, horticulture, aquaculture and dairy are all subsectors that fit
these characteristics.
Horticulture and aquaculture are expected to remain smallholder-based subsectors over the
medium to long term in most Asian countries. However, there is now partial evidence that market
restructuring and functional concentration is taking place in the pork and poultry sub-sectors in
countries such as China, the Philippines and Viet Nam, leading to a declining share of smallholders
in total production. Contract farming within horticulture, dairy and aquaculture may offer a longer-
lasting opportunity for smallholders to integrate into modernizing value chains, provided that they
are able to maintain a competitive edge. Unfortunately, evidence for the effects of contract farming
on smallholder income is limited and the little there is suggests that the value added generated
by the transformation of agrifood value chains will ultimately accrue to a small share of the farm
population. Farmers that will have been able to achieve a minimum scale of production to maintain
a competitive edge may remain a minority of the total population that would otherwise be eligible
to participate in the contract farming process (see Barrett et al., 2012).
At the production end of the value chain, policymakers will more strongly emphasize
engaging with the private sector to better include and engage with smallholders. As agriculture
commercializes, food demand becomes more differentiated and the cost of accessing value-adding
services decreases, particularly in upper-middle-income countries; an increasing share of the
value generated along a supply chain will correspond to the provision of services such as advice,
114
processing, packaging, transporting and retailing. Improving the competitiveness of a particular
value chain will by necessity require investments across its various segments by multiple actors:
a value chain is in fact as efficient as its weakest segment. While the private sector will have a
prominent role in driving agribusiness growth by seeking remunerative investments, the public
sector will play a critical coordinating role by investing in non-excludable infrastructure and services
that the private sector would otherwise underprovide. Government policies will serve the purpose of
aligning private and social returns from the development of strategic value chains. For coordination
among public and multiple private players to succeed in delivering the required investments over
time, governance structures need to be in place.
Governance will be an area of great concern, as the form of market organization in privatized
food systems will determine the distribution of value among value chains stakeholders. Across
most of Asia, the typical current model of governance of value chains is represented by boards
where most of the concerned government agencies are represented but where representation of
private sector and farmer organizations is usually minimal. As value chains become more segmented,
models of devolved governance will become more attractive. Under such arrangements, private sector
and farmer organizations will take responsibility for delivering value-chain-specific public goods
and services (e.g. market intelligence and promotion, R&D, advisory services) within an established
normative framework, access to predictable financial resources, and verifiable objectives set through
negotiation with the public sector, the ultimate role of which is to promote the general public
interest. Models of value chain organization include interprofessional associations and commodity
councils in the European or American tradition.
Further down the value chain, policymakers will focus more on food safety legislation,
the upgrading of mainstream domestic food markets and the promotion of domestic MSMEs
(see chapter 6 of IFAD, 2016a). In spite of the growing share of supermarkets and specialized
wholesalers in Asian food markets, well above half of food is retailed through conventional markets
and food stores. Traditional food supply chains are characterized by the presence of a large number
of MSMEs. These are shorter chains that link farmers to local, regional and suburban markets,
and food products undergo less processing than in modern supply chains. Consolidation through
mergers and acquisitions and equity investments will continue to transform food value chains,
but smallholders and MSMEs will remain integral players. As the primary means of ensuring
quality and standardization within larger value chains, food safety regulations will become
especially relevant for smaller enterprises and for the consolidating forces that they interact with.
Most importantly, compliance with standards will affect production costs at the farm level and
throughout the value chain, shaping the competitive position of MSMEs vis-à-vis larger players.
Overall, rice-centric food policies in Asia will gradually give way to a greater focus on
high-value crops and the feed-livestock complex. In response to dietary shifts away from cereals,
traditional rice self-sufficiency policies will increasingly come under pressure. These policies alone
will not guarantee independence from imports and can dampen farmers’ responses to the growing
demand for non-cereals (Jamora and Labaste, 2015).
Two important trends drive the pressures towards the demise of these policies. First, the growing
demand for feed driven by consumption of pork, poultry and fish is being met through imports of
soybean and wheat – crops in which most of tropical Asia is not competitive, given the agroecological
conditions. In the Philippines, for instance, wheat has traditionally been substituted for maize in
feed production as a means of managing relatively high import tariffs on the latter. In Indonesia,
the middle class is driving the demand for wheat imports as it reduces its per capita consumption of
rice. In spite of the inclusion of soybean in food self-sufficiency policy, Indonesia will continue to
depend on its imports to satisfy the demand for tempeh.

115
57. The tariffication of the rice import quota that the Philippines has recently announced is in fact an early example of the dynamics hereby described.
Second, farm programmes that mainly focus on rice absorb resources that governments could
otherwise devote to the development of infrastructure and public goods that can help farmers
respond to the demand for horticultural, dairy, livestock and seafood products, such as laboratories,
training programmes and quarantine services. Finally, in rice-importing countries farmers with small
plots do not benefit from rice price protection policies (e.g. support prices and import tariffs) unless
they are able to produce a marketable surplus. Land consolidation could emerge as a response to
the competitive pressure and result in larger commercialized rice farms. On the other hand, such a
development would further weaken the poverty reduction justification of rice support programmes
and policies in such countries.57
Conclusions
What do all of these pressures and policy trends mean for investment in rural areas across Asia?
Overall, the growing demand for more diversified, inclusive, sustainable and efficient food systems
will continue pressuring public and private efforts to identify and scale up innovative agribusiness
investment models. While agriculture’s direct contribution to poverty reduction will require
continued focus on support to productivity growth (particularly in areas where yields are below
potential), it will be increasingly important to create the conditions for its indirect contribution to
poverty reduction through product and labour market linkages. The demand for food and industrial
crops will continue to steadily rise as drivers discussed above will continue to operate. This will also
mean that opportunities for FDI in food manufacturing and retail will continue to increase as supply
chains require capital investments to modernize and take advantage of scale economies arising from
the growing volume of agricultural products flowing to urban areas and foreign markets.
There is no shortage of funds in Asia for profitable investments. The challenge will be one of
creating a business environment that balances the need to reward the productive use of such funds
in agribusiness with social and environmental safeguards. Public authorities, including investment
boards, are therefore expected to display a growing interest in identifying inclusive and sustainable
agribusiness investment models that would warrant public incentives, including tax holidays and
exemption from import duties on imported machinery, that would also enhance the efficiency of
agricultural supply chains. The role of investment funds to channel risk capital into agrifood value
chains is expected to grow, with a focus on global public-private partnerships (FAO, 2012; Credit
Suisse et al., 2015).

116
LAOS
117
Shifts in development strategies shaping Asia’s agriculture and rural transformation paradigm
There are four strategic priorities that have emerged at the top of the policy agenda of several Asian
countries and will significantly influence the thinking on agriculture and rural transformation
pathways. These are:
(i) the greening of growth;
(ii) the scaling up of social protection programmes;
(iii) the deepening of subregional cooperation and trade;
(iv) the scaling up of measures aimed at eradicating malnutrition.
ASIA’S PATHWAYS TOWARDS AN INCLUSIVE AND SUSTAINABLE AGRICULTURE AND RURAL TRANSFORMATION
KEY MESSAGES
To effectively pursue an inclusive rural transformation, agricultural and rural development policies
need to be harmonized with important shifts taking place in the development agenda: (i) the greening
of agriculture; (ii) the scaling up of social protection programmes; (iii) the deepening of regional
cooperation and trade; and (iv) scaling up of nutrition programmes.
The policies and institutional reforms within a developing Asian economy will need to be finely tuned
to that country’s stage in the rural transformation path, depending on whether it is in the middle
of its agricultural modernization and intensification or whether it is sustaining the results of that
modernization, accelerating its transformation.
Public investments and interventions at the field level need to take into account the heterogeneity of
Asia’s rural landscapes, differentiating between rural areas with fully commercialized agriculture, rural
areas where commercialization is incipient in spite of their favourable agroecological conditions and
rural areas that are rich in natural resources but structurally in food deficit. Rural areas that have poor
resource endowments and that are structurally in a food deficit should be primarily targeted through
social protection and assistance programmes.
To be successful in transforming the rural economy while integrating smallholders, agricultural policies
and public investments need to remain focused on three key objectives: (i) making commercialization
of agriculture work for smallholders; (ii) enhancing the competitiveness of smallholders and rural
producers; and (iii) strengthening environmental sustainability and climate resilience of agricultural
systems and rural communities.

118
There is an increasing realization among policymakers in Asia that agricultural growth is losing
its comparative advantage in reducing poverty by raising farm income. Traditional approaches
to agricultural growth based on the Green Revolution paradigm are increasingly showing their
limitations when addressing natural resource constraints and the impact of climate change.
Agricultural development policies will nevertheless remain a key tool in delivering on the SDGs
and Agenda 2030 policy toolkit. The issue, then, is to make such policies coherent with relevant
cross-sectoral higher-order development priorities.
The greening of growth Towards Green Growth in Southeast Asia, launched in September 2014, has been one of first
frameworks developed for regional leaders to identify green growth solutions for their economies,
among which are accounting for the essential ecosystem services and ending open-access natural
resource exploitation.58 Asian countries are increasingly looking into mainstreaming green growth
in their national strategies and plans (see Jacob et al., 2013). The Republic of Korea, for example, has
been at the forefront, developing its National Strategy for Green Growth for 2009-2050. Viet Nam
and Indonesia have launched dedicated national green growth strategies closely aligned with their
national climate change strategies.
There has been no shortage of analyses on how to incorporate agriculture into national green
growth strategies: supporting climate-smart agricultural technologies (see FAO, 2012a); introducing
market-based incentives for resource use efficiency throughout supply chains and well-defined
and enforced property rights (see OECD, 2011b); introducing rewards for farmers for adopting
sustainable practices (see WFO, 2012);59 improving access to productive assets by agricultural
producers, especially smallholders and rural women (see UNDESA, 2012c); and including natural
capital stocks in national accounts (see UNEP, 2011).
Agricultural policies supportive of national green growth objectives would therefore call for new
approaches in designing income support programmes for smallholders by reducing the dependence
on fertilizer subsidies while increasing incentives for sustainable use of natural resources, including
provision of ecosystem services. At the same time, access to financing and insurance mechanisms
is key to help smallholder farmers transition to new production systems and rural communities to
invest in energy- and labour-saving technology such as solar systems, wind energy and biogas (see
Lybbert and Sumner, 2010). Clear land rights or usufruct rights60 give communities and farmers
the incentive to restore or maintain environmental resources, such as replanting and managing
forest areas. Public-Private Partnerships (PPP’s) will be key to fostering investments in innovative
technologies and support education in agricultural best practices.
Scaling up social protection programmesThe persistence of smallholder agriculture in settings such as South-East Asia is regarded as a puzzle
whose solution ultimately lies with the hurdles and risks that households still perceive as associated
with exiting agriculture altogether.61 As government-supported social assistance and protection
programmes increase their coverage and are better able to effectively protect households from
58. Green growth signifies an alternative development path that simultaneously pursues socio-economic progress and environmental conservation (OECD, 2011).
59. Payments for ecosystem services (PES) represent an early approach to develop market-based incentives for farmers to supply ecosystem services through a conscious management of the natural resources under their control. In face of limitations and risks inherent in this approach, PES have evolved towards co-investment approaches based on partnerships involving communities, local and national governments, and the private sector.
60. The right to use and derive profit from a piece of property belonging to another, provided the property itself remains undiminished and uninjured in any way.
61. One only has to recall the mass migration from urban centres back to the farm in the wake of the 1996 crisis. See FAO (2007) for a review of the role of agriculture as a buffer at times of macroeconomic crisis.

119
employment and food price shocks, it can be expected that an increasing number of households
will exit agriculture, provided they are able to either rent the land without risks or sell it at a
reasonable price (see previous point).
Since the early 2000s Asian countries have increasingly turned to social protection programmes
to efficiently tackle poverty eradication in rural areas and this strategy has gained momentum during
the past decade. Social assistance programmes include conditional and unconditional cash transfers,
food and in-kind transfers, school feeding programmes, public works and food for work. As shown in
Table 5.1, the extent to which the poorest 20 per cent of households are covered by such programmes
varies by country. Beneficiary graduation remains a major concern for policymakers supporting
the expansion of social protection programmes, given the perceived dependence engendered in
beneficiaries. It has been found that, once households have better access to land, tools and/or
education, they use cash transfers more productively (Barca et al., 2015) and have better chances
of exiting the poverty trap that they are locked in. Furthermore, location matters: where markets
are more developed, the effects of cash transfers tend to be stronger, as production inputs are more
accessible, whereas in areas where markets are less developed cash transfers function better as safety
nets. Finally, there is evidence from African cash transfer programmes that, when households receive
a predictable flow of transfers, food consumption increases and food insecurity is reduced.
TABLE 5.1
ASIA’S PATHWAYS TOWARDS AN INCLUSIVE AND SUSTAINABLE AGRICULTURE AND RURAL TRANSFORMATION
KHM
AFG
NPL
IDN
KIR
LAO
FSM
PNG
PHL
SLB
TMP
VNM
BGD
BTN
IND
PAK
LKA
FJI
MYS
MHL
MNG
PLW
THA
MDV
Low income
Lower-middle income
Upper-middle income
Country code Income classification Year
2008 - - - - -
2011 - - - - 12.467
2010 2.335 - 5.948 - 10.218
2011 - - - - -
2006 4.840 - - - -
2007 - - - - -
2000 4.617 - - - -
2009 1.855 - - - -
2013 2.337 50.754 10.113 - 1.355
2005 1.114 - - - -
2007 - - 23.309 - 0.215
2006 2.361 - - - -
2010 0.267 14.582 0.742 - 0.786
2012 - - - - -
2011 - - - - 26.556
2009 12.293 0.136 2.313 - -
2006 51.228 - - - -
2008 7.108 - - - -
2008 93.552 - - - -
1999 - - - - -
2007 91.370 - - - -
2006 8.668 - - - -
2009 4.342 - - 60.192 -
2004 1.981 - - - -
Source: World Bank, 2017a.
Social assistance: percentage of poorest quintile receiving coverage
Cash transfers
Conditional cash transfer
Food and in-kind transfers
School feeding
Public works and food for work
120
Integrating productive and social assistance programmes increases the capacity of poor
households to graduate out of social assistance programmes and to sustain through time the
benefits from asset-transfer and training programmes (FAO, 2015c). Integrating social protection
and agricultural support policies (e.g. input subsidies, extension and credit) can therefore facilitate
a permanent exit from poverty while reducing possible reversals. Furthermore, as shown in the
case of Brazil’s Zero Hunger programme, smallholders can actually become at the same time
beneficiaries of social programmes or policies that use food, such as school feeding programmes or
public food procurement programmes for schools, hospitals, the army, prisons, etc. Participation
in these procurement programmes becomes an opportunity for smallholders to form common
interest groups and learn how to bring their products to a standard of quality and consistency
which could then make it easier for them to subsequently meet the requirements of private buyers
and commercialize their products at a larger scale (FAO, 2015c).
Deepening regional cooperation and tradeThe growing demand for food and industrial crops in domestic and international markets, improved
transportation and communication infrastructures, macroeconomic stability and openness to
foreign direct investments have placed Asia at the forefront of private sector investors in agrifood
value chains. Given the prominent role that food security plays in Asia’s domestic policies, a gradual
approach of trust building through policy dialogue and on-the-ground action has proven effective in
creating the institutional space for global agribusiness investors to engage in raw material sourcing
and processing. The World Economic Forum (WEF)-backed Grow Asia initiative brings together
companies, governments, NGOs and other stakeholders to help smallholder farmers improve their
production and livelihood through access to information, knowledge, markets and finance in key
regional value chains (e.g. livestock, feed, seafood, rubber and palm oil). Participants pilot business
models selected for their potential to create value, reduce their environmental footprint and increase
farm income, paving the way for successive scaling up. Originally piloted in Indonesia and Viet Nam,
Grow Asia now also involves Cambodia, Myanmar and the Philippines.
With the exclusion of rice and other politically sensitive crops, integration of ASEAN agrifood
markets has recently gained momentum, and questions are being raised about the role that the
South Asian Association for Regional Cooperation (SAARC) could play in South Asia. While self-
sufficiency policies for sensitive staple crops limit market integration and stunt private sector
incentives for investing in the modernization of currently inefficient supply chains,62 there is ample
space for policies that encourage agricultural investments and support in more competitive value
chains. As a forum for high-level and evidence-based policy dialogue, ASEAN is in an ideal position
to promote a convergence of national policies towards a common set of rules on tariffs and customs
so as to ensure that supply chains with multiple country presence are allowed to operate efficiently.
While reducing tariff barriers and constraints to foreign direct investment in agribusiness will create
pressure on local farmers and agribusiness, long-term gains from the modernization of supply chains
will ultimately pay off (World Bank, 2014). Key areas in this agenda include improved land tenure
regulations, enabling business environments through streamlined regulations at local and national
levels, and opening spaces for farmer organizations to represent the interest of smallholders in
technical tables. Convergence on ASEAN common trade policies and regulations and on policies
and strategies for common natural resources remains an important area for policy action.
62. World Bank (2014) examines the deterring effect that public policies on self-sufficiency have on private sector investment in the rice and corn value chains in Asia.
121
Scaling up nutrition In 2015, the SDGs prioritized the objective of ending all forms of malnutrition by 2030. At least
12 of the 17 SDGs contain indicators that are highly relevant for nutrition. To this end, 2016-
2025 has been recently named the United Nations decade of Action on Nutrition. Addressing
rural undernutrition and malnutrition is a central part of a long-term strategy for eradicating rural
poverty and promoting rural development.
Rural transformation and nutritional improvements are inextricably linked. The development
of more efficient production and marketing systems, more stringent food safety norms and the
expansion of income and livelihood opportunities all occur hand in hand with better food security
and nutritional outcomes for rural people (IFAD, 2016 a). Simultaneously, improved nutrition,
especially a reduction in maternal and child undernutrition, reinforces trends in lower mortality,
better educational attainments, and rising wages and incomes. However, the prevalence of
undernourished children remains high and persistent over time, especially in rural South Asia, as
discussed in chapter 1.
Traditionally, economic analysis of hunger has focused on calories alone, but there is growing
interest in “hidden hunger”: micronutrient deficiencies which can have serious repercussions for an
individual’s growth and development. In Viet Nam, wild vegetables make a significant contribution
to overall intake of micronutrients, e.g. carotene, vitamin C and calcium. A significant relationship
between crop diversity and diet diversity has been established for Bangladesh, where, for instance,
aquaculture interventions have had a positive impact on consumption and household nutrition.
Gender-sensitive approaches in aquaculture are likely to increase the participation of women and
enhance access to nutritional benefits. In Pakistan, an increase in the productivity of the processing
of pulses through better agricultural research has had a substantial impact on nutrition, iron intake
and human productivity.
Agriculture remains a key component of national strategies aimed at eradicating hunger and
reducing malnutrition. It does so by:
(i) raising individual or household incomes, which can then in turn be spent on more
nutritious diets or on interventions in areas such as education or health, which lead to
better nutrition;
(ii) increasing the production of nutritious food and making it available for market as well
as self- consumption;
(iii) linking producers and consumers through markets that ensure not just availability but
also quality, safety and affordability (price stabilization);
(iv) empowering women so that they can influence allocation of food in favour of their
children.

122
Asia’s differentiated stages in the transformation of agriculture and the rural economy
Although rural Asia encompasses a host of different cultural, socio-economic and agroecological
contexts, there are commonalities in development processes, institutional arrangements and access to
technological options that hint at some patterns. When looking at differences in rural development,
one can discern variations both between and within countries, where between-country variations are
correlated with the stage of development of the economy as a whole, and within-country variations
with the extent to which lagging and dynamic rural areas have been connected. Two broad country
groups can be identified when taking into account the role in development of agriculture and the
rural economy, the priorities underpinning public investments in the sector and the associated most
pressing political economy challenges:63
Agriculture-intensifying and -modernizing (AIM) countries. Most of Asia’s lower-middle-
income countries are part of this group, which includes most of South-East Asia with the
exclusion of upper-middle-income countries, most of India’s states and the rest of South
Asia’s countries excluding Sri Lanka. AIM countries have transitioned from their agrarian stage
and adopted the Green Revolution model, particularly in the more well-endowed agricultural
areas. They are expected to face second-generation policy issues in terms of inclusiveness and
sustainability of their agricultural and rural transformation.
• The role of agriculture in poverty reduction: AIM countries are witnessing rapid growth
in the urban middle class and rapid structural transformation. A distinctive characteristic
of their development is the growing gap in labour productivity between agriculture and
the rest of the economy. Agriculture represents more than 15 per cent of GDP and is a
source of livelihood for more than 30 per cent of the population. Coverage of social
protection and assistance programmes remains limited given the limited fiscal space in
relation to the size of the population in need. In AIM countries broad-based agricultural
growth remains key to poverty reduction both as a direct support to the food security and
income of the rural poor and because of the multiplier effect it has on the local economy
through linkages with the non-farm sector.
• Stage of agricultural transformation: in AIM countries, commercialization of agriculture
is spreading fast and reliance on markets to access food has become the norm. While capital
deepening in agriculture is advancing, it is even more rapid in urban-based industries and
services. The accelerating food demand is met through domestic agricultural production
that is intensive in the use of natural resources (forest, land and water).
• Rural population dynamics: an important distinction among AIM countries is made
regarding historical trends in rural population. While in South Asia’s AIM countries rural
population pressure is expected to peak in 2030, in South-East Asia the decline in rural
population is expected to be a reality by 2020.64 In the latter group of AIM countries the
decline in rural population implies increasingly active land markets and a reversal in the
decline of the average size of farms.
63. The categories follow the approach of IFAD’s Rural Development Report of 2016. 64. According to the most recent United Nations population projections (FAOSTAT, 2017).

123
• Integration of lagging rural areas: AIM countries typically contain lagging rural areas:
places of high agricultural productive potential where commercialization is still incipient
and where access to food is mediated through local markets rather than longer, more
modern, supermarket-driven supply chains. These high-potential lagging areas will attract
the focus of agricultural development efforts in the near future. Conversely, lagging areas
with limited agricultural potential will attract development initiatives that facilitate the
exit of poor unproductive farm households from agricultural work altogether.
• Rural policy framework: AIM countries typically possess weak enabling policy frameworks
towards rural investment climate and private sector development. Weak enforcement
capacity undermines these policies even if they are present. Agricultural markets in these
countries may not be fully liberalized, regulatory frameworks are still in a development
phase and business start-up costs remain relatively high – especially for the rural poor.
Access to formal rural financial institutions is limited while village-level savings and credit
groups remain a reliable but limited pathway for rural financial graduation.
• Second-generation policy challenges: in AIM countries the key policy challenges include
(i) closing the yield gap in poor areas with agricultural potential by improving access to
commercial inputs and appropriate technologies, (ii) strengthening private sector incentives
in sourcing agrifood products, (iii) reducing the pressure on natural resources while
enhancing the resilience of rural communities to climatic shocks, (iv) facilitating the financial
graduation of rural producers and (v) stimulating growth in the rural non-farm economy,
particularly in areas characterized by declining farm size and growing rural population.
Agriculture-sustaining and -transforming (AST) countries. This group includes upper-
middle-income countries as well, including China, Indonesia, Malaysia, Sri Lanka and
Thailand. These countries are characterized by declining rural population, rapidly increasing
rural wages and an advanced stage of agricultural commercialization.
• Role of agriculture in poverty reduction: from a structural perspective, agriculture represents
a small share of GDP (less than 15 per cent) and of total employment (prevalently less than
30 per cent). The labour productivity gap has peaked and stabilized and is now declining,
although at a slow pace. In AST countries, poverty, including in rural areas, has declined at a
rapid pace and its eradication by 2030 is likely; eradicating poverty will result not only from
the sustained growth rate but also from the increasing coverage of national social protection
and assistance programmes made possible by the improving fiscal space.
• Stage of agricultural transformation: as yield growth is plateauing in ASC countries,
higher labour productivity in agriculture will come from greater mechanization (capital
deepening), greater farm gate value for agricultural crops and/or more value addition
with integration in immediate downstream processing of agricultural commodities. The
share of farm output that is commercialized is higher than in AMC countries.
• Integration of rural lagging areas: compared with AMC countries, farmers in
lagging areas with agricultural potential can be integrated more rapidly provided the
required investments in infrastructure and support services are prioritized. Poverty is
concentrated in marginal areas where low productivity farming dominates and where
local opportunities for income diversification might arise from tourism.
• Rural policy framework: the policy framework is generally developed and supports the
functioning of financial input; output markets and the establishment and operation of
FOs are generally positive. Following recent trends in liberalization and deregulation, in
most AST countries the investment climate for private sector investments, MSMEs and
farmer organizations is generally well developed.

124
TABLE 5.2
RURAL DEVELOPMENT APPROACHES AND MAIN CHALLENGES FOR INCLUSIVE RURAL TRANSFORMATION IN ASIA
Degree of structural transformation
Main policy objectives influencing agricultural and rural development policies
Main countries concerned
• Moderate structural transformation:
• Primary agriculture represents more than 15 per cent of GDP and more than 30 per cent of total employment
• Gap between agricultural and non-agricultural labour productivity is widening
• Rural wages are generally on the rise at moderate pace
• Agriculture represents the backbone of the rural economy, although the share of non-farm income in total household income is increasing rapidly
• Agrifood system is transforming rapidly as a result of urbanization. Deregulation and foreign and domestic private investments result in longer and leaner food value chains
• Commercialization of agriculture is rapidly spreading, although spot markets are still relevant in price discovery
• Rural population has yet to peak: in South Asia by 2030 and in South-East Asia by 2020
• Foster rural non-farm employment
• Strengthen agriculture’s linkages to the agro-industrial sector
• Stabilize food prices while increasing farm income
• Increase efficiency in the use of natural resources in production processes
Lower-middle-income countries; large parts of east, north-east and central India; western provinces of China
Advanced structural transformation:
• Agriculture represents less than 15 per cent of total GDP and generally less than 30 per cent of total employment
• Gap in labour productivity has slowed down and is stabilizing
• Rural and urban labour markets are integrated and rural wages are increasing at an accelerated rate, converging with urban salaries
• Farm income is less than 50 per cent of total household income, particularly for households with limited land access
• Agrifood systems have modernized and contractual arrangements increasingly determine prices and distribution of value added along the chain
• Declining trend in rural population
• Improve environmental quality
• Integrate lagging areas into the national economy
• Upgrade agrifood value chains through greater focus on food safety and environmental standards
• Recognize rural heritage as a key pillar of the national cultural identity
Upper-middle-income countries: China, Indonesia, Iran, Malaysia, Sri Lanka, Thailand; most advanced states of India; eastern provinces of China
Intensifying and modernizing agriculture Sustaining and transforming agriculture
• Third-generation policy challenges: for AST countries the main policy challenges
include (i) integrating marginal rural communities through targeted programmes or by
leveraging their natural resource base through payments for ecosystem services (PES),
(ii) reducing the environmental footprint of agriculture through an upgrading of agro-
environmental policies, (iii) developing the market governance institutions that regulate
the distribution of value along the rapidly modernizing (or modernized) food value
chains, in particular through market organizations where organizations of buyers and
sellers negotiate reference prices, grades and standards, and (iv) reforming land markets
to facilitate the emergence of entrepreneurial small and medium-sized farms.

125
65. Tables 5-2a-c provide a snapshot of the analysis in this section. 66. See IFAD’s Strategic Framework 2016-25.
Strategic thrusts for an Asian smallholder-centred agricultural and rural transformation agenda65
Transforming Asia’s agriculture and the rural economy will require attracting private investments
in the modernization of value chains and in the adoption and adaption of new technologies and
management practices at the farm level. The public sector plays a key coordinating role through
its investment programmes and policies that aim to improve the attractiveness of investments by
farmers and private entrepreneurs and the capacity of stakeholders to benefit from commercialization
opportunities. In this process, social benefits otherwise undervalued or not accounted for by the
market need to be safeguarded.
As Asian policymakers examine options, three strategic thrusts emerge as organizing principles to
shape and prioritize public agricultural and rural policies and investments: (i) making agricultural
commercialization work for the poor; (ii) enhancing the competitiveness of smallholders and
rural producers; and (iii) strengthening the environmental sustainability and climate resilience of
agricultural systems and rural communities.66
To improve market access, governments will need to create a favourable business climate in rural
areas for private entrepreneurs and farmers. Appropriate infrastructural investments will be required
to reduce transaction and transportation costs. Meanwhile, rural producer organizations will have
to strengthen their capacity to bridge the gap between the market and the individual farmer, a gap
that increases inversely with the size of the farm. The competitiveness of smallholders will hinge
very much on their ability to reduce their average costs. To achieve that, either production costs
need to be brought down or yields need to be increased. Farm-level investments will benefit from
improved tenure security, access to irrigation water, technology and financial services. Finally, for the
transformation of agriculture to respond to the objectives of sustainability and climate resilience,
public and private investments will be required to identify, adopt, adapt and scale up appropriate
technologies and land management practices. In all cases, policy and institutional innovations will
be required along with, where necessary, targeted forms of financial support.
The prioritization and contextualization of these strategic thrusts needs to take into consideration
country specificities regarding the role of agriculture in sustainable development and variations in
agricultural landscapes when it comes to field-level interventions. At the cost of oversimplification,
three relevant types of rural areas can be identified from a public investment perspective, combining
agroecological conditions, integration in agrifood markets, infrastructure development and
development of farmer organizations:
Commercially integrated productive areas: these include those rural areas that are well
integrated into modern value chains and commercial food systems. This includes areas
close to urban centres that have relatively well-developed infrastructure such as roads,
electrification and market facilities. Commercial farms characterize the productive
environment, and farmers’ associations or cooperatives are active. Although most Asian
countries have regions with a thriving agribusiness sector, AST countries (or AST subnational
entities) are expected to have most of their agricultural regions highly integrated into
commercial agrifood systems.

126
Marginally integrated productive areas: these consist of areas that are marginally integrated
into modern value chains but have the potential to become food surplus areas in view of their
endowments of fertile lands and water resources. Although they have a high potential for
agricultural commercialization, they face challenges such as poorly developed infrastructure
and low capacity of rural poor’s organizations. Individually, agribusiness investors face high
transaction costs in developing commercial linkages with local farming communities. Because
of remoteness and limited access to irrigation services, farmers are not competitive and therefore
are seen as only marginal suppliers by commercial buyers. Transforming marginally integrated
areas in commercial farming areas requires significant up-front investments in infrastructure
and logistics. Even though present in most of the AST countries, marginally integrated rural
areas are expected to represent a high share of agricultural land in AMI countries.
Natural resource-rich food-deficit areas: these include upland and mountainous areas that
are rich in natural resources and ecosystem services but do not possess sufficient land resources
to produce a surplus of food for urban centres or export markets. Indigenous peoples tend to
be concentrated in upland and mountainous areas for historical reasons tied to colonization
and marginalization. The private sector finds it difficult to operate in these areas owing to
their remoteness, poorly developed infrastructure and the limited outreach of public services.
However, these areas have the potential for the production of niche products such as NTFPs.
Such areas represent a large part of Asia’s rural world.
Strategic thrust 1: making commercialization work for smallholders and rural SME’sImproving the rural business climate
Fostering a favourable rural investment climate is of paramount importance, requiring a focus on
reducing commercial and policy risks, particularly for MSMEs given their role in local development.
Simplification of regulatory and licensing frameworks requires balancing public interest in food safety
and environmental quality. Importantly, governments should separate clearly their role as entrepreneur
– in the form of state-owned enterprises – from their role as regulators where these overlap.
Progress in this area has been noticeable in Asia’s recent past, although there is ample scope for
improvements. For example, in both China and Viet Nam, state-owned enterprises in agriculture
(and especially in the strategic grain sector) have been either privatized or requested to seek financial
sustainability. In Sri Lanka duty-free importation of raw materials and preferential tax allowances have
led to a large expansion of FDI; steps to open a business have recently been simplified from eight to
four steps, the time required has been reduced from 38 to 8 days and the government has undertaken
active policies to partner entrepreneurs with larger value chain actors. In China, the time needed to create
a business remains relatively long, but the government has undergone a coordinated effort to expand
credit, tax incentives, extension services and access to R&D in favour of MSMEs. In Viet Nam, accession to
the ASEAN Free Trade Area (AFTA), a simplified common regulatory framework for business registration
established as early as 2005, and a package of incentives for the establishment of rural enterprises (such
as tax incentives, credit windows and extension services) have led to a large growth in rural businesses.
On the other hand, efforts to develop enabling institutional and regulatory frameworks for
rural SMEs remain at a relatively early stage across several lower-middle-income Asian countries.
Governments exercise a large degree of control over the agricultural economy, and rural business
environments remain largely informal. Both the Lao PDR and Cambodia have made strenuous efforts
to attract foreign investment and to privatize agricultural and resource-based activities in rural areas;
nonetheless, support systems for SMEs are at an early stage of development. Inconsistently applied
legal frameworks and tax incentives, large foreign land concessions and high time and monetary
costs of business creation have led to a “dual economy” that is dominated by a small number of
large, formally registered firms on one hand and a large number of small informal ones on the other.
127
Bangladesh and India have liberalized their agricultural economies and also undertaken a series of
innovative approaches to improving business regulatory frameworks for SMEs in rural areas. Bangladesh
has overseen a continued reduction in agricultural subsidies; its business regulatory framework
supports rural SMEs through the Bangladesh Small and Cottage Industries Corporation, although
these continue to face great difficulties in accessing inputs and infrastructure in rural areas. In India,
the government has prioritized the extension of infrastructure and public services to rural areas: the
National Bank for Agricultural and Rural Development (NABARD) develops partnerships between
credit and service providers, self-help groups and local institutions; the SME Development Act (2006)
has laid the foundations for a more regularized SME credit scheme. However, extensive government
pricing policies (through the Commission for Agricultural Costs and Prices) and food subsidies
continue to distort much of the rural agricultural market and cause high start-up costs for businesses.
For countries where the rural business climate is still weak, the privatization of agricultural input
markets, the consistent application of legal frameworks and the formal registration of producers
within local institutions will be the first and most important step in fostering a more equitable
rural business climate. In countries that are becoming attractive to foreign investors and large
domestic value chain actors a second-generation challenge concerns managing the negative impact
on existing domestic competitors. Empirical evidence on the impact of FDI in the agribusiness
sector is limited. In the case of China, however, recent studies have found that acquisitions by
foreign companies improve the productivity of the bought-out domestic companies and of those
vertically linked. Domestic competitors have instead been negatively impacted (see Jin et al., 2017).
Maintaining a competitive environment in the food industry will be critical for smallholders and
farmer organizations engaged in marketing. A competitive fringe of agrifood SMEs will preserve
a fertile ground for innovations, for enhancing the bargaining capacity of smallholders and for
maintaining a demand for agrobiodiversity67 in local and regional food markets. Macroeconomic
stability, credible fiscal policies, enforceability of contracts and a strong rural infrastructure are
powerful attractors of domestic and foreign investments.
Market access infrastructureThe rural infrastructure gap affecting many Asian countries – mainly in roads, transport, power,
telecommunications and irrigation – represents a key bottleneck in the region’s transformation of
food. In India, for instance, more than 50 per cent of villagers have to travel more than 10 km to reach
the nearest wholesale agricultural market (IFAD, 2014). In China, local governments have not paid
enough attention to village road maintenance and road deterioration is extensive. In Indonesia, where
rural roads make up 72 per cent of the classified road network, almost half of this network is in poor or
bad condition. As Asian economies grow, more investments in rural infrastructure can be expected to
materialize with improving public finances. Indonesia and the Philippines, for instance, are currently
prioritizing rural infrastructure programmes with a noticeable increase in national budget support.
Rural infrastructure needs for smallholder farmers vary according to the potential degree of
agroecological market integration characterizing a given region. Commercially integrated productive
areas have as a priority to ensure that infrastructure such as market roads and irrigation facilities is
sustained in a way that keeps agricultural production and transport costs competitive. Furthermore,
even when market access roads are well developed, farmers cannot optimize benefits in the absence of
access to market information. In such cases, improving access to telecommunications and relevant
marketing information will be a priority. In a typical decentralized context, local governments
normally bear the burden of maintenance of local transport and communication infrastructure.
67. Agrobiodiversity: the variability among living organisms associated with the cultivation of crops and rearing of animals, and the ecological complexes of which those species are part. This includes diversity between, and within, species and of ecosystems (McNeely and Scherr, 2003).

128
In marginally integrated areas, the role of infrastructure cofinanced by national and local
governments is a necessary condition to develop an efficient marketing system. An entire set of
interlinked logistics and communications components must be in place to jump-start and bring to scale
agriculture’s commercialization. Physical transit components include farm-to-market roads, regional
highways, railways, trucks and rolling stock. Communications networks involve telephones, radios
and information-gathering capacities on the parts of local and regional governments. Simultaneously,
policymakers must prioritize the delivery of utilities, including reliable supplies of electricity for
lighting. Finally, the architecture for functional agricultural value chains remains of paramount
importance: this consists of market centres and wholesale terminals with convenient access to both
transport facilities and financial intermediaries, and a set of accepted grades and standards for traded
commodities that permit reliable “arm’s-length” contracts to be written and enforced at low cost.
Taken together, all of these disparate components play mutually reinforcing roles in generating a
business platform that helps crowding-in private sector investments. While economies of scale and
scope68 are rather limited at the farm/production level, they do matter at the marketing level given
the incidence of transport, electricity and communication costs. By ensuring the development of
scale and scope economies in agriculture, an effective marketing platform has the potential to raise
the agricultural competitiveness of an entire region.
In many Asian countries (e.g. China, India, Viet Nam and the Philippines) remote resource-rich
but food-deficit areas are often inhabited by indigenous peoples’ communities that often endure
social and economic marginalization. Rural infrastructure in such areas is typically neglected. Even
in settings such as China, for example, the proportion of villages accessible by paved roads in poor
counties designated by the government in 14 poverty-stricken regions was 67.1 per cent, compared
with 86.5 per cent at the national level (IFAD, 2014). In Papua New Guinea, the topography is highly
challenging and most transport networks are in poor condition, with about 85 per cent of main roads
and nearly all feeder roads impassable or abandoned during some time of the year (IFAD, 2014).
About 17 per cent of the population has no access to any road and 35 per cent of the population lives
more than 10 km from a national road. As roads have deteriorated, transport costs have increased
between 40 to 60 per cent in real terms. Both the high costs of trading and advisory services affect
significantly the margins of cocoa and coffee, Papua New Guinea’s most important cash crops.
Rural producer organizationsThe major benefit of rural producer organizations (RPOs) is that they offer services to members at
low cost, including bulk purchase of inputs, transportation, negotiation with companies, obtaining
of credit from financial institutions and enforcement of contracts. Furthermore, when governments
have an open and regular dialogue with RPOs at national and local levels, these RPOs occupy a
unique position to voice the concerns of rural people.
Above all, RPOs play a critical role in guiding the transformation of rural food systems.
During the transformation process, spot markets give way to contractual arrangements between
farmers and buyers in determining price, grades, standards and cost structures along the chain,
particularly in the case of high-value commodities. In this context, governments will face the
need to organize markets so that bargaining between producers and buyers gains transparency
and results in stable and predictable market transactions. Achieving this will require RPOs and
buyers’ organizations to develop their capacity to handle sector-wide negotiations and, contextually,
for governments to develop appropriate underpinning policies and regulatory frameworks.
68. “Economies of scope” in the context of this report refers to the reduction in unit costs achieved by increasing the range of products that are marketed or processed. Reduction in seasonal periods during which marketing infrastructure or processing plants are kept idle, for instance, is an immediate example.

129
To be effective and representative of smallholders’ interests, RPO governance needs to be
strengthened so that representativeness can be built bottom-up and reflect a mediation of local
interests within sector-wide priorities.
Meanwhile, until organized markets evolve, producer collective interests need to be mediated by
local-level RPOs. To deliver effective and efficient services to their members, RPOs’ empowerment
and governance needs to be grounded in homogeneous membership profiles and commonality
of interests, which can range from specific commodities to natural resource management, rural
financial services, community development and planning processes, and service provision. The
challenge is to achieve discipline in collective action so that contract terms are met, side-selling
is avoided, loans are repaid, common natural resources are sustained and members are able to
derive tangible benefits from improved access to markets and technologies (Byerlee, de Janvry
and Sadoulet, 2010). Two main approaches for the development and empowerment of rural
organizations have found some success in development practice.
TABLE 5.3a
STRATEGIC THRUST 1
National policies and institutions
Investments for commercially integrated areas
Investments for marginally integrated areas
Investments for resource-rich/food-deficit areas
• Liberalize markets; remove inefficient pricing policies and agricultural subsidies
• Improve the efficiency and service delivery of rural development institutions within government
• Develop new partnerships between government institutions, downstream buyers and existing producers’ cooperatives
• Invest in existing market and post-harvest infrastructure that better connects producers’ organizations with downstream buyers
• Expand partnerships between government institutions and producers’ organizations and self-help groups
• Expand market and post-harvest infrastructure so that it is more accessible at the farm gate
• Strengthen framework for the provision of health and education services for smallholders and indigenous peoples
• Invest in basic infrastructure that facilitates transportation and market access for smallholders
• Invest in grass-roots organizations and self-help groups operating at the community level
• Improve the transparency and efficiency of regulatory frameworks that mediate relationships between producers, service providers and downstream firms
• Promote production quality and food safety standards across value chains for commercial agricultural products
• Strengthen existing relationships between producers’ organizations, service providers and downstream buyers
• Expand post-harvest and post-processing infrastructure for commercial agricultural products
• Support mature or apex-level rural producers’ cooperatives
• Directly support farmers’ organizations and cooperatives, with emphasis on minimizing risks they face when establishing new relationships with downstream buyers
• Expand transportation and post-harvest infrastructure from commercially integrated areas towards those in which they are less prevalent
• Invest in the expansion of existing social safety nets that lessen the risks for smallholders and indigenous peoples in exiting the agricultural sector
• Invest in the expansion of commercial infrastructure for NTFPs and other niche products
Strategic area Intensifying and modernizing agriculture Sustaining and transforming agriculture
Making commercialization work for smallholders and rural SMEs
130
The first approach focuses on the grass roots with the objective of building skills and cohesion by
leveraging common interests among members. Three different arrangements are normally observed:
(i) in areas where agriculture is well commercialized and buyers seek long-term marketing
arrangements that respond to their business needs, private companies promote and establish
farmer groups, organizations and associations (these groups are generally set up to facilitate the
implementation of the contracts and efficient flow of relevant services); (ii) in marginally integrated
areas, where the commercialization potential is discernible but commercial risks are high,
government agencies or extension services are involved in the administration and support of farmer
groups, associations and cooperatives; (iii) where public extension services are weak or in remote/
unfavourable areas, often governments or the private sector resort to NGOs in promoting and
setting up community-based groups and organizations. An effective model here aims at developing
RPOs with a strong element of empowerment and civil society support: initially, national NGOs
train local NGOs in how to reach and support poorer communities and groups; local NGOs in
turn organize and support grass-roots groups, who prepare community development proposals in
a participatory manner at village level or in a cluster of villages.
The second approach is the aggregation of rural organizations such as Self-Help Groups
(SHG’s) into federations or apex organizations. While SHGs could be the entry point for project
interventions, a medium-/long-term process should also be envisaged to facilitate their aggregation
or membership into apex associations to receive better services in a sustainable manner when
projects phase out, to achieve economies of scale and access bigger markets and to influence
policy.69 India has been at the forefront of the strategy of aggregating SHGs into associations, and
associations into federations, to enhance capacity for collective bargaining and supervision of
individual projects.
Strategic thrust 2: enhancing the competitiveness of smallholder and rural SMEsAccess to land and forests
Asian countries are characterized by varying degrees of inequality in land distribution and tenure
security. Land in countries such as China and Viet Nam is equitably distributed and tenure
security is supported overall. Inequality and tenure insecurity, to different degrees, has historically
characterized countries such as India, Indonesia, Nepal, Pakistan and the Philippines. Land and
tenancy reforms affecting private lands have been carried out to various extents in India, Pakistan
and the Philippines. Facilitating access to agricultural land in public lands has characterized land
reform efforts in Indonesia, while the Philippines has included titling of public lands in its broader
agrarian reform effort. A significant incidence of landlessness among rural households characterizes
countries such as Bangladesh, India and Pakistan. In India, scheduled caste/tribe households have
seen a decrease in access to land and have become more reliant on agricultural labour (Appu, 1996).
Highly skewed distribution of land and landlessness are among the major causes of poverty and
conflict in Pakistan’s rural areas. In a third group of countries, including Cambodia, the Lao PDR
and Myanmar, implementation of formal land tenure regulations has remained weak. For instance,
in Cambodia, landholding under customary tenure or informal titles remains predominant. The Lao
PDR is in the process of passing a revised land law to increase land tenure security and encourage
villages to protect forests by sustainably managing them.
69. An important issue constraining the expansion of the SHG-bank linkage model, as shown by IFAD’s experience in India, is the weak response from public sector banks in extending credit support to SHGs, despite the good track record of SHGs and associated borrowers.

131
Policy priorities in Asia with regard to land include (i) reducing inequality in land ownership
to ensure that the benefits of agricultural growth reach a vast mass of the rural poor; (ii) activating
land rental markets to support land consolidation and achieve efficiency in farm operations; and
(iii) improving management of forest land and natural resources while supporting livelihoods by
favouring access by landless households under leasehold or forms of common property tenurial
arrangements. All of these priorities have in common the need to strengthen tenure security
on farmaland.
While equality in land distribution has been found to be well correlated with subsequent
economic and rural non-farm growth, and poverty reduction (Deininger and Squire, 1996), the
strength of that correlation is likely to weaken as the share of agriculture in total GDP declines and
the productivity edge of small farmers diminishes. Furthermore, as the experience of the Philippines’
Comprehensive Agrarian Reform Program shows, unless supported by strong land administration
systems, land distribution programmes run the risk of taking decades to be completed while giving rise
to tenure insecurity and freezing land markets (World Bank, 2010). Notwithstanding these arguments,
substantial inequality in land ownership may still call for distribution on the ground of social justice.
Reforms of land rental regulations and policies currently underpin China’s agricultural
modernization efforts. While formal land ownership remains in the state’s hands, it provides rural
households with 30-year control rights. These rights allow households to lease their land, thereby
separating control from operations and facilitating land consolidation through rental markets. In
perspective, 260 million rural households will have control rights against a much smaller number
of farms. Currently farms remain small but since 2003 the average size has increased from 0.57 to
0.78 hectares. Consolidation may receive a further boost from recent regulations allowing for the
leasing of whole blocks of village lands.
Forests represent an important resource for the rural poor, with more than 800 million people
living in – and deriving an income from – forests and woodlands in the Global South alone
(Quizon, 2013). In India, Nepal, Sri Lanka, Indonesia, Thailand, Viet Nam and China, the share
of forests in total land area ranges between 20 and 50 per cent. In Indonesia, there are about
75 million hectares of degraded forest land alone. It is estimated that 61 per cent of the forests in
Asia are under government ownership and about 31 per cent are under the ownership of IPs and
local communities. Their tenurial status is often left unclear, implying weak or no legal protection.
There is a substantial potential to use this resource for sustained poverty reduction for millions of
IPs and other dwellers by transferring control of forest lands to these groups – either ownership or
conditional tenure – and by providing complementary support. Community forestry institutions
(CFIs), particularly led by women, play a critical role in this agenda, as recent research on India and
Nepal has shown: institutional sustainability and community support are higher among CFIs with
a high proportion of women in the executive committees, especially landless women.
Countries that are developing a policy framework for the land consolidation process face a
key question: should consolidation be driven by entrepreneurial smallholders or large investors?
Arguments for the latter case emphasize that outsider-driven consolidation would provide money
to pay wages, and leases would accrue to rural communities. Under this scenario, however, profits
would be syphoned off and local people would face limited opportunities to reinvest the gains
from agricultural modernization in the local non-farm economy, thereby under-generating off-farm
employment opportunities. Upper-middle-income countries in South-East Asia are in fact witnessing
a growing rural labour scarcity as reflected by the steep increase in rural wages. Agricultural censuses
in Indonesia, for instance, reflect a slight increase in the average size of farms during the past decade.
Rural populations are expected to start declining by 200 in most of South-East Asia (FAOSTAT,
2017), signalling the end of one of the major drivers of farmland fragmentation.
132
Access to irrigation water
There is a wide range of institutional mechanisms regulating agricultural water system management
across Asia. Water governance systems concern (i) the allocation of responsibilities across levels of
governments, (ii) the degree to which water user associations (WUAs) are allowed to participate in
irrigation management, and (iii) the introduction of water pricing to improve water productivity.
Several countries have established national policy frameworks for integrating management
systems across different levels of regional and national administration. For instance, in Viet Nam
water management systems are decentralized at the provincial level, but also need to comply with
sustainability obligations set at higher levels of government. Indonesia adopted a national water
resources policy in 2001, setting an integrated system of water resource management, allocation
and use at national, provincial and district levels and where coordination mechanisms involve all
agencies responsible for water management and planning. Responsibilities for water supply are
devolved to provincial and district governments. India has a policy for the sustainable management
of water resources that regulates groundwater exploitation and prescribes water rates for both surface
and groundwater that take into account small and marginal farmers’ constraints. India launched in
2015 a major programme (Pradhan Mantri Krishi Sinchai Yojana) with the aim of improving water
productivity, on-farm water use efficiency and the adoption of water-saving technologies.
Policies to transfer irrigation water management to WUAs have been actively pursued by several
governments, and some successes are worth learning from. In China, responsibility for water
delivery has been transferred from provincial water resource departments to non-profit utilities
called water supply corporations (WSCs)/water supply organizations (WSOs). The WSOs in turn
sell water to WUAs, which have responsibility for water allocation, fee collection and operations
and maintenance (O&M). By the end of 2011, China had registered 78,000 WUAs managing
16 million hectares of irrigated farmland or 25.9 per cent of the total. Malaysia established the
Malaysian Water Association (MWA), a non-profit organization aiming to enhance management
of water supply and wastewater industries.
In Nepal, WUAs are successfully managing almost all of the 15,000 or so irrigation systems in
the country, sometimes jointly with the government. Farmer- and community-managed systems
are generally found to be more efficiently managed than government-managed systems. Pakistan
supports participatory irrigation management through the establishment of area water boards
(AWBs), controlled by water users and government representatives, and provincial irrigation and
drainage authorities (PIDAs), providing technical support and oversight to the AWBs. All provinces
promulgated WUA Ordinances, which aimed to define the role, duties, rights and responsibilities
of this grass-roots institution.
Pricing mechanisms are increasingly regarded as key to regulate and stabilize water use.
However, they are often ineffective owing to difficulties in implementation, including price
determination. In India, for example, the water pricing policy results in insufficient coverage of
irrigation O&M costs. As a consequence, transfers from national budget are needed, the financial
health of irrigation departments is weakened, maintenance of canals is neglected and water is
used inefficiently. Furthermore, there is a wide variation in the pricing of agricultural water across
states, and prices have not been revised for several decades in most states. While the payment of
water fees is contemplated in Cambodia’s Water Management Law, there is no general and effective
pricing system in place, irrigation service fees are often set at unrealistically low levels and collection
rates are very low (TWGAW, 2006). Even where farmers are highly appreciative of the benefits
of public irrigation systems, there is little perception that the sustainability of these benefits is
dependent on the collective willingness of the farmers to pay the operation and maintenance costs.
133
In the Lao PDR, pricing systems are not very effective and do not cover all costs related to
infrastructure O&M. Even with quite functional WUAs, fees cannot be collected from all members
and used for O&M purposes. These cases demonstrate that physical and institutional infrastructure
must be properly developed and implemented before water costs can be fully estimated and
collected from users.
Access to technologies and best management practices
Past investments in agricultural R&D have yielded great advances in technologies and management
practices that will be required to address the challenges of climate change and natural resource
scarcity (see Rosegrant et al., 2014). Yet, while smallholders’ access to technology and information
has improved across most of Asia, there is still ample scope for amplifying it and for strengthening
the responsiveness of R&D and extension systems to smallholder needs. This requires a shift
away from the traditional “linear” approach of training and visit, followed during the Green
Revolution era, towards a more pluralistic and participative approach. Progress towards smallholder
participation has typically been more significant where smallholders enjoy relatively favourable
access to land and water resources.
Extensive experience accumulated over the years suggests some basic principles of engagement.
First, by involving farmers in pilot testing and on-farm trials, participatory approaches are very
effective in accelerating technology adoption and in identifying best management practices. They
contribute to reducing farmers’ perceived risk from adoption due to their aversion to losses and
binding financial constraints. Producer groups and farmers’ associations play an important role in
creating awareness among smallholders about the potential benefits of a particular technology as
well as facilitating access to finance. Further, for many technologies, the benefits are scale-dependent.
Second, financial resources allocated to public agricultural extension are limited and extension
agencies lack a post-production, marketing and business-oriented dimension. In such cases, the
public sector should actively favour the emergence of a pluralistic extension system populated by
private sector advisory services, NGOs, lead farmers, etc. Where the private sector is weak, building
the capacity over time of service providers through demand-driven interventions will be critical.
Adequate capacity should be built for other actors as well by training and providing certification to
local extension service providers such as lead farmers and/or farmer associations. Subcontracting
extension delivery to the private sector (profit and non-profit) could provide a mechanism for
getting around the institutional inefficiencies associated with public delivery, although this solution
has encountered mixed success where tried out.
Improving smallholder access to agricultural R&D approaches needs to be adjusted to reflect
the nature of the targeted agricultural systems. For commercially integrated areas, future research
efforts should focus on resource-conserving management and technology, including no-till farming
or zero tillage, organic agriculture and drip and sprinkler irrigation. Promoting farmers’ associations,
improving market access and sustaining supportive financial policies are complementary policies
to encourage smallholders’ access and adoption. Environmental policies can also have an indirect
impact on the adoption of certain technologies. For example, in China the ban on burning of
residues has resulted in the increased spread of no-till or zero-tillage technology (Rosegrant et
al., 2014). On the other hand, poorly designed subsidies can have negative effects on technology
adoption. As an example, input subsidies for fertilizer, water and rural electrification reduce the
potential benefits of nitrogen use efficiency and water-saving technologies, thereby reducing the
adoption of no-till technology.
134
For productive and marginally integrated areas, enhancing agricultural productivity will
hinge on the promotion of sustainable agricultural technologies such as integrated soil fertility
management, water harvesting and development of stress-tolerant crop varieties. Water-harvesting
technologies will be critical to poor farmers in arid and semi-arid areas, and carefully designed
subsidies could effectively promote the construction and maintenance of water-harvesting
structures. Although good progress has been made in developing drought- and heat-tolerant crop
varieties, continued support from national governments, development partners and international
research centres will continue to play critical roles in developing and disseminating these new
stress-tolerant varieties.
To target farmers in remote resource-rich but food-deficit areas, research efforts should
be directed to develop high-yielding varieties of underutilized crops (e.g. millets, amaranthus,
buckwheat) and associated post-harvest and processing technologies. Also, research systems should
promote the conservation and utilization of the rich diversity of indigenous crop varieties, which
possess useful traits such as drought tolerance, disease and pest resistance.
Access to rural financial services
Inclusive rural finance fulfils the varied financial needs of different groups as evidenced by the
actual usage of financial services of these different market segments. Accordingly, policymakers need
to look beyond the challenge of promoting access for rural people to (i) promote expanded client
choice of relevant, quality financial services for differentiated needs and groups and (ii) measure,
with robust evidence, usage and gaps in service provision, system performance and impacts. A
number of countries in Asia and the Pacific, e.g. China, India, Indonesia, Pakistan, Papua New
Guinea and the Philippines, have begun to pursue financial inclusion strategies (FISs) to improve
financial inclusion. FISs identify key policy reform requirements and emphasize the importance of
partnerships and diversification in financial outreach, improving financial literacy and capabilities,
and robust analytical evidence.
Pakistan’s FIS builds on an extensive policy and regulatory framework for development
finance in the areas of agriculture, microfinance, SMEs, housing and infrastructure. The regulatory
framework for financing these priority sectors includes the issuance of prudential regulations and
relevant guidelines in line with international best practices. Even prior to the FIS, the State Bank of
Pakistan promoted development finance through credit risk sharing mechanisms, capacity-building
programmes for banks and grass-roots awareness events across the country. Similarly, China had
promulgated a series of policies to promote rural finance (including policies increasing access to
financial institutions in rural areas) prior to the development of the country’s FIS. This included,
among other things, subsidies, tax reductions and floating interest rates to expand the reach of rural
credit cooperatives, and the development of trust guarantee and collaterals. The State Council has
issued a circular to allow farmers to use their land and property as collateral for loans. In recent
years, commercial banks have increased lending to SMEs through innovative products and services.
Additionally, an SME development fund has been established to encourage investments by private
entrepreneurs and financial institutions in SMEs.
In some countries of the region (e.g. Afghanistan, Myanmar), however, the policy environment
remains nascent and does not yet reflect a coherent and integrated approach to financial inclusion,
although this has not necessarily precluded important progress in extending the reach of basic
financial services to rural areas. In Afghanistan, for example, there are still no prescribed regulations
or a designated regulatory authority for microfinance. To guide microfinance under these conditions,
the Microfinance Investment Support Facility for Afghanistan (MISFA) is taking the lead not only
in funding the MFIs but also in guiding them in reporting, governance and in monitoring and
reviewing the performance of MFIs.
135
In operationalizing rural finance strategies there will be the need to account for the nature of
the local agricultural systems. In commercially integrated areas, where financial integration is
more advanced, contracts and receivables can serve as reliable performance predictors for financial
institutions. Higher returns from commercial agriculture reinforce credit discipline and reduce
loan default risks. In this case, there is additional room to leverage commercial activities, such
as through warehouse receipts, inventory credit, equity finance and improved SME finance. To
optimize their returns, banks and equity financiers are often drawn to the larger-value transactions
that are predominantly with downstream firms. The financial landscape thus may favour large
agribusiness companies, who are thus able to strengthen their bargaining power and in some cases
will pursue extractive strategies that limit returns to producers.70 On the other hand, microfinance
institutions often provide too little credit, and poor lending terms, including repayment periods
and interest rates. Thus, opportunities for small businesses and microenterprises to engage in value
addition, and to contribute to inclusive rural growth, are not automatically leveraged. To support
inclusive development in these types of areas, governments should pursue policies that improve
SME finance, ease of doing business and fair contracts.
In productive and marginally integrated areas, penetration of financial services remains limited or
nascent. Community financial institutions and microfinance may be available, and more affordable
alternatives to moneylenders and other traditional channels of finance, but these are not always
preferred owing to their higher administrative requirements and lengthy approval processes. In
these areas, formal financial institutions may not have the risk appetite or the client relationships
to rapidly support local investment. While resisting the temptation to extend financial services, the
state should instead enact policies that promote an expanded role for private financial institutions.
Loan guarantees and other risk mitigation schemes are critically important in this context.
Furthermore, regulations that facilitate low-cost solutions for service provision (such as mobile
banking or linkage banking) or that diminish or distribute risk (such as the use of inventories
as collateral, or securitizing accounts receivable and other liquid assets) play an important role
in enabling farm enterprises to secure needed capital and upgrade their business. Contracts and
partnerships along the value chain can also provide a heightened level of assurance for creditors,
including from value chain actors themselves. Government may also require financial institutions
to share client information through credit information bureaux, thus minimizing information
asymmetries and reducing the possibilities of multiple exposures by borrowers. Finally, non-
financial services that improve business planning, accounting, financial management, marketing
and compliance with environmental or sanitary certifications may not yet be on offer, and would
often require public support.
Remote resource-rich and food-deficit areas are characterized by lower returns, higher risks and
access costs, all of which combine to preclude affordable service provision by the formal financial
sector in remote areas (with some exceptions, such as for tourism or mining enterprises, or for
niche high-value forest or horticultural products). In such a context, it will be a priority to build
the capacities and capabilities of locally managed (and therefore often low-cost) financial services,
including through subsidies, as well as high-quality technical advisory services. Even with strong
community institutions, though, the poorest rural households are unlikely to be able to leverage
access to, and affordability of, investment capital. In these cases, targeted conditional grants through
social protection programmes are necessary to assist households in reducing debt, meeting their
basic human needs and considering an eventual switch to more remunerative and commercialized
livelihood strategies. Such programmes are currently being scaled up across several countries in Asia
(see discussion in section 5.1).
70. In other cases, however, lead firms will work with groups of small producers, providing them with technical, financial and marketing support.
136
As part of their livelihood diversification and risk mitigation strategies, many households will
rely on the domestic or international migration of one or more household member. Financial
education is particularly important for households who choose to travel for work, given the high
social cost they often expose themselves to as a trade-off for pursuing primarily financial objectives.
At a minimum, migrant households (and indeed also rural households without migrating members)
will normally seek some financial service aside from loans, savings and investment. Promoting cost-
effective solutions for the expanded reach of remittances and payment services offers an added
benefit: building financial track records for rural households. With time, such non-credit services
can improve the information base available to financial service providers, and enable them to
extend additional financial services to clients that exhibit financial discipline and creditworthiness.
Developing such low-cost service solutions will often require leveraging new ICT opportunities,
requiring some regulatory reform and/or initial R&D investments, to catalyse private engagement.
Strategic thrust 3: Fostering investment in ecosystem services and resilience Smallholder farmers’ livelihoods are among the most vulnerable to environmental and climatic
risks and shocks. Addressing these vulnerabilities while enhancing poor rural people’s food
security requires managing natural resources and ecosystem services more sustainably, increasing
their agricultural productivity and strengthening their resilience to climatic shocks and long-term
variability. This entails the transition to smallholder production systems that are more productive,
use inputs more efficiently and have less variability and greater stability in their outputs while being
more sustainable and resilient (FAO, 2013a). This also calls for the reduction of greenhouse gas
emissions from agriculture and agrifood value chains, and harnessing underutilized synergies that
exist between adaptation and mitigation.
Since the 1970s, when the first concerns about the unintended impacts of the Green Revolution
emerged, there has been interest in an agricultural development agenda that is environmentally
and socially sustainable as well as productive (IFAD, 2011a). In addition, in the last 25 years,
climate change has become an increasingly acknowledged complicating factor, exacerbating effects
on the environment and affecting development sectors. Consequently, in the last two decades,
new terms such as “agroecological approaches”, “ecologically intensive agriculture”, “low external
input technology”, “sustainable agricultural intensification”, “integrated landscape approach”
and “climate-smart agriculture” (CSA71) have emerged to refer to this agenda of sustainable and
resilient agriculture (Pretty, 2006; Tripp, 2006; Reed et al., 2016). Various responses have been
highlighted as appropriate, such as new crop and animal varieties, water-saving technologies, soil
conservation, community-based natural resource management and conservation agriculture (CA72)
– see Summary for Policy makers (IPCC, 2014).
Strengthening the environmental sustainability and climate resilience of agricultural systems
and rural communities will require three interconnected levels of “greening”, from national to local
level, for long-term results – taking into consideration, at each level, country specificities regarding
the potential role of agriculture in sustainable development and the nature of rural landscapes and
variations of their agricultural systems when it comes to field-level interventions.
71. Climate-smart agriculture: (1) agriculture that sustainably increases productivity and resilience (adaptation), reduces/removes greenhouse gases (mitigation), and enhances achievement of national food security and development goals (FAO, 2010a); (2) a set of strategies that can help meet the challenges of climate change by increasing resilience to weather extremes, adapting to climate change and decreasing agriculture’s greenhouse gas emissions (Steenwerth et al., 2014).
72. Conservation agriculture: an approach to managing agroecosystems for improved and sustained productivity, increased profits and food security while preserving and enhancing the resource base and environment. Conservation agriculture is characterized by three linked principles: (i) continuous minimum mechanical soil disturbance, (ii) permanent organic soil cover and (iii) diversification of crop species grown in sequences and/or associations (see www.fao.org/ag/ca/).

137
TABLE 5.3b
STRATEGIC THRUST 2
National policies and institutions
Investments for commercially integrated areas
Investments for marginally integrated areas
Investments for resource-rich/food-deficit areas
• Develop institutional frameworks for water user associations (WUAs)
• Develop efficient pricing mechanisms for water use
• Support a pluralistic extension system that is amenable for the private sector, including SMEs
• Strengthen government institutions that implement land-titling schemes and that resolve land-titling disputes
• Implement improved water pricing schemes; strengthen regional authorities that regulate local WUAs
• Support apex-level finance institutions that coordinate and in turn provide credit to local institutions and producers’ cooperatives
• Promote producers’ organizations and self-help groups that mediate communal land use
• Expand small-scale irrigation infrastructure, with emphasis on facilitating smallholder access and the use of WUAs
• Support mid-level microcredit providers and institutions that finance new agricultural practices and that support local producers’ organizations
• Promote dialogue and participatory approaches to land titling/communal land administration for ethnic minorities and indigenous peoples
• Promote concurrent expansion of irrigation infrastructure and WUAs to guarantee equitable and sustainable use
• Support self-help groups as initial providers of credit and disseminators of new agricultural technologies
• Reform of regulatory frameworks for land rental
• Secure legal protection of forest rights for indigenous peoples in upland areas
• Promote participatory approaches for testing and disseminating technology and best practices for smallholders
• Strengthen regional authorities that regulate local WUAs and that promote the use of water-saving technologies at the local level
• Facilitate R&D investments towards resource-conserving management and technology
• Support the integration of apex-level micro- and rural financial institutions into the modern banking sector
• Strengthen existing WUAs directly, with emphasis on implementing water-saving technologies and practices in arid or semi-arid areas
• Facilitate R&D investments towards sustainable agricultural technologies, including integrated soil management, water harvesting and stress-tolerant crop varieties
• Test new cost-efficient strategies for expanding existing MFIs out of commercialized agricultural areas
• Strengthen local and regional institutions that demarcate and enforce the rights of indigenous peoples and protected areas
• Develop communal and participatory methods of interfacing customary land and water management strategies with regional or national institutions
• Facilitate R&D investments towards high-yielding varieties of underutilised crops as well as post-harvest and processing techniques
Strategic area Intensifying and modernizing agriculture Sustaining and transforming agriculture
Enhancing the competitiveness of smallholder agriculture and rural SMEs
138
Green growth strategies and policy reformsGreen growth strategies are instruments for achieving a “green economy”.73 The pursuit of green
growth aims to increase economic activity while protecting natural assets for future generations to
survive and thrive. More so than sustainable development, green growth emphasizes the desirability
of pursuing economic growth and environmental protection at the same time, towards a growth
which is not just low carbon but also climate-resilient, biodiverse, clean and sustainable (Jacobs,
2012; Fankhauser et al., 2017).
Asian countries have been among the first to understand the potential of, and the need for,
green growth. Countries in Asia are taking the lead in implementing green growth by reforming
economic incentives, promoting a more inclusive and adaptive governance, and pursuing and
investing in green strategies and policy reforms that help align economic growth strategies with
the objective of sustainable development (ADB, 2012). Asian countries are already performing
well in an international context, being among the world’s leading producers of green goods and
services. They have significant comparative advantages in key technologies, such as energy storage,
and they are strong innovators in areas such as biofuels and clean transport. However, there are
regional disparities, with countries such as China, Japan and the Republic of Korea outpacing others
(Fankhauser et al., 2017).
In its 2012 report, the Commission on Sustainable Agriculture and Climate Change recommended
making sustainable, climate-friendly agriculture central to green growth and the Rio+20 Earth
Summit (Beddington et al., 2012). In the past few years various agencies have highlighted the key
areas that need attention when incorporating agriculture into national green growth strategies. These
include (i) resource use efficiency across agricultural supply chains, (ii) clearly defined and enforced
land ownership and tenure (OECD, 2011b), (iii) agricultural systems resilient to climate change
and other sources of volatility (FAO, 2012a), (iv) government and other investments in R&D and
education for agricultural best practices, (v) improved access to productive assets by agricultural
producers, especially smallholders and rural women (UNDESA, 2012c), (vi) well-designed and
targeted insurance mechanisms enabling access to credit and improved energy- and labour-saving
technologies (see Lybbert and Sumner, 2010), (vii) agricultural markets that accurately signal natural
resource scarcity and appropriately reward the use of sustainable practices (UNEP, 2011) and (viii)
government tracking of natural capital stocks in monetary terms in national environmental accounts
(see WFO, 2012).74
Radical policy shifts are required to make green growth a reality (Bowen et al., 2016). There are
promising green growth policy actions and interventions related to agriculture in Asian countries
which have the potential to be tailored, scaled up and replicated. Although the policy mechanisms
most commonly used to define a pathway towards sustainable agriculture are, in general, not directly
related to the agricultural sector (e.g. REDD+75, low-carbon green growth, climate change responses,
reforestation plans), there is a gradual shift from establishing targets for increased production to
developing long-term action plans for sustainable production (Scherr et al., 2015).
73. Green economy: ‘an economy that results in improved human well-being and social equity while significantly reducing environmental risks and ecological scarcities. In its simplest expression, a green economy can be thought of as one which is low carbon, resource-efficient and socially inclusive’ (UNEP, 2011).
74. Payments for ecosystem services represent an early approach to develop market-based incentives for farmers to supply ecosystem services through a conscious management of the natural resources under their control. In the face of limitations and risks inherent in this approach, PES have evolved towards co-investment approaches based on partnerships involving communities, local and national governments, and the private sector.
75. REDD+: reducing emissions from deforestation and forest degradation in developing countries and the role of conservation, sustainable management of forests and enhancement of forest carbon stocks (UNEP, 2014).
139
76. Sustainable land management: a knowledge-based procedure that helps integrate land, water, biodiversity and environmental management to meet rising food and fibre requirements while sustaining ecosystem services and livelihoods (World Bank, 2006).
77. Agroforestry: a collective name for land use systems in which woody perennials (trees, shrubs, etc.) are grown in association with herbaceous plants (crops, pastures) or livestock, in a spatial arrangement, rotation or both; there are usually both ecological and economic interactions between the trees and other components of the system (Lundgren, 1982).
While many countries in the region still rely on fossil fuels, the clear articulation in their
nationally determined contributions (NDCs) to undertake absolute emission reductions from
business-as-usual levels (e.g. Bangladesh, Bhutan, Indonesia, Kazakhstan, the Philippines,
Tajikistan, Thailand and Viet Nam), reduce emission intensity of growth (e.g. China, India and
Malaysia), improve forest cover (e.g. Cambodia, the Lao PDR and Sri Lanka) or increase the share
of renewable energy in the energy mix (e.g. China, India, the Lao PDR and Papua New Guinea)
are indicative of their resolve to bend their national emissions curves in the right direction.
Renewable energy is an area where agricultural and rural development policies can contribute to
national priorities under Agenda 2030.
National-level government agencies have had some success in endorsing and establishing
environmental policy goals, such as the framework law on “low-carbon green growth” of the
Republic of Korea in 2009, the “higher quality growth” component of China’s Twelfth Five-Year
Plan, the “low carbon inclusive growth” dimension of India’s Twelfth Five-Year Plan (2012-2017),
the public-private model for sector transformation under Viet Nam’s Coffee Coordination Board
created in 2013, Indonesia’s and Viet Nam’s green growth strategies, and the integrated water
resource management programme of the Thai government. Regional and local governments have
provided political support for green growth including the “organic coast” strategy embraced by
the Ca Mau provincial government (Viet Nam) and the bio-industry and low-carbon development
programmes in Yunnan (China) (Scherr et al., 2015; Negra, 2013).
Land use regulations at the national, provincial and local levels of government related to forest
and mangrove protection have become common. Spatial planning has been an important factor
as illustrated by land use planning in Indonesia, water and land use zoning in Thailand, and
China’s land use master plan accompanying the five-year plan, which must now consider critical
ecosystem services based on government-defined “Ecological Function Conservation Areas”. Overall,
monitoring of environmental management and ecosystem health is inadequate owing to the low
level of data collection by all units of government. However, this is rapidly changing. Indonesia’s
One Map initiative and Viet Nam’s (good aquaculture practices [VietGAP]-related) plan to cover
100 per cent of production area with spatial analysis and to broaden soil and water testing illustrate
the types of programmes that will enable better monitoring of compliance with environmental
regulations (Scherr et al., 2015).
However, remaining gaps hindering policy objectives include lack of cross-ministerial
coordination, local stakeholder engagement and clear tenure rights. Negative consequences of low
stakeholder engagement can be illustrated by conflicts related to resource rights in Kalimantan
(Indonesia), overextraction of water in Dak Lak (Viet Nam) and expansion of maize production in
Mae Chaem (Thailand).
Sustainable integrated approaches – looking at the bigger pictureAs national strategies evolve into on-the-ground practice, the last few decades have seen
paradigm shifts in the way of thinking about land management resulting in new perspectives,
such as moving from soil conservation to sustainable land management (SLM76), from
monocrops to agroecosystems and agrobiodiversity, from farming in forest areas to agroforestry77
and from focusing solely on water management to combining water and soil management.
140
78. Landscape approaches: approaches that seek to provide tools and concepts for allocating and managing land to achieve social, economic and environmental objectives in areas where agriculture, mining and other productive land uses compete with environmental and biodiversity goals (Sayer et al., 2013).
79. Ecosystem approach (integrated ecosystem approach): a strategy for the integrated management of land, water and living resources that promotes conservation and sustainable use in an equitable way (Convention on Biological Diversity, 2004).
This has also led to a growing international consensus on the need to shift away from the
management of resources individually towards a more holistic landscape approach,78 with
recognition from an increasing number of institutions, including ADB, Center for International
Forestry Research (CIFOR), FAO, the Global Environment Facility (GEF), IFAD, the International
Union for Conservation of Nature (IUCN) and the World Bank. It is embedded in the Convention
for Biological Diversity and is integral to the Millennium Ecosystem Assessment and the SDGs.
The recently conceptualized landscape approach builds on ecosystem services to integrate
multiple development and conservation goals. By addressing potential trade-offs between
production and conservation, this approach implies that ecosystem integrity must be protected,
and not sacrificed for short-term production gains. It embodies the basics of the integrated ecosystem
approach,79 but recognizes the complexity of land management systems and the need to consider
human-environment interactions across sectors and scales (ADB, 2017; Sayer et al., 2013). Thinking
at the landscape scale means creating linkages and interactions between landscape units, leading to
functional heterogeneity (Torquebiau, 2015), avoiding compartmentalization or silos building. For
example, “ridge to reef” is a landscape approach that links land activities (e.g. erosion and sediment
in rivers) to the impacts on marine ecosystems (e.g. damage to the reef) to comprehensively address
degradation and restore the integrity of the landscape as a whole. “Watershed development” and
“catchment management” are the closest predecessor approaches; however, these terms have
a narrowed connotation, defined by fixed hydrological boundaries. “Participatory watershed
management” – a term especially used in India in the 1990s – was a further step forward, bringing
land users into the planning process as stakeholders.
As mainstream agriculture development, particularly in poverty-stricken regions, still concentrates
on “productivity first” and places limited focus on sustainability, intensification becomes undoubtedly
a fundamental requirement to sustain the future viability of agriculture. The paradigm shift towards
sustainable agriculture intensification (SIA), which focuses largely on how to increase agricultural
outputs while keeping the ecological footprint as small as possible, aims to reposition agriculture
from its current role as the world’s single largest driver of global environmental change to becoming
a key contributor in a global transition to a sustainable world. Incorporating landscape approaches is
an important part of the development of SIA, by designing multifunctional agroecosystems that are
both productive and resilient. This translates into planning and implementing farm-level practices
in the context of cross-scale interactions with catchments, biomes and the landscape as a whole, and
maximizing farm-level productivity by maximizing ecological functions from moisture feedback to
disease abatement, across scales (Rockström et al., 2017).
Furthermore, the landscape approach is increasingly used to link to industries and markets
via the value chain. The profit maximization principle of agribusinesses under conventional value
chain approaches need to be recalibrated to the multifunctional goals of the landscape approach.
The necessity of such an approach in market and supply chain management lies in its capacity
to capture new markets, mitigate risk, create opportunities at a large scale and improve business
governance (Gyau et al., 2015). Additionally, the private sector is increasingly interested in the
application of landscape approaches to certify sustainability. Sustainability standards or certifications
favour sustainable agricultural practices and protection of ecosystem services by enabling companies
to evaluate environmental or social interventions beyond the farm or production unit scale.
141
80. Landscape governance: a set of rules (policies and cultural norms) and the decision-making processes of public, private and civic sector actors with stakes in the landscape that affect actions in the landscape (de Graaf et al., 2017).
Examples of commonly used production standards include those of the roundtables on sustainable
palm oil, soy, biofuels and Bonsucro (sugar), the Sustainable Agriculture Network (SAN)/Rainforest
Alliance Certification, the Fairtrade Foundation and UTZ Certified. Standards tend to focus on
best practices related to social issues, land use and agricultural production practices within the
production unit (e.g. farm, concession and/or mill). However, some standards incorporate
principles or criteria that stretch beyond the production unit to include biodiversity, livelihood
and/or ecosystem service considerations (Minang et al., 2015).
The landscape approach has evolved to reconcile environmental and development objectives
while incorporating climate resilience – falling under so-called “climate-smart landscapes”. CSA has
been defined as agriculture that aims to sustainably increase productivity, enhance farmer resilience
(adaptation) and reduce greenhouse gas emissions (mitigation) to achieve national food security
and development goals. It has been argued that scaling up CSA practices from pilot projects to large-
scale programmes and policies requires landscape approaches to be applied to CSA by integrating
adaptation and mitigation activities into multifunctional agricultural landscapes. Only a holistic
approach that incorporates all sectors and stakeholders in a landscape can enhance the synergies
between the three pillars of CSA while sustaining ecosystem services, going beyond merely the use
of new technologies and practices such as drought-resistant varieties or precision farming (Harvey
et al., 2014). In addition to the landscape perspective, CSA must also adopt value chain perspectives,
with effective interventions including diversification, climate-proofing and value chain efficiencies.
It is important to stress that landscape approaches are complex and location-specific and
therefore must be tailored to specific regions, biomes, livestock and cropping systems, and socio-
economic contexts. The spatial arrangement of different land uses and cover types (landscape
structure) and the norms and modalities of its governance contribute to the complexity of a
landscape. Depending on the management objectives of the stakeholders, landscape boundaries
may be discrete or fuzzy, and may correspond to watershed boundaries, distinct land features and/
or jurisdictional boundaries or cross-cut such demarcations (Scherr et al., 2013). As the scale of the
landscape increases, upstream-downstream interactions are amplified, resulting in the landscape
becoming more heterogeneous, with increased implications in terms of common property rights,
community management of grazing and forest land, administrative zones, etc. These approaches
also need adequate time to develop and demonstrate their impacts, and do not lend themselves to
three- or four-year project cycles (ADB, 2017).
At the heart of landscape approaches is landscape governance80 as it aims to ensure synergies and
minimize trade-offs between economic, social and environmental (including climate) goals within a
landscape (Denier et al., 2015). Governance, in the context of multifunctional landscapes, is thereby
concerned with the institutional arrangements, decision-making processes, policy instruments and
underlying values in the system by which multiple actors pursue their interests in sustainable food
production, biodiversity and ecosystem service conservation and livelihood security (Kozar et al., 2014).
Achieving multiple objectives at the landscape level will require harmonizing sectoral policies
so that different planning frameworks are aligned. So far, many policy, legal and institutional
frameworks are based on implementing separate actions for ecosystem management, agricultural
productivity, forestry and rural livelihoods, which creates coordination issues. Joint planning and
coordinated interaction between ministries are essential and can be fostered through cross-sectoral
consultations. In addition to ensuring effective coordination mechanisms, landscape governance
also requires generating and communicating relevant knowledge and information, and collaborative
learning and capacity building among stakeholders in the landscape (de Graaf et al., 2017).

142
Core policy needs at the local, national and international levels are (i) compatibility and coordination
of policies for agricultural development, forest, water, climate and biodiversity conservation,
(ii) environmental legislation that acknowledges the potential and rights of farming communities,
and (iii) removal of public subsidies and incentives that harm biodiversity. Investments in
developing capacities for the co-design of robust, effective and sustainable landscape governance
systems are needed at multiple scales (Kozar et al., 2014).
Achieving financial viability for development initiatives that operate at the landscape level
requires that the incomes of all stakeholders are sufficiently high to prevent them from engaging
in activities detrimental to local ecosystems and sustainable livelihoods. Payments for ecosystem
services (PES),81 a mechanism for compensating farmers and farming communities for maintaining
ecosystem services, are an example of a market-based innovation for scaling up SLM and sustainable
forest management. Economic incentives are effective when they provide financial benefits to
producers for their contribution to environmental stewardship and have the added advantage
of increasing the financial attractiveness of alternative practices. These can come in the form of
payments for conservation efforts, tree planting or improved agricultural management. Several
examples of these incentive mechanisms already exist, such as the IFAD-funded rewards for,
use of and shared investment in pro-poor environmental services (RUPES) in Asia. In addition,
eco-certification systems for major agricultural commodities, such as coffee and cocoa, provide
economic incentives for investments in agricultural initiatives that protect environmental services
(FAO, 2013a).
Sustainable and resilient technologies and tools for managing the landscapeWhile the landscape approach sets the overall framework, SLM provides a basket of powerful
tools and technologies for action, based on integrated management systems. These are low-input,
resource-conserving technologies that counteract land degradation and erosion, restore soil health
and fertility and improve water productivity while providing crucial support to biodiversity and
ecosystems, building climate resilience and storing carbon. Above all, they are key in improving
local livelihoods and production and thus long-term food security, nutrition and poverty reduction.
The World Overview of Conservation Approaches and Technologies (WOCAT) divides these
technologies based on four land conservation measures, following with examples broadly
representing each category, ranging from those technologies found at the top of a catchment to
those found at the bottom: (i) management (e.g. participatory forest management), (ii) structural
(cross-slope barriers), (iii) agronomic (e.g. conservation agriculture) and (iv) vegetative (e.g.
homegardens, agroforestry) (ADB, 2017). More than half the technologies presented by WOCAT
(2007) consist of a combination of measures. For instance, terraces – a typical structural measure
– are often combined with other measures such as grass on the risers for stabilisation and fodder
(vegetative measure), or contour ploughing (agronomic measure).
Participatory forest management: a typical Asian landscape below the highest altitudes is
enclosed by forest. Forests are crucial in the provision of ecosystem services, hence the need to
transfer forest rights and responsibilities back to the local people for improved forest management.
Participatory forest management took off in India with the national joint forest management
resolution of 1990. The communities received technical support and incentives, such as the
construction of dams for irrigation, from NGOs working in tandem with the government.
81. Payment for ecosystem services: a transaction in which a well-defined ecosystem service, or a form of land use likely to secure that service, is bought from an ecosystem service provider on the condition that the provider continues to supply that service (Wunder, 2005).
143
82. Social fencing: joint agreements not to trespass with livestock or for illicit purposes into the forest.83. Cross-slope barrier: any structure made from stone, earth, wood or vegetation that acts as a barrier to runoff and sediment
(ADB, 2017).
In return, the communities established “social fencing”82 and, while maintaining the forest and
improving it through enrichment planting with desirable woody species, they established rules for
sustainable harvest of non-timber forest products (WOCAT, 2007). This type of reform has led to
millions of hectares of forest being transferred to communities and indigenous peoples across Asia.
However, the granting of rights has sometimes transferred limited new rights or taken away others
and has often been burdened with responsibilities to conserve forests, but it has also offered new
livelihood opportunities and/or improved forest conditions in many cases (ADB, 2017).
The REDD/REDD+ programme has injected fresh stimulus into forest access rights, responsibilities,
co-benefits and reforms, as the issue of forest tenure is central to its successful implementation.
While only pilot projects under REDD+ are currently under way, it is clear that a fully developed
internationally ratified REDD+ programme should give a new impetus to participatory forest
management (ADB, 2017).
Cross-slope barriers:83 soil and water conservation structures, such as bench terraces (the most
widespread form of terrace in Asia), earth bunds and tied ridges, are used to optimize water capture
and infiltration, and to create grassed waterways to convey excess water safely off the slopes. On
steeper slopes, soil erosion can be reduced by planting contour hedgerow, which is the base of
sloping agricultural land technology (SALT) involving multipurpose leguminous tree species such as
Calliandra tetragona, Leucaena diversifolia or Gliricidium sepium (Palm and Laquihon, 2004). The
current emphasis has turned towards low-cost contour vegetative barriers, which are cheaper to
establish and are basically self-maintaining. Thus, terrace construction on steep slopes is being
increasingly consigned to history and ecotourism because of costs of construction and maintenance,
time-dependency and, in some places, increasingly stringent legislation regarding cultivation of
unstable steep slopes. Additionally, vegetative barriers can provide secondary benefits of fodder for
livestock or mulching for fruits and vegetables when the vegetation is trimmed.
However, a general trend over the last 25 years has been to move away from structural solutions
to soil and water conservation towards good husbandry in-field, e.g. mulching, no-till farming,
rotation, intercropping, agroforestry and manuring, which lower soil erosion and build up organic
matter within topsoil for improved and more stable production. Additionally, this shifts much of
the responsibility from male barrier builders to female crop cultivators.
Conservation agriculture: being one of the most significant success stories in modern rainfed
agriculture (Goddard et al., 2007), CA has developed into a technically viable, sustainable and
economic alternative to current crop production practices (Derpsch and Friederich, 2009).
CA is based on the three principles of no (or minimal) tillage, maintaining a surface cover and
crop rotation, and reduces the energy (and carbon emissions) involved in, and costs associated
with, preparing land. CA took off rapidly in the late 1990s with the emergence of new, less toxic
herbicides and specialized machinery (seed drills and straw-chopping combine harvesters, etc.),
making ploughing – detrimental to soil health – unnecessary, and maintaining the soil carbon
stocks as well as reducing waterbodies’ pollution and eutrophication incidences (Critchley, 2009).
Although uncertainty lies within the international research community over the exact amount of
carbon potentially sequestered per hectare per year under CA, these no-till technologies have been
identified as having high technical potential for climate mitigation (IPCC, 2014c).
The increase in area under CA in Asia in recent years is significant. In China, the area under
CA has expanded from an insignificant amount in 2000 to 6.7 million hectares in 2014, and India
has some 1.5 million hectares being cropped under conservation agriculture (FAOSTAT, 2015).

144
However, in India constraints include lack of appropriate machinery, competition for crop
residues, insufficient knowledge amongst farmers and entrenched attitudes (Bhan and Behera,
2014). Despite these challenges, which can be overcome, it is predicted that the exponential
increase in area under CA will continue in Asia, particularly in China, where it is supported by
considerable subsidies, such as a 30 per cent subsidy on purchase of CA-adapted machinery
(Critchley, 2014). Additionally, manuring/composting and crop rotation can easily be integrated
into daily farming activities and are not perceived as an additional “conservation” burden, as they
require comparatively low inputs and have a direct impact on crop productivity. However, some
question its wider applicability to smallholder farmers owing to the reliance of CA on herbicides,
which can lead to weed-removal issues for low-income farmers, and mulch availability, which has
a high opportunity cost as livestock feed (Bhan and Behera, 2014).
Homegardens: generally representing the most biodiverse (and agrobiodiverse) location within
a farm, and the most intensively cultivated and integrated location in terms of production systems,
homegardens are characteristic of perhaps the majority of rural households in the humid tropics
and across Asia. In the classic Asian context, homegardens are a form of agroforestry: multistrata,
multispecies, highly intensive mixtures around the homestead. It has been defined as “a small-scale
supplementary food production system by and for household members that mimics the natural,
multi-layered ecosystem” (Hoogerbrugge and Fresco, 1993) characterized by high species diversity
and usually three or four vertical canopy strata (Fernandez and Nair, 1986). Their importance in
terms of food production is often underestimated: in Sri Lanka, almost half of the agricultural land is
under these systems, while in Java, Indonesia, the proportion of homegardens to farmland generally is
around 20-50 per cent (Critchley, 2009) and it has been defined as the most efficient form of land use
in this densely populated rainfed zone (Raintree and Warner, 2015). Figures from Thai homegardens
are up to 1.5 kg of fresh produce per day from 18 m2 plots (Hoogerbrugge and Fresco, 1993).
Biodiverse multifunctional farms are also more resilient to extreme weather effects and can
provide a “natural insurance policy” against climate change. Hence, diversification is considered a key
adaptation strategy and a successful risk management strategy, because not all crops and agricultural
and non-farm activities are likely to be affected in the same way by changing climatic conditions.
Although homegardens can be said to form the smallest unit for a “nested landscape approach”,
research and development in this area remain weak. The maramihang pagtatanim in the Philippines
– a particular mixture based on multi-storey cropping of a wide variety of specific trees, perennial
shrubs and annuals that has been created by agronomists and successfully promoted locally –
shows that scientific approaches to agroforestry can contribute to homegardens by introducing
improved tree species (Raintree and Warner, 2015).
Agroforestry, referring to land use systems in which trees are grown in association with
agricultural crops, pastures or livestock (Young, 1997), is important in the landscape context, as it
forms a central element to many of the technologies mentioned here. India was the first country
to recognise the potential of agroforestry in reducing poverty and enhancing productivity while
also making agricultural landscapes more climate-resilient, and in 2014 adopted a comprehensive
agroforestry plan launching the National Agroforestry Policy (NAP). The policy envisages the
development of a National Agroforestry Mission/Board, with an initial investment of approximately
US$33 million, to coordinate agroforestry-related activities that will help increase the area under
agroforestry from 25 million to 53 million hectares in the country.84 Drawing on India’s experience,
and the fact that the realization of the NAP has enhanced the economy, human health and the
environment in a very short period of time, Nepal has taken its first steps towards developing its
own national agroforestry policy.85
84. https://ccafs.cgiar.org/research/results/india%E2%80%99s-new-national-agroforestry-policy#.WmntGa6nGUk 85. http://blog.worldagroforestry.org/index.php/2018/01/17/nepal-makes-progress-towards-a-national-agroforestry-policy/
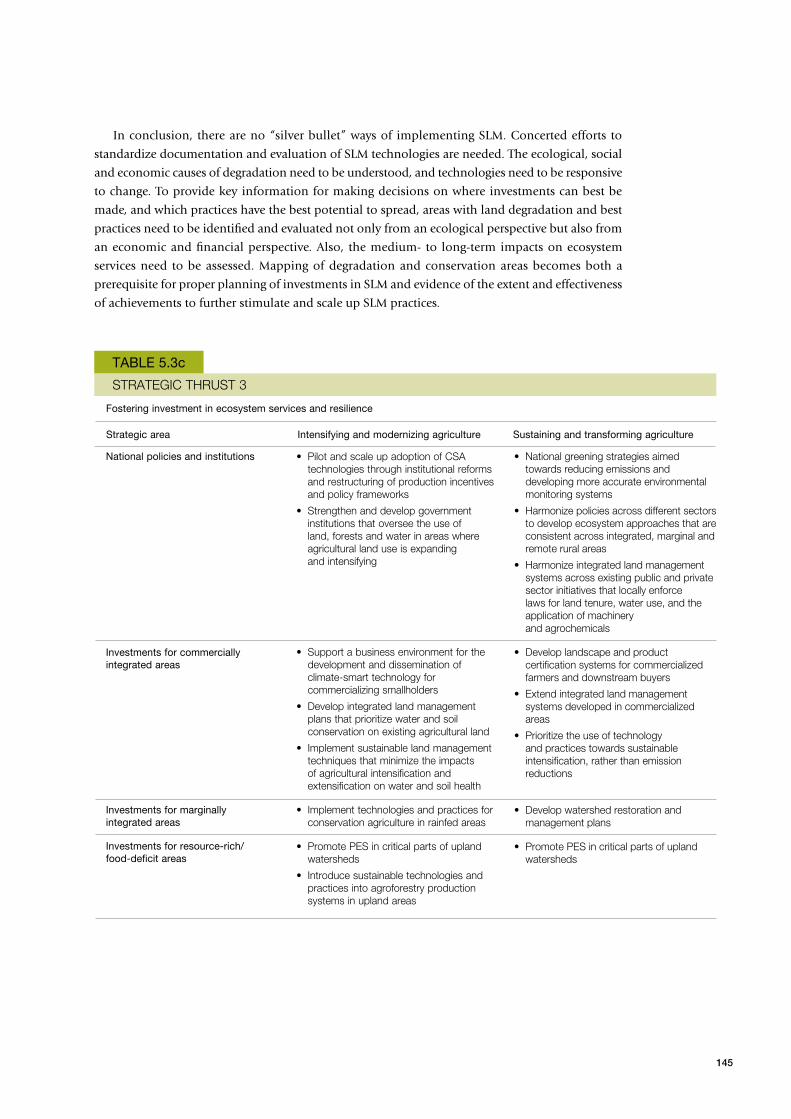
145
In conclusion, there are no “silver bullet” ways of implementing SLM. Concerted efforts to
standardize documentation and evaluation of SLM technologies are needed. The ecological, social
and economic causes of degradation need to be understood, and technologies need to be responsive
to change. To provide key information for making decisions on where investments can best be
made, and which practices have the best potential to spread, areas with land degradation and best
practices need to be identified and evaluated not only from an ecological perspective but also from
an economic and financial perspective. Also, the medium- to long-term impacts on ecosystem
services need to be assessed. Mapping of degradation and conservation areas becomes both a
prerequisite for proper planning of investments in SLM and evidence of the extent and effectiveness
of achievements to further stimulate and scale up SLM practices.
TABLE 5.3c
STRATEGIC THRUST 3
National policies and institutions
Investments for commercially integrated areas
Investments for marginally integrated areas
Investments for resource-rich/food-deficit areas
• Pilot and scale up adoption of CSA technologies through institutional reforms and restructuring of production incentives and policy frameworks
• Strengthen and develop government institutions that oversee the use of land, forests and water in areas where agricultural land use is expanding and intensifying
• Support a business environment for the development and dissemination of climate-smart technology for commercializing smallholders
• Develop integrated land management plans that prioritize water and soil conservation on existing agricultural land
• Implement sustainable land management techniques that minimize the impacts of agricultural intensification and extensification on water and soil health
• Implement technologies and practices for conservation agriculture in rainfed areas
• Promote PES in critical parts of upland watersheds
• Introduce sustainable technologies and practices into agroforestry production systems in upland areas
• National greening strategies aimed towards reducing emissions and developing more accurate environmental monitoring systems
• Harmonize policies across different sectors to develop ecosystem approaches that are consistent across integrated, marginal and remote rural areas
• Harmonize integrated land management systems across existing public and private sector initiatives that locally enforce laws for land tenure, water use, and the application of machinery and agrochemicals
• Develop landscape and product certification systems for commercialized farmers and downstream buyers
• Extend integrated land management systems developed in commercialized areas
• Prioritize the use of technology and practices towards sustainable intensification, rather than emission reductions
• Develop watershed restoration and management plans
• Promote PES in critical parts of upland watersheds
Strategic area Intensifying and modernizing agriculture Sustaining and transforming agriculture
Fostering investment in ecosystem services and resilience
146
SLM approaches also require long-term commitment from research and policy organizations
to allow joint learning, monitoring and evaluation, and adaptation. National governments are to
allocate resources for the development and promotion of soil and water conservation technologies,
including both indigenous and innovative practices, for combating soil erosion and nutrient
depletion, improving water conservation and water infrastructure, increasing yield and productivity,
and addressing climate change. Investments in better soil management are vital to improving
soil fertility and water availability and quality. The role of soils in climate change mitigation and
adaptation is an urgent issue of concern and one that is inadequately understood, acknowledged
and addressed.
Additionally, national legislation needs to effectively incorporate customary land tenure
into land policies to create an enabling environment. In many Asian countries, however, land
registration has made poor progress owing to a weak capacity to conduct cadastral surveys. National
governments, therefore, need to find effective ways of making land management systems accountable
and protective of land rights, thus ensuring improvement of tenure systems for the rural poor.
Conclusions
Echoing IFAD’s 2016 Rural Development Report, one of the main messages of this chapter is that a
sustainable and inclusive transformation requires adequate policies, institutions and investments
for it to materialize. It will be important for Asian countries, at this important stage of their
development path, to make such transformation happen, as it will be an important pillar of their
effort to achieve the ambitious targets set in Agenda 2030 and “incarnated” in the SDGs. There
are numerous solutions and pathways that can be followed to achieve this transformation. In
essence, though, action will revolve around three main strategic thrusts, the lines of action needed
to deliver on smallholders and rural producers that are more competitive, more entrepreneurially
oriented, and able to adopt technologies and management practices that are environmentally
sustainable and resilient to climate change. In shaping these strategic thrusts, broader policy and
cultural contexts at national and local level will play a key role. At the same time, though, there
are broader development policy shifts occurring throughout Asia that will bear significantly on
determining national strategies for agricultural and rural transformation. The greening of growth,
scaling up of social protection programmes, deepening regional cooperation and trade, and scaling
up of nutrition are critical agendas in themselves with which agricultural and rural transformation
strategies will need to be harmonized.

147
REFERENCES
AASA (Association of Academies of Sciences in Asia). 2012. Towards a sustainable Asia: Environment
and climate change. Berlin: Springer.
ADB (Asian Development Bank). 2017a. A region at risk: The human dimensions of climate change in
Asia and the Pacific. Manila: ADB.
ADB. 2017b. Sustainable Land Management in Asia: Introducing the Landscape Approach. Mandaluyong
City, Philippines.
ADB. 2016. Asian water development outlook 2016: Strengthening water security in Asia and the Pacific.
Mandaluyong City: ADB.
ADB. 2013a. Asian water development outlook 2013: Measuring water security in Asia and Pacific.
Mandaluyong City: ADB.
ADB. 2013b. Food security in Asia and the Pacific. Madaluyong City: ADB.
ADB. 2013c. The economics of climate change in the Pacific. Manila: ADB.
ADB. 2012. Green Growth, Resources and Resilience: Environmental Sustainability in Asia and the
Pacific. Manila. www.adb.org/publications/green-growth-resources-and-resilience.
ADB. 2011. Environment program: Greening growth in Asia and the Pacific. Mandaluyong City: ADB.
ADB. 2009. The economics of climate change in Southeast Asia: A regional review. Manila: ADB.
ADB and WWF (World Wide Fund for Nature). 2012. Ecological footprint and investment in natural
capital in Asia and the Pacific. UK: INWK.
Adelman, I. 1984. Beyond export-led growth. World Development 12 (9): 937-49.
Adesina, A. A., Mbila, D., Nkamleu, G. B., Endamana, D. 2000. Econometric analysis of the
determinants of adoption of alley farming by farmers in the forest zone of southwest Cameroon.
Agriculture, Ecosystems and Environment 80 (2000): 255-65.
Alcántara-Ayala, I., Altan, O., Baker, D., Briceño, S., Cutter, S., Gupta, H., Holloway, A., Ismail-Zadeh,
A., Jímenez Diaz, V., Johnston, D., McBean, G., Ogawa, Y., Paton, D., Porio, E., Silbereisen, R.,
Takeuchi, K., Valsecchi, G., Vogel, C., Wu, G., and Zhai, P. 2015. Disaster risks research and
assessment to promote risk reduction and management. International Council for Science and
International Social Science Council.
Alexander, K. and West, J. 2011. Chapter 4: ‘Water’ - Resource Efficiency in Asia and the Pacific.
Bangkok: United Nations Environment Programme.
Alexandratos, N. and Bruinsma, J. 2012. World agriculture towards 2030/2050: The 2012 revision. ESA
Working Paper No. 12-03, Rome: FAO.
Allison, E. H., Allison L. P., Badjeck, M.C., Adger, W. N., Brown, K., Conway, D., Halls, A.S., Pilling,
G.M., Reynolds, J.D., Andrew, N.L., and Dulvyet, N.K. 2009. Vulnerability of national economies
to the impacts of climate change on fisheries. Fish and Fisheries 10 (2): 173-96.
148
AMAN (Aliansi Masyarakat Adat Nusantar). 2012. Country technical note on indigenous peoples’ issues:
Republic of Indonesia. Rome: IFAD.
Anderson, K. 1983. ‘Economic Growth, Comparative Advantage and Agricultural Trade of Pacific
Rim Countries’, Review of Marketing and Agricultural Economics, 51(3).
Anderson, K. and Hayami, Y. 1986. The Political Economy of Agricultural Protection: East Asia in
International perspective. Sydney: Allen and Unwin.
Anderson, K. and Martin, W. 2009. ‘China and Southeast Asia’, in Anderson, K. (ed.) Distortions to
Agricultural Incentives. Washington, D.C.: The World Bank, pp. 359-389.
APEC (Asia-Pacific Economic Cooperation). 2014. APEC marine sustainable development report. APEC.
APFED (Asia-Pacific Forum for Environment and Development). 2010. Driving innovation for
sustainable Asia and Pacific: APFED II Final Report. APFED.
Appu, P. S. 1996. Land reforms in India: A survey of policy, legislation and implementation. New Delhi:
Vikas Publishing House.
ASEAN (Association of Southeast Asian Nations). 2011. Sustainable management of peatland forests
in Southeast Asia. ASEAN.
Bai, Z. G., Dent, D.L., Olsson, L., and Schaepman, M.E. 2008. Proxy global assessment of land
degradation. Soil Use and Management 24 (3): 223-34.
Balassa, B. (1965) ‘Trade Liberalisation and “Revealed” Comparative Advantage’, The Manchester
School, 33(2), pp. 99–123. doi: 10.1111/j.1467-9957.1965.tb00050.x.
Baliscan, A., Mapa, D., Fuwa, N., Santos, C.A. and Piza, S.F.. 2011. Addressing the infrastructure
constraints to the development of the rural nonfarm sector: Implications for poverty and rural development
in the Philippines. Report submitted to the World Bank: Manila, Philippines.
Barca, V., Brook, S., Holland J., Otulana M. & Pozarny, P. (2015). Qualitative research and analysis of
the economic impact of cash transfer programmes in sub-Saharan Africa: Synthesis Report. PtoP report.
Rome, FAO.
Barrett, C. B., Bachke, M.E., Bellemare, M.F., Michelson, H.C., Narayanan, S., Walker, T.F. 2012.
Smallholder participation in contract farming: Comparative evidence from five countries. World
Development 40 (4): 715-30.
Barrett, C. B., Carter, M. R. and Timmer, C. P. 2010. A century-long perspective on agricultural
development. American Journal of Agricultural Economics 92 (2): 447-68.
Beddington, J., M. Asaduzzaman, A. Fernandez, M. Clark, M. Guillou, M. Jahn, L. Erda, T. Mamo,
N. Van Bo, C. Nobre, R. Scholes, R. Sharma, and J. Wakhungu. 2012. Achieving Food Security in
the Face of Climate Change: Summary for Policy Makers from the Commission on Sustainable
Agriculture and Climate Change. Copenhagen, Denmark: CGIAR Research Program on Climate
Change, Agriculture and Food Security (CCAFS).
Bénabou, R. 1996. Inequality and growth, NBER Macroeconomics Annual 11: 11-74. http://www.
journals.uchicago.edu/doi/10.1086/654291.
Besley, T., Leight, J., Pande, R., and Rao, V. 2013. Long-term impacts of land regulation: Evidence
from tenancy reform in India, Journal of Development Economics 118: 72-87.
Bhan, S. and U. Behera. 2014. Conservation Agriculture in India—Problems, Prospects and Policy
Issues. International Soil and Water Conservation Research. 2 (4). pp. 1-12.
Bhattachan, K. B. 2012. Country technical note on indigenous peoples’ issues: Federal Democratic Republic
of Nepal. Rome: IFAD.
149
Binswanger-Mkhize, H. P. 2012. India 1960‐2010: Structural change, the rural nonfarm sector, and the
prospects for agriculture. Berkeley, CA: Department of Agricultural Resource Economics, University
of California, Berkeley.
Bowen, A., Duffy, C., & Fankhauser, S. 2016. ‘ Green growth ’ and the new Industrial Revolution,
(January), 1-21.
Brander, L. and Eppink, F. 2012. The economics of ecosystems and biodiversity for Southeast Asia (ASEAN
TEEB): Scoping study. ASEAN Centre for Biodiversity, British Foreign and Commonwealth Office
and GIZ.
Bresciani, F. and Valdés, A (Eds.). 2007. Beyond food production. The role of agriculture in poverty
reduction. Northampton, MA: Edward Elgar and FAO.
Briones, R. M. 2016. Transformation and diversification of the rural economy in Asia. Rome: IFAD.
Briones, R. 2017. Transformation and diversification of the rural economy in Asia. IFAD Research
Series, n. 20. Rome, Italy.
Burke, L., Selig, E. and Spalding, M. 2002. Reefs at risk in Southeast Asia. Washington, D.C.: World
Resources Institute.
Byerlee, D. 2014. The fall and rise again of plantations in tropical Asia: History repeated? Land 3 (3):
574-97. http://www.mdpi.com/2073-445X/3/3/574/.
Byerlee, D., de Janvry, A. and Sadoulet, E. 2009. Agriculture for Development: Toward a New
Paradigm (October 2009). Annual Review of Resource Economics. 1(1): 15-35.
Cai, W., X. Hu, Huang, W., Murrell, M. C., Lehrter, J. C., Lohrenz, S. E., Chou, W., Zhai, W., Wang, Y.,
Guo, X., Gundersen, K., Hollibaugh, J. T., Dai, M., and Gong, G. 2011. Acidification of subsurface
coastal waters enhanced by eutrophication. Nature Geosci 4 (11): 766-70.
Carino, J. K. 2012. Country technical notes on indigenous peoples’ issues: Republic of the Philippines.
Rome: IFAD.
Cheung, W. W. L., Watson, R. and Pauly, D. 2013. Signature of ocean warming in global fisheries
catch. Nature 497 (7449): 365-68.
Christiaensen, L., Demery, L. and Kuhl, J. 2010. The (evolving) role of agriculture in poverty
reduction: An empirical perspective. Journal of Development Economics 96 (2): 239-54.
Christiansen, L., L. Demery, J. Kuhl. 2011. The (evolving) role of agriculture in poverty reduction –
an empirical perspective. Journal of Development Economics 96(2): 239-54.
Coffrey, D. and Spears, D. 2017. Where India goes: Abandoned toilets, stunted development, and
the cost of caste. Harper Collins.
Convention on Biological Diversity. 2004. The Ecosystem Approach: CBD Guidelines. Montreal:
Secretariat of the CBD. https://www.cbd.int/doc/publications/ea-text-en.pdf.
CRED (Centre for Research on the Epidemiology of Disasters). 2014. Database EM-DAT. Brussels:
Université Catholique de Louvain.
CRED and UNISDR (United Nations International Strategy for Disaster Reduction). 2015. Poverty
and death: Disaster mortality 1996-2015. CRED and UNISDR.
Credit Suisse, CDC Group plc, EMPEA (Emerging Markets Private Equity Association), IFC
(International Finance Corporation) and World Wildlife Fund (WWF). 2015. Private equity and
emerging markets agribusiness: Building value through sustainability. Credit Suisse.
150
Critchley, W. 2014. Internal report for the Asian Development Bank’s policy and advisory technical
assistance on Integrated Strategy for Sustainable Land Management in Dryland Ecosystems
(TA 8162-PRC). Manila.
Critchley, W. 2009. Soil and Water Management Techniques in Rainfed Agriculture: State of the
Art and Prospects for the Future. Background Note to World Bank. 2010. Improving Water
Management in Rainfed Agriculture: Issues and Options in Water-Constrained Production
Systems. World Bank Other Operational Studies 13028. Washington, D.C.: World Bank.
Cruz, R.,Harasawa, H., Lal, M., and Wu, S. 2007. Asia. In Climate change 2007: Impacts, adaptation and
vulnerability. Contribution of Working Group II to the Fourth Assessment Report of the Intergovernmental
Panel on Climate Change, ed. M. L. Parry, et al., 469-506. Cambridge: Cambridge University Press.
Dabla-Norris, E., Kochhar, K., Suphaphiphat, N., Ricka, F., and Tsounta, E. 2015. Causes and
consequences of income inequality: A global perspective. International Monetary Fund.
Dasgupta, S., Hossai, Md. M., Hug, M., Wheeler, D. 2014. Climate change, soil salinity, and the
economics of high-yield rice production in coastal Bangladesh. Washington, D.C.: World Bank.
Dasgupta, S., Laplante, B., Meisner, C., Wheeler, D., Jianping, Y. 2009. The impact of sea level rise
on developing countries: A comparative analysis. Climate Change 93 (3-4): 379-88.
Datt, G. and Ravallion, M. 2009. Has India’s economic growth become more pro-poor in the wake of
economic reforms? Policy Research Working Paper 5103, The World Bank: Washington, D.C.
David, B., Winters, P., and Carletto, G. 2010. A cross-country comparison of rural income generating
activities. World Development. 38(1): 48-63.
Deacon RT, 1995. Assessing the relationship between government policy and deforestation. Journal
of Environmental Economics and Management 28: 1-18.
de Graaf, M., Buck, L., Shames, S., & Zagt, R. (2017). Assessing Landscape Governance: A Participatory
Approach.
Deininger, K., Squire, L. 1996. Measuring income inequality: a new data-base. World Bank Economic
Review 10 (3): 565-591.
Deininger, K., Jin, S. and Sur, M. 2007. Sri Lanka’s rural non-farm economy: Removing constraints
to pro-poor growth. World Development 35 (12): 2056-78.
Denier, L., Scherr, S., Shames, S., Chatterton, P., Hovani, L., Stam, N. 2015. The Little Sustainable
Landscapes Book, Global Canopy Programme: Oxford.
Derpsch, R., and T. Friedrich. 2009. Development and Current Status of No-Till Adoption in the
World. Proceedings on CD-ROM. 18th Triennial Conference of the International Soil & Tillage
Research Organization (ISTRO), Izmir, Turkey, 15-19 June.
Dethier, J. J. and Effenberger, A. 2012. Agriculture and development: A brief review of the literature.
Economic Systems 36 (2): 175-205. http://dx.doi.org/10.1016/j.ecosys.2011.09.003.
Dukes, J. 2003. Hotter and weedier? Effects of climate change on the success of invasive species.
In Global climate change and biodiversity, ed. R. E. Green, M. Hartley, L. Miles, J. Scharlemann, A.
Watson and O. Watts, eds. Norwich: Tyndall Centre for Climate Change Research.
Fankhauser, S., Kazaglis, A., & Srivastav, S. 2017. Green growth opportunities for Asia (508).
Fant, C., Schlosser, C.A., Gao, X., Strzepeck, K., and Reilly, J. 2016. Projections of water stress based
on an ensemble of socioeconomic growth and climate change scenarios: A case study in Asia.
PLOS ONE 11 (3): e0150633.
151
FAO. FAOSTAT. 2015. Statistics Division of the Food and Agriculture Organization of the United
Nations.
FAO. FAOSTAT. 2016. Statistics Division of the Food and Agriculture Organization of the United
Nations.
FAO. 2018. Agriculture investment funds for development: Descriptive analysis and lessons learned from
funds management, performance and public-private collaboration. Food and Agriculture Organization
of the United Nations. Rome.
FAO. 2016a. Asia and the Pacific regional overview of food insecurity. Bangkok: FAO.
FAO. 2016b. The state of food and agriculture: Climate change, agriculture and food security. Rome: FAO.
FAO. 2015a. The impacts of natural hazards and disasters on agriculture and food security and nutrition:
A call for action to build resilient livelihoods. Rome: FAO.
FAO. 2015b. World fertilizer trends and outlook to 2018. Rome: FAO.
FAO. 2015c. The state of food and agriculture: Social protection and agriculture: Breaking the cycle of rural
poverty. Rome, Italy.
FAO. 2014. FAO statistical yearbook 2014: Asia and the Pacific food and agriculture. Bangkok: FAO.
FAO. 2013a. Climate-smart agriculture sourcebook. Rome: FAO.
FAO. 2013b. Climate change guidelines for forest managers. Rome: FAO.
FAO. 2013c. FAO statistical yearbook: World food and agriculture. Rome: FAO.
FAO. 2013d. Trends and impacts of foreign investment in developing country agriculture: Evidence from
case studies. Food and Agriculture Organization of the United Nations. Rome.
FAO. 2012. Greening the Economy with Climate-Smart Agriculture. Background Paper for the
Second Global Conference on Agriculture, Food Security and Climate Change, Hanoi, Vietnam,
3-7 September. http://www.fao.org/docrep/016/ap403e/ap403e.pdf.
FAO. 2011a. Asia-Pacific forests and forestry to 2020. Forest policy brief 01. Rome: FAO.
FAO. 2011b. State of the world’s forests. Rome: FAO.
FAO. 2010a. Forests and climate change in the Asia-Pacific Region. Forest and Climate Change Working
Paper 7. Rome: FAO.
FAO. 2010b. Global forest resources assessment 2010. FAO Forestry Paper 163. Rome: FAO.
FAO. 2010c. The state of world fisheries and aquaculture. Rome: FAO.
FAO. 2010d. World programme for the census of agriculture. http://www.fao.org/world-census-
agriculture/wca2020/wca2010/en/.
FAO. 2007. Building adaptive capacity to climate change: Policies to sustain livelihoods and fisheries. New
directions in fisheries – A series of policy briefs on development issues no. 8. Rome: FAO.
FAO. 2003. State of the world’s forest. Rome: FAO.
FAO. 2002. Land tenure and rural development. FAO Land Tenure Stories 3. Rome: FAO.
FAO and ADB. 2011. Greater Mekong Sub-region report Asia-Pacific Forestry Sector Outlook Study II. RAP
Publication 2011/04 FAO, Bangkok.
FAO, WFP (World Food Programme) and IFAD. 2012. The state of food insecurity in the world 2012:
Economic growth is necessary but not sufficient to accelerate reduction of hunger and malnutrition.
Rome: FAO.
152
Fernandez, E., and P. Nair. 1986. An Evaluation of the Structure and Function of Tropical
Homegardens. International Council for Research in Agroforestry (ICRAF) Working Paper No. 38.
Nairobi, Kenya.
Foster, A. and Rosenzweig, M. 2004. Agricultural productivity growth, rural economic diversity, and
economic reforms: India, 1970-2000. Economic Development and Cultural Change 52(3): 509-542.
Francks, P. 2002. Growth linkages, and economic development in nineteenth-century Japan. Journal
of Asian Studies 61(1): 33-55.
Fuglie, K. (2015). Accounting for Growth in Global Agriculture. Bio-based and Applied Economics
4(3): 221-254. Global Footprint Network, Open data platform.
Gerber, P.J., Steinfeld, H., Henderson, B., Mottet, A., Opio, C., Dijkman, J., Falcucci, A. & Tempio,
G. 2013. Tackling climate change through livestock – A global assessment of emissions and
mitigation opportunities. Food and Agriculture Organization of the United Nations (FAO), Rome.
Goddard, T., M. Zoebisch, Y. Gan, W. Ellis, A. Watson, and S. Sombatpanit, eds. 2007. No-Till
Farming Systems. World Association of Soil and Water Conservation (WASWC) Special Publication
No. 3. Bangkok: WASWC.
Government of India. 2012. India Second National Communication to the United Nations Framework
Convention on Climate Change Ministry. New Delhi: Government of India.
Green, T. R., Taniguchi, M., Kooi, H., Gurdak, J. J., Allen, D.M. 2011. Beneath the surface of global
change: Impacts of climate change on groundwater. Journal of Hydrology 405 (3-4): 532-60.
Gyau, A., Oudol, J., Mbugua, M., Foundjem-Tita, D., Ademonia, Arinloye, D., & Kouame, C.
(2015). Landsape approaches to sustainable supply chain management: the role of agribusiness.
Climate-Smart Landscapes: Multifunctionality in Practice, 1, 295-305. https://doi.org/10.1017/
CBO9781107415324.004.
Haggblade, S., Hazell, P. and Reardon, T. (eds.). 2007. Transforming the rural nonfarm economy:
Opportunities and threats in the developing world, MA: Johns Hopkins University Press.
Hallegatte, S., Bangalore, M., Bonzanigo, L., Fay, M., Kane, T., Narloch, U., Rozenberg, J. Treguer, D.,
Vogt-Schilb, A. 2016. Shock waves: Managing the impacts of climate change on poverty. Washington,
D.C.: World Bank Group.
Hanson, S., Nicholls, R., Ranger, N., Hallegatte, S., Corfee-Morlot, J., Herweijer, C., Chateau, J. 2011. A
global ranking of port cities with high exposure to climate extreme. Climatic Change 104 (1): 89-111.
Harris, N., Minnemeyer, S., Sizer, N., Alix-Mann, S., and Payne, O. 2015. With latest fires crisis,
Indonesia surpasses Russia as world’s fourth-largest emitter. World Research Institute.
Harvey, C. Chacon, C. Donatti, E. Garen, L. Hannah, A. Andrade, L. Bede, D. Brown, A. Calle,
J. Chara, C. Clement, E. Gray, M. Hoang, P. Minang, A. Rodriguez, C. Seeberg-Elverfeldt, B.
Semroc, S. Shames, S. Smukler, E. Somarriba, E. Torquebiau, J. van Etten, and E. Wollenberg.
2014. Climate-Smart Landscapes: Opportunities and Challenges for Integrating Adaptation and
Mitigation in Tropical Agriculture. Conservation Letters. 7 (2). pp. 77-90.
Hayami, Y. 2010. Plantations agriculture. In Handbook of agricultural economics, volume 4, ed. R.
Evenson and P. Pingali, 3305-22. North Holland.
Hayami, Y. 2007. An emerging agricultural problem in high-performing Asian economies. World Bank.
Policy Research Working Paper 4312. Washington, D.C., USA.
Hazell, P. B. R. 2009. The Asian Green Revolution. International Food Policy Research Institute.

153
Hazell, P. B. R. and Ramasamy, C. 1991. The Green Revolution reconsidered: The impact of high-yielding
rice varieties in south India. Baltimore, MA: Johns Hopkins University Press.
Hertel, T. W., Burke, M. B. and Lobell, D. B. 2010. The poverty implications of climate-induced crop
yield changes by 2030. Global Environmental Change 20 (4): 577-85.
Herzer, D. and Vollmer, S. 2012. Inequality and growth: Evidence from panel cointegration. Journal
of Economic Inequality 10 (4): 489-503.
Hijioka, Y., Lin, E., and Pereira, J.J. 2014. Asia. In Climate Change 2014: Impacts, adaptation, and
vulnerability. Part B: Regional aspects. Contribution of Working Group II to the Fifth Assessment Report
of the Intergovernmental Panel on Climate Change, ed. V. R. Barros et al., 1327-70. Cambridge:
Cambridge University Press.
Hoegh-Guldberg, O. 2014. Coral reefs in the Anthropocene: Persistence or the end of the line?
Geological Society, London, Special Publications 395 (1): 167-183.
Hoegh-Guldberg, O., Hoegh-Guldberg, H., Veron, J.E.N., Green, A., Gomez, E. D., Lough, J., King,
M., Ambariyanto, Hansen, L., Cinner, J., Dews, G., Russ, G., Schuttenberg, H. Z., Peñafl or,
E.L., Eakin, C. M., Christensen, T. R. L., Abbey, M., Areki, F., Kosaka, R. A., Tewfi k, A., Oliver,
J. (2009). The Coral Triangle and Climate Change: Ecosystems, People and Societies at Risk.
WWF Australia, Brisbane, 276 pp.Hoogerbrugge, I., and Fresco, L. 1993. Homegarden Systems:
Agricultural Characteristics and Challenges. Gatekeeper Series. No. 39. London: International
Institute for Environment and Development.
Howes, S. and Wyrwoll, P. 2012. Asia’s wicked environment problems. ADBI Working Paper 348. Tokyo:
Asian Development Bank Institute.
IFAD. 2016a. Rural development report: Fostering and inclusive rural transformation. Italy, Rome.
IFAD. 2016b. Strategic framework 2016-2025: Enabling inclusive and sustainable rural transformation.
Rome, Italy.
IFAD. 2014. Progress report on implementation of the performance-based allocation system. EB
2014/113/R.2/Add.1. Rome: IFAD.
IFAD. 2012. Country technical notes on indigenous peoples’ issues: Lao People’s Democratic Republic.
Rome: IFAD.
IFAD. 2011. Rural poverty report: New realities, new challenges, new opportunities for tomorrow’s generation.
Rome: IFAD.
IFAD. 2008. Climate change and the future of smallholder agriculture: How can rural poor people be a part
of the solution to climate change? Rome: IFAD.
IFAD. 2001. Rural poverty report. Rome: IFAD.
IFPRI (International Food Policy Research Institute). 2015. Global nutrition report 2015: Actions and
accountability to advance nutrition and sustainable development. Washington, D.C.: IFPRI. http://
ebrary.ifpri.org/cdm/ref/collection/p15738coll2/id/129443.
ILO (International Labour Organization) and ADB. 2011. Women and labour markets in Asia
rebalancing towards gender equality in labour markets in Asia. Bangkok: ILO Regional Office for
Asia and the Pacific.
Imai, K. S., Gaiha, R. and Bresciani, F. 2016. The dynamics of transformation in rural Asia and the Pacific.
Kobe: Kobe University.
Imai, K. S., Malaeb, B. and Bresciani, F. 2016. Remittances, growth and poverty reduction in Asia: A
critical review of the literature and new evidence from cross-country panel data. Kobe: Kobe University.
154
Imai, K. S., Gaiha, R. and Kang, W. 2011. Poverty, inequality and ethnic minorities in Vietnam.
International Review of Applied Economics 25 (3): 249-82. http://www.tandfonline.com/doi/abs/
10.1080/02692171.2010.483471.
Imai, K., Gaiha, R., Thapa, G. and Ali, A. 2012. Supply responses to food price changes in Asian
countries. In Institutions and comparative economic development, International Economic
Association Conference Volume 1, edited by M. Aoki, T. Kuran and G. Roland. Basingstoke, UK:
Palgrave Macmillan, pp. 313-332.
Immerzeel, W. W., van Beek, L. H. P. and Bierkens, M. F. P. 2010. Climate change will affect the Asian
water towers. Science 328: 1382-1385.
IPCC (Intergovernmental Panel on Climate Change). 2014a. Climate change 2014: Impacts, adaptation,
and vulnerability. Part B: Regional aspects. Contribution of Working Group II to the Fifth Assessment
Report of the Intergovernmental Panel on Climate Change. Cambridge: Cambridge University Press.
IPCC 2014b. Summary for Policymakers. In Climate Change 2014: Mitigation of Climate Change.
Contribution of Working Group III to the Fifth Assessment Report of the Intergovernmental
Panel on Climate Change [O. Edenhofer et al. (eds.)]. Cambridge, United Kingdom and New
York, USA: Cambridge University Press. pp. 1-32.
IPCC. 2012. Managing the risks of extreme events and disasters to advance climate change adaptation: Special
Report of the Intergovernmental Panel on Climate Change. Cambridge: Cambridge University Press.
IPCC. 2007. Climate Change 2007: Synthesis Report. Contribution of Working Groups I, II and III to the
Fourth Assessment Report of the Intergovernmental Panel on Climate Change. Geneva, Switzerland.
Islam, M. S. and Tanaka, M. 2004. Impacts of pollution on coastal and marine ecosystems including
coastal and marine fisheries and approach for management: A review and synthesis. Marine
Pollution Bulletin 48 (7-8): 624-49.
Ivanic, M., Martin, W. and Zaman, H. 2011. Estimating the short-run poverty impacts of the 2010-11 surge
in food prices. Washington, D.C.: World Bank.
IWGIA (International Work Group for Indigenous Affairs). 2016. The indigenous world, 2016.
Copenhagen: IWGIA.
Jacobs, M. 2012. Green Growth: Economic Theory and Political Discourse. Centre for Climate Change
Economics and Policy Working Paper, (108), 1-24. https://doi.org/10.1162/REST_a_00255.
Jacob K., Kauppert P. and Quitzow R. 2013. Green Growth Strategies in Asia Drivers and Political
Entry Points.
Jamora, N. and Labaste, P. 2015. Dietary changes and implications on future food demand in East Asia.
The World Bank. Working Paper. Mimeo. Washington, D.C.
Janvry, A. De and Sadoulet, E. 2009. Agricultural growth and poverty reduction: Additional evidence.
World Bank Research Observer 25 (1): 1-20.
Jha, R. 2005. Alleviating environmental degradation in the Asia-Pacific region: International cooperation
and the role of issue-linkage. Canberra, ACT: Australian National University.
Jin, S., Guo, H., Delgado, M.S., and Wang, H. 2017. Benefit or damage? The productivity effects of
FDI in the Chinese food industry. Food Policy. Vol. 68: 1-9.
Johnston, B. 1951. Agricultural productivity and economic development in Japan. Journal of
Political Economy 59(6): 498-513.
Johnston, B. F. and Mellor, J. W. 1961. The role of agriculture in economic development. American
Economic Review 51 (4): 566-93. http://www.jstor.org/stable/1812786.
155
Johnston, F. H., Henderson, S. B., Chen, Y., Randerson, J. T., Marlier, M., Defries, R.S., Kinney,
P., Bowman, D. M., Brauer. M. 2012. Estimated global mortality attributable to smoke from
landscape fires. Environmental Health Perspectives 120 (5): 695-701.
Kanbur, R. and Sumner, A. 2012. Poor countries or poor people? Development assistance and the
new geography of global poverty. Journal of International Development 24 (6): 686-95.
Kasem, S. and Thapa, G. B. 2011. Crop diversification in Thailand: Status, determinants, and effects
on income and use of inputs. Land Use Policy 28 (3): 618-28. http://dx.doi.org/10.1016/j.
landusepol.2010.12.001.
Kelly-Hope, L. and Thomson, M. 2008. Climate change and infectious diseases. In Seasonal forecasts,
climatic change, and human health, ed. M. C. Thomson, R. Garcia-Herrera and M. Beniston, 31-70.
Dordrecht: Springer Science+Business Media.
Ketterings, Q. M., Wibowo, T. T., van Noordwijk, M., Penot, E. 1999. Farmers’ perspectives on
slash-and-burn as a land clearing method for small-scale rubber producers in Sepunggur, Jambi
Province, Sumatra, Indonesia. Forest Ecology and Management 120: 157-169.
Ketterings, Q. M., Noordwijk, M. Van and Bigham, J. M. 2002. Soil phosphorus availability after
slash-and-burn fires of different intensities in rubber agroforests in Sumatra, Indonesia.
Agriculture, Ecosystems and Environment 92: 37-48.
Knox, J., Hess, T., Daccache, A., Wheeler, T. 2012. Climate change impacts on crop productivity in
Africa and South Asia. Environmental Research Letters 7: 034032.
Koplitz, S. N., Mickley, L. J., Marlier, M. E., Buonocuore, J. J., Kim, P. S., Liu, T., Sulprizio, M. P.,
DeFries, R. S., Jacob, D. J., Schwartz, J., Pongsiri, M., Myers, S. S. 2016. Public health impacts
of the severe haze in equatorial Asia in September–October 2015: Demonstration of a new
framework for informing fire management strategies to reduce downwind smoke exposure.
Environmental Research Letters 11 (9): 94023.
Koshy, K., Mataki, M. and Lal, M. 2008. Sustainable development: A Pacific islands perspective. Apia:
UNESCO Cluster Office for the Pacific States.
Kossin, J. P., Emanuel, K. A. and Vecchi, G. A. 2014. The poleward migration of the location of
tropical cyclone maximum intensity. Nature 509 (7500): 349-52.
Kozar, R., Buck, L.E., Barrow, E.G., Sunderland, T.C.H., Catacutan, D.E., Planicka, C., Hart, A.K., and
L. Willemen. 2014. Toward Viable Landscape Governance Systems: What Works? Washington,
D.C.: EcoAgriculture Partners, on behalf of the Landscapes for People, Food, and Nature Initiative.
Kreft, S., Eckstein, D., Melchior, I. 2017. Global climate risk index 2017: Who suffers most from extreme
weather events? Weather-related loss events in 2015 and 1996 to 2015. Bonn: Germanwatch.
Kroeker, K. J., Kordas, R. L., Crim, R., Hendricks, I. E., Ramajo, L., Singh, G. S., Duerte, C. M. 2013.
Impacts of ocean acidification on marine organisms: Quantifying sensitivities and interaction
with warming. Global Change Biology 19: 1884-96.
Kubiszewski, I., Anderson, S. J., Costanza, R., Sutton, P. C. 2016. The future of ecosystem services in
Asia and the Pacific. Asia and the Pacific Policy Studies 3 (3): 389-404.
Kundzewicz, Z.W., L.J. Mata, N.W. Arnell, P. Döll, P. Kabat, B. Jiménez, K.A. Miller, T. Oki, Z. Sen
and I.A. Shiklomanov. 2007. Freshwater resources and their management. In Climate change
2007: Impacts, adaptation and vulnerability. Contribution of Working Group II to the Fourth Assessment
Report of the Intergovernmental Panel on Climate Change, ed. M. L. Parry et al., 173-210. Cambridge:
Cambridge University Press.

156
Lal, M. 2011. Implications of climate change in sustained agricultural productivity in South Asia.
Regional Environmental Change 11 (1): 79-94.
Lal, R. 2007. Soil degradation and environment quality in South Asia. International Journal of Ecology
and Environmental Sciences 33 (2): 91-103.
Larson, B. A. and Bromley, D. W. 1990. Property rights, externalities, and resource degradation.
Journal of Development Economics 33 (2): 235-62.
Lehmann, J., Coumou, D. and Frieler, K. 2015. Increased record-breaking precipitation events under
global warming. Climatic Change 132 (4): 501-15.
Lewis, A. W. 1954. Economic development with unlimited supplies of labour. The Manchester School
22 (2): 139-91.
Lipton, M. and Longhurst, R. 1989. New seeds and poor people. Agricultural Systems 33 (4): 378-80.
Liu, J., Yang, H. and Savenije, H. H. G. 2008. China’s move to higher-meat diet hits water security.
Nature 454 (7203): 397.
Lloyd, S. J., Kovats, R. S. and Chalabi, Z. 2011. Climate change, crop yields, and undernutrition:
Development of a model to quantify the impact of climate scenarios on child undernutrition.
Environmental Health Perspectives 119 (12): 1817-24.
Lobell, D. B., Burke, M. B., Tebaldi, C., Mastrandrea, M. D., Falcon, W. P., Naylor, R. L. 2008.
Prioritizing climate change adaptation needs for food security in 2030. Science 319 (5863):
607-610.
Lokshin, M. and Radyakin, S. 2012. Month of birth and children’s health in India. Journal of Human
Resources 47 (1): 174-203.
López, R. and Ánriquez, G. 2007. Growth and poverty reduction. In Beyond Food Production: The
Role of Agriculture in Poverty Reduction. Fabrizio Bresciani and Alberto Valdés (eds.), Food and
Agriculture Organization of the United Nations and Edward Elgar, Cheltenham, UK.
Lough, J. M. 2012. Small change, big difference: Sea surface temperature distributions for tropical
coral reef ecosystems, 1950-2011. Journal of Geophysical Research 117: C09018.
Lundgren, B. 1982. Introduction (Editorial). What is Agroforestry? Agroforestry Systems. 1. pp. 3-6.
Lybbert T. and Sumner D. 2010. Agricultural Technologies for Climate Change Mitigation and
Adaptation in Developing Countries: Policy Options for Innovation and Technology Diffusion,
ICTSD–IPC Platform on Climate Change, Agriculture and Trade, Issue Brief No.6, International
Centre for Trade and Sustainable Development, Geneva, Switzerland and International Food &
Agricultural Trade Policy Council, Washington, D.C., USA.
Macusi, E. D., Katikiro, R. E., Ashoka Deepananda, K. H. M., Jimenez, L. A., Conte, A. R., Fadli,
N. 2011. Human induced degradation of coastal resources in Asia Pacific and implications on
management and food security. Journal of Nature Studies 9 (2)/10(1): 13-28.
Margono, B. A., Potapov, P. V., Turubanova, S., Stolle, F., Hansen, M. C. 2014. Primary forest cover
loss in Indonesia over 2000-2012. Nature Climate Change 4 (8): 730-35.
Martin, W. and Warr, P. G. 1993. ‘Explaining the relative decline of agriculture: A supply-side analysis
for Indonesia’, World Bank Economic Review, 7(3), pp. 381-401. doi: 10.1093/wber/7.3.381.
McDonald, R. I., Green, P., Balk, D., Fekete, B. M., Revenga, C., Todd, M., Montgomery, M., Gleick,
P. H.. 2011. Urban growth, climate change, and freshwater availability. Proceedings of the National
Academy of Sciences of the United States of America 108 (15): 6312-17.
157
Mcleod, E., Hinkel, J., Athanasios, T. V., Nicholls R. J., Harvey N., Salm, R. 2010. Sea-level rise
vulnerability in the countries of the Coral Triangle. Sustainability Science 5 (2): 207-22.
McNeely, J., and S. Scherr. 2003. Ecoagriculture: Strategies to Feed the World and Save Wild
Biodiversity. Washington, DC: Island Press.
Meissner, K. J., Lippmann, T. and Sen Gupta, A. 2012. Large-scale stress factors affecting coral reefs:
Open ocean sea surface temperature and surface seawater aragonite saturation over the next 400
years. Coral Reefs 31 (2): 309-19.
Milanovic, B. 2013. Global income inequality in numbers: In history and now. Global Policy 4 (2):
198-208.
Millennium Ecosystem Assessment. 2005. Ecosystems and human well-being: Synthesis. Washington,
D.C.: Millennium Ecosystem Assessment.
Minang, P. A., van Noordwijk, M., Freeman, O. E., Mbow, C., Leeuw, J. De, & Catacutan, D. 2015.
Climate-Smart Landscapes : Multifunctionality in Practice. Nairobi, Kenya.
Mohammed, A. R. and Tarpley, L. 2009. High nighttime temperatures affect rice productivity
through altered pollen germination and spikelet fertility. Agricultural and Forest Meteorology 149:
999-1008.
Mukherjee, A., Sengupta, M. K., Hossain, M. A., Ahamed, S., Das, B., Nayak, B., Lodh, D., Rahman,
M. M., Chakraborti, D. 2006. Arsenic contamination in groundwater: A global perspective with
emphasis on the Asian scenario. Journal of Health, Population and Nutrition 24 (2): 142-63.
Muthayya, S., Sugimoto, J. D., Montgomery, S., Maberly, G. F. 2014. An overview of global rice
production, supply, trade, and consumption. Annals of the New York Academy of Sciences 1324
(1): 7-14.
Myers, S. S., Zanobetti, A., Kloog, I., Huybers, P., Andrew, D. B., Bloom, A., Carlisle, E., Dietterich,
L. H., Fitzgerald, G., Holbrook, N. M., Nelson, R. L., Ottman, M. J. 2014. Rising CO2 threatens
human nutrition. Nature 510 (7503): 139-42.
Najim, M.M.M., Lees, T.S., Haque, M.A., and Esham, M. (2007). The sustainability of rice production:
A Malaysian perspective. The Journal of Agricultural Sciences. 3(1): 1-12.
Negra, C. 2013. Agriculture and Climate Change in National Green Growth Strategies, (49), 40.
Nelson, G. C., Rosegrant, M. W., Palazzo, A., Gray, I., Ingersoll, C., Robertson, R., Tokgoz, S., Zhu, T.
2010. Food security and climate change. IFPRI Issue Brief 66. Washington, D.C.: IFPRI.
Nelson, G. C., Rosegrant, M. W., Koo, J., Robertson, R., Sulser, T., Zhu, T., Ringler, C., Msangi, S.,
Palazzo, A., Batka, M., Magalhaes, M., Valmonte-santos, R., Ewing, M., Lee, D. 2009. Climate
change: Impact on agriculture and costs of adaptation. Washington, D.C.: IFPRI.
Novotny, V., Wang, X., Englande, A. J., Bedoya, D., Promakasikorn, L., Tirado, R. 2010. Comparative
assessment of pollution by the use of industrial agricultural fertilizers in four rapidly developing
Asian countries. Environment, Development and Sustainability 12 (4): 491-509.
Nurse, L. A., McLean, R. F., Agard J., Briguglio, L. P., Duvat-Magnan, V., Pelesikoti, N., Tompkins,
E., Webb, A. 2014. Small islands. In Climate change 2014: Impacts, adaptation, and vulnerability.
Part B: Regional aspects. Contribution of Working Group II to the Fifth Assessment Report of the
Intergovernmental Panel on Climate Change, ed. [Barros, V.R., C.B. Field, D.J. Dokken, M.D.
Mastrandrea, K.J. Mach, T.E. Bilir, M. Chatterjee, K.L. Ebi, Y.O. Estrada, R.C. Genova, B. Girma,
E.S. Kissel, A.N. Levy, S. MacCracken, P.R. Mastrandrea, and L.L. White (eds.)]., 1613-1654.
Cambridge: Cambridge University Press.

158
Nwanze, K.F. and Shenggen, F. (2016). Climate change and agriculture: Strengthening the role of
smallholders. In Global Food Policy Report. Chapter 2. Pp. 12-21. Washington, D.C.: International
Food Policy Research Institute (IFPRI). http://dx.doi.org/10.2499/9780896295827_02.
OECD (Organisation for Economic Co-operation and Development). 2017. Agricultural policies in
the Philippines. Paris: OECD.
OECD. 2011. Towards Green Growth. OECD Green Growth Studies. Paris: OECD Publishing.
OECD and FAO. 2017. OECD-FAO agricultural outlook 2017-2026. Paris: OECD and FAO.
Otsuka, K. 2013. Food insecurity, income inequality, and the changing comparative advantage in
world agriculture. Agricultural Economics 44 (Suppl.1): 7-18. doi: 10.1111/agec.12046.
Otsuka, K. 2007. The rural industrial transition in East Asia: Influences and implications. In
Transforming the rural nonfarm economy: Opportunities and threats in the developing world, edited by
S. Haggblade, P. Hazell, and T. Reardon, MA: Johns Hopkins University Press.
Otsuka, K., Liu, Y. and Yamauchi,F. 2016a. The future of small farms in Asia. Development Policy
Review, Overseas Development Institute, vol. 34(3), pp. 441-461, May.
Otsuka, K., Liu, Y., and Yamauchi,F. 2016b. Growing advantage of large farms in Asia and its
implications for global food security, Global Food Security 11, (5).
Otsuka, K. and Sonobe, T. 2011. A cluster-based industrial development policy for low-income
countries. World Bank Policy Research Working Paper Series No. 5703. Washington, D.C.:
World Bank.
Palmer, J., and G. Laquihon. 2004. Nitrogen-Fixing Contour Hedgerows as a Sustainable Soil and
Water Conservation Practice: The SALT Experience. In D. Barker, A. Watson, S. Sombatpanit, B.
Northcutt, and A. Maglinao. Ground and Water Bioengineering for Erosion Control and Slope
Stabilization. Enfield, New Hampshire: Science Publishers. pp. 197-205.
Pelletier, J., Codjia, C. and Potvin, C. 2012. Traditional shifting agriculture: Tracking forest carbon
stock and biodiversity through time in western Panama. Global Change Biology 18 (12): 3581-95.
Peter Timmer, C. 1988. ‘Chapter 8 The agricultural transformation’, Handbook of Development
Economics, 1, pp. 275–331. doi: 10.1016/S1573-4471(88)01011-3.
Pingali, P. 2004. Westernisation of Asian diets and the transformation of food systems: Implications
for research and policy. Food Policy 32 (4): 281-98.
Pingali, P. L. and Rosegrant, M. W. 1995. Agricultural commercialization and diversification:
Processes and policies. Food Policy 20 (3): 171-85.
Pomeranz, K., Turner, J. L., Shifflett, S. C., Wirsing, R. G., Cronin, R. P. 2013. Himalayan water
security: The challenges for South and Southeast Asia. Asia Policy 16: 1-50.
Porter, J. R., Xie, L., Challinor, A.J., Cochrane, K., Howden, S.M., Iqbal, M.M., Lobell, D.B., and
Travasso, M.I. 2014. Food security and food production systems. In Climate change 2014: Impacts,
adaptation, and vulnerability. Part A: Global and sectoral aspects. Contribution of Working Group II to
the Fifth Assessment Report of the Intergovernmental Panel on Climate Change, ed. C. B. Field, V. R.
Barros, D. J. Dokken, K., and M. Mastrandrea, 485-533. Cambridge: Cambridge University Press.
Pretty, J. 2006. Agroecological approaches to agricultural development: Background paper for the World
Bank World Development Report 2008 – Agriculture for development. World Bank Group.
Qiu, Y., Lin, Z. and Wang, Y. 2010. Responses of fish production to fishing and climate variability in
the northern South China Sea. Progress in Oceanography 85 (3-4): 197-212.
159
Qu, J. and Fan, M. 2010. The current state of water quality and technology development for water
pollution control in China. Critical Reviews in Environmental Science and Technology 40 (6): 519-60.
Quizon, A. 2013. Land governance in Asia: Understanding the debates on land tenure rights and land
reforms in the Asian context. International Land Coalition, Land Governance in the 21st Century:
Framing the Debates Series. Italy, Rome.
Rabbani, G., Rahman, A. and Mainuddin, K. 2013. Salinity-induced loss and damage to farming
households in coastal Bangladesh. International Journal of Global Warming 5 (4): 400-15.
Rabbani Mondal, G., Khalek, A., Rahman, M., Mahmud, D. 2010. Price escalation of rice in
Bangladesh: A time series approach. ASA University Review 4 (1): 97-119.
Ram, A. N., Gawander, J. S., Jokhan, A. D., Garan, K. 2007. Soil loss and declining sugarcane yields
on sloping land in Fiji. XXVI Congress, International Society of Sugar Cane Technologists, ICC,
Durban, South Africa, 29 July - 2 August, 2007, 190-98.
Ramos, C. G., Estudillo., J., Sawada, Y., Otsuka, K. 2012. Transformation of the rural economy
in the Philippines, 1988–2006. Journal of Development Studies 48 (11): 1629-48. http://www.
tandfonline.com/doi/abs/10.1080/00220388.2012.716151.
Raintree, J., and K. Warner. 2015. Agroforestry Pathways Revisited: Voices from the Past. In M. F.
Cairns, ed. Shifting Cultivation and Environmental Change: Indigenous People, Agriculture and
Forest Cultivation. London: Earthscan. pp. 87-121.
Ranis, G. and Fei, J. C. H. 1961. A theory of economic development. American Economic Review
51: 533-65.
Ravallion, M. 2014. Income inequality in the developing world. Science 344 (6186): 851-55. http://
www.sciencemag.org/cgi/doi/10.1126/science.1251875.
Ravallion, M. and Chen, S. 2007. China’s (uneven) progress against poverty. Journal of Development
Economics 82: 1-42.
Ravallion, M. and Datt, G. 1996. How important to India’s poor is the sectoral composition of
economic growth? World Bank Economic Review. 10(1): 1-25.
Reardon, T. and Timmer, C. P. 2014. Five inter-linked transformations in the Asian agrifood economy:
Food security implications. Global Food Security 3 (2): 108-17. http://dx.doi.org/10.1016/j.
gfs.2014.02.001.
Reardon, T., Timmer, C. P. and Minten, B. 2012. Supermarket revolution in Asia and emerging
development strategies to include small farmers. Proceedings of the National Academy of Sciences
109 (31): 12332-37. http://www.pnas.org/cgi/doi/10.1073/pnas.1003160108.
Reardon, T., Barrett, T. B., Berdegue, J. A., Swinnen, J. F. M. 2009. Agrifood industry transformation
and small farmers in developing countries. World Development 37 (11): 1717-27.
Reed, J., Van Vianen, J., Deakin, E. L., Barlow, J., Sunderland, T. 2016. Integrated landscape
approaches to managing social and environmental issues in the tropics: Learning from the past
to guide the future. Global Change Biology 22 (7): 2540-54.
Rockström, J., Williams, J., Daily, G., Noble, A., Matthews, N., Gordon, L., … Smith, J. 2017.
Sustainable intensification of agriculture for human prosperity and global sustainability. Ambio,
46(1), 4–17. https://doi.org/10.1007/s13280-016-0793-6.

160
Rosegrant, Mark W.; Koo, Jawoo; Cenacchi, Nicola; Ringler, Claudia; Robertson, Richard D.;
Fisher, Myles; Cox, Cindy M.; Garrett, Karen; Perez, Nicostrato D.; and Sabbagh, Pascale. 2014.
Food security in a world of natural resource scarcity: The role of agricultural technologies.
Washington, D.C.: International Food Policy Research Institute (IFPRI). http://dx.doi.
org/10.2499/9780896298477.
Rozenberg, J. and Hallegatte, S. 2015. The impacts of climate change on poverty in 2030 and the potential
from rapid, inclusive, and climate-informed development. Research Working Paper No. WPS 7483.
Washington, D.C.: World Bank Group.
RRI 2009. Rights and Resources Initiative Annual Progress Report 2009.
Sayer, J., T. Sunderland, J. Ghazoul, J-L. Pfund, D. Shell, E. Meijaard, M. Venter, A. Boedhihartono,
M. Day, C. Garcia, C. van Oosten, and L. Buck. 2013. Ten Principles for a Landscape Approach
to Reconciling Agriculture, Conservation, and Other Competing Land Uses. Special Feature:
Perspective in May’s Proceedings of the National Academy of Sciences. PNAS. 110 (21). pp.
8,349-8,356.
Scherr, S. J., Mankad, K., Jaffee, S., & Negra, C. 2015. Steps toward green: Policy responses to the
environmental footprint of commodity agriculture in East and South East Asia.
Schleussner, C., Lissner, T. K., Fischer, E. M., Wohland, J., Perrette, M., Golly, A., Rogelj, J., Childers, K.,
Schewe, J., Frieler, K., Mengel, M., Hare, W., Schaeffer, M. 2016. Differential climate impacts for policy-
relevant limits to global warming: The case of 1.5° C and 2° C. Earth System Dynamics 7: 327-51.
Shah, T. 2009. Climate change and groundwater: India’s opportunities for mitigation and
adaptation. Environmental Research Letters 4: 13.
Shameem, M. I., Momtaz, S. and Rauscher, R. 2014. Vulnerability of rural livelihoods to multiple
stressors: A case study from the southwest coastal region of Bangladesh. Ocean and Coastal
Management 102: 79-87.
Shrestha, A., Agrawal, N. K., Alfthan, B., Bajracharya, S. R., Maréchal, J., van Oort, B. 2015. The
Himalayan climate and water atlas: Impact of climate change on water resources in five of Asia’s major
river basins. International Centre for Integrated Mountain Development, GRID-Arendal and the
Centre for International Climate and Environmental Research-Oslo.
Siamwalla, A. 1994. An assessment of impact of price intervention program in the rice markets, year
1992–93. TDRI White Paper, No. 7.
SMERU Research Institute. (2003). Transitions to non-farm employment and the growth of the
rattan industry: The example of Desa Buyut, Cirebon. In The Indonesian rural economy: Mobility,
work, and enterprise, edited by T. Leinback. Singapore: Institute of Southeast Asian Studies.
Smith, P., Bustamante, M., Ahammad, H., Clark, H., Dong, H., Elsiddig, E. A., Haberl, H., Harper,
R., House, J., Jafari, M., Masera, O., Mbow, C., Ravindrnath, N. H., Rice, C. W., Abad, C. R.,
Romanovskaya, A., Sperling, F., Tubiello, F. N. 2014. Agriculture, forestry and other land use
(AFOLU). In Climate change 2014: Mitigation of climate change. Contribution of Working Group III
to the Fifth Assessment Report of the Intergovernmental Panel on Climate Change [Edenhofer, O., R.
Pichs-Madruga, Y. Sokona, E. Farahani, S. Kadner, K. Seyboth, A. Adler, I. Baum, S. Brunner, P.
Eickemeier, B. Kriemann, J. Savolainen, S. Schlömer, C. von Stechow, T. Zwickel and J.C. Minx
(eds.)]. Cambridge: Cambridge University Press.
SOA (State Oceanic Administration of China). 2014. China Ocean Environment Bulletin. SOA.
Sodhi NS and Brook BW, 2006 Southeast Asian Biodiversity in Crisis. Cambridge: Cambridge
University Press.
161
Steenwerth, K., A. Hodson, A. Bloom, M. Carter, A. Cattaneo, C. Chartres, J. Hatfield, K. Henry, J.
Hopmans, W. Horwath, B. Jenkins, E. Kebreab, R. Leemans, L. Lipper, M. Lubell, S. Msangi, R.
Prabhu, M. Reynolds, S. Solis, W. Sischo, M. Springborn, P. Tittonell, S. Wheeler, S. Vermeulen, E.
Wollenberg, L. Jarvis, and L. Jackson. 2014. Climate-Smart Agriculture Global Research Agenda:
Scientific Basis for Action. Agriculture & Food Security. 3 (1). p. 11. www.agricultureandfoodsecurity.
com/content/pdf/2048-7010-3-11.pdf.
Subramanian S.M., Gasparatos A., Braimoh A.K., and Elliott W., 2011. Unraveling the drivers of
Southeast Asia’s biodiversity loss. UNU, Tokyo, Japan. Available at: http://unu.edu/publications/
articles/unraveling-the-drivers-of-southeast-asia-biodiversity-loss.html#info.
Sumarto, S. and Suryahadi, A. (2007). Indonesia. In Beyond Food Production: The Role of Agriculture
in Poverty Reduction. Fabrizio Bresciani and Alberto Valdés (eds.), Food and Agriculture
Organization of the United Nations and Edward Elgar, Cheltenham, UK.
Sunderlin, W. D., Dewi, S., Puntodewo, A., Muller, D., Angelsen, A., and Epprecht, M. (2008). Why
forests are important for global poverty alleviation: A spatial explanation. Ecology and Society 13
(2) 24: 23-30.
Sur, M., Zhang, J. and Chen, K. 2014. The investment climate and enterprise performance in
rural Pakistan: Implications for rural non-farm employment generation. Journal of the Asia
Pacific Economy 19 (3): 488-505. http://www.scopus.com/inward/record.url?eid=2-s2.0-
84900008853&partnerID=40&md5=fe8b6028d8326d7da65774161a20e839.
Tao, F. and Zhang, Z. 2013. Climate change, high-temperature stress, rice productivity and water
use in Eastern China: A new superensemble-based probabilistic projection. Journal of Applied
Meteorology and Climatology 52 (3): 531-51.
Taylor, M., Mcgregor, A. and Dawson, B. 2016. Vulnerability of Pacific island agriculture and forestry to
climate change. Noumea: Pacific Community. Technical Working Group on Agriculture and Water
(TWGAW). (2006) Participatory irrigation management and development (PIMD) in Cambodia:
Review of Experiences: Modes of intervention, results and lessons learned. Main Report.
Thapa, G. 2013. Enhancing IFAD’s engagement with indigenous peoples in Asia and the Pacific. In
First Global Meeting of the Indigenous Peoples’ Forum. Rome: IFAD.
The World Bank. (2014). The Practice of Responsible Investment Principles in Larger-Scale Agricultural
Investments: Implications for Corporate Performance and Impact on Local Communities. World Bank
Report Number 86175-GLB, Washington, D.C.
Thirtle, C., Lin, L. and Piesse, J. 2003. The impact of research-led agricultural productivity growth
on poverty reduction in Africa, Asia and Latin America. World Development 31 (12): 1959-75.
Tian, X., Matsui, T., Li, S., Yoshimoto, M., Hasegawa, T., Tian, X., Matsui, T., Li, S., Yoshimoto, M.
2010. Heat-induced floret sterility of hybrid rice (Oryza sativa L.) Cultivars under humid and low
wind conditions in the field of Jianghan Basin, China. Plant Production Science 13 (3): 243-51.
Tiffin, R. and Irz, X. 2006. Is agriculture the engine of growth? Agricultural Economics 35(1): 78-89
Timmer, C. P. 2009. Do supermarkets change the food policy agenda? World Development 37 (11):
1812-19.
Timmer, C. P. 2008. Agriculture and pro-poor growth: An Asian perspective. Asian Journal of Agriculture
and Development 5 (63): 1-27.
Tirado, M. C., Clarke, R., Jaykus, L. A., Mcquatters-gollop, A., Frank, J. M. 2010. Climate change and
food safety: A review. Food Research International 43 (7): 1745-65.
162
Torlesse, H., Kiess, L. and Bloem, M. W. 2003. Association of household rice expenditure with child
nutritional status indicates a role for macroeconomic food policy in combating malnutrition.
Journal of Nutrition 133 (5): 1320-25.
Torquebiau, E. 2015. Whither Landscapes? Compiling Requirements of the Landscape Approach.
In P. Minang, M. van Noordwijk, O. Freeman, C. Mbow, J. de Leeuw, and D. Catacutan, eds.
2015. Climate-Smart Landscapes: Multifunctionality in Practice. Nairobi: World Agroforestry
Centre. pp. 21-35.
Tosca, M., Randerson, J. T., Zender, C. S., Flanner, M. G., Rasch, P. J. 2010. Do biomass burning
aerosols intensify drought in equatorial Asia during El Nino? Atmospheric Chemistry and Physics
Discussions 9: 23319-48.
Tripp, R. 2006. Natural resource perspectives 102: Is low external input technology contributing to
sustainable agricultural development? London: Overseas Development Institute.
Tubiello, F. N., Salvatore, M., Cóndor Golec, R. D., Ferrara, A., Rossi, S., Biancalani, R., Federici,
S., Jacobs, H., Flammini, A. 2014. Agriculture, forestry and other land use emissions by sources and
removals by sinks: 1990-2011. Analysis. ESS Working Paper No. 2 2014. FAO.
UNDESA. 2012. Follow-up framework by the United Nations system to Rio+20. United Nations
Department for Economics and Social Affairs. New York, NY, USA. http://sustainabledevelopment.
un.org/followupbyunsystem.html.
United Nations and ADB. 2012. Green growth, resources and resilience: Environmental sustainability in
Asia and the Pacific. Bangkok: United Nations and ADB.
UN-HABITAT (United Nations Human Settlements Programme). 2010. The state of Asian cities
2010/11. Fukuoka: UN-HABITAT.
UNEP (United Nations Environment Programme). 2016. Global environment outlook (GEO-6):
Regional assessment for Asia and the Pacific. Nairobi: UNEP.
UNEP. 2015. Indicators for a resource efficient and green Asia and the Pacific: Measuring progress of
sustainable consumption and production, green economy and resource efficiency policies in the Asia-
Pacific region. Bangkok: UNEP.
UNEP 2014. Building Natural Capital: How REDD+ Can Support a Green Economy. Nairobi.
http:// unep.org/resourcepanel/Publications/BuildingNaturalCapitalHowREDD/tabid/132320/
Default.aspx.
UNEP. 2013. Recent trends in material flows and resource productivity in Asia and the Pacific. Bangkok: UNEP.
UNEP. 2012a. Global environment outlook (GEO-5): Environment for the future we want. Malta: UNEP.
UNEP. 2012b. Growing greenhouse gas emissions due to meat production. https://na.unep.net/geas/
getuneppagewitharticleidscript.php?article_id=92.
UNEP 2011. Towards a Green Economy: Pathways to Sustainable Development and Poverty
Eradication—A Synthesis for Policy Makers. http://web.unep.org/greeneconomy/resources/
green-economy-report.
UNEP. 2006. Challenges to international water: Regional assessments in a global perspective.
Nairobi: UNEP.
UNESCAP (Economic and Social Commission for Asia and the Pacific). 2016. Economic and social
survey of Asia and the Pacific 2016: Nurturing productivity for inclusive growth and sustainable
development. Bangkok: UN-ESCAP.
163
UNESCAP. 2015. Overview of natural disasters and their impacts in Asia and the Pacific, 1970-2014.
Bangkok: UNESCAP.
UNESCAP. 2014. Statistical yearbook for Asia and the Pacific. Bangkok: UNESCAP.
UNESCAP. 2013. Water, food and energy nexus in Asia and the Pacific: Discussion paper. Bangkok:
UNESCAP.
UNESCAP. 2009. Sustainable agriculture and food security in Asia and the Pacific. Bangkok: UNESCAP.
UNESCAP. 2005. State of the environment in Asia and the Pacific 2005: Economic growth and sustainability.
Bangkok: UNESCAP.
UNSD (United Nations Statistics Division). 2017. UNSD: Methodology. https://unstats.un.org/unsd/
methodology/m49/.
UNSD. 2017. UN Comtrade Database. United Nations Statistics Division. Available at: http://
comtrade.un.org/data/.
USAID (United States Agency for International Development). 2013. Mekong adaptation and resilience
to climate change synthesis report. Bangkok: UNSAID.
Valdés, A. and Foster, W. 2010. Reflections on the role of agriculture in pro-poor growth. World
Development 38(10): 1362-1374.
Vass, K. K., Das, M. K., Srivastava, P. K., Dey, S. 2009. Assessing the impact of climate change on
inland fisheries in River Ganga and its plains in India. Aquatic Ecosystem Health & Management
12 (2): 138-51.
Vinke, K., Martin, M. A., Adams, S., Baarsch, F., Bondeau, A., Coumou, D., Donner, R. V., Menon,
A., Perrette, M., Rehfeld, K., Robinson, A., Rocha, M., Schaeffer, M., Schwan, S., Serdeczny, O.,
Svirejeva-Hopkins, A. 2017. Climatic risks and impacts in South Asia: Extremes of water scarcity
and excess. Regional Environmental Change 17 (6): 1569-83.
Wagha, W. 2012. Country technical note on indigenous peoples’ issues: Islamic Republic of Pakistan.
Rome: IFAD.
Wassmann, R., Jagadish, S. V. K., Heuer, S., Ismail, A., Redona, E., Serraj, R., Singh, R. K., Howell,
G., Pathak, H., Sumfleth, K. 2009a. Climate change affecting rice production: The physiological
and agronomic basis for possible adaptation strategies. In Advances in Agronomy, Vol. 101:
59-122. Burlington, MA: Academic Press.
Wassmann, R., Jagadish, S. V. K., Sumfleth, K., Pathak, H., Howell, G., Ismail, A., Serraj, R., Redona,
E., Singh, R. K., Heuer, S. 2009b. Regional vulnerability of climate change impacts on Asian rice
production and scope for adaptation. In Advances in Agronomy, Vol. 102: 91-133. Burlington,
MA: Academic Press.
WFO, 2012. Agriculture’s Contribution to the Green Economy: Proposed Outcomes from the Rio
+20 Summit. World Farmers’ Organization. Rome, Italy. http://www.uncsd2012.org/content/
documents/Ag%20and%20the%20Green%20Economy.pdf.
Wheeler, D. 2011. Quantifying vulnerability to climate change: Implications for adaptation assistance.
Working Paper 240, January 2011. Washington, D.C.: Center for Global Development.
Wiberg, D., Satoh, Y., Burek, P., Fischer, G., Tramberend, S., Kahil, T., Florke, M., Eisner, S.. 2017.
Water futures and solutions: Asia 2050 (final report) – Knowledge and innovation support for the
water financing programme of the Asian Development Bank (RETA 6498). Laxenburg: International
Institute for Applied Systems Analysis.
164
Wiggins, S. and Keats, S. 2014. Rural wages in Asia. London: Overseas Development Institute. https://
www.odi.org/sites/odi.org.uk/files/odi-assets/publications-opinion-files/9186.pdf.
Williams, L. and Rota, A. 2010. Impact of climate change on fisheries and aquaculture in the developing
world and opportunities for adaptation. Rome: FAO.
Vollrath, T. L. (1991) ‘A theoretical evaluation of alternative trade intensity measures of revealed
comparative advantage’, Weltwirtschaftliches Archiv, 127(2), pp. 265-280. doi: 10.1007/
BF02707986.
WOCAT. 2007. Where the land is greener - case studies and analysis of soil and water conservation
initiatives worldwide. Labour. https://doi.org/978-92-9081-339-2.
World Bank. 2017a. World Development Indicators. http://data.worldbank.org/data-catalog/world-
development-indicators.
World Bank. 2017b. World Bank country and lending groups: World Bank data help desk. https://
datahelpdesk.worldbank.org/knowledgebase/articles/906519-world-bank-country-and-
lending-groups.
World Bank. 2017c. PovCalNet database. Available at: http://iresearch.worldbank.org/PovcalNet/
povOnDemand.aspx.
World Bank. 2016a. World Development Indicators. Washington, D.C.: World Bank.
World Bank. 2016b. The cost of fire : an economic analysis of Indonesia’s 2015 fire crisis (English).
Indonesia sustainable landscapes knowledge; note no. 1. Washington, D.C. : World Bank Group.
World Bank. 2014. Turn down the heat: Confronting the new climate normal. Washington, D.C.:
World Bank.
World Bank. 2013a. Annual freshwater withdrawals: Agriculture. Washington, D.C.: World Bank.
World Bank. 2013b. Turn down the heat: Climate extremes, regional impacts, and the case for resilience. A
report for the World Bank by the Potsdam Institute for Climate Impact Research and Climate Analytics.
Washington, D.C.: World Bank.
World Bank. 2010a. Economics of adaptation to climate change: Bangladesh. Washington, D.C.: World Bank.
World Bank. 2010b. Economics of adaptation to climate change: Vietnam. Washington, D.C.: World Bank.
World Bank. 2010c. Land reform, rural development, and poverty in the Philippines : revisiting the agenda.
Technical working paper. Washington, D.C.
World Bank. 2007. World development report 2008: Agriculture for development. Washington, D.C.:
World Bank.
World Bank. 2006. Revitalizing the rural economy: An assessment of the investment climate facing non-farm
enterpises at the district level. Jakarta: World Bank Office Jakarta.
World Research Institute (WRI). 2017. Data Beta database. Available at: http://datasets.wri.org/
dataset?q=energy.
Wunder, S. 2005. Payments for Environmental Services: Some Nuts and Bolts. Center for
International Forestry Research (CIFOR). Occasional Paper No. 42. www.cifor.org/ publications/
pdf_files/OccPapers/OP-42.pdf.
Yadav, P. K., Kapoor, M. and Sarma, K. 2012. Impact of slash-and-burn agriculture on forest ecosystem
in Garo Hills landscape of Meghalaya, North-East India. Journal of Biodiversity Management and
Forestry 1 (1): 1-6.
165
Young, A. 1997. Agroforestry for Soil Management. Wallingford, UK: CAB International (in
association with ICRAF, Nairobi, Kenya).
Yu, W. H., Alam, M., Hassan, A., Khan, A. S., Ruane, A. C., Rosenzweig, C., Major, D. C., Thurlow, J.
2010. Climate change risks and food security in Bangladesh. Washington, D.C.: World Bank.
Zhang, T., Zhu, J. and Wassmann, R. 2010. Responses of rice yields to recent climate change in
China: An empirical assessment based on long-term observations at different spatial scales
(1981-2005). Agricultural and Forest Meteorology 150 (7-8): 1128-37.
Zhang, X., Rashid, S., Ahmad, K., Mueller, V., Lee, H. K., Lemma, S., Belal, S., Akhter, A. 2013. Rising
wages in Bangladesh. IFPRI Discussion Paper (March). http://ebrary.ifpri.org/cdm/ref/collection/
p15738coll2/id/127427.
Zhuang, J., Kanbur, R. and Rhee, C. 2014. What drives Asia’s rising inequality? In Inequality in Asia
and the Pacific: Trends, drivers, and policy implications, ed. J. Zhuang, R. Kanbur and C. Rhee, 37-
57. Abingdon: ADB and Routledge. https://www.adb.org/sites/default/files/publication/41630/
inequality-asia-and-pacific.pdf#page=62.


ASIA AND THE PACIFIC DIVISION
AN OUTLOOK ON ASIA’S AGRICULTURAL AND RURAL TRANSFORMATIONProspects and options for making it an inclusive and sustainable one
International Fund for Agricultura l Development
Via Paolo di Dono, 44 - 00142 Rome, Italy
Tel: +39 06 54591 - Fax: +39 06 5043463
Email: [email protected]
www.ifad.org
twitter.com/ifad
youtube.com/user/ifadTV
facebook. com/ifad
instagram. com/ifadnews
linkedin.com/company/ifad