an overview of brazil's balance of payment
TRANSCRIPT
No 667 ISSN 0104-8910
An Overview of Brazil’s Balance of Payment
Rubens Penha Cysne, Paulo Gustavo Grahl
Janeiro de 2008

Os artigos publicados são de inteira responsabilidade de seus autores. As opiniões
neles emitidas não exprimem, necessariamente, o ponto de vista da Fundação
Getulio Vargas.
1
An Overview of Brazil’s Balance of Payment
Rubens Penha Cysne1
Paulo Gustavo Grahl2
1 Getulio Vargas Foundation 2 Getulio Vargas Foundation This work benefited from research assistance of Guilherme Babo Torres and Felipe Balassiano. It derives from the book “Brasil: Uma Análise das Contas Externas”, by the same authors. The book has been last revised in June of 2007 and is based on data available until January of 2007. The authors have not revised the translation to English.

2
1 - Brazil’s Current Account Transactions
Brazil’s balance of payments has been calculated since 2001 in accordance with criteria suggested in the 5
th edition of the International Monetary Fund’s Balance of Payments
Manual (BPM5)3[7]. The Balance of Payments account can be divided into two groups: (i) current account transactions and (ii) the capital and financial account. The current account includes transactions arising from trade in goods and services and remuneration for factors of production (such as interest and dividends). The capital and financial account includes private capital (direct investments, credits to buyers and suppliers, debt securities, etc.), the error and omissions account and compensatory capital (international reserves, exceptional debt financing2 and arrears). In this section and in the next we present a more detailed view of recent behavior in current account transactions and the capital and financial account, respectively.
Current account transactions represents the sum of the net values of:
● Balance on goods
● Services
● Income
● Current Unilateral Transfers
The balance on goods is the result of the monetary difference between exports and imports of goods. Exports and imports are calculated using their FOB (Free on Board) values, meaning the amounts without including international costs with transportation and insurance which are included in the services account. The services account is the net result from income and expenses with the following services: transportation, international travel, insurance, governmental services, financial services, computer and information services, royalties and concessions, rental of equipment and other services (in communication, construction, trade related, management, professional and technical, personal, culture and recreation, miscellaneous)
4. The heading income represents the
sum of income and expenses with: salaries and wages (remuneration for work), profit and dividends (remuneration for risk capital), and interest (remuneration for loan capital). Current unilateral transfers accounts for transfers of any kind (currency or merchandise) between residents and non-residents of an economy that have no counter entry (financial or not) on the part of the beneficiary. The most important of these, as we saw earlier, are transfers made by migrants (remittances from workers).
The balance of current account transactions or current accounts balance is the total of the net results from the items mentioned above.
As can be observed in Illustration 1, for the fourth consecutive year Brazil has recorded a surplus in current account transactions, after ten straight years of deficits (1993-2002).
3 The data is published monthly by the Central Bank of Brazil (BCB). 4 Loans obtained from international financial institutions (the International Monetary Fund, for example) for the purpose of solving problems with the country’s balance of payments.

3
Illustration 1: Composition of Current Account Transactions Balance
Composition of Currente Account Transactions Balance
-60
-40
-20
0
20
40
60
1990 1991 1992 1993 1994 1995 1996 1997 1998 1999 2000 2001 2002 2003 2004 2005 2006
US$ billions
-6%
-4%
-2%
0%
2%
4%
6%
% of GDP
Balance on Goods Unilateral Transfers
Services Income
Current Account Transactions
Source: Central Bank, compiled for this study; 2006 for the months ending in September.
The reader should note that a current account deficit in the balance of payments manifests itself in an excess of absorption (consumption plus investment) in the gross national product at market prices or, equivalently, an excess in total investments by the economy in internal savings. This being stated, it can be concluded that Brazil, over the last few years, has been saving for the rest of the world, resulting in a reduction in its net external liability solely in regard to transactions between residents and non-residents.
The important point to be observed, from an economic policy perspective, is whether this negative external savings represented by the positive balance in the current account in recent years is good from the point of view of intertemporal allocation of consumption. This then becomes a point for empirical investigation, for which there are techniques available in the literature. Given the relationship that exists between current account deficits and an increase in net external liability in an economy, the question can be put another way: to understand whether or not the trend forecast for net external liability will be good from an economic perspective.
Part of the reversal in the current account balance observed as of 1999 can be attributed directly and indirectly to the devaluation of the real currency exchange rate that occurred in 1999 and, once again, in 2002. Another part reflects an upward movement in external demand for Brazilian exports, which has been related to (i) a general increase in the prices of commodities and (ii) a strong wave of expansion in world trade.
According to calculations by FUNCEX5, the real currency exchange rate for Brazil vis-à-vis a basket of 13 currencies (made up of the country’s principal trading partners6) and corrected for inflation using the consumer price index, underwent a depreciation of 36%
5 Fundação Centro de Estudos do Comércio Exterior [Center for Foreign Trade Studies Foundation] (www.funcex.com.br) 6 The countries and their respective weighting (in parenthesis): Argentina (10.8%), Canada (1.8), Chile (3.2), China (7.7), South Korea (2.7), The United States (28.0), Japan (5.1), Mexico (3.9), Paraguay (1.1), The United Kingdom (3.2), Russia (2.2), Uruguay (1.0), The Euro Zone (29.3).
4
in 1999 as compared to 19987 (comparing the real exchange rates in December of each year) and of 24% in 2002, as compared to 2001 in the same comparison. In terms of annual averages, Brazil’s real currency exchange rate depreciated 50% in 1999, accompanied by a modest appreciation in 2000 (7%), and an additional depreciation of 19% in 2001, followed by relative stability between 2002 and 2004. Thus, during the year of 2004, the real currency exchange rate hovered at a point representing a depreciation of around 66%, on the average, compared to the average for 1998.
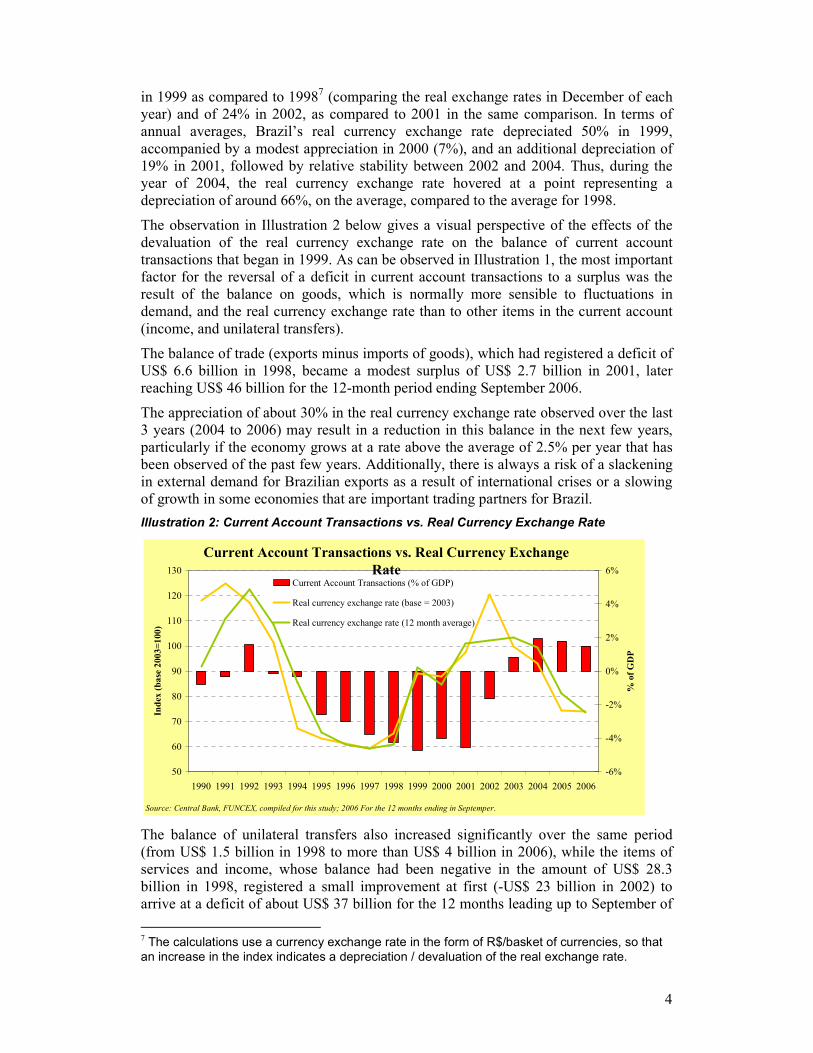
The observation in Illustration 2 below gives a visual perspective of the effects of the devaluation of the real currency exchange rate on the balance of current account transactions that began in 1999. As can be observed in Illustration 1, the most important factor for the reversal of a deficit in current account transactions to a surplus was the result of the balance on goods, which is normally more sensible to fluctuations in demand, and the real currency exchange rate than to other items in the current account (income, and unilateral transfers).
The balance of trade (exports minus imports of goods), which had registered a deficit of US$ 6.6 billion in 1998, became a modest surplus of US$ 2.7 billion in 2001, later reaching US$ 46 billion for the 12-month period ending September 2006.
The appreciation of about 30% in the real currency exchange rate observed over the last 3 years (2004 to 2006) may result in a reduction in this balance in the next few years, particularly if the economy grows at a rate above the average of 2.5% per year that has been observed of the past few years. Additionally, there is always a risk of a slackening in external demand for Brazilian exports as a result of international crises or a slowing of growth in some economies that are important trading partners for Brazil.
Illustration 2: Current Account Transactions vs. Real Currency Exchange Rate
Current Account Transactions vs. Real Currency Exchange
Rate
50
60
70
80
90
100
110
120
130
1990 1991 1992 1993 1994 1995 1996 1997 1998 1999 2000 2001 2002 2003 2004 2005 2006
Index (base 2003=100)
-6%
-4%
-2%
0%
2%
4%
6%
% of GDP
Current Account Transactions (% of GDP)
Real currency exchange rate (base = 2003)
Real currency exchange rate (12 month average)
Source: Central Bank, FUNCEX, compiled for this study; 2006 For the 12 months ending in Septemper.
The balance of unilateral transfers also increased significantly over the same period (from US$ 1.5 billion in 1998 to more than US$ 4 billion in 2006), while the items of services and income, whose balance had been negative in the amount of US$ 28.3 billion in 1998, registered a small improvement at first (-US$ 23 billion in 2002) to arrive at a deficit of about US$ 37 billion for the 12 months leading up to September of
7 The calculations use a currency exchange rate in the form of R$/basket of currencies, so that an increase in the index indicates a depreciation / devaluation of the real exchange rate.
5
2006. Part of this increase in the services and income account can be attributed to, among other things, (i) an increase in interest expense, (ii) an increase in trade volume (exports + imports), leading to an increase in expenses with freight and insurance, and (iii) increase in remittances of profit and dividends, reflecting an increase in the level of foreign investment in the country.
In addition to the effect of the real currency exchange rate on the result for the balance of trade, as we have seen, it is necessary to emphasize the importance of (i) the general increase in commodity prices and (ii) a strong wave of expansion in world trade in recent years. It is important to continuously monitor these two influences which, apparently, are partially neutralizing the effect of the appreciation of the real currency exchange rate observed over the last two or three years.
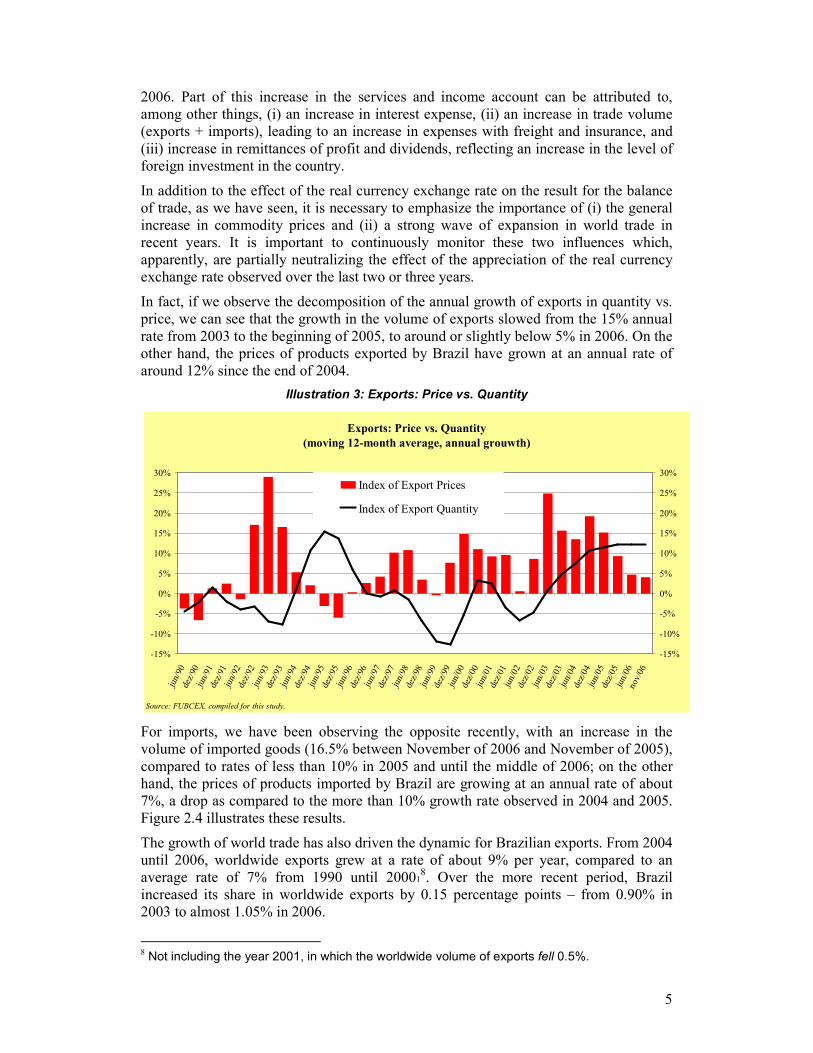
In fact, if we observe the decomposition of the annual growth of exports in quantity vs. price, we can see that the growth in the volume of exports slowed from the 15% annual rate from 2003 to the beginning of 2005, to around or slightly below 5% in 2006. On the other hand, the prices of products exported by Brazil have grown at an annual rate of around 12% since the end of 2004.
Illustration 3: Exports: Price vs. Quantity
Exports: Price vs. Quantity
(moving 12-month average, annual grouwth)
-15%
-10%
-5%
0%
5%
10%
15%
20%
25%
30%
jun/90
dez/90
jun/91
dez/91
jun/92
dez/92
jun/93
dez/93
jun/94
dez/94
jun/95
dez/95
jun/96
dez/96
jun/97
dez/97
jun/98
dez/98
jun/99
dez/99
jun/00
dez/00
jun/01
dez/01
jun/02
dez/02
jun/03
dez/03
jun/04
dez/04
jun/05
dez/05
jun/06
nov/06
-15%
-10%
-5%
0%
5%
10%
15%
20%
25%
30%
Index of Export Prices
Index of Export Quantity
Source: FUBCEX, compiled for this study.
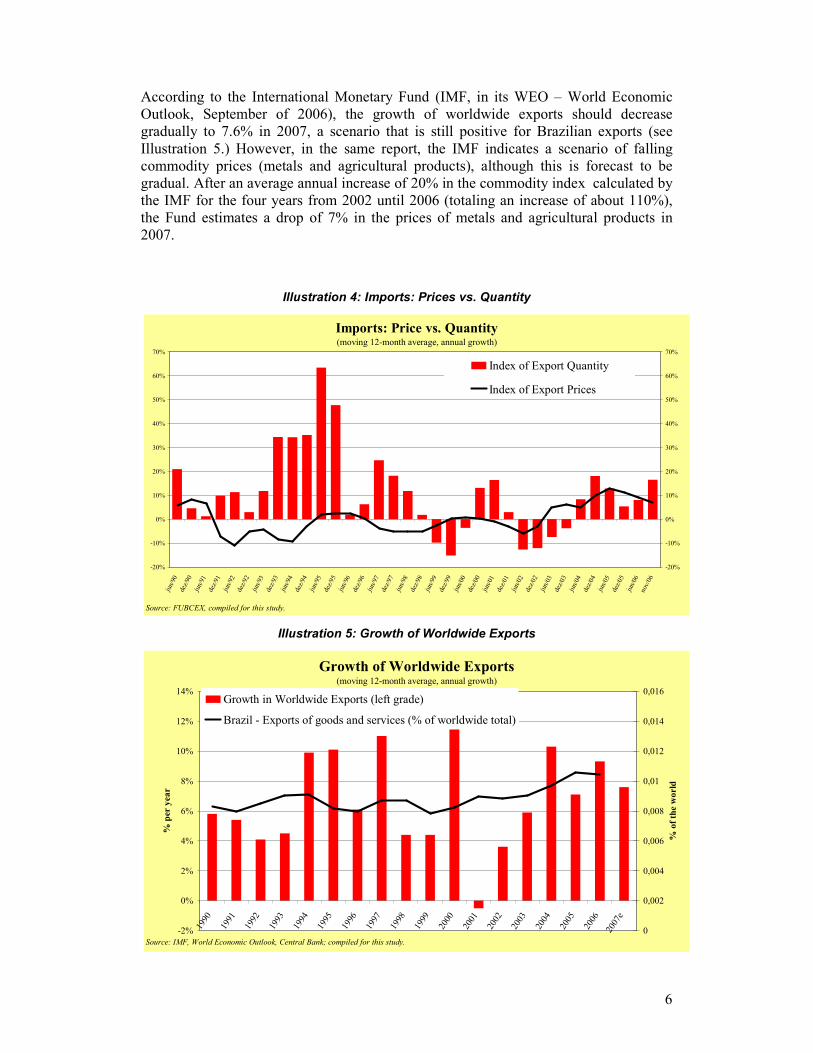
For imports, we have been observing the opposite recently, with an increase in the volume of imported goods (16.5% between November of 2006 and November of 2005), compared to rates of less than 10% in 2005 and until the middle of 2006; on the other hand, the prices of products imported by Brazil are growing at an annual rate of about 7%, a drop as compared to the more than 10% growth rate observed in 2004 and 2005. Figure 2.4 illustrates these results.
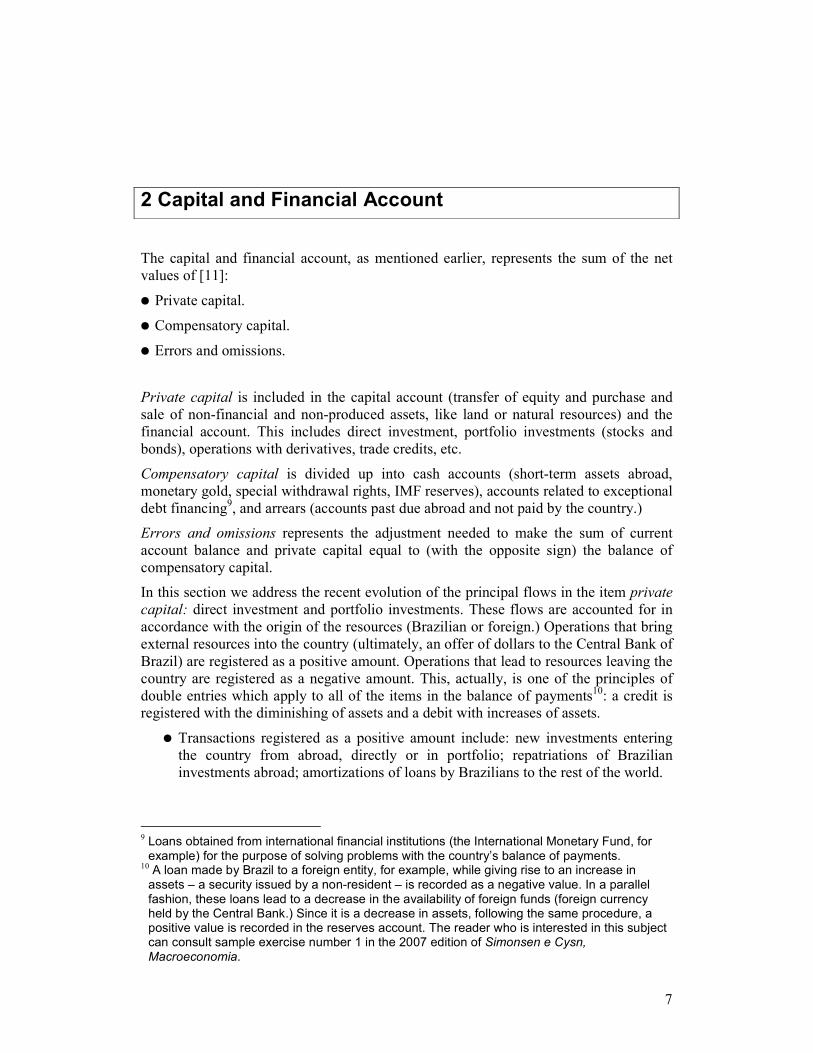
The growth of world trade has also driven the dynamic for Brazilian exports. From 2004 until 2006, worldwide exports grew at a rate of about 9% per year, compared to an average rate of 7% from 1990 until 20001
8. Over the more recent period, Brazil increased its share in worldwide exports by 0.15 percentage points – from 0.90% in 2003 to almost 1.05% in 2006.
8 Not including the year 2001, in which the worldwide volume of exports fell 0.5%.
6
According to the International Monetary Fund (IMF, in its WEO – World Economic Outlook, September of 2006), the growth of worldwide exports should decrease gradually to 7.6% in 2007, a scenario that is still positive for Brazilian exports (see Illustration 5.) However, in the same report, the IMF indicates a scenario of falling commodity prices (metals and agricultural products), although this is forecast to be gradual. After an average annual increase of 20% in the commodity index calculated by the IMF for the four years from 2002 until 2006 (totaling an increase of about 110%), the Fund estimates a drop of 7% in the prices of metals and agricultural products in 2007.
Illustration 4: Imports: Prices vs. Quantity
Imports: Price vs. Quantity(moving 12-month average, annual growth)
-20%
-10%
0%
10%
20%
30%
40%
50%
60%
70%
jun/90
dez/90
jun/91
dez/91
jun/92
dez/92
jun/93
dez/93
jun/94
dez/94
jun/95
dez/95
jun/96
dez/96
jun/97
dez/97
jun/98
dez/98
jun/99
dez/99
jun/00
dez/00
jun/01
dez/01
jun/02
dez/02
jun/03
dez/03
jun/04
dez/04
jun/05
dez/05
jun/06
nov/06
-20%
-10%
0%
10%
20%
30%
40%
50%
60%
70%
Index of Export Quantity
Index of Export Prices
Source: FUBCEX, compiled for this study.
Illustration 5: Growth of Worldwide Exports
Growth of Worldwide Exports(moving 12-month average, annual growth)
-2%
0%
2%
4%
6%
8%
10%
12%
14%
1990
1991
1992
1993
1994
1995
1996
1997
1998
1999
2000
2001
2002
2003
2004
2005
2006
2007e
% per year
0
0,002
0,004
0,006
0,008
0,01
0,012
0,014
0,016
% of the world
Growth in Worldwide Exports (left grade)
Brazil - Exports of goods and services (% of worldwide total)
Source: IMF, World Economic Outlook, Central Bank; compiled for this study.
7
2 Capital and Financial Account
The capital and financial account, as mentioned earlier, represents the sum of the net values of [11]:
● Private capital.
● Compensatory capital.
● Errors and omissions.
Private capital is included in the capital account (transfer of equity and purchase and sale of non-financial and non-produced assets, like land or natural resources) and the financial account. This includes direct investment, portfolio investments (stocks and bonds), operations with derivatives, trade credits, etc.
Compensatory capital is divided up into cash accounts (short-term assets abroad, monetary gold, special withdrawal rights, IMF reserves), accounts related to exceptional debt financing9, and arrears (accounts past due abroad and not paid by the country.)
Errors and omissions represents the adjustment needed to make the sum of current account balance and private capital equal to (with the opposite sign) the balance of compensatory capital.
In this section we address the recent evolution of the principal flows in the item private
capital: direct investment and portfolio investments. These flows are accounted for in accordance with the origin of the resources (Brazilian or foreign.) Operations that bring external resources into the country (ultimately, an offer of dollars to the Central Bank of Brazil) are registered as a positive amount. Operations that lead to resources leaving the country are registered as a negative amount. This, actually, is one of the principles of double entries which apply to all of the items in the balance of payments10: a credit is registered with the diminishing of assets and a debit with increases of assets.
● Transactions registered as a positive amount include: new investments entering the country from abroad, directly or in portfolio; repatriations of Brazilian investments abroad; amortizations of loans by Brazilians to the rest of the world.
9 Loans obtained from international financial institutions (the International Monetary Fund, for example) for the purpose of solving problems with the country’s balance of payments.
10 A loan made by Brazil to a foreign entity, for example, while giving rise to an increase in assets – a security issued by a non-resident – is recorded as a negative value. In a parallel fashion, these loans lead to a decrease in the availability of foreign funds (foreign currency held by the Central Bank.) Since it is a decrease in assets, following the same procedure, a positive value is recorded in the reserves account. The reader who is interested in this subject can consult sample exercise number 1 in the 2007 edition of Simonsen e Cysn, Macroeconomia.
8
● Transactions registered as a negative amount include: direct or portfolio investments made by Brazilians in external markets; new loans made by Brazilians abroad; amortizations of loans contracted by Brazilians from foreign sources; repatriations of foreign investments.
In this manner, for example, a negative (positive) balance of Brazilian direct investments represents an exit (repatriation) of dollars
11. On the other hand, a negative
(positive) balance of foreign direct investments represents repatriation (entrance) of investments from non-residents. In both cases, a value that is positive (negative) represents the entrance (exit) of net dollars for the country12.
2.1 Foreign Investment: in Portfolio
And Direct
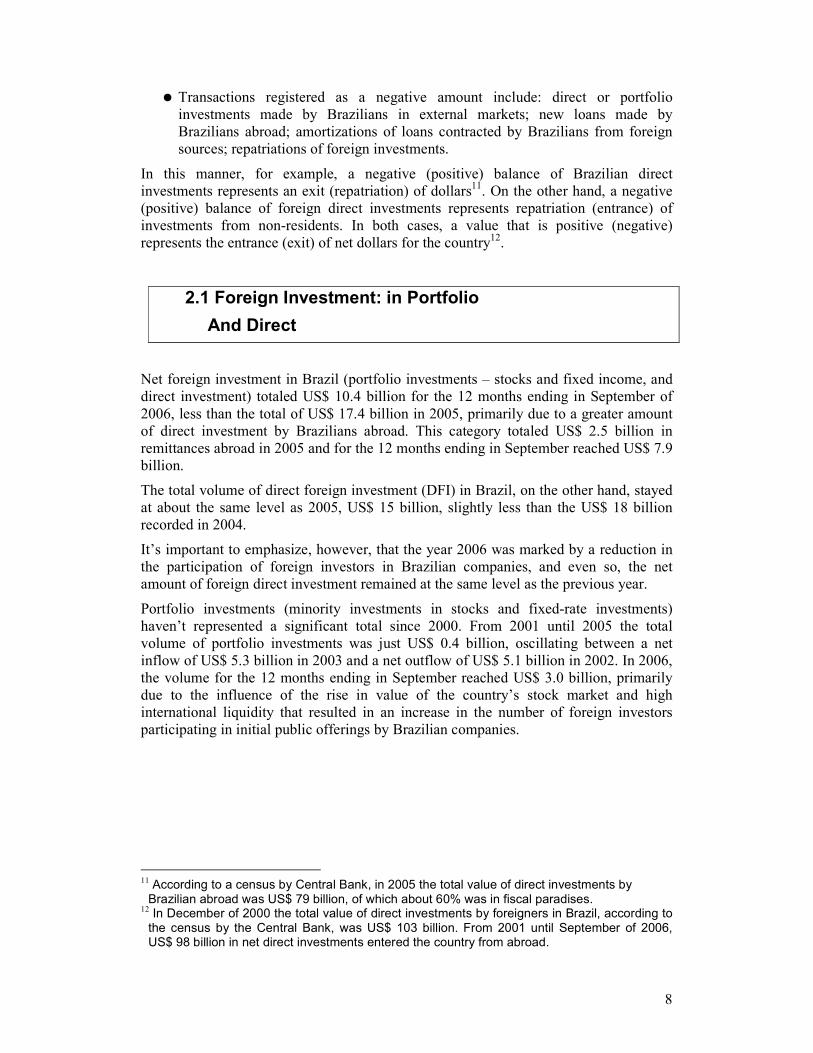
Net foreign investment in Brazil (portfolio investments – stocks and fixed income, and direct investment) totaled US$ 10.4 billion for the 12 months ending in September of 2006, less than the total of US$ 17.4 billion in 2005, primarily due to a greater amount of direct investment by Brazilians abroad. This category totaled US$ 2.5 billion in remittances abroad in 2005 and for the 12 months ending in September reached US$ 7.9 billion.
The total volume of direct foreign investment (DFI) in Brazil, on the other hand, stayed at about the same level as 2005, US$ 15 billion, slightly less than the US$ 18 billion recorded in 2004.
It’s important to emphasize, however, that the year 2006 was marked by a reduction in the participation of foreign investors in Brazilian companies, and even so, the net amount of foreign direct investment remained at the same level as the previous year.
Portfolio investments (minority investments in stocks and fixed-rate investments) haven’t represented a significant total since 2000. From 2001 until 2005 the total volume of portfolio investments was just US$ 0.4 billion, oscillating between a net inflow of US$ 5.3 billion in 2003 and a net outflow of US$ 5.1 billion in 2002. In 2006, the volume for the 12 months ending in September reached US$ 3.0 billion, primarily due to the influence of the rise in value of the country’s stock market and high international liquidity that resulted in an increase in the number of foreign investors participating in initial public offerings by Brazilian companies.
11 According to a census by Central Bank, in 2005 the total value of direct investments by Brazilian abroad was US$ 79 billion, of which about 60% was in fiscal paradises.
12 In December of 2000 the total value of direct investments by foreigners in Brazil, according to the census by the Central Bank, was US$ 103 billion. From 2001 until September of 2006, US$ 98 billion in net direct investments entered the country from abroad.
9
Illustration 6: Foreign Investments
Foreign Investments (direct and portfolio)
-20
-10
0
10
20
30
40
50
60
1990 1991 1992 1993 1994 1995 1996 1997 1998 1999 2000 2001 2002 2003 2004 2005 2006
US$ billions
Portfolio Investmet (Foreign)
Portfolio Investmet (Brazilian)
Direct Investment (Brazilian)
Direct Investment (Portfolio)
Source: Central Bank; compiled for this study; 2006 for the 12 months ending in September.
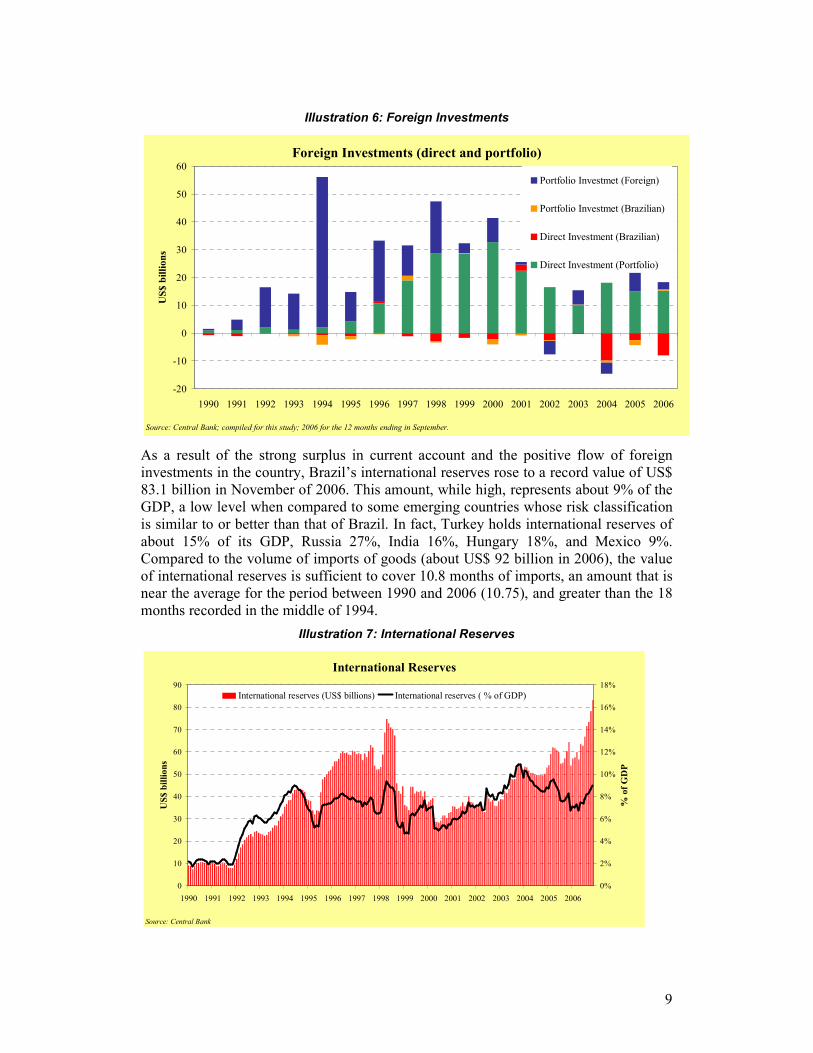
As a result of the strong surplus in current account and the positive flow of foreign investments in the country, Brazil’s international reserves rose to a record value of US$ 83.1 billion in November of 2006. This amount, while high, represents about 9% of the GDP, a low level when compared to some emerging countries whose risk classification is similar to or better than that of Brazil. In fact, Turkey holds international reserves of about 15% of its GDP, Russia 27%, India 16%, Hungary 18%, and Mexico 9%. Compared to the volume of imports of goods (about US$ 92 billion in 2006), the value of international reserves is sufficient to cover 10.8 months of imports, an amount that is near the average for the period between 1990 and 2006 (10.75), and greater than the 18 months recorded in the middle of 1994.
Illustration 7: International Reserves
International Reserves
0
10
20
30
40
50
60
70
80
90
1990 1991 1992 1993 1994 1995 1996 1997 1998 1999 2000 2001 2002 2003 2004 2005 2006
US$ billions
0%
2%
4%
6%
8%
10%
12%
14%
16%
18%
% of GDP
International reserves (US$ billions) International reserves ( % of GDP)
Source: Central Bank
10
2.2 Direct investment
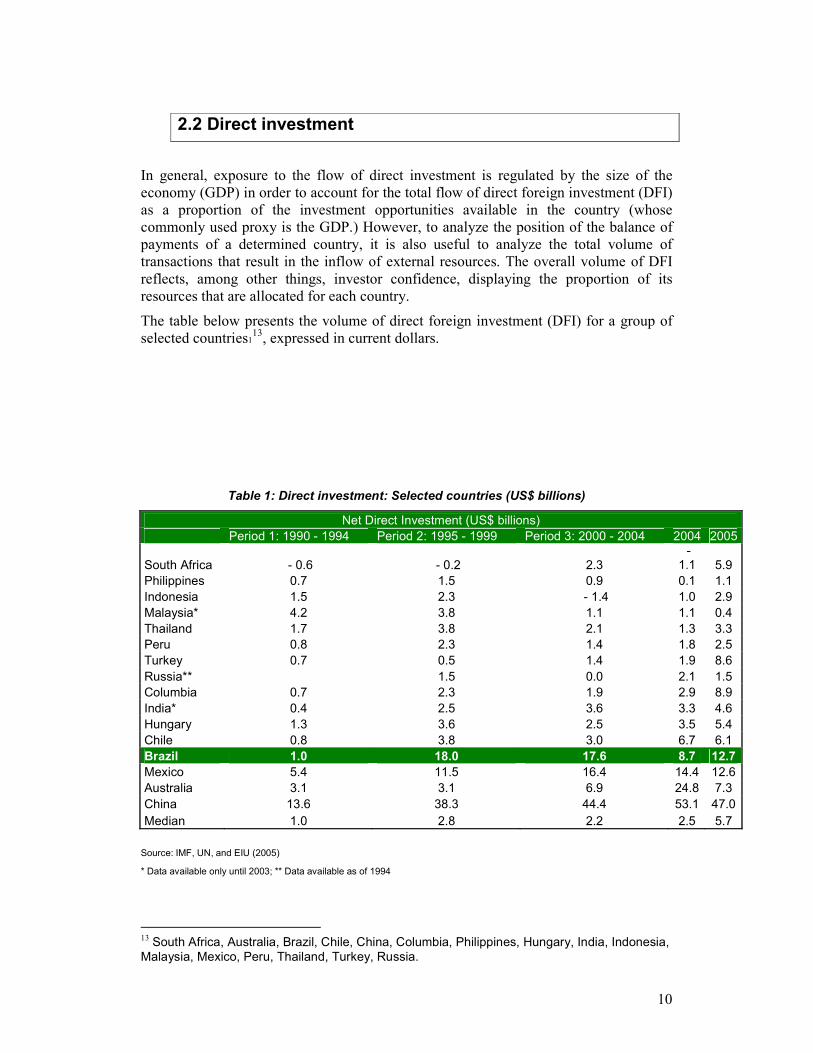
In general, exposure to the flow of direct investment is regulated by the size of the economy (GDP) in order to account for the total flow of direct foreign investment (DFI) as a proportion of the investment opportunities available in the country (whose commonly used proxy is the GDP.) However, to analyze the position of the balance of payments of a determined country, it is also useful to analyze the total volume of transactions that result in the inflow of external resources. The overall volume of DFI reflects, among other things, investor confidence, displaying the proportion of its resources that are allocated for each country.
The table below presents the volume of direct foreign investment (DFI) for a group of selected countries113, expressed in current dollars.
Table 1: Direct investment: Selected countries (US$ billions)
Net Direct Investment (US$ billions)
Period 1: 1990 - 1994 Period 2: 1995 - 1999 Period 3: 2000 - 2004 2004 2005
South Africa - 0.6 - 0.2 2.3 - 1.1 5.9
Philippines 0.7 1.5 0.9 0.1 1.1
Indonesia 1.5 2.3 - 1.4 1.0 2.9
Malaysia* 4.2 3.8 1.1 1.1 0.4
Thailand 1.7 3.8 2.1 1.3 3.3
Peru 0.8 2.3 1.4 1.8 2.5
Turkey 0.7 0.5 1.4 1.9 8.6
Russia** 1.5 0.0 2.1 1.5
Columbia 0.7 2.3 1.9 2.9 8.9
India* 0.4 2.5 3.6 3.3 4.6
Hungary 1.3 3.6 2.5 3.5 5.4
Chile 0.8 3.8 3.0 6.7 6.1
Brazil 1.0 18.0 17.6 8.7 12.7
Mexico 5.4 11.5 16.4 14.4 12.6
Australia 3.1 3.1 6.9 24.8 7.3
China 13.6 38.3 44.4 53.1 47.0
Median 1.0 2.8 2.2 2.5 5.7
Source: IMF, UN, and EIU (2005)
* Data available only until 2003; ** Data available as of 1994
13 South Africa, Australia, Brazil, Chile, China, Columbia, Philippines, Hungary, India, Indonesia, Malaysia, Mexico, Peru, Thailand, Turkey, Russia.
11
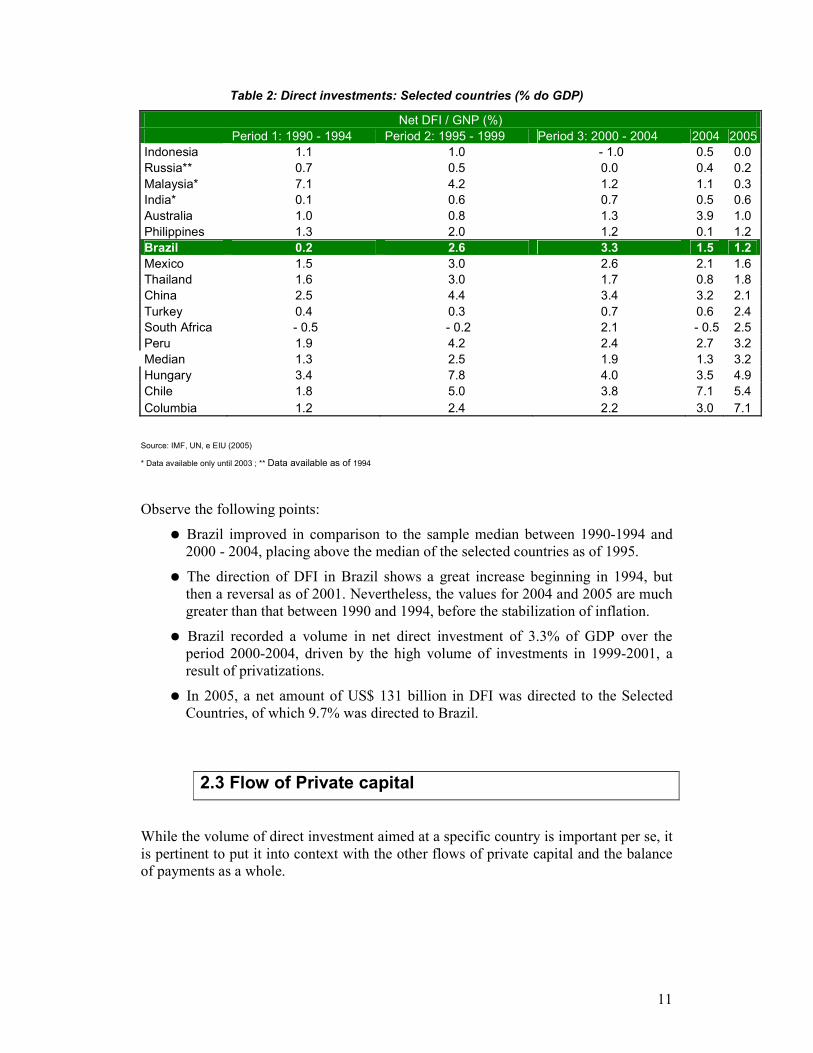
Table 2: Direct investments: Selected countries (% do GDP)
Net DFI / GNP (%)
Period 1: 1990 - 1994 Period 2: 1995 - 1999 Period 3: 2000 - 2004 2004 2005
Indonesia 1.1 1.0 - 1.0 0.5 0.0
Russia** 0.7 0.5 0.0 0.4 0.2
Malaysia* 7.1 4.2 1.2 1.1 0.3
India* 0.1 0.6 0.7 0.5 0.6
Australia 1.0 0.8 1.3 3.9 1.0
Philippines 1.3 2.0 1.2 0.1 1.2
Brazil 0.2 2.6 3.3 1.5 1.2
Mexico 1.5 3.0 2.6 2.1 1.6
Thailand 1.6 3.0 1.7 0.8 1.8
China 2.5 4.4 3.4 3.2 2.1
Turkey 0.4 0.3 0.7 0.6 2.4
South Africa - 0.5 - 0.2 2.1 - 0.5 2.5
Peru 1.9 4.2 2.4 2.7 3.2
Median 1.3 2.5 1.9 1.3 3.2
Hungary 3.4 7.8 4.0 3.5 4.9
Chile 1.8 5.0 3.8 7.1 5.4
Columbia 1.2 2.4 2.2 3.0 7.1
Source: IMF, UN, e EIU (2005)
* Data available only until 2003 ; ** Data available as of 1994
Observe the following points:
● Brazil improved in comparison to the sample median between 1990-1994 and 2000 - 2004, placing above the median of the selected countries as of 1995.
● The direction of DFI in Brazil shows a great increase beginning in 1994, but then a reversal as of 2001. Nevertheless, the values for 2004 and 2005 are much greater than that between 1990 and 1994, before the stabilization of inflation.
● Brazil recorded a volume in net direct investment of 3.3% of GDP over the period 2000-2004, driven by the high volume of investments in 1999-2001, a result of privatizations.
● In 2005, a net amount of US$ 131 billion in DFI was directed to the Selected Countries, of which 9.7% was directed to Brazil.
2.3 Flow of Private capital
While the volume of direct investment aimed at a specific country is important per se, it is pertinent to put it into context with the other flows of private capital and the balance of payments as a whole.
12
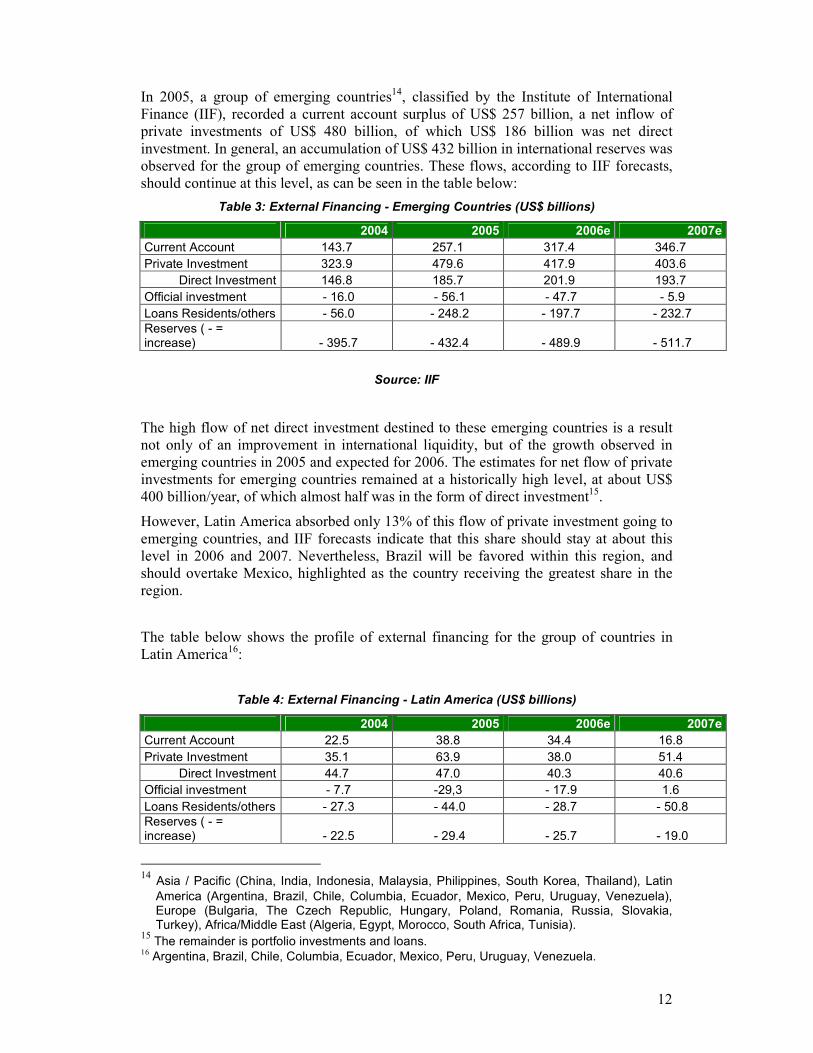
In 2005, a group of emerging countries14, classified by the Institute of International Finance (IIF), recorded a current account surplus of US$ 257 billion, a net inflow of private investments of US$ 480 billion, of which US$ 186 billion was net direct investment. In general, an accumulation of US$ 432 billion in international reserves was observed for the group of emerging countries. These flows, according to IIF forecasts, should continue at this level, as can be seen in the table below:
Table 3: External Financing - Emerging Countries (US$ billions)
2004 2005 2006e 2007e
Current Account 143.7 257.1 317.4 346.7
Private Investment 323.9 479.6 417.9 403.6
Direct Investment 146.8 185.7 201.9 193.7
Official investment - 16.0 - 56.1 - 47.7 - 5.9
Loans Residents/others - 56.0 - 248.2 - 197.7 - 232.7 Reserves ( - = increase) - 395.7 - 432.4 - 489.9 - 511.7
Source: IIF
The high flow of net direct investment destined to these emerging countries is a result not only of an improvement in international liquidity, but of the growth observed in emerging countries in 2005 and expected for 2006. The estimates for net flow of private investments for emerging countries remained at a historically high level, at about US$ 400 billion/year, of which almost half was in the form of direct investment15.
However, Latin America absorbed only 13% of this flow of private investment going to emerging countries, and IIF forecasts indicate that this share should stay at about this level in 2006 and 2007. Nevertheless, Brazil will be favored within this region, and should overtake Mexico, highlighted as the country receiving the greatest share in the region.
The table below shows the profile of external financing for the group of countries in Latin America16:
Table 4: External Financing - Latin America (US$ billions)
2004 2005 2006e 2007e
Current Account 22.5 38.8 34.4 16.8
Private Investment 35.1 63.9 38.0 51.4
Direct Investment 44.7 47.0 40.3 40.6
Official investment - 7.7 -29,3 - 17.9 1.6
Loans Residents/others - 27.3 - 44.0 - 28.7 - 50.8 Reserves ( - = increase) - 22.5 - 29.4 - 25.7 - 19.0
14 Asia / Pacific (China, India, Indonesia, Malaysia, Philippines, South Korea, Thailand), Latin America (Argentina, Brazil, Chile, Columbia, Ecuador, Mexico, Peru, Uruguay, Venezuela), Europe (Bulgaria, The Czech Republic, Hungary, Poland, Romania, Russia, Slovakia, Turkey), Africa/Middle East (Algeria, Egypt, Morocco, South Africa, Tunisia).
15 The remainder is portfolio investments and loans.
16 Argentina, Brazil, Chile, Columbia, Ecuador, Mexico, Peru, Uruguay, Venezuela.
13
Source: IIF
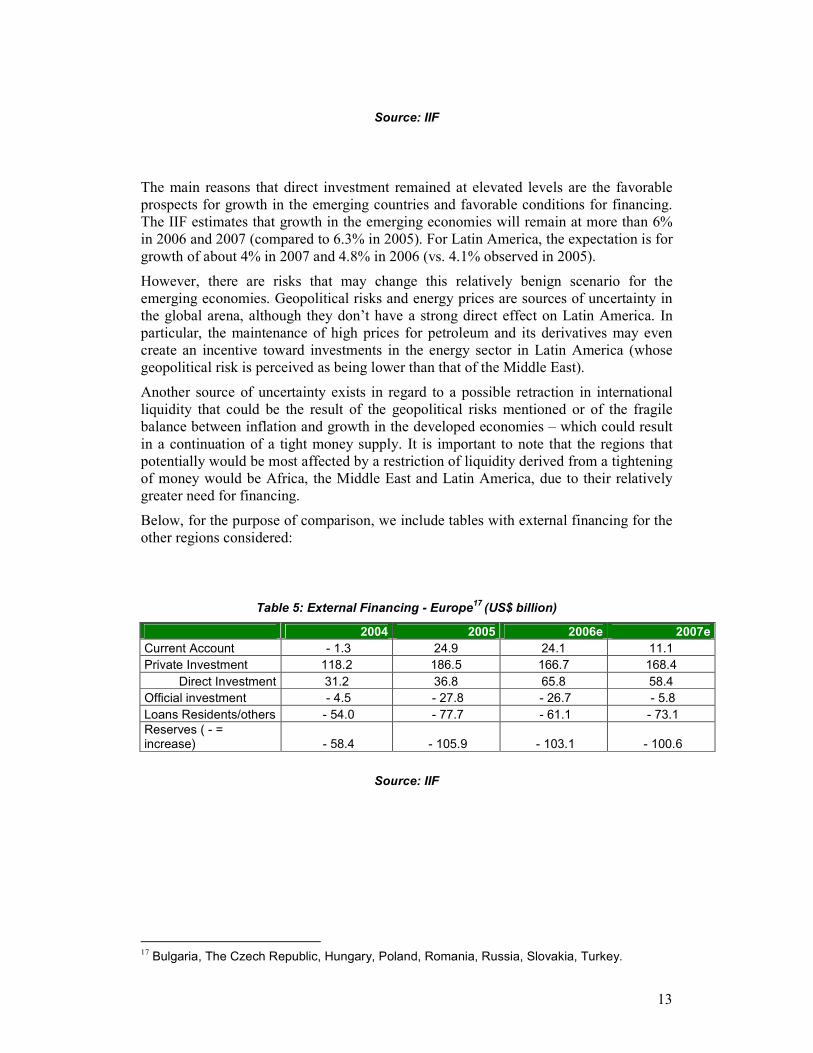
The main reasons that direct investment remained at elevated levels are the favorable prospects for growth in the emerging countries and favorable conditions for financing. The IIF estimates that growth in the emerging economies will remain at more than 6% in 2006 and 2007 (compared to 6.3% in 2005). For Latin America, the expectation is for growth of about 4% in 2007 and 4.8% in 2006 (vs. 4.1% observed in 2005).
However, there are risks that may change this relatively benign scenario for the emerging economies. Geopolitical risks and energy prices are sources of uncertainty in the global arena, although they don’t have a strong direct effect on Latin America. In particular, the maintenance of high prices for petroleum and its derivatives may even create an incentive toward investments in the energy sector in Latin America (whose geopolitical risk is perceived as being lower than that of the Middle East).
Another source of uncertainty exists in regard to a possible retraction in international liquidity that could be the result of the geopolitical risks mentioned or of the fragile balance between inflation and growth in the developed economies – which could result in a continuation of a tight money supply. It is important to note that the regions that potentially would be most affected by a restriction of liquidity derived from a tightening of money would be Africa, the Middle East and Latin America, due to their relatively greater need for financing.
Below, for the purpose of comparison, we include tables with external financing for the other regions considered:
Table 5: External Financing - Europe17 (US$ billion)
2004 2005 2006e 2007e
Current Account - 1.3 24.9 24.1 11.1
Private Investment 118.2 186.5 166.7 168.4
Direct Investment 31.2 36.8 65.8 58.4
Official investment - 4.5 - 27.8 - 26.7 - 5.8
Loans Residents/others - 54.0 - 77.7 - 61.1 - 73.1 Reserves ( - = increase) - 58.4 - 105.9 - 103.1 - 100.6
Source: IIF
17 Bulgaria, The Czech Republic, Hungary, Poland, Romania, Russia, Slovakia, Turkey.
14
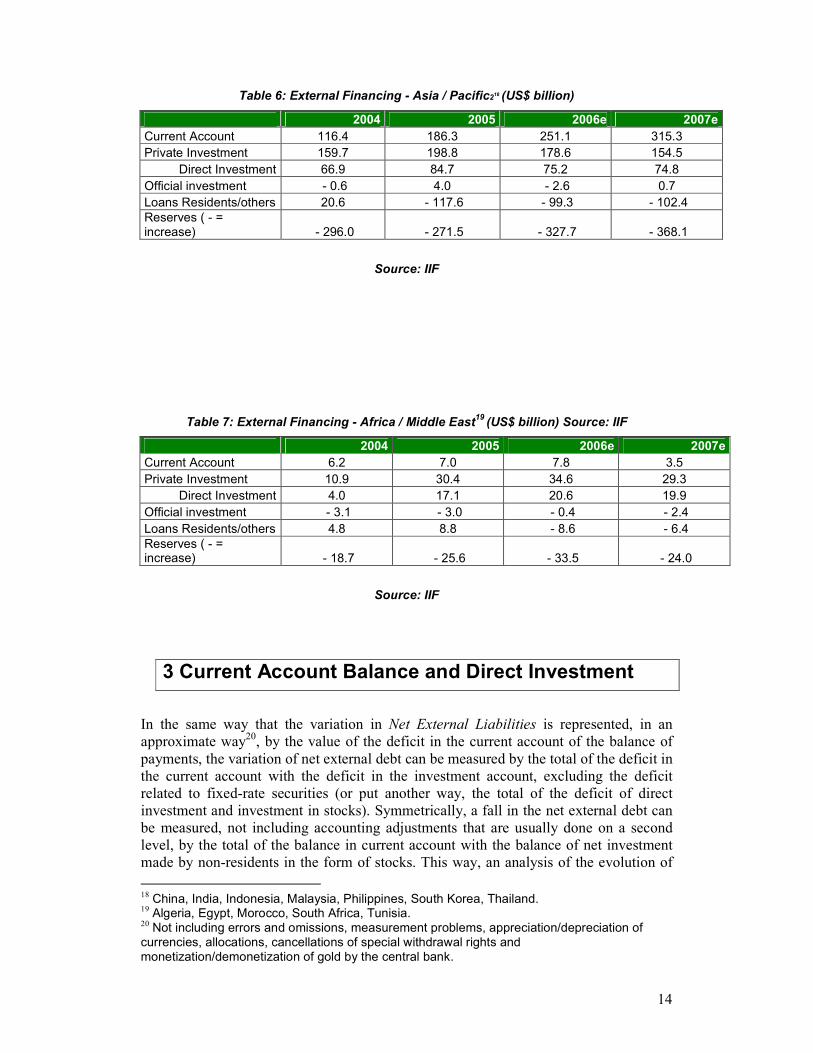
Table 6: External Financing - Asia / Pacific218 (US$ billion)
2004 2005 2006e 2007e
Current Account 116.4 186.3 251.1 315.3
Private Investment 159.7 198.8 178.6 154.5
Direct Investment 66.9 84.7 75.2 74.8
Official investment - 0.6 4.0 - 2.6 0.7
Loans Residents/others 20.6 - 117.6 - 99.3 - 102.4 Reserves ( - = increase) - 296.0 - 271.5 - 327.7 - 368.1
Source: IIF
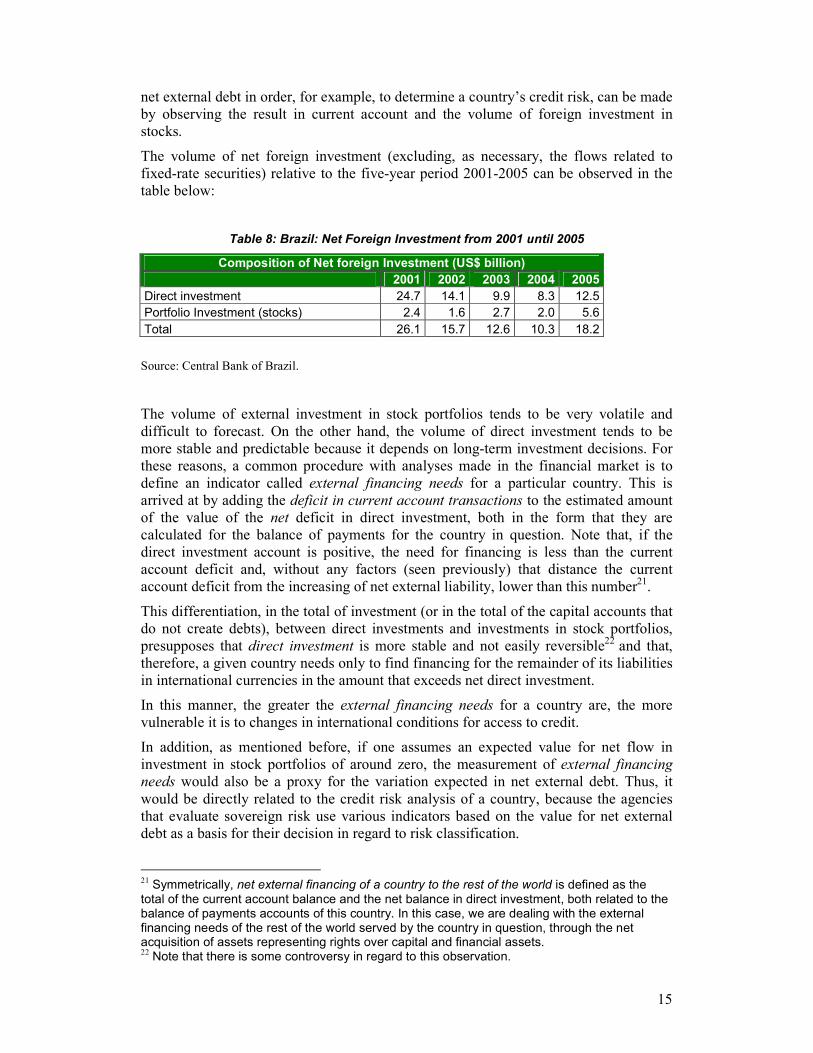
Table 7: External Financing - Africa / Middle East19 (US$ billion) Source: IIF
2004 2005 2006e 2007e
Current Account 6.2 7.0 7.8 3.5
Private Investment 10.9 30.4 34.6 29.3
Direct Investment 4.0 17.1 20.6 19.9
Official investment - 3.1 - 3.0 - 0.4 - 2.4
Loans Residents/others 4.8 8.8 - 8.6 - 6.4 Reserves ( - = increase) - 18.7 - 25.6 - 33.5 - 24.0
Source: IIF
3 Current Account Balance and Direct Investment
In the same way that the variation in Net External Liabilities is represented, in an approximate way20, by the value of the deficit in the current account of the balance of payments, the variation of net external debt can be measured by the total of the deficit in the current account with the deficit in the investment account, excluding the deficit related to fixed-rate securities (or put another way, the total of the deficit of direct investment and investment in stocks). Symmetrically, a fall in the net external debt can be measured, not including accounting adjustments that are usually done on a second level, by the total of the balance in current account with the balance of net investment made by non-residents in the form of stocks. This way, an analysis of the evolution of
18 China, India, Indonesia, Malaysia, Philippines, South Korea, Thailand. 19 Algeria, Egypt, Morocco, South Africa, Tunisia. 20 Not including errors and omissions, measurement problems, appreciation/depreciation of currencies, allocations, cancellations of special withdrawal rights and monetization/demonetization of gold by the central bank.
15
net external debt in order, for example, to determine a country’s credit risk, can be made by observing the result in current account and the volume of foreign investment in stocks.
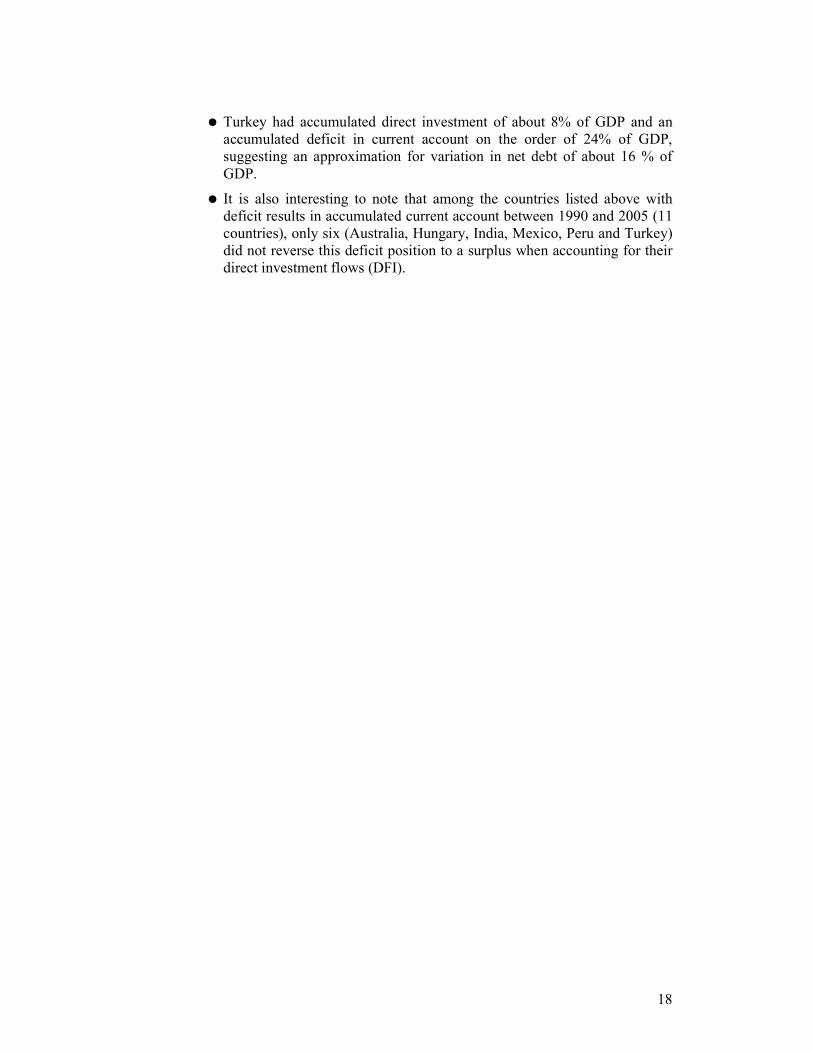
The volume of net foreign investment (excluding, as necessary, the flows related to fixed-rate securities) relative to the five-year period 2001-2005 can be observed in the table below:
Table 8: Brazil: Net Foreign Investment from 2001 until 2005
Composition of Net foreign Investment (US$ billion)
2001 2002 2003 2004 2005
Direct investment 24.7 14.1 9.9 8.3 12.5
Portfolio Investment (stocks) 2.4 1.6 2.7 2.0 5.6
Total 26.1 15.7 12.6 10.3 18.2
Source: Central Bank of Brazil.
The volume of external investment in stock portfolios tends to be very volatile and difficult to forecast. On the other hand, the volume of direct investment tends to be more stable and predictable because it depends on long-term investment decisions. For these reasons, a common procedure with analyses made in the financial market is to define an indicator called external financing needs for a particular country. This is arrived at by adding the deficit in current account transactions to the estimated amount of the value of the net deficit in direct investment, both in the form that they are calculated for the balance of payments for the country in question. Note that, if the direct investment account is positive, the need for financing is less than the current account deficit and, without any factors (seen previously) that distance the current account deficit from the increasing of net external liability, lower than this number21.
This differentiation, in the total of investment (or in the total of the capital accounts that do not create debts), between direct investments and investments in stock portfolios, presupposes that direct investment is more stable and not easily reversible22 and that, therefore, a given country needs only to find financing for the remainder of its liabilities in international currencies in the amount that exceeds net direct investment.
In this manner, the greater the external financing needs for a country are, the more vulnerable it is to changes in international conditions for access to credit.
In addition, as mentioned before, if one assumes an expected value for net flow in investment in stock portfolios of around zero, the measurement of external financing
needs would also be a proxy for the variation expected in net external debt. Thus, it would be directly related to the credit risk analysis of a country, because the agencies that evaluate sovereign risk use various indicators based on the value for net external debt as a basis for their decision in regard to risk classification.
21 Symmetrically, net external financing of a country to the rest of the world is defined as the total of the current account balance and the net balance in direct investment, both related to the balance of payments accounts of this country. In this case, we are dealing with the external financing needs of the rest of the world served by the country in question, through the net acquisition of assets representing rights over capital and financial assets. 22 Note that there is some controversy in regard to this observation.

16
The graph below shows the evolution of current account deficit and external financing
needs for Brazil during the period 1992-2005.
Illustration 8: Current Account Deficit and Financing Need
Deficit in Current Account vs. Financing Need
-4,0%
-3,0%
-2,0%
-1,0%
0,0%
1,0%
2,0%
3,0%
4,0%
5,0%
6,0%
1992 1993 1994 1995 1996 1997 1998 1999 2000 2001 2002 2003 2004 2005
(% of GDP)
Deficit in Current Account Financing Needs
Souce: Central Bank; compiled for this study.
Some important points to mention include:
● Since 1999, Brazil’s financing needs have been negative. That is to say that, not including accounting factors that are usually considered to be of the second order, there has been a decreasing trend for net external debt.
● It was only beginning in 2003 that the result in current account became a surplus.
● At the start of the Real Plan, the result in the current account increasingly became a deficit, reaching a deficit of almost 5% of the GDP in 1999.
● Nevertheless, as shown in the graph, financing needs displayed a declining trend after the jump to almost 2% of the GDP in 1995. From 1999 until 2002 the flow of direct investment in Brazil was more than sufficient to cover the deficit result in the current account.
● For the most part, this flow of direct investment was a result of the process of privatizations. From 1996 until 2000, US$ 30 billion in foreign investment entered Brazil related to privatization, or about US$6 billion/year (or around 0.9% of the GDP per year, on average for the five-year period.)

17
● The data below compares Brazil with some selected countries for the period that runs from 1990 until 2005. The data is accumulated year-by-year as a percentage of GDP.
Table 9: Current Account Balance and Direct Investment Source: IMF.
Current Account Balance = NetFDI
(% GND)
(1990 - 2005)
Australia - 54.8
Brazil 8.1
Chile 27.2
China 90.5
Columbia 10.7
Hungary - 10.9
India 6.0
Indonesia 14.9
Malaysia 109.2
Mexico - 11.2
Peru - 18.7
Philippines 26.3
Russia 88.5
South Africa 0.4
Thailand 31.4
Turkey - 16.2
Some observations follow:
● From 1990 until 2005, Brazil had accumulated direct investment of around 32 % of its GDP and an accumulated deficit in current account on an order of 24% of GDP. A rough estimate (especially, because it doesn’t take into consideration stock portfolio investments and gains/losses in capital) of the variation in net debt obtained with these numbers is -8 % (-32%+24%) of GDP, or a drop of around eight per cent of GDP.
● Chile shows an accumulated deficit in current account of 31% in its GDP between 1990 and 2004. But the net DFI account for this same period was 58% of GDP. The approximate number for the variation of net debt was -27% (-58%+31%) of GDP, or a drop of around 27% of GDP. The reader can draw a parallel with an economic agent that absorbs more in goods and services than it produces, but sells a capital asset at the end of the period, thus still being able to increase its bank deposits and (consequently) reduce its net debt.
18
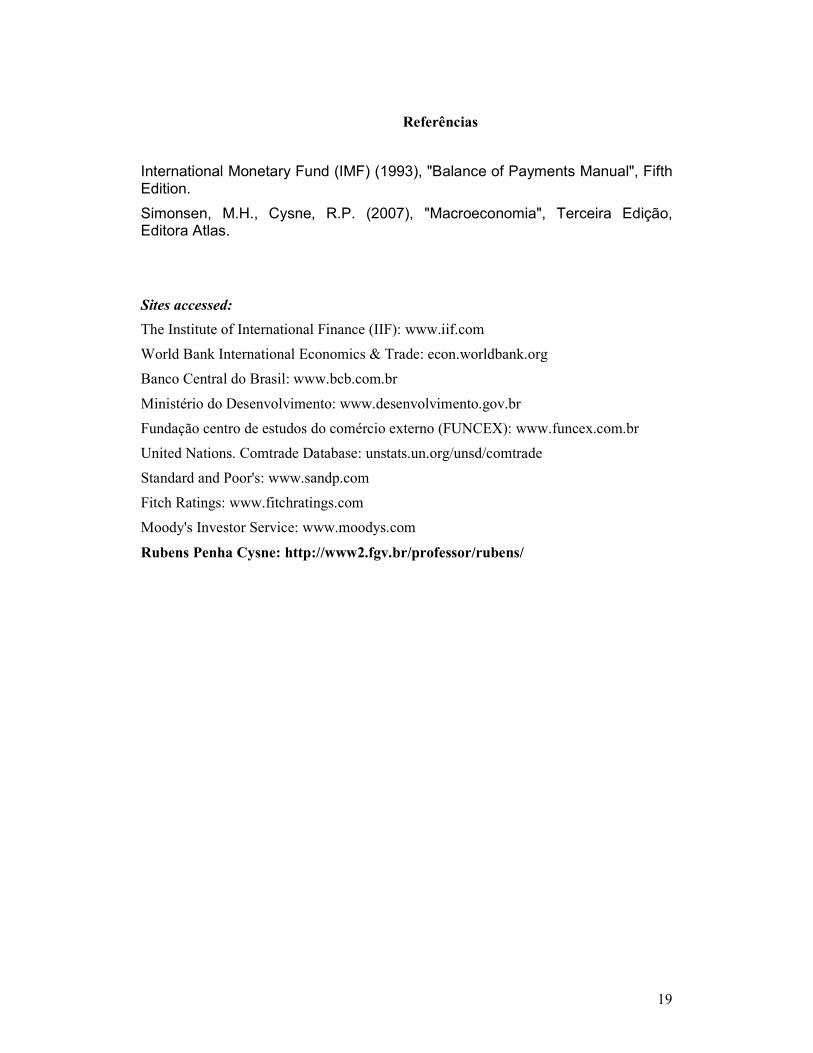
● Turkey had accumulated direct investment of about 8% of GDP and an accumulated deficit in current account on the order of 24% of GDP, suggesting an approximation for variation in net debt of about 16 % of GDP.
● It is also interesting to note that among the countries listed above with deficit results in accumulated current account between 1990 and 2005 (11 countries), only six (Australia, Hungary, India, Mexico, Peru and Turkey) did not reverse this deficit position to a surplus when accounting for their direct investment flows (DFI).
19
Referências
International Monetary Fund (IMF) (1993), "Balance of Payments Manual", Fifth Edition.
Simonsen, M.H., Cysne, R.P. (2007), "Macroeconomia", Terceira Edição, Editora Atlas.
Sites accessed:
The Institute of International Finance (IIF): www.iif.com
World Bank International Economics & Trade: econ.worldbank.org
Banco Central do Brasil: www.bcb.com.br
Ministério do Desenvolvimento: www.desenvolvimento.gov.br
Fundação centro de estudos do comércio externo (FUNCEX): www.funcex.com.br
United Nations. Comtrade Database: unstats.un.org/unsd/comtrade
Standard and Poor's: www.sandp.com
Fitch Ratings: www.fitchratings.com
Moody's Investor Service: www.moodys.com
Rubens Penha Cysne: http://www2.fgv.br/professor/rubens/