an overview of california climate michael anderson, state climatologist
TRANSCRIPT
An Overview of California Climate
Michael Anderson, State Climatologist
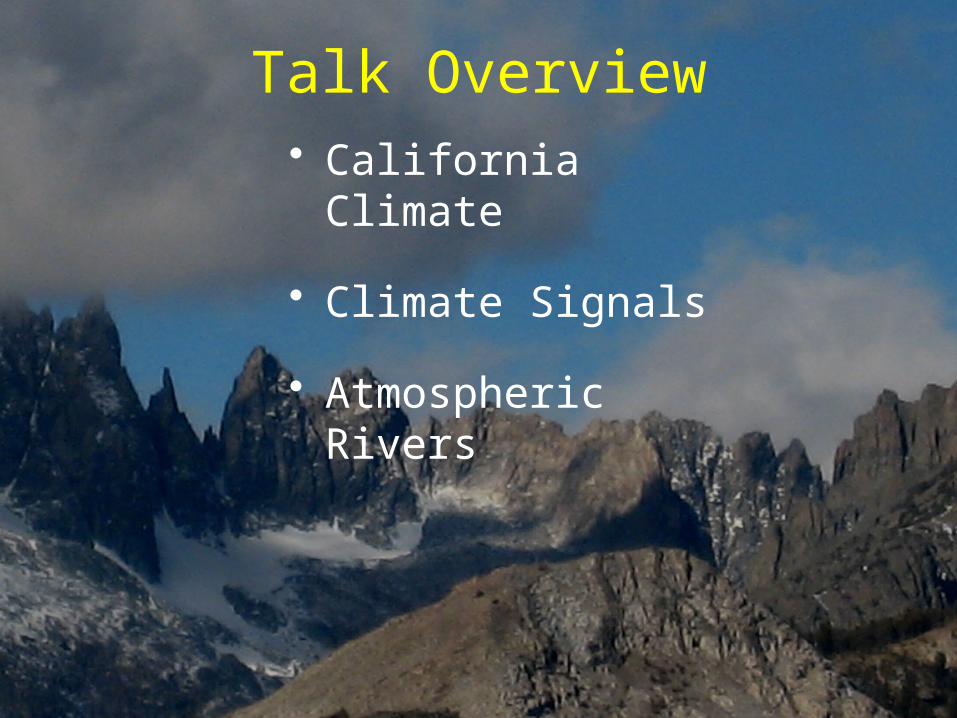
Talk Overview• California Climate
• Climate Signals
• Atmospheric Rivers
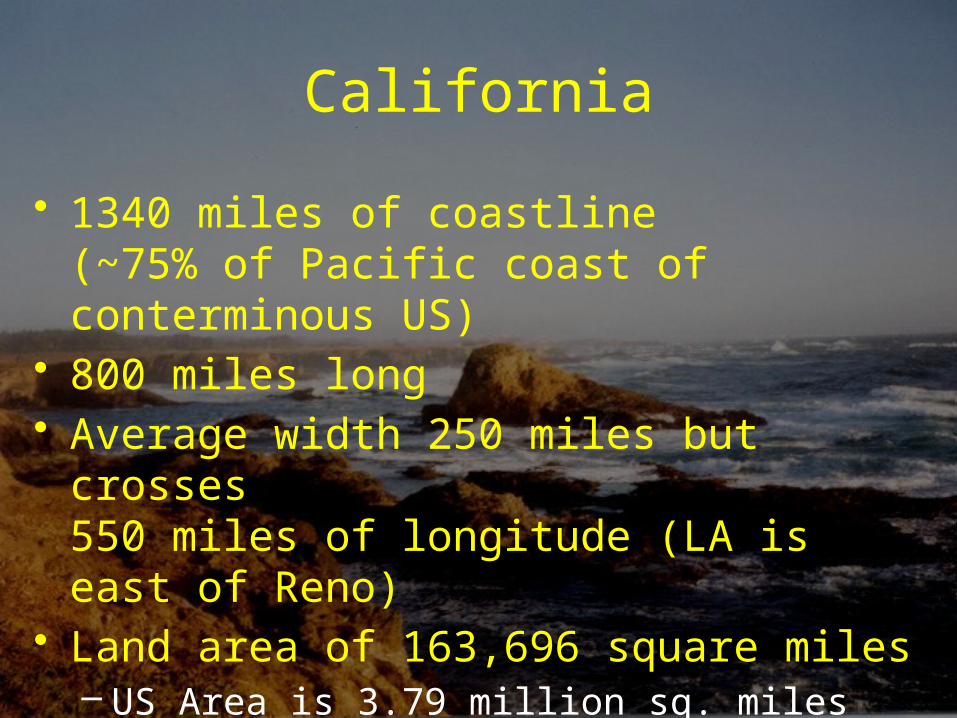
California
• 1340 miles of coastline (~75% of Pacific coast of conterminous US)
• 800 miles long• Average width 250 miles but crosses
550 miles of longitude (LA is east of Reno)• Land area of 163,696 square miles
– US Area is 3.79 million sq. miles– Rank 3rd behind Alaska and Texas
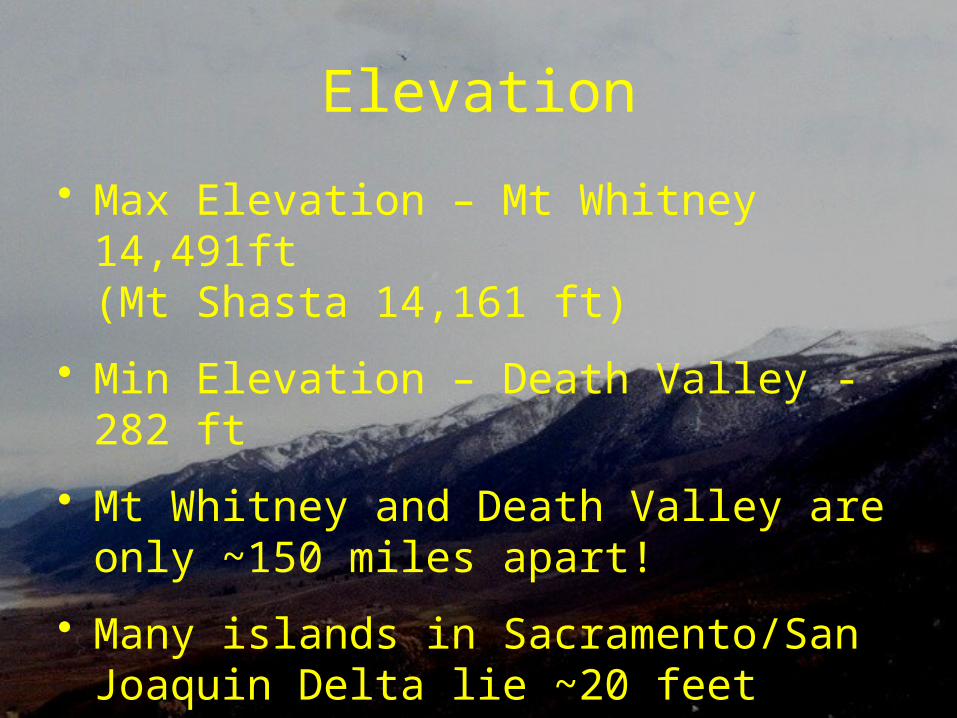
Elevation
• Max Elevation – Mt Whitney 14,491ft(Mt Shasta 14,161 ft)
• Min Elevation – Death Valley -282 ft
• Mt Whitney and Death Valley are only ~150 miles apart!
• Many islands in Sacramento/San Joaquin Delta lie ~20 feet below sea level
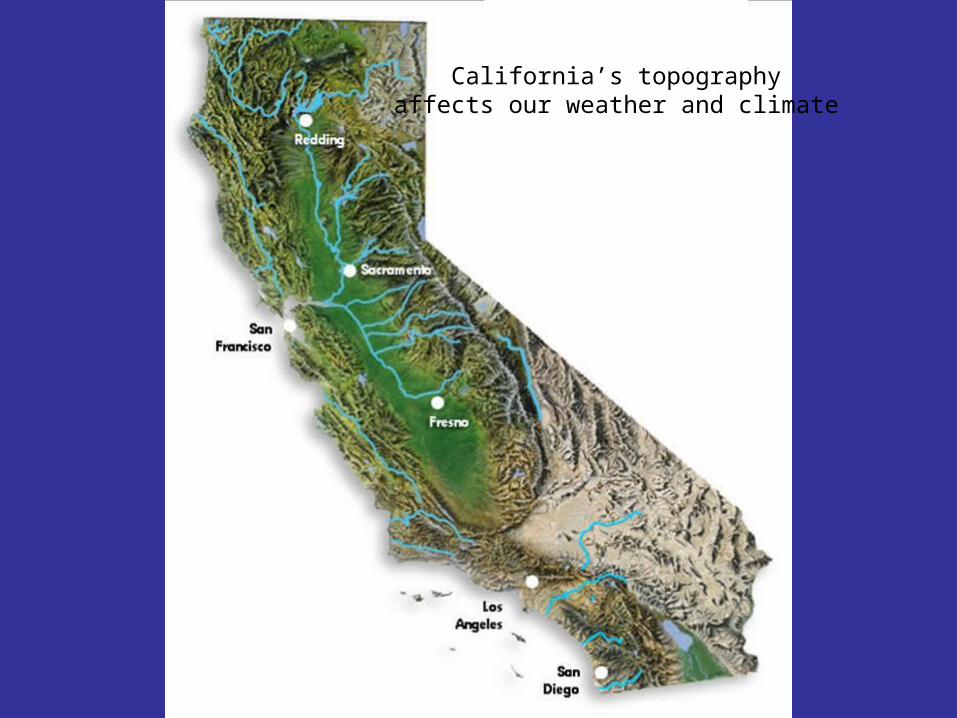
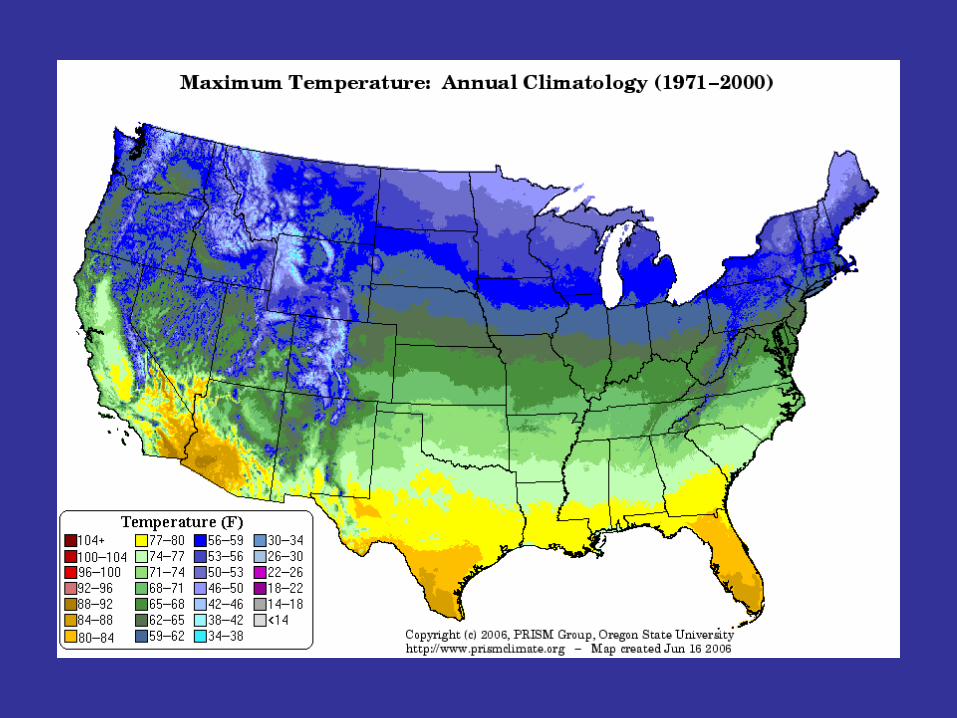
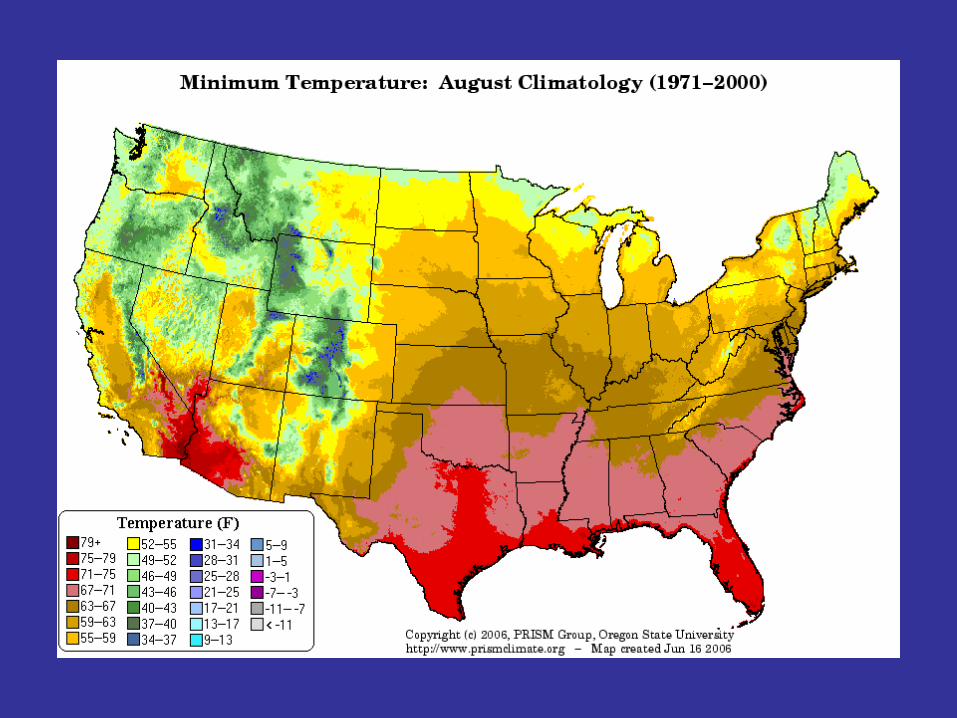
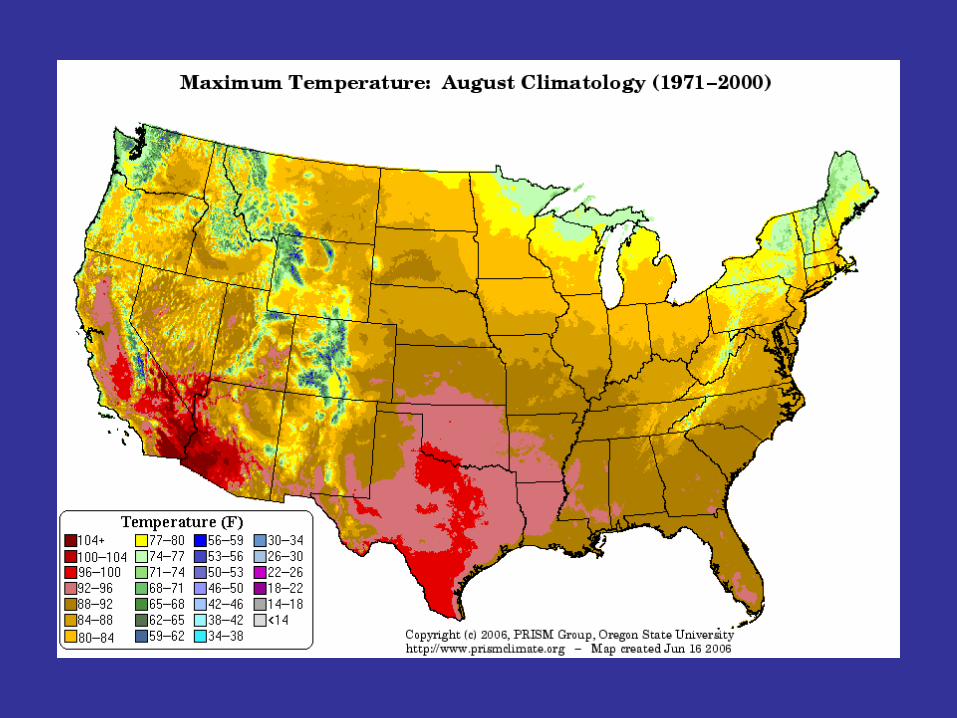
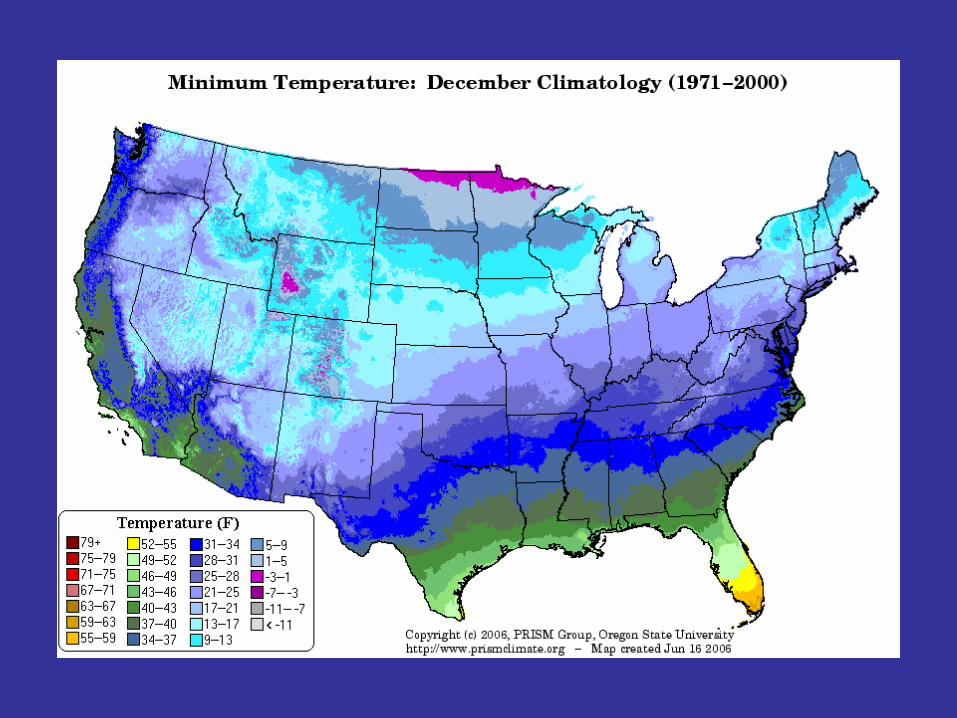
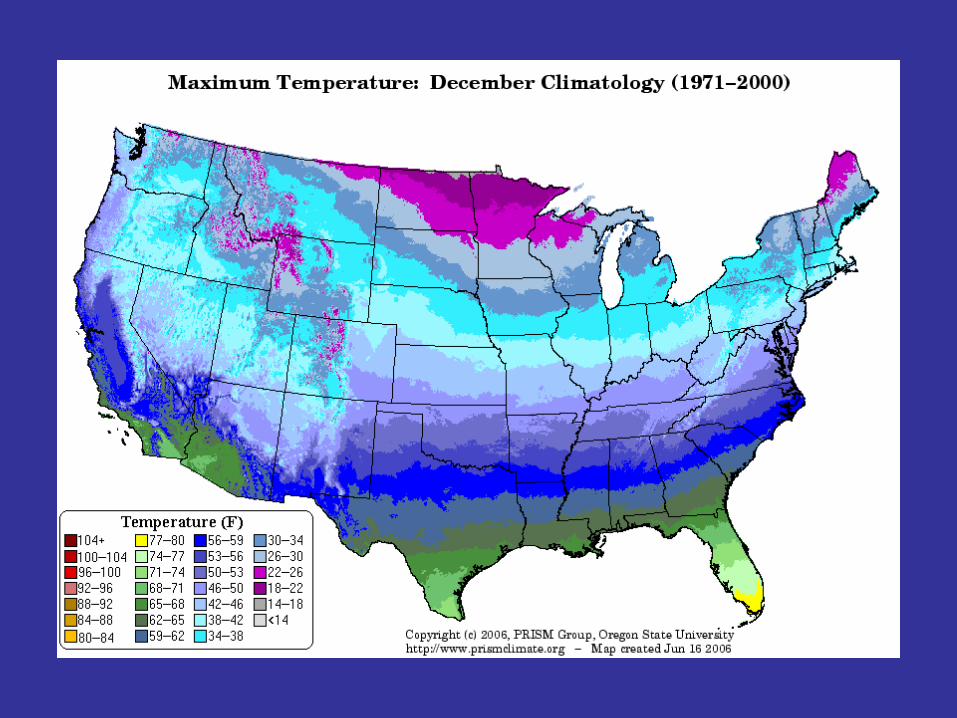
California’s topographyaffects our weather and climate
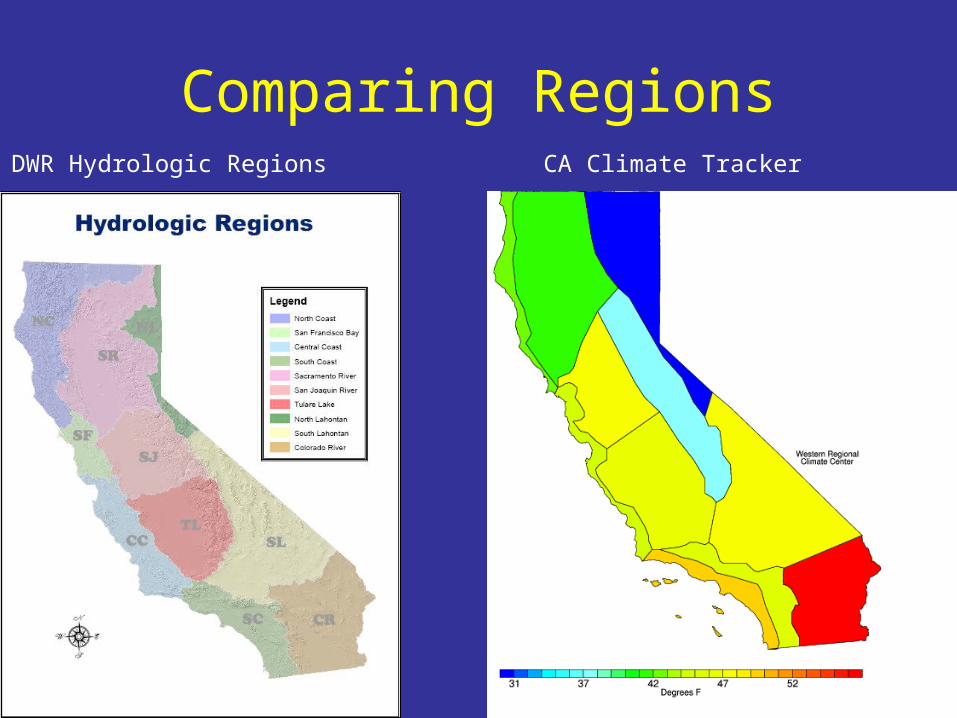
Comparing RegionsCA Climate TrackerDWR Hydrologic Regions
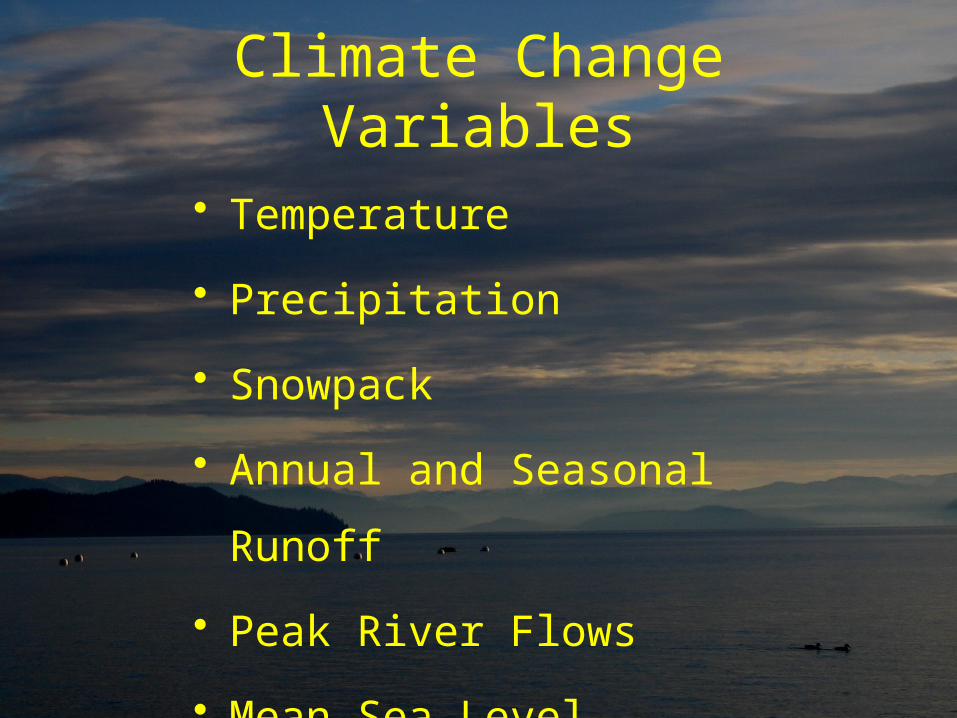
Climate Change Variables
• Temperature
• Precipitation
• Snowpack
• Annual and Seasonal Runoff
• Peak River Flows
• Mean Sea Level
Statewide 20th CenturyTemperature and Precipitation
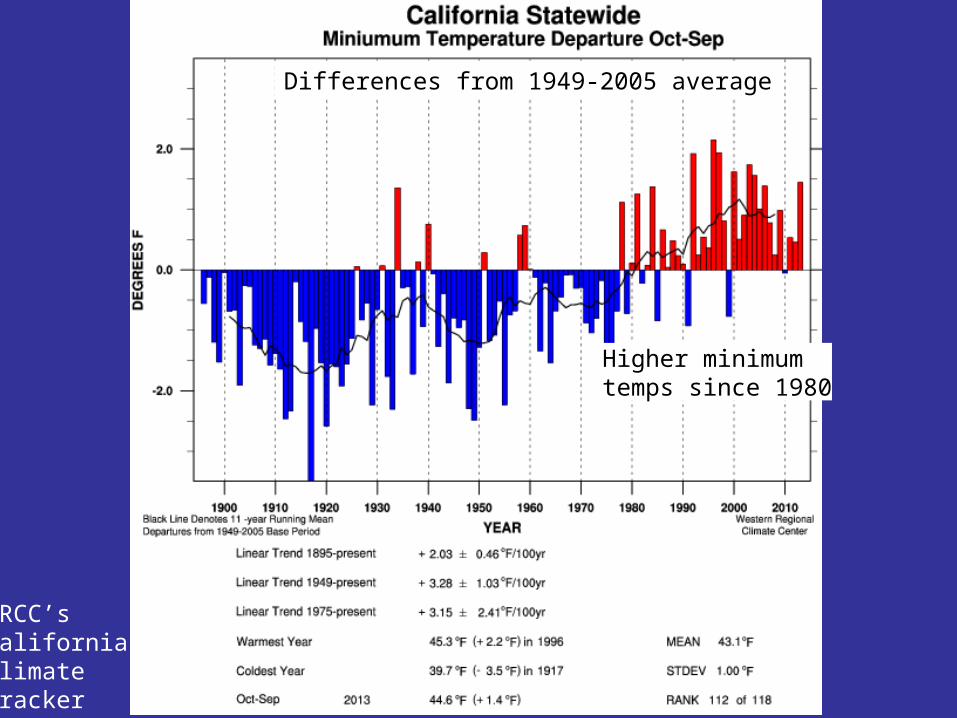
WRCC’sCalifornia Climate Tracker
Differences from 1949-2005 average
Higher minimum temps since 1980

WRCC’sCalifornia Climate Tracker
Differences from 1949-2005 average
Dust Bowl Era
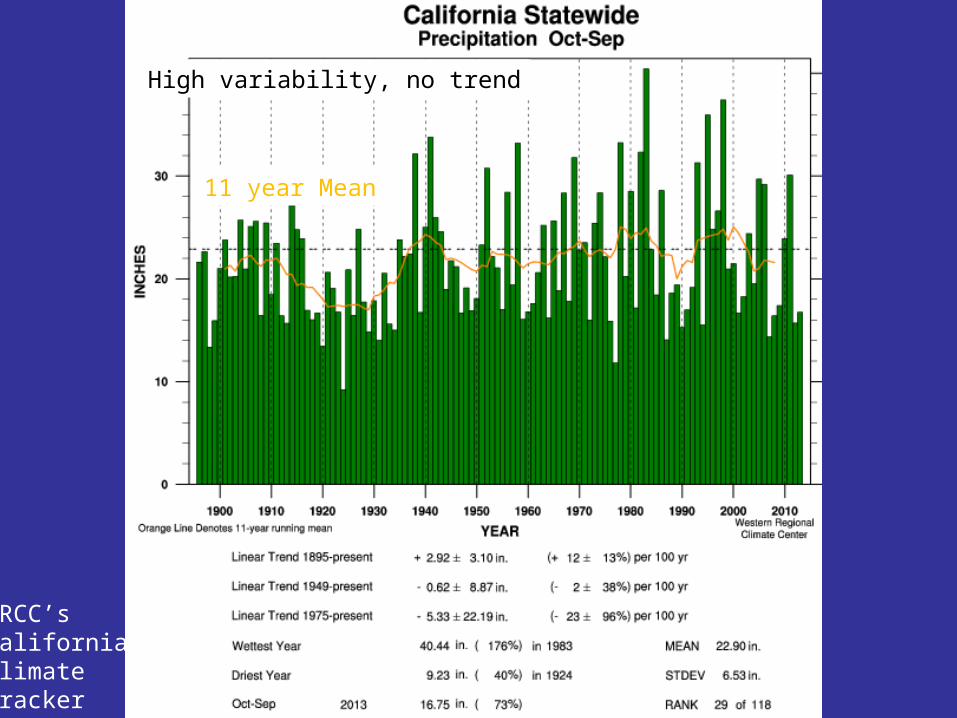
WRCC’sCalifornia Climate Tracker
11 year Mean
High variability, no trend

Spatial Variability
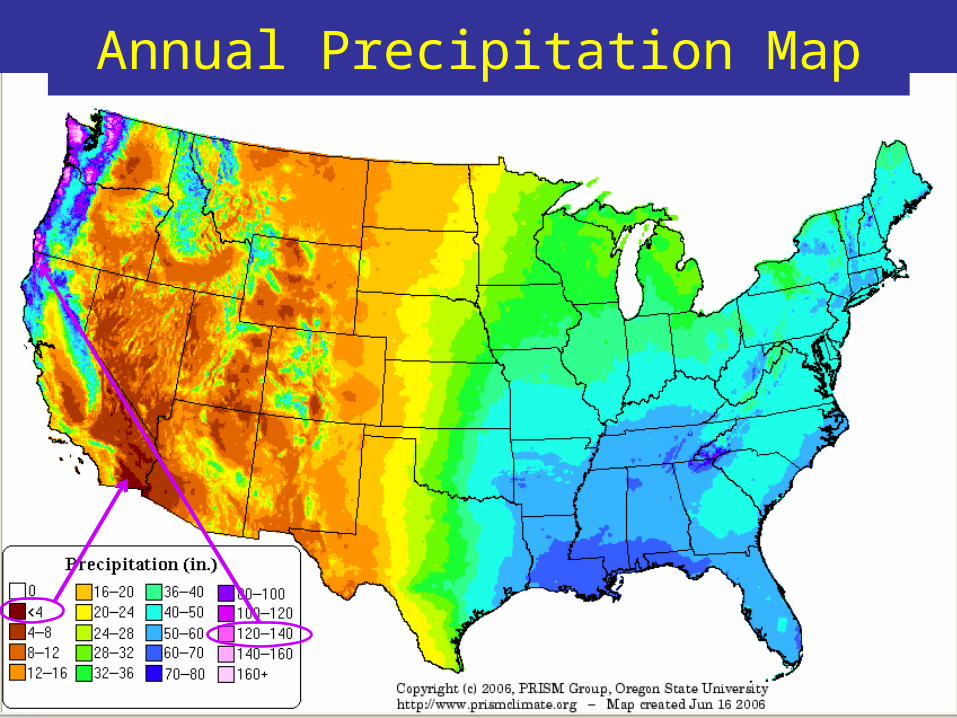
Annual Precipitation Map

Seasonal Variability

Inter-Annual Variability
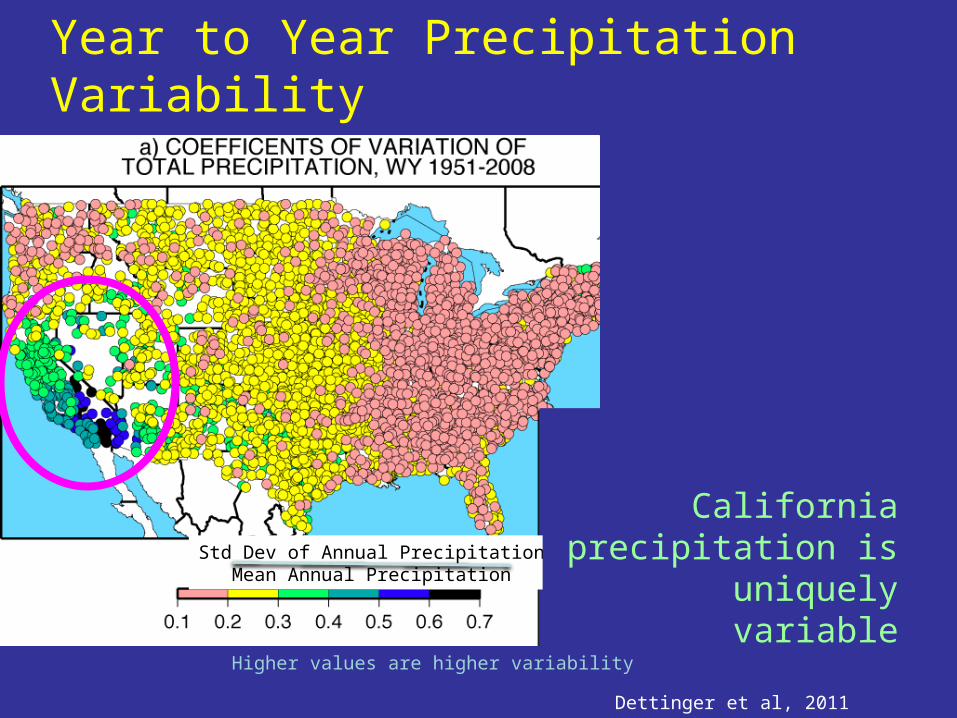
Year to Year Precipitation Variability
Dettinger et al, 2011
Std Dev of Annual PrecipitationMean Annual Precipitation
California precipitation is uniquely variable
Higher values are higher variability
Precipitation and Runoff
Northern Sierra
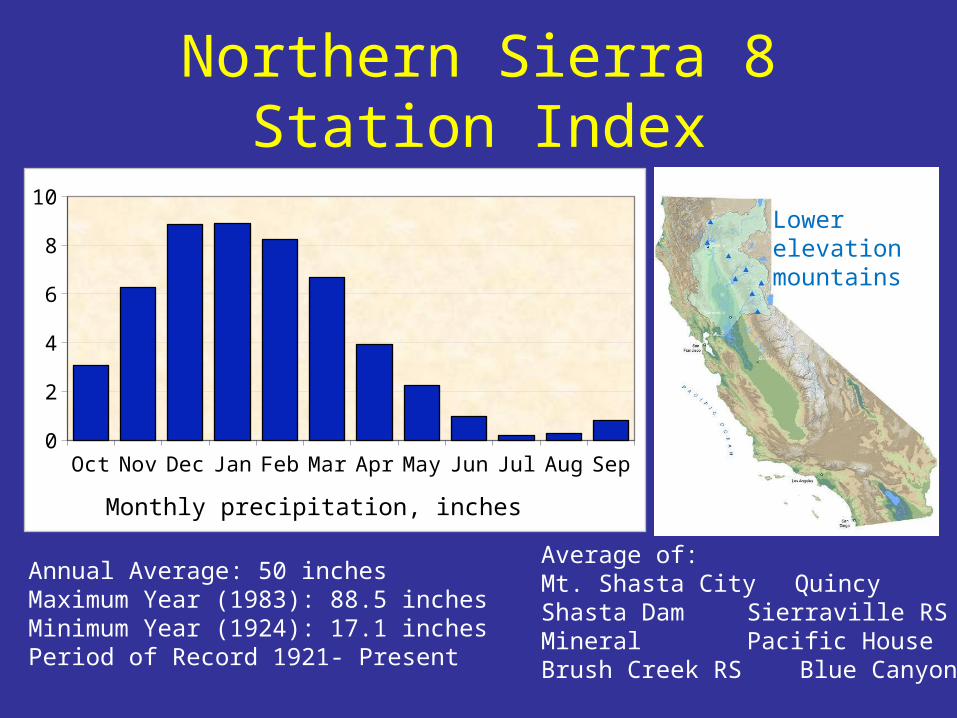
Northern Sierra 8 Station Index
Annual Average: 50 inchesMaximum Year (1983): 88.5 inchesMinimum Year (1924): 17.1 inchesPeriod of Record 1921- Present
Average of:Mt. Shasta City QuincyShasta Dam Sierraville RSMineral Pacific HouseBrush Creek RS Blue Canyon
Oct Nov Dec Jan Feb Mar Apr May Jun Jul Aug Sep0
2
4
6
8
10
Monthly precipitation, inches
Lower elevation mountains
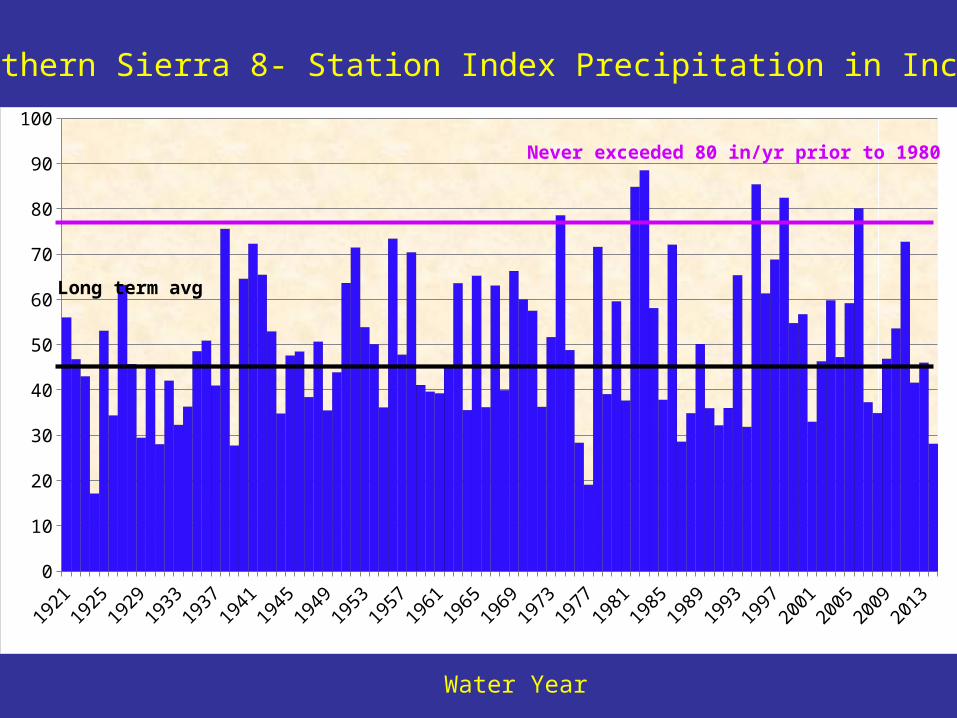
19211925
19291933
19371941
19451949
19531957
19611965
19691973
19771981
19851989
19931997
20012005
20092013
0
10
20
30
40
50
60
70
80
90
100
Long term avg
Never exceeded 80 in/yr prior to 1980
Water Year
Northern Sierra 8- Station Index Precipitation in Inches
Oct Nov Dec Jan Feb Mar Apr May Jun Jul Aug Sep0.0
0.5
1.0
1.5
2.0
2.5
3.0
3.5
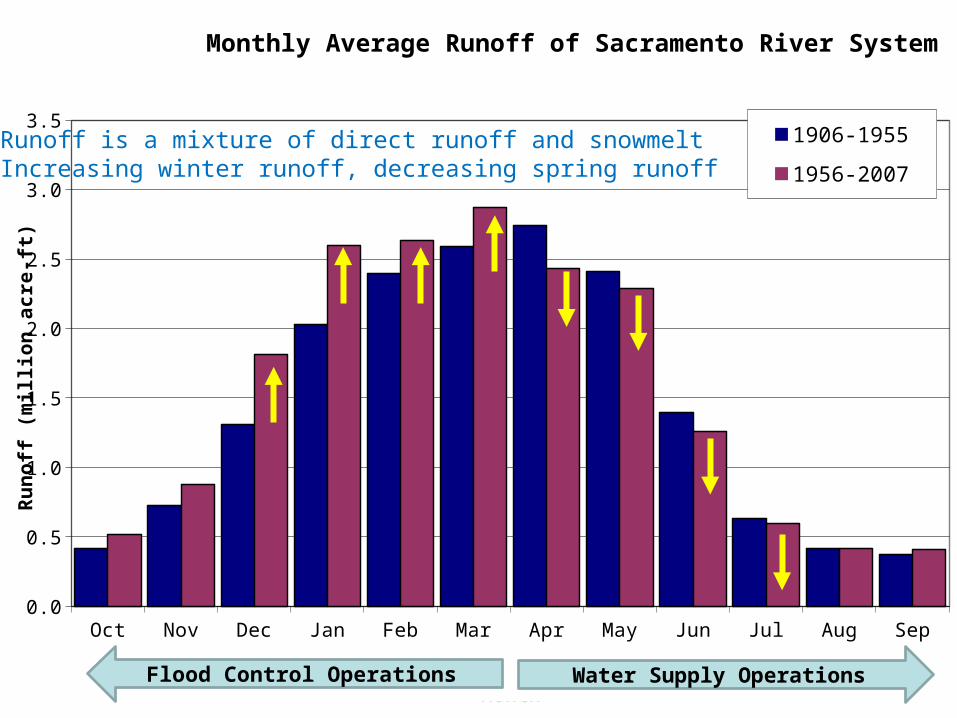
Monthly Average Runoff of Sacramento River System
1906-1955
1956-2007
Month
Ru
no
ff (
mil
lio
n a
cre
-ft)
Flood Control Operations
Runoff is a mixture of direct runoff and snowmeltIncreasing winter runoff, decreasing spring runoff
Water Supply Operations
Precipitation and Runoff
Southern Sierra
Oct Nov Dec Jan Feb Mar Apr May Jun Jul Aug Sep0
2
4
6
8
10
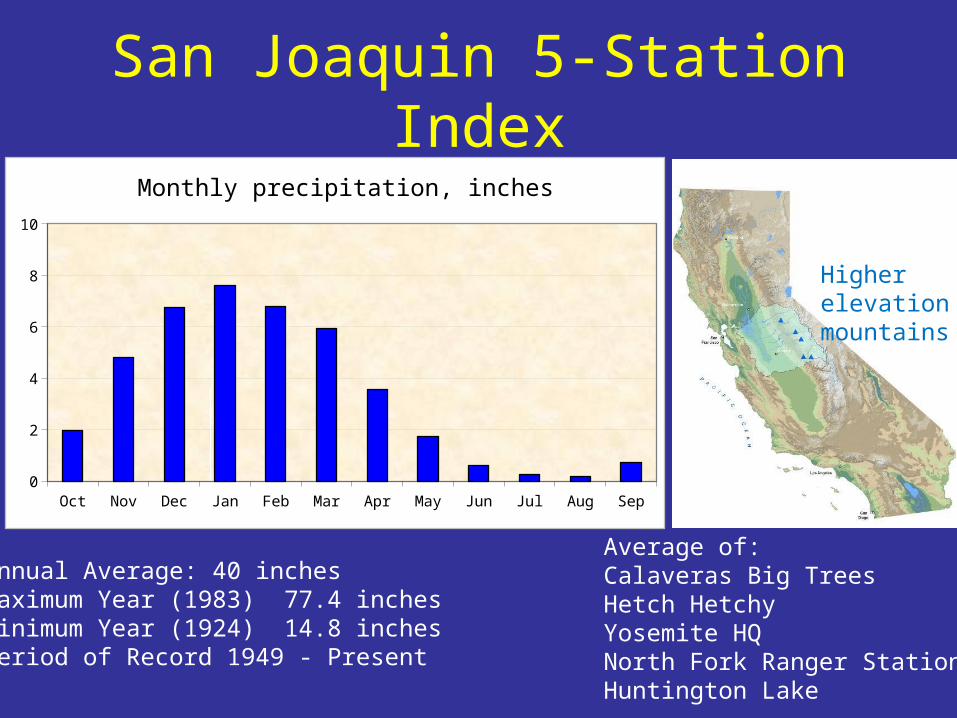
San Joaquin 5 Station Index
San Joaquin 5-Station Index
Annual Average: 40 inchesMaximum Year (1983) 77.4 inchesMinimum Year (1924) 14.8 inchesPeriod of Record 1949 - Present
Average of:Calaveras Big TreesHetch HetchyYosemite HQNorth Fork Ranger StationHuntington Lake
Monthly precipitation, inches
Higherelevation mountains
1905 1913 1921 1929 1937 1945 1953 1961 1969 1977 1985 1993 2001 2009 0
10
20
30
40
50
60
70
80
90
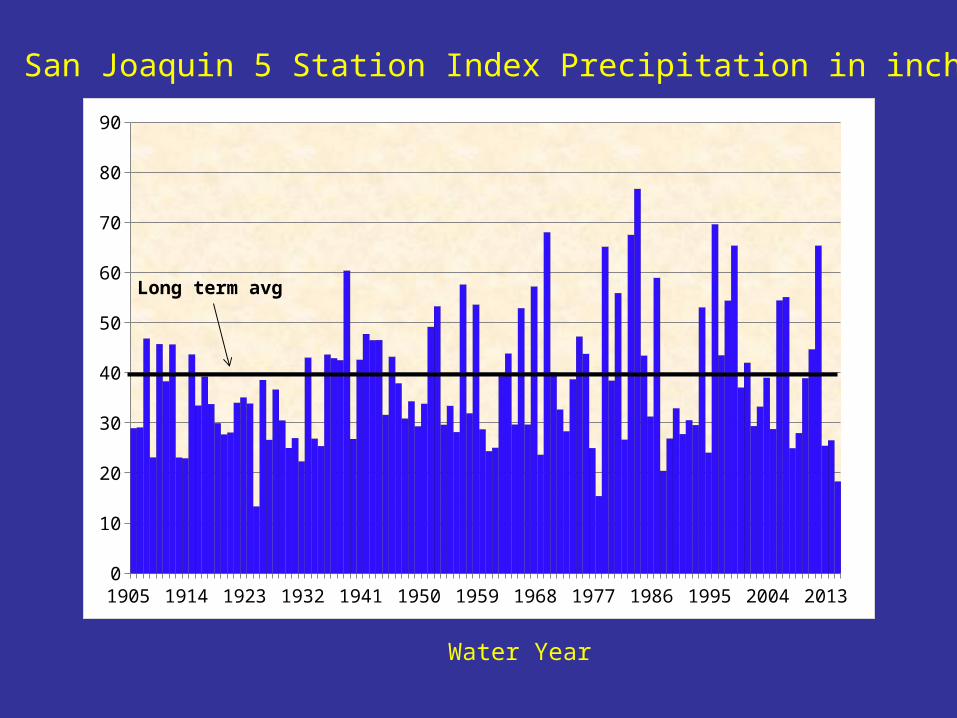
Long term avg
Water Year
San Joaquin 5 Station Index Precipitation in inches
Oct Nov Dec Jan Feb Mar Apr May Jun Jul Aug Sep0.0
0.2
0.4
0.6
0.8
1.0
1.2
1.4
1.6
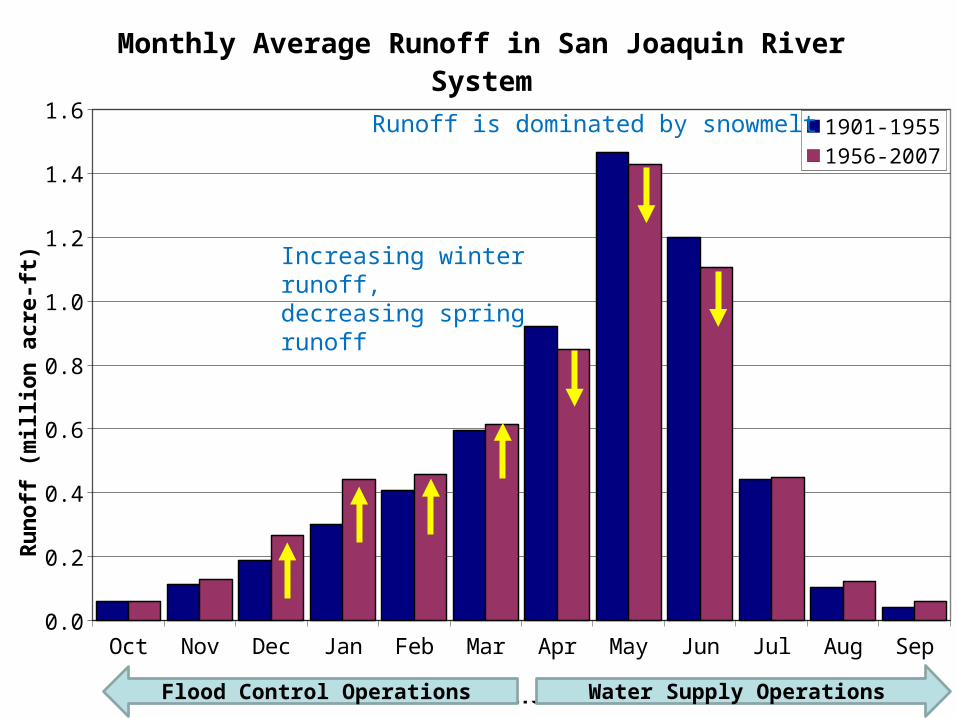
Monthly Average Runoff in San Joaquin River System
1901-19551956-2007
Month
Ru
no
ff (
mill
ion
acr
e-ft
)
Flood Control Operations Water Supply Operations
Runoff is dominated by snowmelt
Increasing winter runoff, decreasing spring runoff
Snow Pack
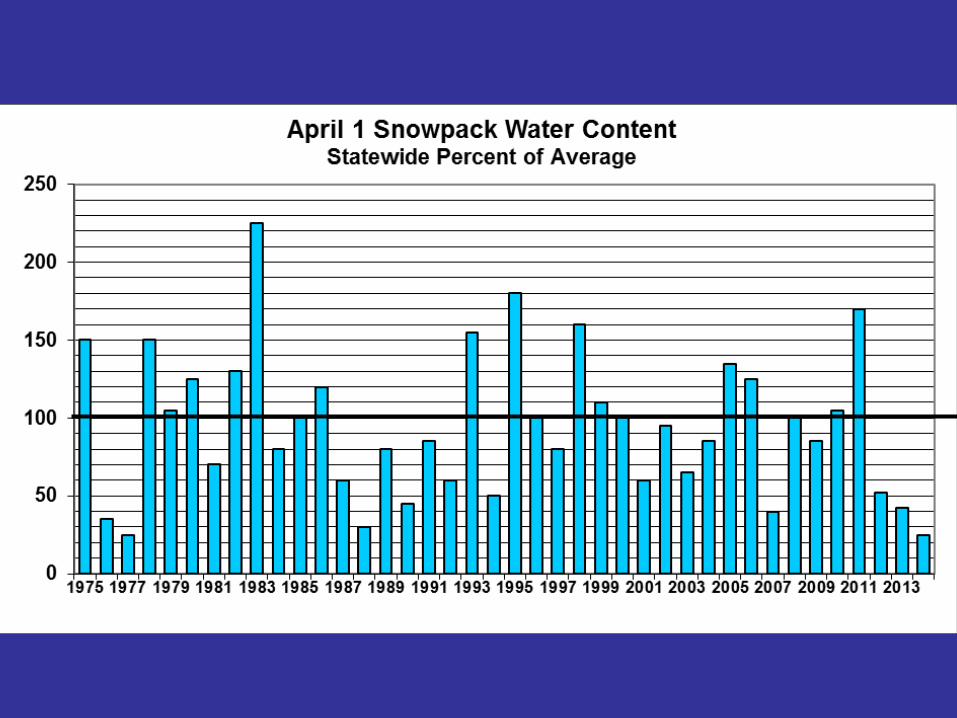
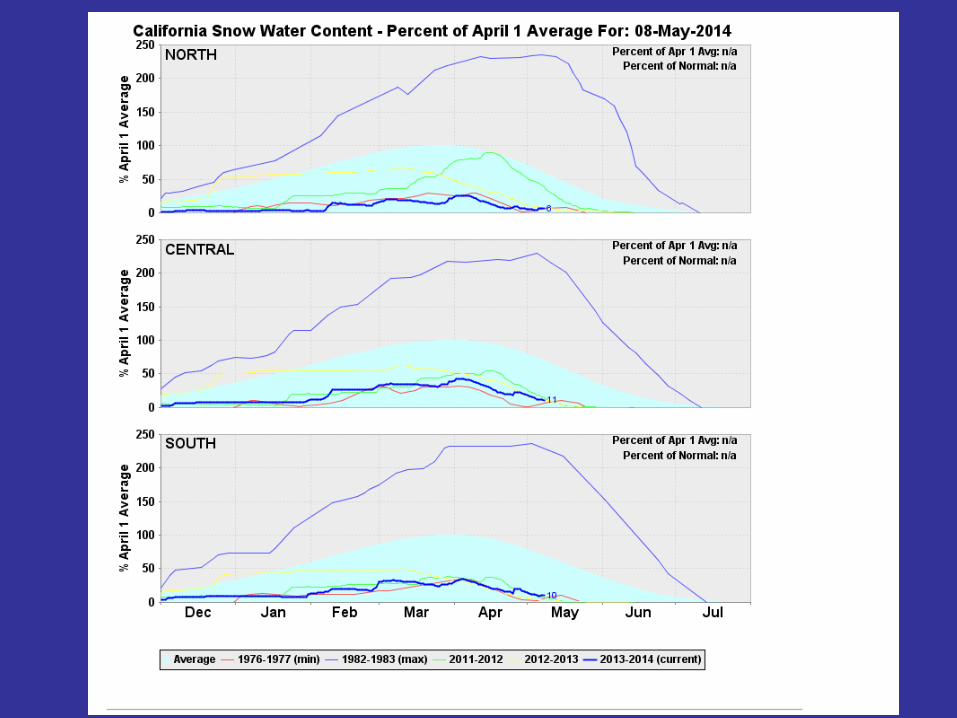
2011
2011
2011
SnowmeltApril-July Runoff
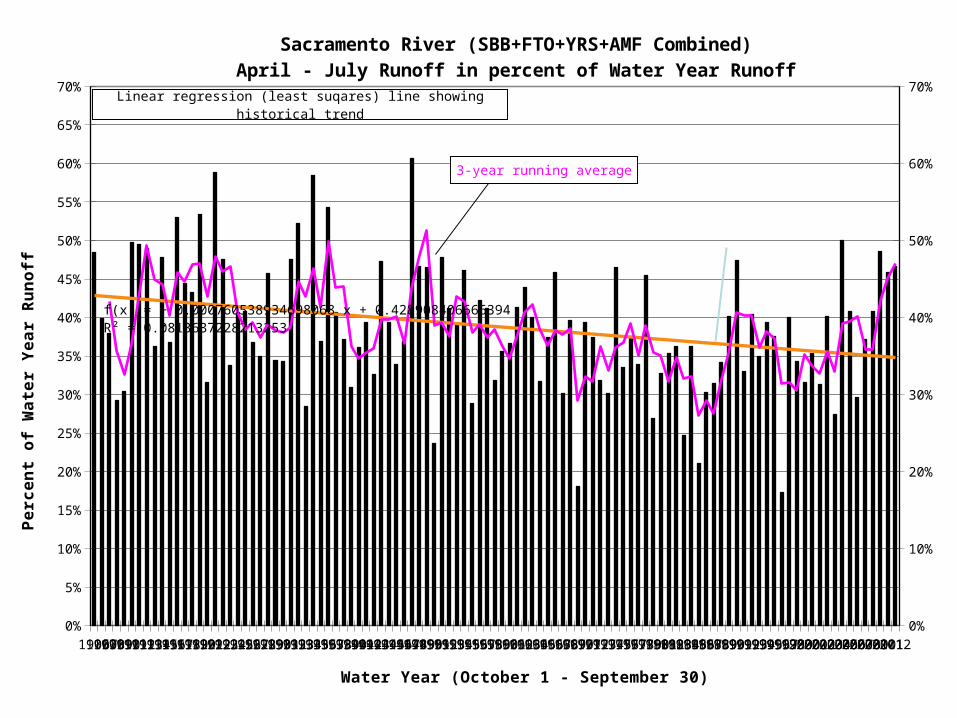
190619071908190919101911191219131914191519161917191819191920192119221923192419251926192719281929193019311932193319341935193619371938193919401941194219431944194519461947194819491950195119521953195419551956195719581959196019611962196319641965196619671968196919701971197219731974197519761977197819791980198119821983198419851986198719881989199019911992199319941995199619971998199920002001200220032004200520062007200820092010201120120%
5%
10%
15%
20%
25%
30%
35%
40%
45%
50%
55%
60%
65%
70%
0%
10%
20%
30%
40%
50%
60%
70%
f(x) = − 0.000760538934698068 x + 0.428908406666395R² = 0.0813637228213251
Sacramento River (SBB+FTO+YRS+AMF Combined)April - July Runoff in percent of Water Year Runoff
Water Year (October 1 - September 30)
Pe
rce
nt
of
Wa
ter
Ye
ar
Ru
no
ff
Linear regression (least suqares) line showing historical trend
3-year running average
19011902190319041905190619071908190919101911191219131914191519161917191819191920192119221923192419251926192719281929193019311932193319341935193619371938193919401941194219431944194519461947194819491950195119521953195419551956195719581959196019611962196319641965196619671968196919701971197219731974197519761977197819791980198119821983198419851986198719881989199019911992199319941995199619971998199920002001200220032004200520062007200820092010201130%
35%
40%
45%
50%
55%
60%
65%
70%
75%
80%
85%
90%
30%
40%
50%
60%
70%
80%
90%
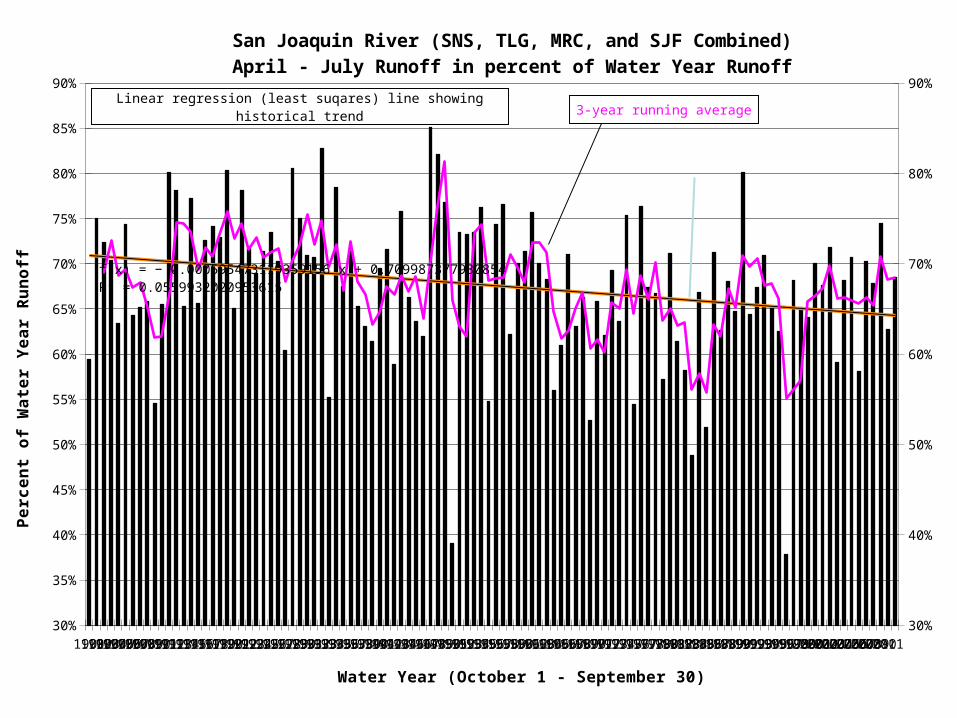
f(x) = − 0.000595473119359156 x + 0.709987377930854R² = 0.0559932020953621
San Joaquin River (SNS, TLG, MRC, and SJF Combined)April - July Runoff in percent of Water Year Runoff
Water Year (October 1 - September 30)
Pe
rce
nt
of
Wa
ter
Ye
ar
Ru
no
ff
Linear regression (least suqares) line showing historical trend 3-year running average
Peak Runoff
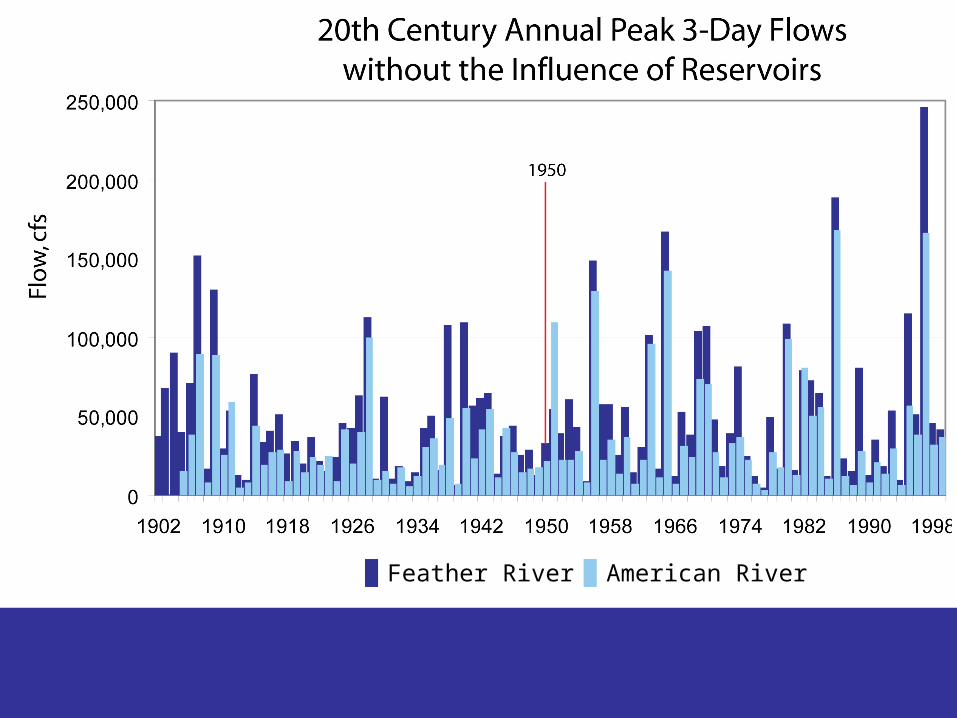
Feather River American River
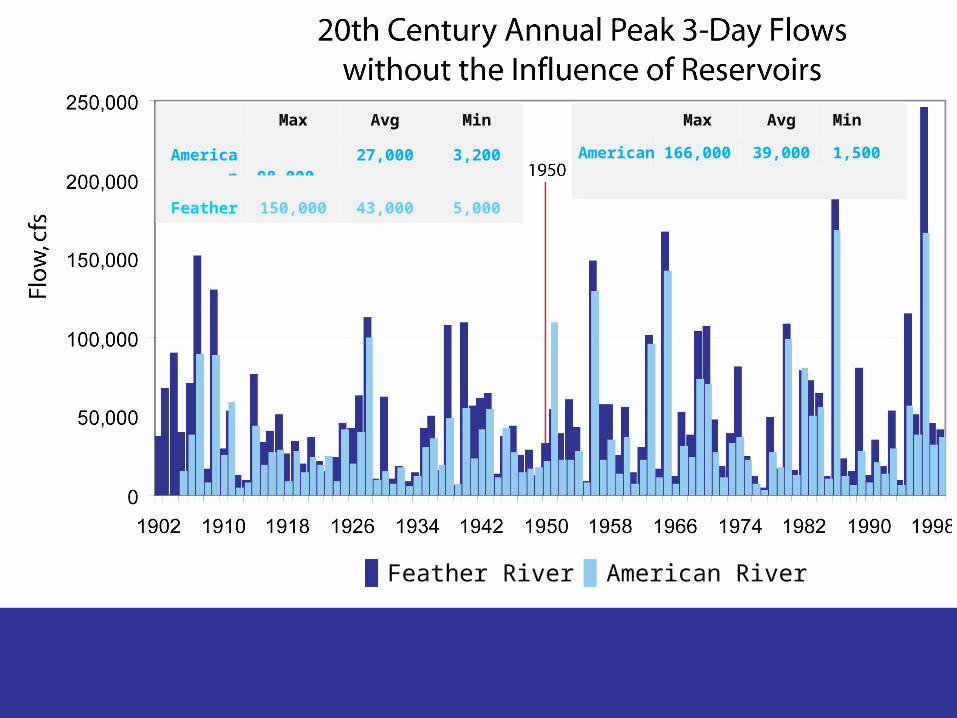
Max Avg Min
American
98,000 27,000 3,200
Feather 150,000 43,000 5,000
Max Avg Min
American 166,000 39,000 1,500
Feather 245,000 55,000 3,000
Feather River American River
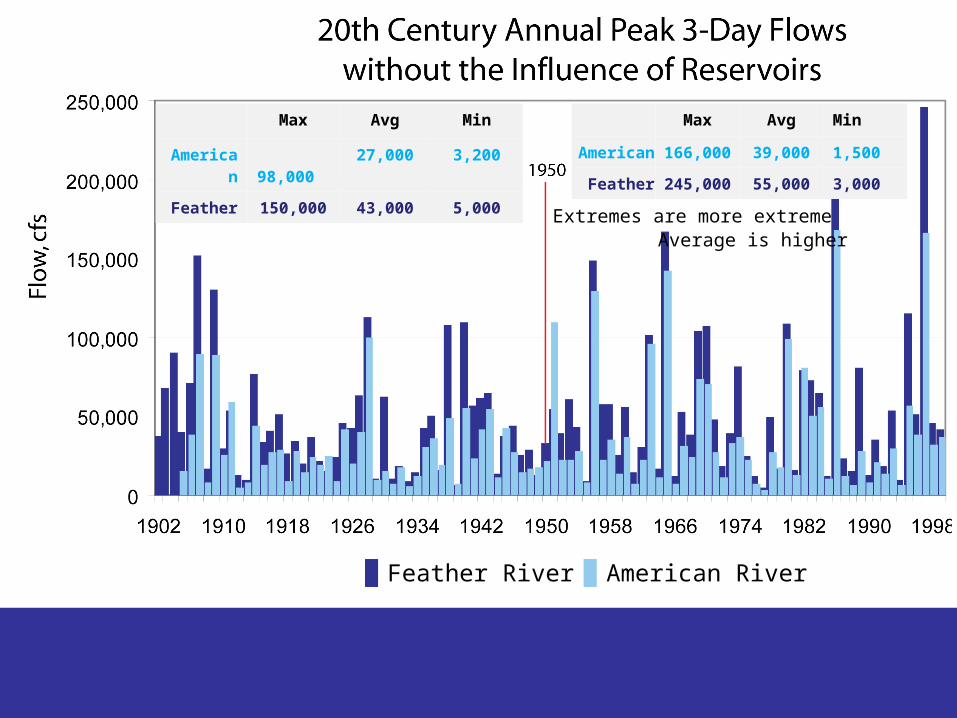
Max Avg Min
American
98,000 27,000 3,200
Feather 150,000 43,000 5,000
Max Avg Min
American 166,000 39,000 1,500
Feather 245,000 55,000 3,000
Average is higherExtremes are more extreme
Feather River American River
Climate Signals
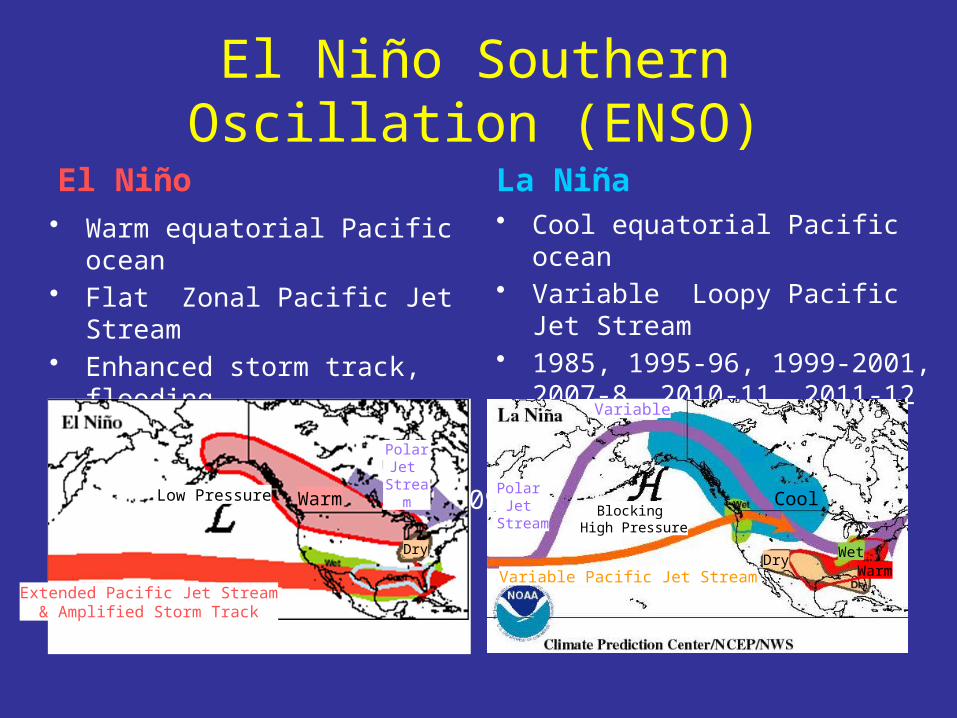
El Niño Southern Oscillation (ENSO)
El Niño• Warm equatorial Pacific ocean• Flat Zonal Pacific Jet Stream• Enhanced storm track, flooding• 1983,1986-87, 1991-92, 1993,
1994,1997-98, 2002-3, 2009-10
La Niña• Cool equatorial Pacific ocean• Variable Loopy Pacific Jet Stream• 1985, 1995-96, 1999-2001,
2007-8, 2010-11, 2011-12
Low PressureBlocking
High Pressure
Warm
Extended Pacific Jet Stream& Amplified Storm Track
DryDry Wet
WarmVariable Pacific Jet Stream
Cool
Variable
Polar Jet
Stream
Polar Jet
Stream
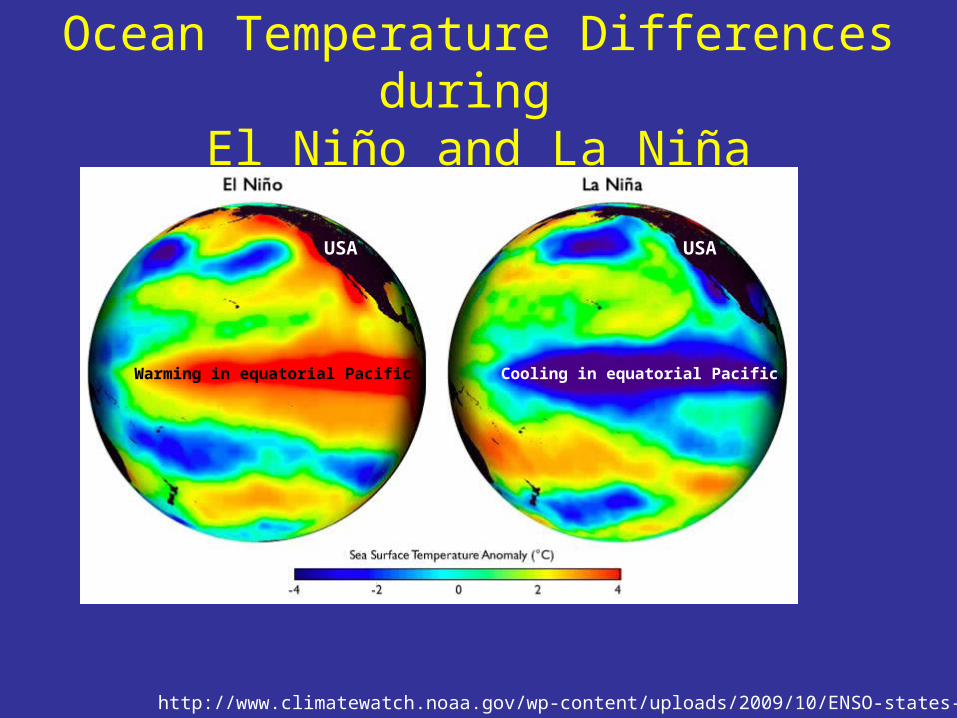
Ocean Temperature Differences during El Niño and La Niña
http://www.climatewatch.noaa.gov/wp-content/uploads/2009/10/ENSO-states-viz.jpg
Warming in equatorial Pacific Cooling in equatorial Pacific
USAUSA
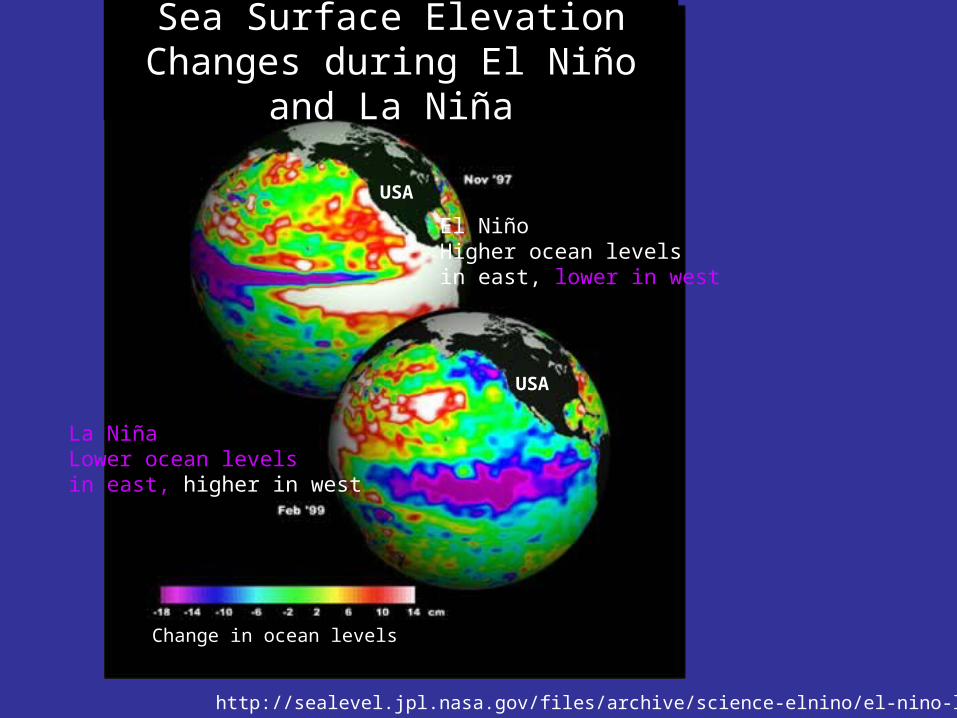
http://sealevel.jpl.nasa.gov/files/archive/science-elnino/el-nino-la-nina.jpg
Sea Surface Elevation Changes during El Niño and La Niña
El NiñoHigher ocean levels in east, lower in west
La Niña Lower ocean levels in east, higher in west
Change in ocean levels
USA
USA
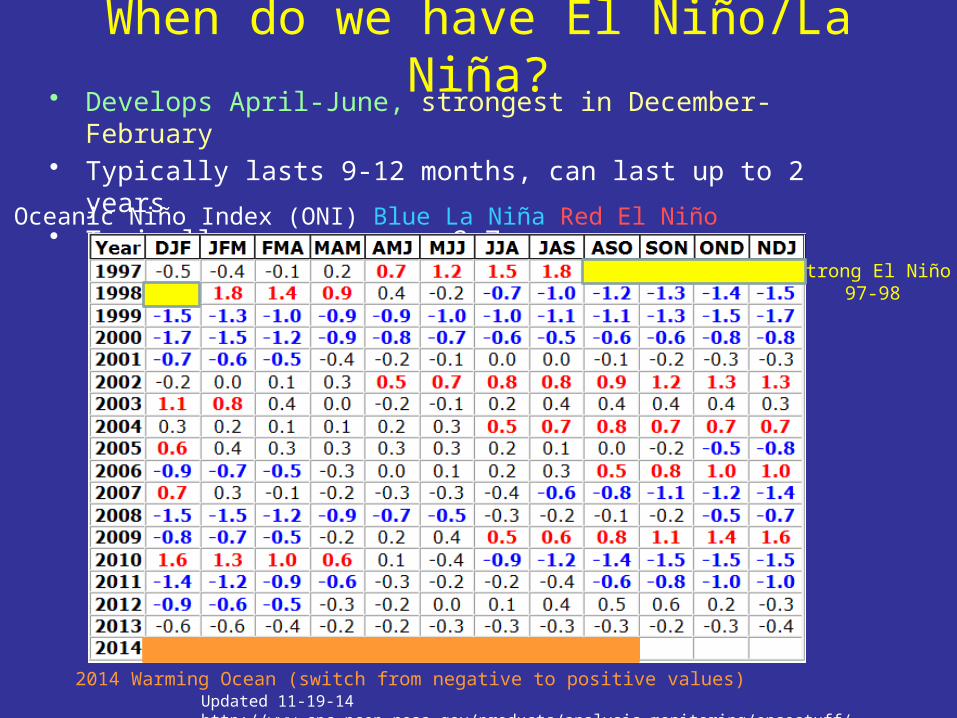
When do we have El Niño/La Niña?• Develops April-June, strongest in December-February• Typically lasts 9-12 months, can last up to 2 years• Typically occurs every 2-7 years
Updated 11-19-14 http://www.cpc.ncep.noaa.gov/products/analysis_monitoring/ensostuff/ensoyears.shtml
Oceanic Niño Index (ONI) Blue La Niña Red El Niño
Strong El Niño97-98
2014 Warming Ocean (switch from negative to positive values)
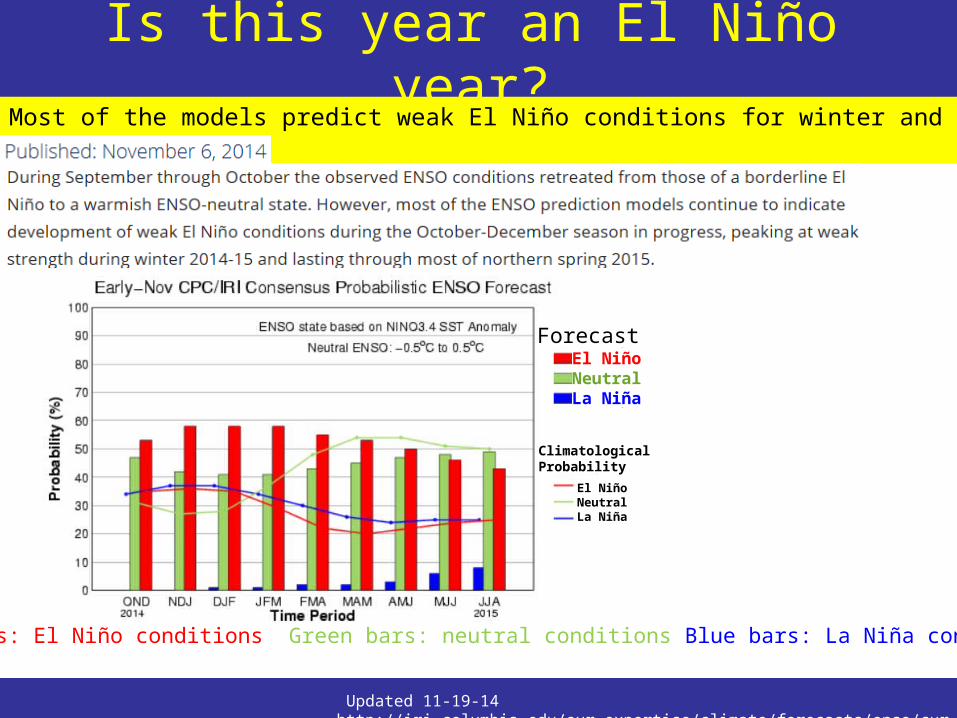
Is this year an El Niño year?
Updated 11-19-14 http://iri.columbia.edu/our-expertise/climate/forecasts/enso/current/
Most of the models predict weak El Niño conditions for winter and spring
Red bars: El Niño conditions Green bars: neutral conditions Blue bars: La Niña conditions
El NiñoNeutralLa Niña
Forecast
El NiñoNeutralLa Niña
Climatological Probability
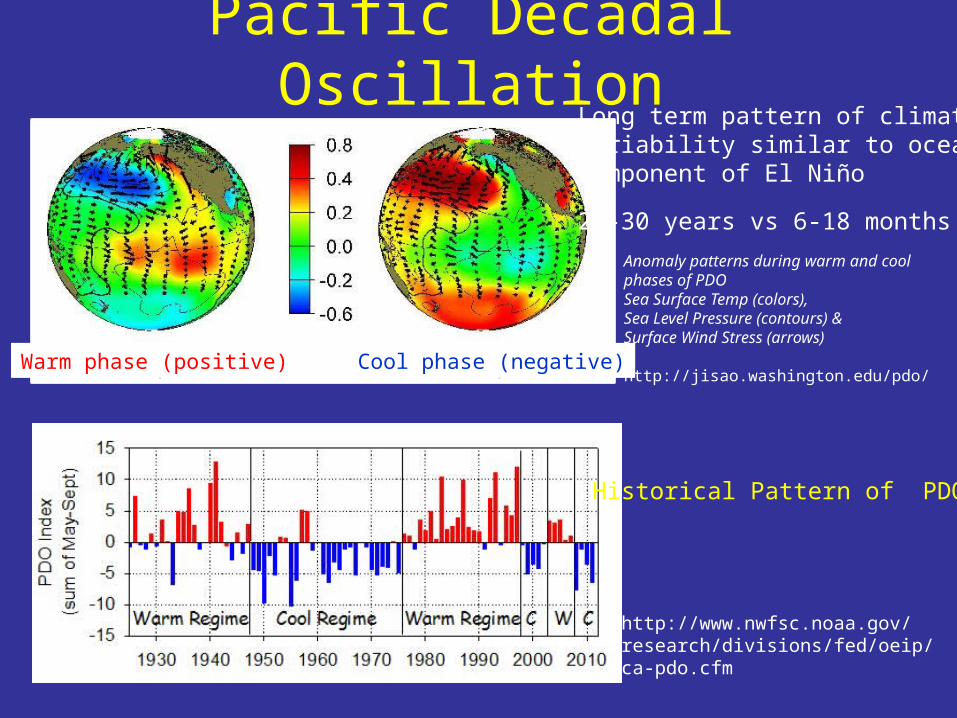
Pacific Decadal Oscillation
Warm phase Cool phase
Anomaly patterns during warm and cool phases of PDOSea Surface Temp (colors), Sea Level Pressure (contours) & Surface Wind Stress (arrows)
http://jisao.washington.edu/pdo/
http://www.nwfsc.noaa.gov/research/divisions/fed/oeip/ca-pdo.cfm
Historical Pattern of PDO
Long term pattern of climate variability similar to ocean component of El Niño
20-30 years vs 6-18 months
Warm phase (positive) Cool phase (negative)
Atmospheric Rivers
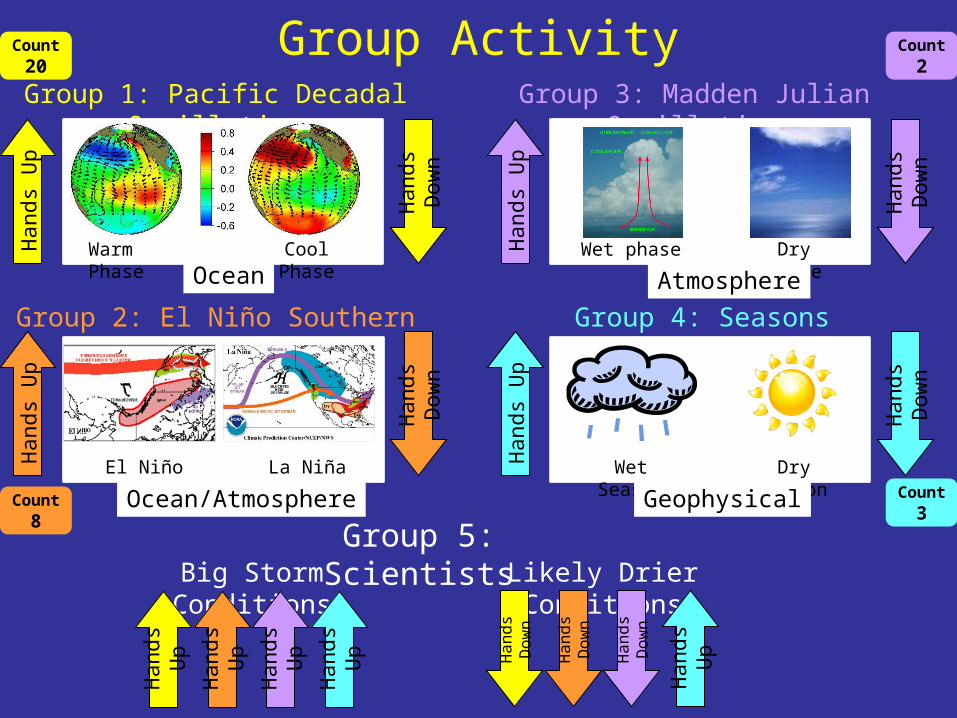
Group ActivityGroup 1: Pacific Decadal Oscillation
Warm Phase Cool Phase
Han
ds U
p
Han
ds
Dow
n
Han
ds U
p
Han
ds
Dow
n
Group 2: El Niño Southern Oscillation
El Niño La Niña
Group 3: Madden Julian Oscillation
Group 4: Seasons
Group 5: ScientistsH
ands
Up
Han
ds
Dow
n
Han
ds U
p
Han
ds
Dow
n
Wet Season Dry Season
Wet phase Dry phase
Big Storm Conditions
Han
ds
Up
Han
ds
Up
Han
ds
Up
Han
ds
Up
Likely Drier Conditions
Han
ds
Dow
n
Han
ds
UpHan
ds
Dow
n
Han
ds
Dow
n
Count 20
Count 3
Count 2
Count 8
Ocean Atmosphere
Ocean/Atmosphere Geophysical
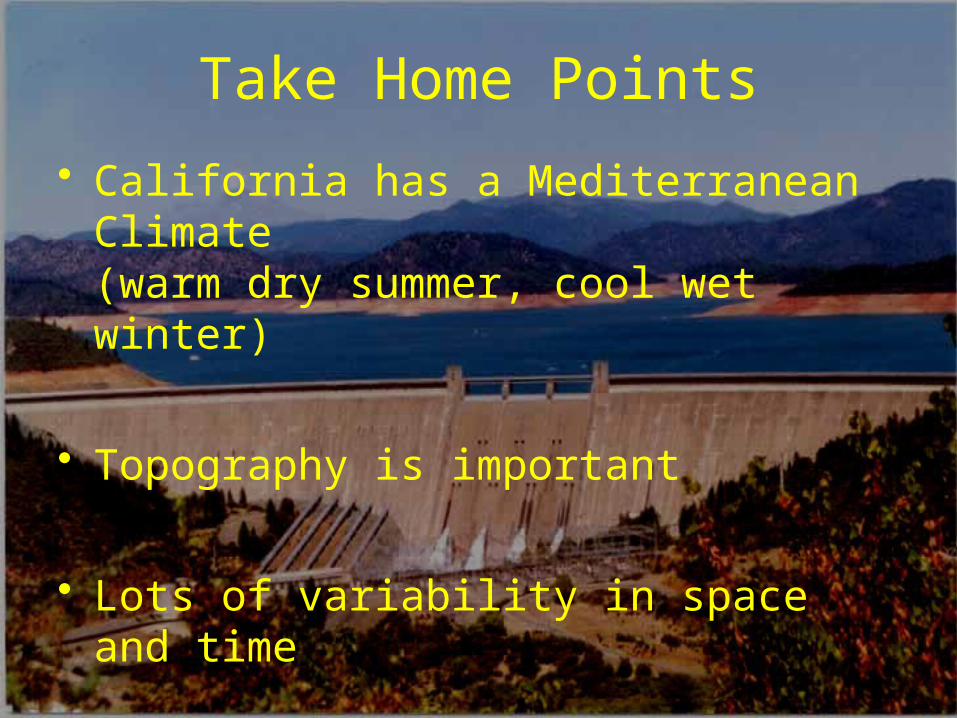
Take Home Points
• California has a Mediterranean Climate(warm dry summer, cool wet winter)
• Topography is important
• Lots of variability in space and time
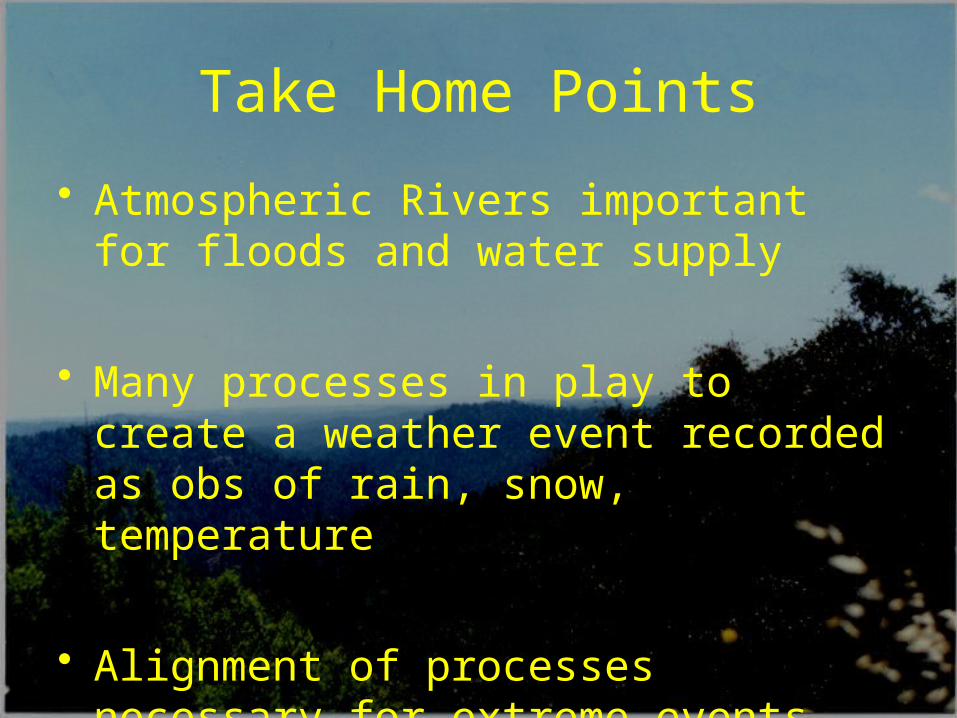
Take Home Points
• Atmospheric Rivers important for floods and water supply
• Many processes in play to create a weather event recorded as obs of rain, snow, temperature
• Alignment of processes necessary for extreme events