an overview of climate change science
TRANSCRIPT

An Overview ofClimate Change Science
Amy Snover, PhD
Co-Director, Climate Impacts Group
University of Washington
Climate Science in the Public
Interest
North Cascadia Adaptation PartnershipEverett, WAApril 28, 2011

Weather vs. Climate
• Weather refers to the day-to-day changes in temperature, precipitation, etc. at a specific location.
• Climate refers to the average of these variables over long time periods.
“You pick your vacation destination based on the climate but you pack your bag based on the weather.”
• Individual weather events, especially extreme events, do not prove (or disprove) climate change.

Climate Change vs. Climate Variability
• Climate change - refers to the long-term change (e.g. decades to centennial scale) in climate.
• Also occurring: natural seasonal to decadal climate variability, e.g., El Niño and La Niña.
• Natural variability can affect temperature, precipitation, snowpack, sea level, storm patterns, etc. at varying time scales.
El Nino Rains Flood California -- El Nino storms brought
flooding to Clearlake, California on March 1, 1998.
Credit: Dave Gatley/FEMA

GLOBAL CLIMATE CHANGE
Setting the Stage for Pacific Northwest Climate Change

Science of climate change
The scientific understanding comes from thousands of peer-reviewed scientific papers
Intergovernmental Panel on Climate Change (IPCC)
Major IPCC reports in 1990, 1996, 2001, 2007
Reports are produced by hundreds of authors
Conclusions (2007 report):
“An increasing body of observations gives a collective picture of a warming world and other changes in the climate system.”
“There is new and stronger evidence that most of the warming observed over the last 50 years is attributable to human activities.”
Other assessments: US National Assessment, NAS America’s Climate Choices, CIG regional assessments

Four main points
1. There is a natural greenhouse effect
2. Humans are increasing the greenhouse effect by adding greenhouse gases to the atmosphere
3. Effects of a changing climate are already apparent
4. There is very likely much more global warming to come

Greenhouse gases (water vapor, CO2, CH4, N2O) play a
critical role in determining global temperature
Rapid increases in greenhouse gases are
changing this natural balance

Carbon-dioxide concentrations
• Seasonal changes driven by the “breathing” of the biosphere have been riding on top of a rising trend
source - http://www.esrl.noaa.gov/gmd/ccgg/trends/

Industrial revolution and the atmosphere
The current concentrations of key greenhouse gases,
and their rates of change, are unprecedented in the last 10,000 years.
Carbon dioxide Methane Nitrous Oxide

Current concentrations are higher
than any time in at least the past
~780,000 years
~70% of CO2 emissions come from fossil fuel burning
From a long term perspective, these changes are enormous
CO2 over the last 160,000 years
2010
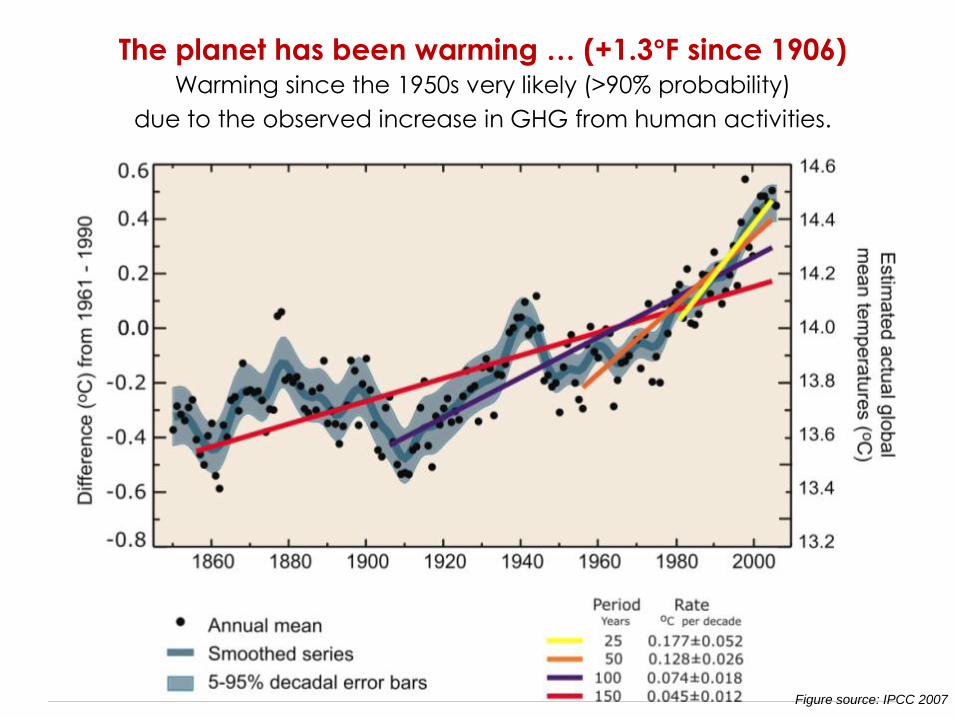
The planet has been warming … (+1.3°F since 1906)Warming since the 1950s very likely (>90% probability)
due to the observed increase in GHG from human activities.
Figure source: IPCC 2007

There is a pattern to the past century’s warming
Globally averaged, the planet is about 0.75°C warmer than it was in 1860, based
upon dozens of high-quality long records using thermometers worldwide, including
land and ocean.
(IPCC 2007)

Natural Climate Influences Human Climate Influences
All Climate Influences
The understanding of anthropogenic
warming and cooling influences on
climate has improved since the Third
Assessment Report (TAR), leading to
very high confidence that the globally
averaged net effect of human
activities since 1750 has been one of
warming, with a radiative forcing of
+1.6 [+0.6 to +2.4] W m-2. (spm 2007)

Summary of evidence for a human-contribution to recent warming
Rate of warming appears to be unusually rapid
Pattern of change matches that expected from increasing greenhouse gases
Solar, volcanic forcing would have led to cooling in the past ~30 years

Evidence of change is increasingly visible throughout Earth’s natural systems
Observed 20th century change

Average annual
temperature increased
+1.5F in the PNW
during the 20th century 3.6 °F
2.7 °F
1.8 °F
0.9 °F
Cooler Warmer
Mote 2003(a), updated
Temperature Trends (°F per century), since 1920
Key Trends in PNW Climate
April 1 snowpack
decreased, with losses
of 30-60% at many
individual stations in the
PNW (1950-2000)
Decrease Increase
Mote, P.W. 2003.
Similar snowpack
declines are seen
throughout the
western United States
Decrease Increase
Mote et al. 2005

Trends in Spring Runoff
Stewart et al. 2005 Stewart I.T., Cayan D.R., Dettinger M.D., 2005: Changes toward earlier streamflow timing across western
North America, Journal of Climate, 18(8):1136-1155.
Peak of
spring runoff
is moving
earlier into
the spring
throughout
western U.S.
and Canada

Boulder Glacier
Glacier National Park
T.J. Hileman, courtesy of Glacier National Park Archives
1932
Greg Pederson photo, USGS
2005

South Cascade Glacier
North Cascades National Park
Photos courtesy of Dr. Ed Josberger, USGS Glacier Group, Tacoma, WA
19742004
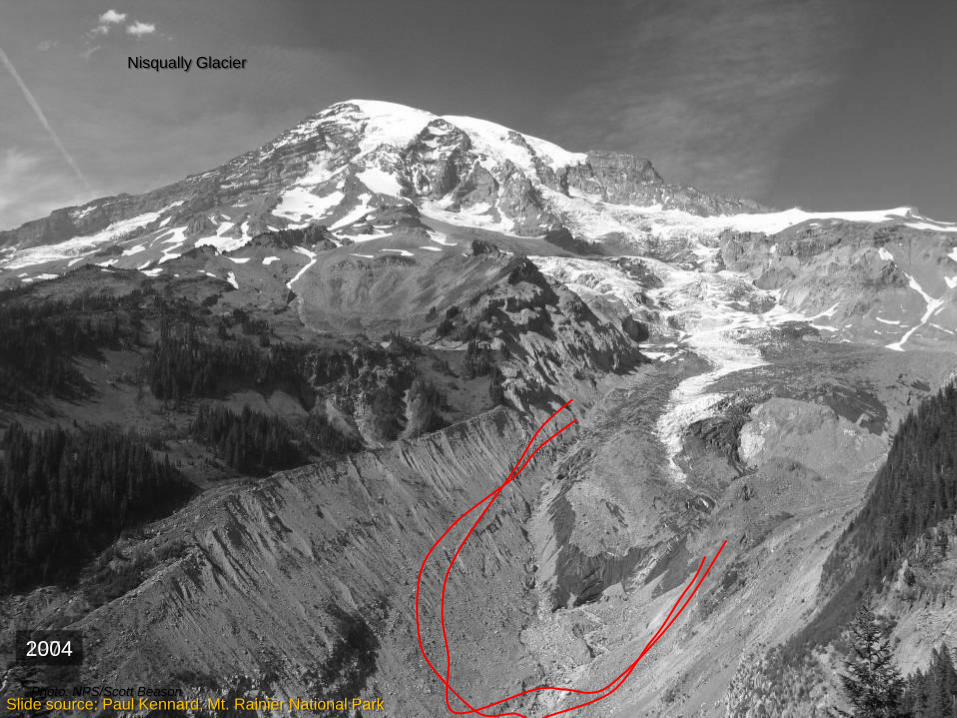
Photo: NPS/Scott Beason
Nisqually Glacier
Slide source: Paul Kennard, Mt. Rainier National Park

Evidence of change is increasingly visible throughout Earth’s natural systems
Observed 20th century change

http://www.arborday.org/media/mapchanges.cfm
Changes in USDA Hardiness Zones
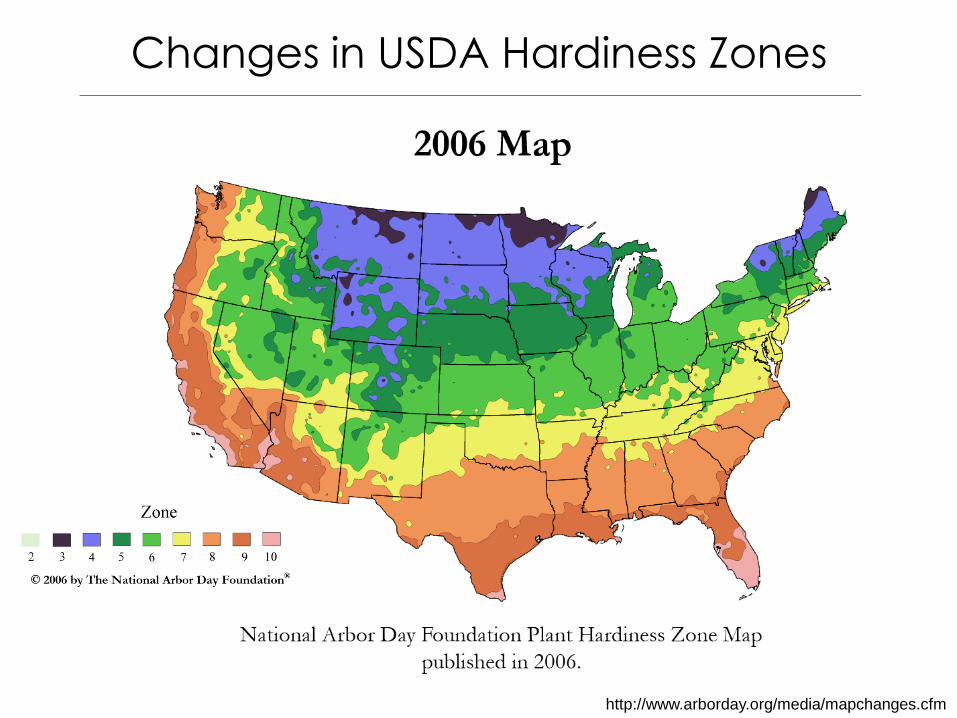
http://www.arborday.org/media/mapchanges.cfm
Changes in USDA Hardiness Zones


Review of Past Changes
• CO2 and other greenhouse gases warm the planet
• Human activities are changing the atmospheric concentrations of greenhouse gases (CO2 up ~30%)
• Extensive and wide-spread evidence that the earth is warming; we are already seeing the first clear signals of a changing climate.
• The planet warmed ~0.8°C from 1860-2009, in part due to human activities.
• Observed changes in the western US (increased temperature, decreased snowpack, changes in timing of snow accumulation and streamflow) partly due to anthropogenic forcing

Race Rocks sea surface
temperature: 1921-2009
Surface
temperature
variations for Puget
Sound as a whole
closely track those
at Race Rocks
Note the large
year-to-year
changes, decadal
cycles, and on
longer-term
warming trend
1941
1958
1983
1998
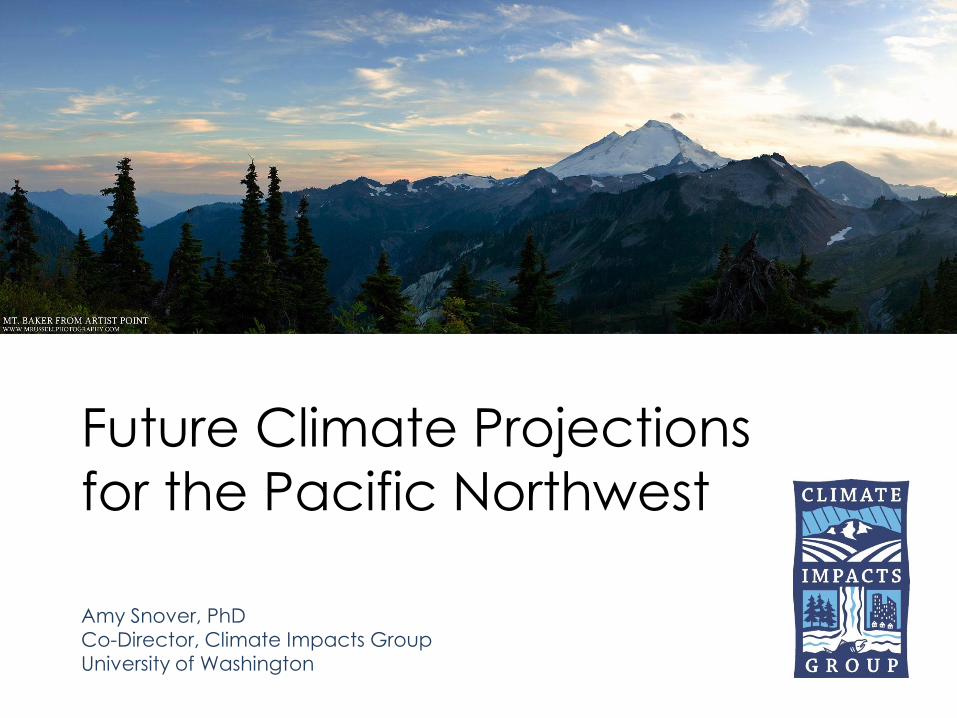
Future Climate Projections
for the Pacific Northwest
Amy Snover, PhD
Co-Director, Climate Impacts Group
University of Washington

A chain of assumptions and models are needed for
future climate change scenarios:
1. Start with a greenhouse gas emissions scenario
2. Choose a global climate model –
3. Downscale the coarse resolution climate model
output
Projecting Future Climate

Projecting Future Climate:
1. How much CO2 will be emitted?
40 emissions scenarios are used to “drive” global climate models.
Different scenarios result in different climate change projections.
Figure source: IPCC 2001, Summary for Policy Makers
Current emissions
are in the current
range of the A1B
scenario.

Karl & Trenberth (2003) Science
Projecting Future Climate:
2. Pick a climate model

Figure source: IPCC 2007 WG1, Summary for Policy Makers
IPCC “best
estimate” range
of global-scale
warming by the
2090s:
3.2°F-7.2°F
(likely range: 2-11.5°F)
Projected Increases in
Average Global Temperature

~200 km(~125 mi)resolution
~5 km(~3 mi)resolution
Projecting Future Climate:
3. Downscale to obtain regional information

Projected Increases in
Annual PNW Temperature* Relative to 1970-1999 average
Mote and Salathé, 2009
°F°C
Historic
2020s +2.0°F (1.1-3.4°F)
2040s +3.2°F (1.6-5.2°F)
2080s +5.3°F (2.8-9.7°F)

Historic
Mote and Salathé, 2009
Projected Increases in
Annual PNW Precipitation* Relative to 1970-1999 average
2020s +1% (-9 to 12%)
2040s +2% (-11 to +12%)
2080s +4% (-10 to +20%)
Most (not all) models project wetter autumns & wintersand drier summers

21st century PNW climate scenarios
relative to past variability

What About Changes in
Extreme Precipitation?
Simulations generally indicate
increases in extreme
precipitation over the next 50
years, however:
– The projections vary by
model and region, and
– Actual changes may be
difficult to distinguish from
natural variability.
Salathé et al. 2009, Rosenberg et al. 2009)

Coasts
• Global SLR: 7-23” by 2100
• Medium estimates of SLR for 2100:+2” for the Olympic Peninsula +11” for the central coast+13” for Puget Sound
• Higher estimates (up to 4 feet by 2100 in Puget Sound) cannot be ruled out at this time.
Rising sea levels will increase the risk of flooding, erosion, and habitat loss along much of Washington’s 2,500 miles of coastline.
3”
6”
30”
50”
2050 2100
13”
40”
20”
10”
6”
Projected sea level rise (SLR) in Washington’s waters
relative to 1980-1999, in inches. Shading roughly indicates
likelihood. The 6” and 13” marks are the SLR projections for
the Puget Sound region and effectively also for the central
and southern WA coast (2050: +5”, 2100: +11”).

Climate change may be manifest partly as a change
in the relative frequency of natural variations (e.g., El
Niños vs. La Niñas)
Likely changes with ENSO are very uncertain
It currently isn’t clear if ENSO will be stronger, weaker, or
unchanged in a warmer future! (see Collins et al 2010, Nature
Geosciences)
Regardless of nature of future change, climate
variability will continue
Climate change and natural variations

°F
°C
Historic
Prepare for a bumpy ride…

All climate model projections for the future will be
wrong
Emissions scenarios are stories about what might happen;
informing climate system models with these stories yields
“scenarios”, not predictions, for future climate
There are good reasons for screening GCM scenarios,
using weighted average ensembles, selecting specific
methods for downscaling, and choosing specific tools
for impacts assessments
Even with all these careful steps, you still end up with
scenarios about future climate
Some Closing Thoughts

Many new scenarios are being generated for the IPCC’s 5th Assessment (due in 2013)
• A torrent of climate model scenarios will be released over the next few years!
• One strategy for making use of these scenarios is to first focus on a “bottom-up” vulnerability assessment

Evaluate a system’s vulnerability to climate by
evaluating component parts:
Vulnerability =
(sensitivity x exposure)/adaptability
Climate change scenarios provide information only
about exposure to future climate events; the system
you’re interested in can tell you about adaptability
and sensitivity
The Vulnerability Assessment Approach

The vulnerability assessment approach (at the least)
compliments a “top-down” impacts assessment
approach
In my opinion, this “bottom-up” framework is superior
for many reasons including an explicit recognition
that there are and will always be many future
scenarios to choose from, and our ability to narrow
down future climate uncertainties is sharply limited.
The Vulnerability Assessment Approach

The Climate Impacts Group
www.cses.washington.edu/cig

http://www.hydro.washington.edu/2860/
HydrologicProducts

Available PNW Scenarios (80!)
2020s – mean 2010-2039; 2040s – mean 2030-2059; 2080s – mean 2070-2099
Downscaling Approach
A1B
Emissions
Scenario
B1
Emissions
Scenario
Hybrid Delta
hadcm
cnrm_cm
ccsm3
echam5
echo_g
cgcm3.1_t4
7 pcm1
miroc_3.2
ipsl_cm4
hadgem1
2020s 10 10
2040s 10 10
2080s 10 10
Transient
BCSD
hadcm
cnrm_cm
ccsm3
echam5
echo_g
cgcm3.1_t4
7 pcm1
1950-
2098+7 7
Delta Methodcomposite
of 10
2020s 1 1
2040s 1 1
2080s 1 1

Resilience to a changing climate requires recognizing and updating the expectations about climate embedded in our infrastructure, plans, operations, and decision processes.
The Climate Impacts Group
www.cses.washington.edu/cig

Extreme Events
*Judgmental estimates of confidence by IPCC: very likely - 90-99% chance,likely - 66-90% chance. Source: IPCC SPM 2007

Climate Change Scenarios for the
Pacific Northwest
Mote and Salathé (2009)
All of these scenarios show warming
for the 2040s, but different scenarios
warm at different rates
Most (not all) show increasing
precipitation in winter, spring and
fall, and decreasing precipitation in
summer

Climate model + emissions scenario combinations yield a range of temperature and precipitation
change scenarios
Precipitation change (%)
Tem
peratu
re chan
ge (ºC
)

“Dynamical vs Statistical Downscaling” CCSM3
Statistical Dynamical
%%
Dynamical downscaling redistributes the precipitation changes from the global
models in a more physically realistic way
(Salathè et al. 2010)
2040s-1990s 2040s-1990s

A1B
A2
B1
CO2 Concentrations
A1FI

150-km GCM
High resolution is needed for regional studies
Washington
Oregon
Idaho
Snake Plain
Olympics
• Global Models
Typically have 100-200
km resolution
• Cannot distinguish
Eastern WA from
Western WA
• No Cascades
• No Land cover
differences

150-km GCM
High resolution is needed for regional studies
Washington
Oregon
Idaho
Snake Plain
Olympics
• Global Models Typically have 100-
200 km resolution
• Cannot distinguish Eastern WA
from Western WA
• No Cascades
• No Land cover differences
• Regional Models Typically have 12-
50 km ( resolution
• 12 km WRF at UW/CIG
• Can represent major
topographic features
• Can simulate small extreme
weather systems
• Represent land surface effects
at local scales
12-km WRF