an overview of our regulatory proposal 2015-2020
TRANSCRIPT
An Overview of Our Regulatory Proposal
2015-2020

Today’s topics
2
Our progress, the challenge ahead and how we
compare
Our investment
plans
Questions
Ergon Energy and our service commitments
The price impact
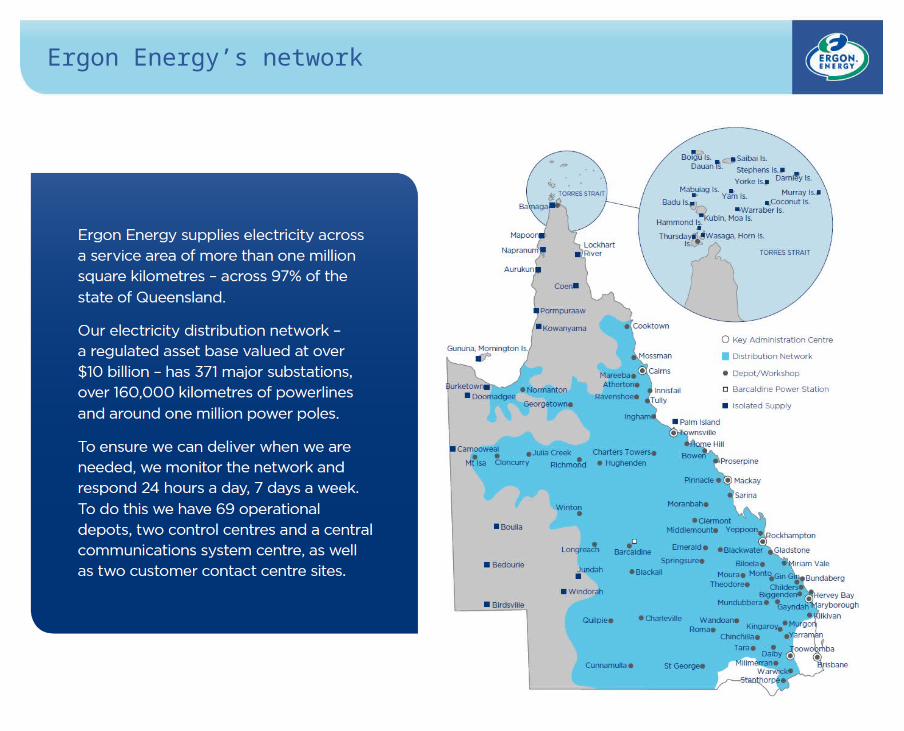
Ergon Energy’s network
3
Ergon Energy’s Drivers…
4
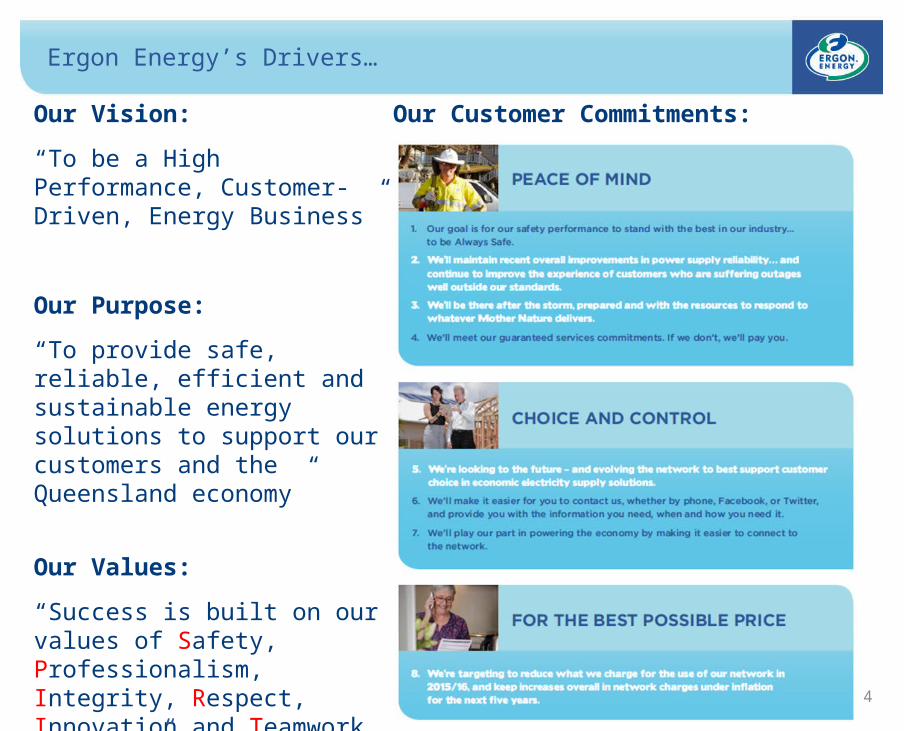
Our Vision:
“To be a High Performance, Customer-Driven, Energy Business”
Our Purpose:
“To provide safe, reliable, efficient and sustainable energy solutions to support our customers and the Queensland economy”
Our Values:
“Success is built on our values of Safety, Professionalism, Integrity, Respect, Innovation and Teamwork – SPIRIT”
Our Customer Commitments:
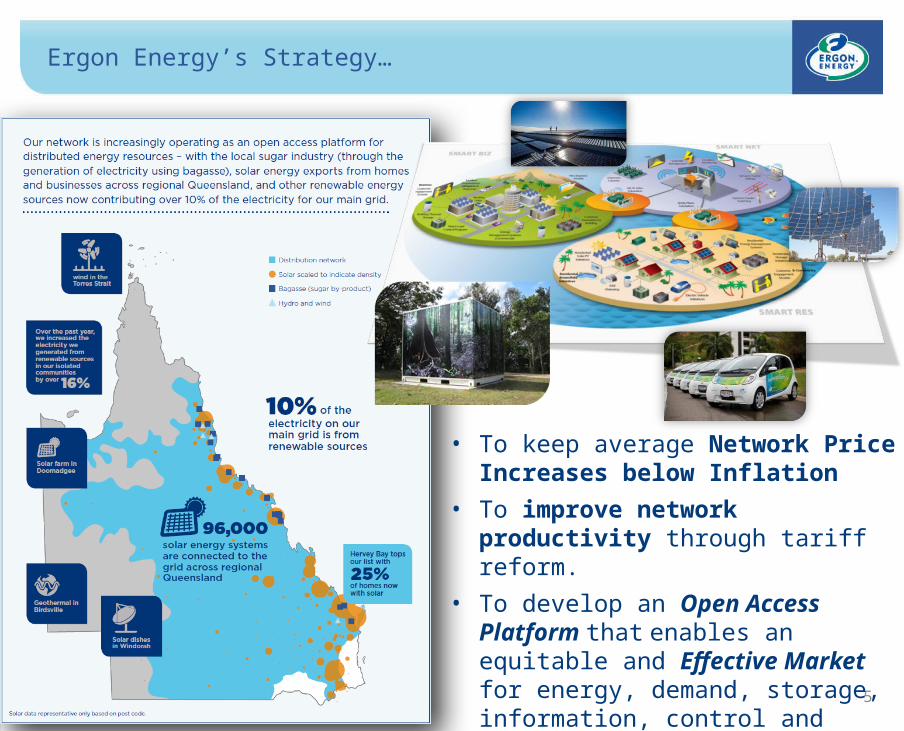
Ergon Energy’s Strategy…
5
• To keep average Network Price Increases below Inflation
• To improve network productivity through tariff reform.
• To develop an Open Access Platform that enables an equitable and Effective Market for energy, demand, storage, information, control and services.
• To deliver Efficient Services.
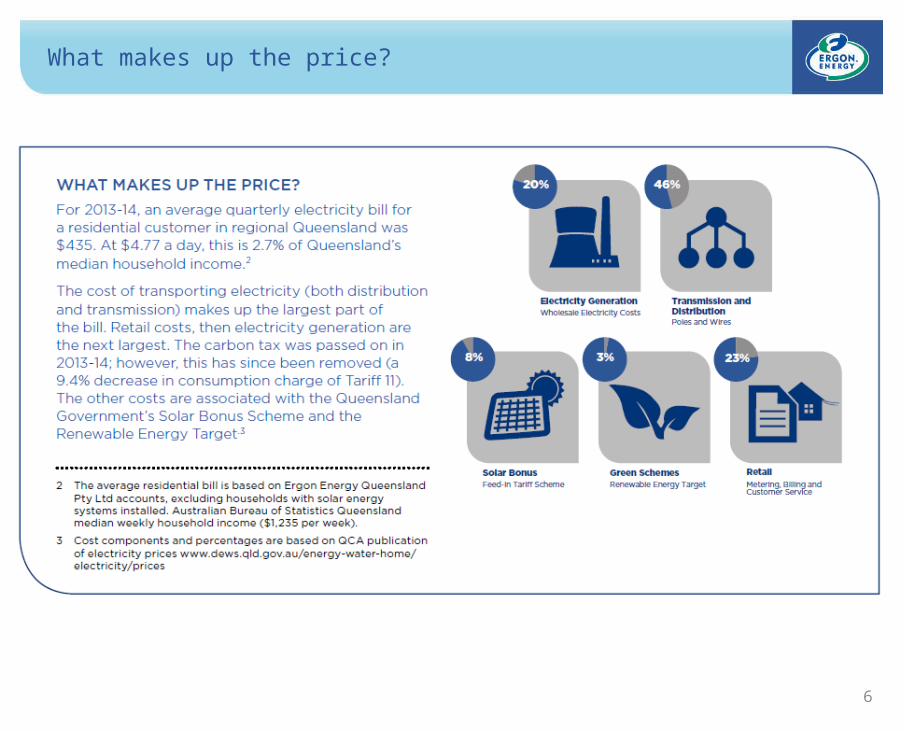
What makes up the price?
6
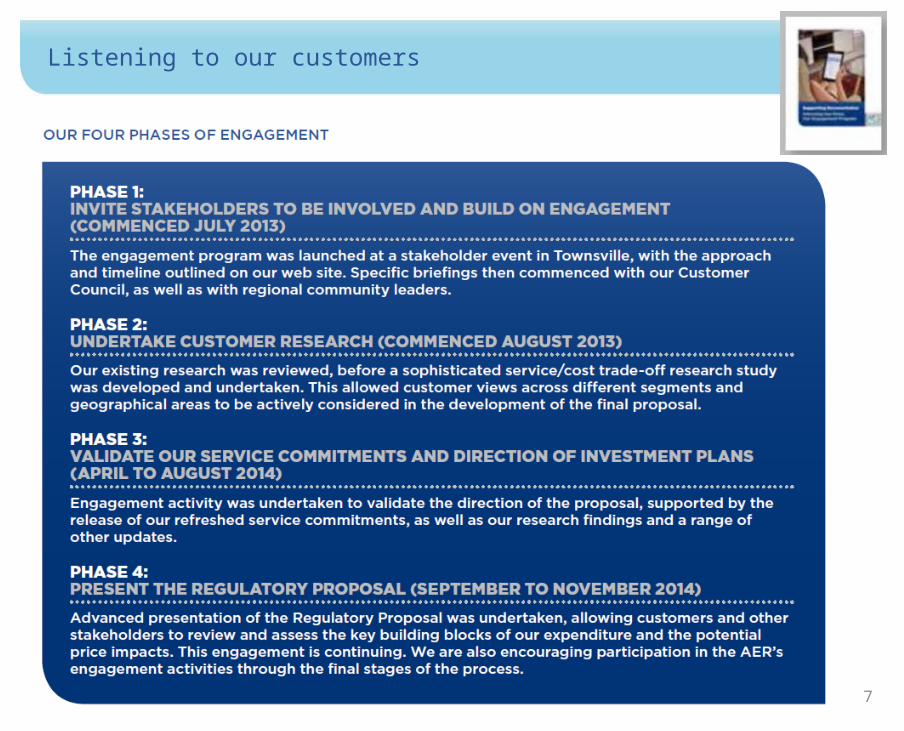
Listening to our customers
7
8
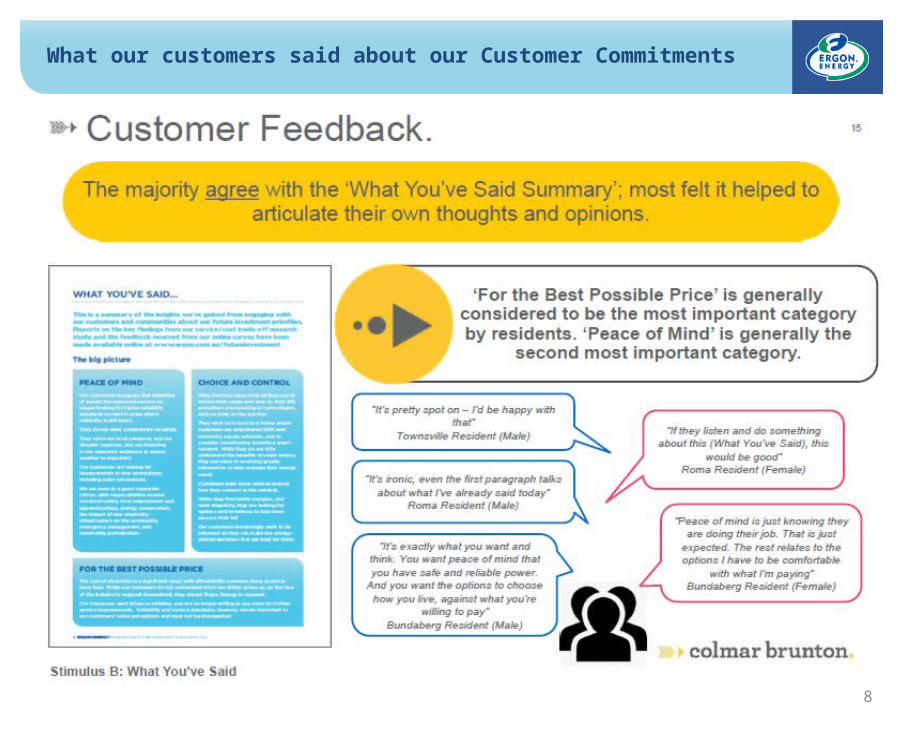
What our customers said about our Customer Commitments
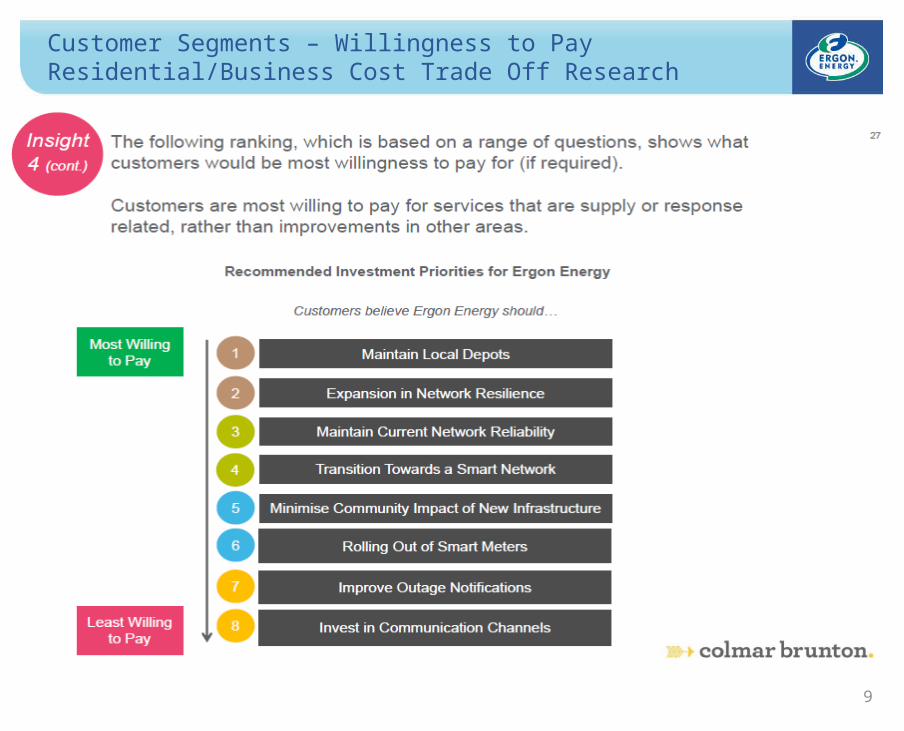
Customer Segments – Willingness to PayResidential/Business Cost Trade Off Research
9
Our progress, the challenge ahead
10
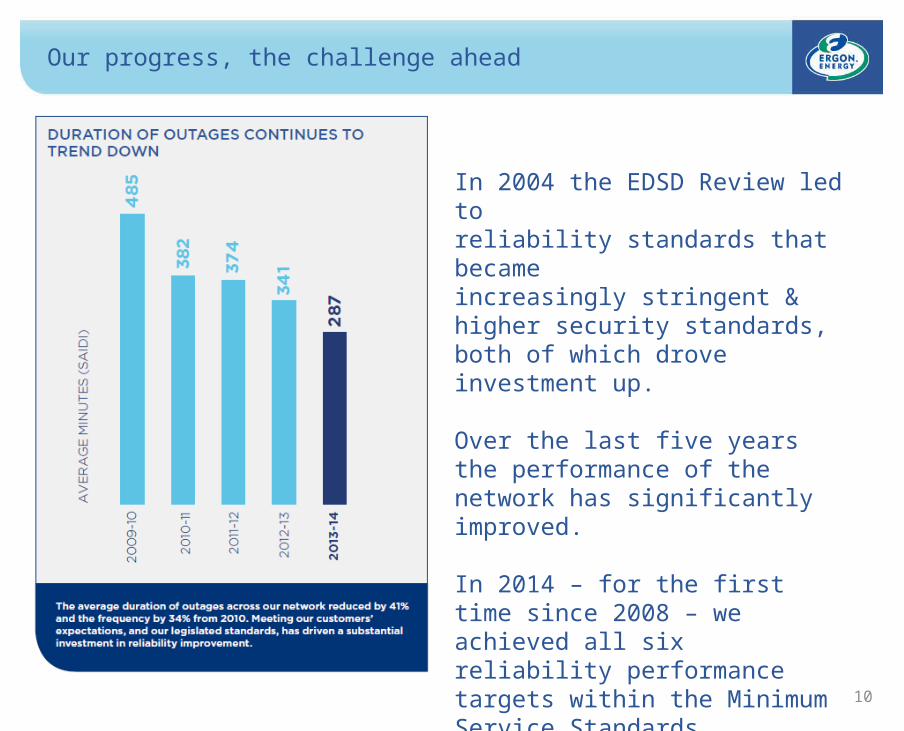
In 2004 the EDSD Review led toreliability standards that becameincreasingly stringent & higher security standards, both of which drove investment up.
Over the last five years the performance of the network has significantly improved.
In 2014 – for the first time since 2008 – we achieved all six reliability performance targets within the Minimum Service Standards.

How Ergon Energy compares
11

How Ergon Energy compares across the NEM
12
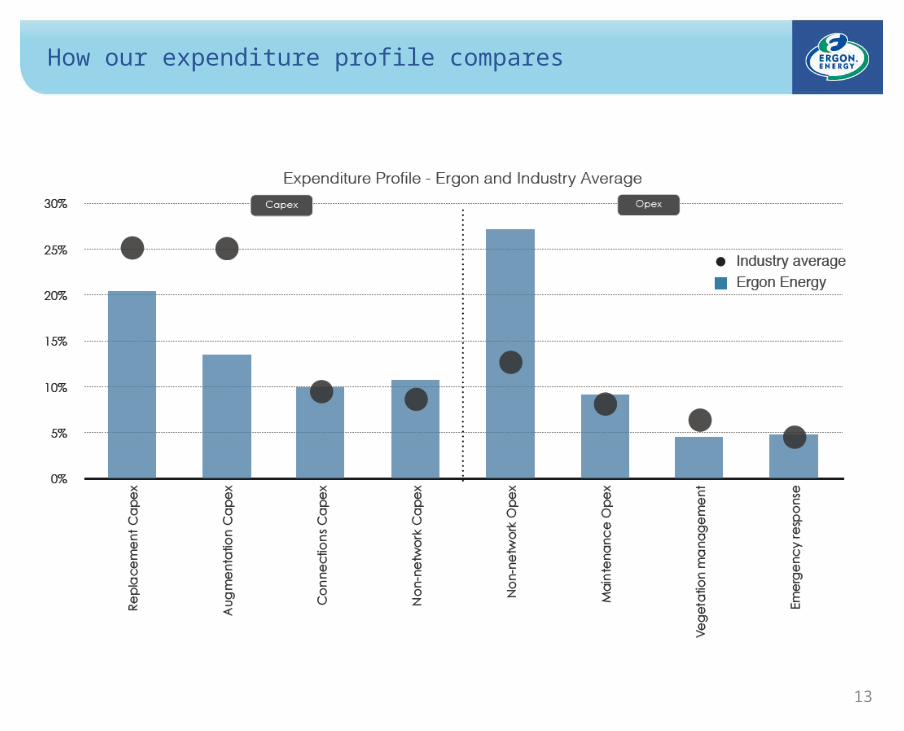
How our expenditure profile compares
13
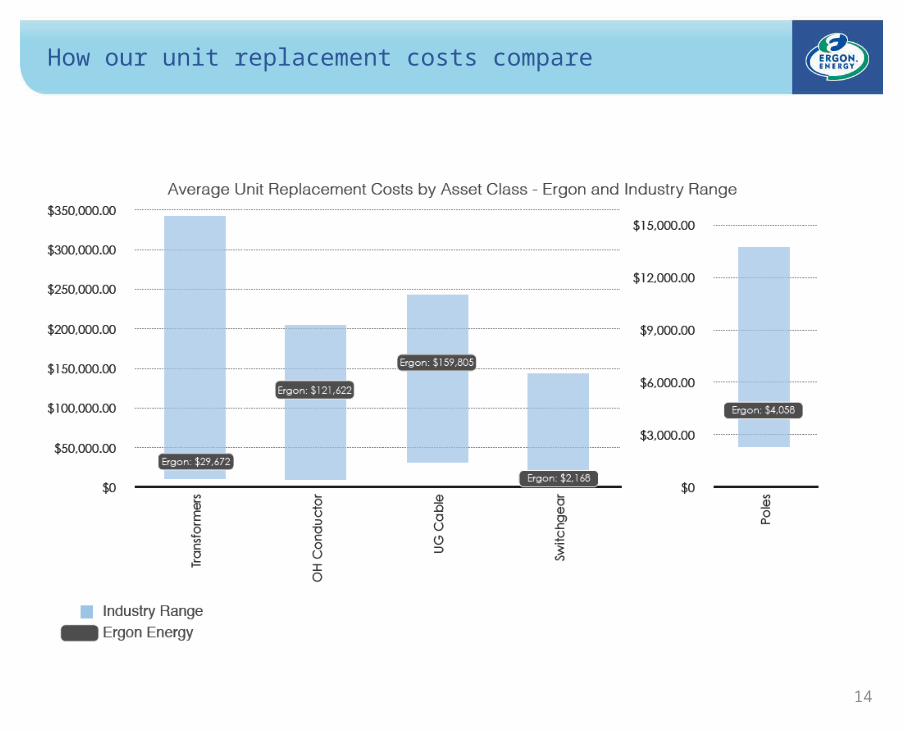
How our unit replacement costs compare
14
A changing growth scenario
15
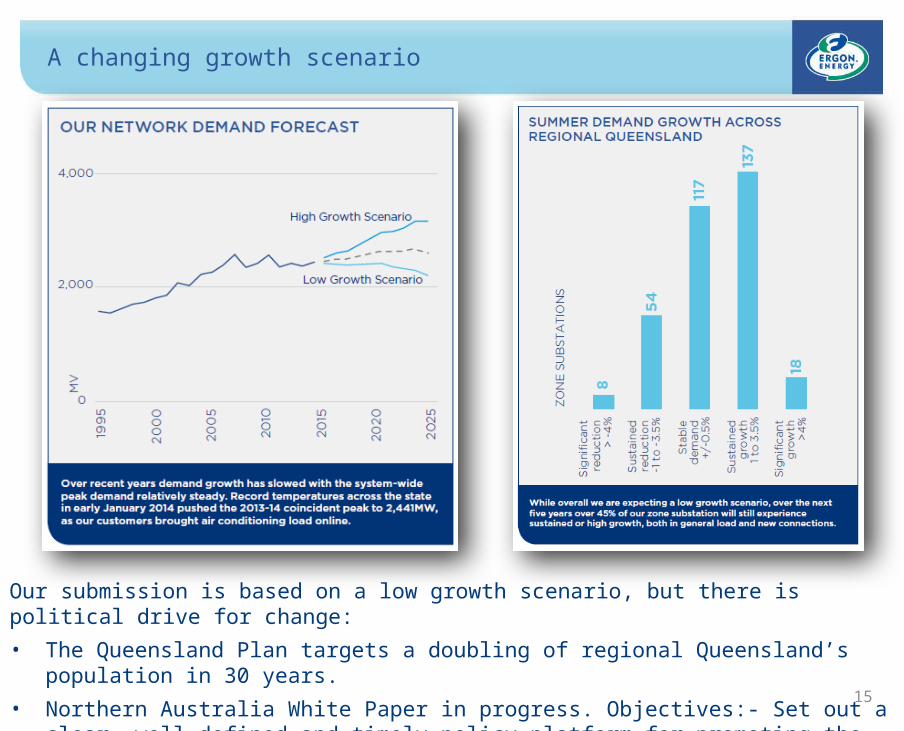
Our submission is based on a low growth scenario, but there is political drive for change:
• The Queensland Plan targets a doubling of regional Queensland’s population in 30 years.
• Northern Australia White Paper in progress. Objectives:- Set out a clear, well-defined and timely policy platform for promoting the development of Northern Australia.
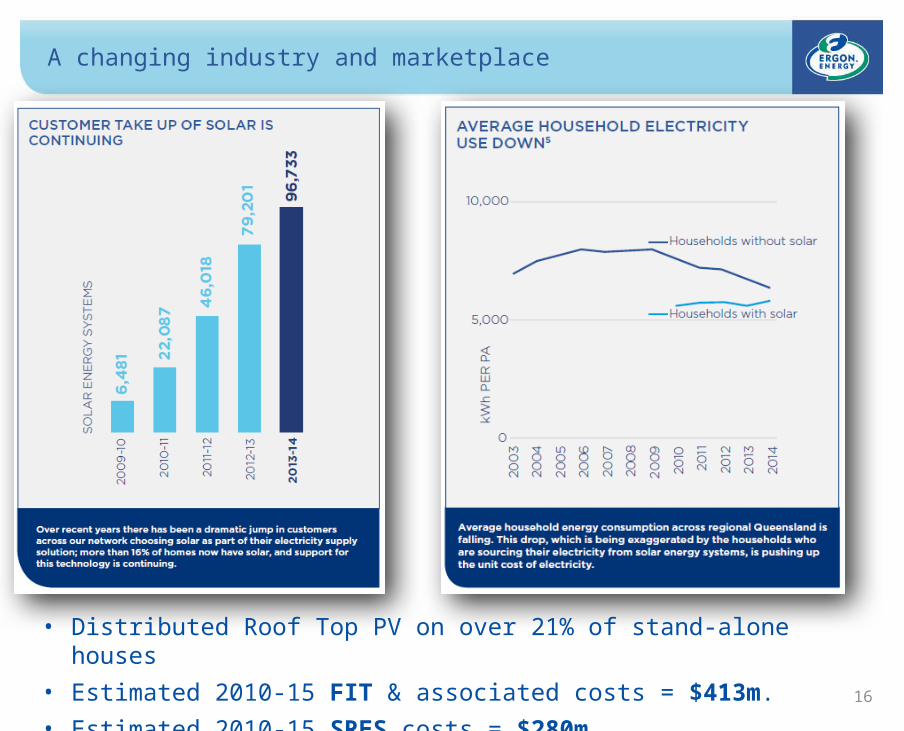
A changing industry and marketplace
16
• Distributed Roof Top PV on over 21% of stand-alone houses
• Estimated 2010-15 FIT & associated costs = $413m.
• Estimated 2010-15 SRES costs = $280m
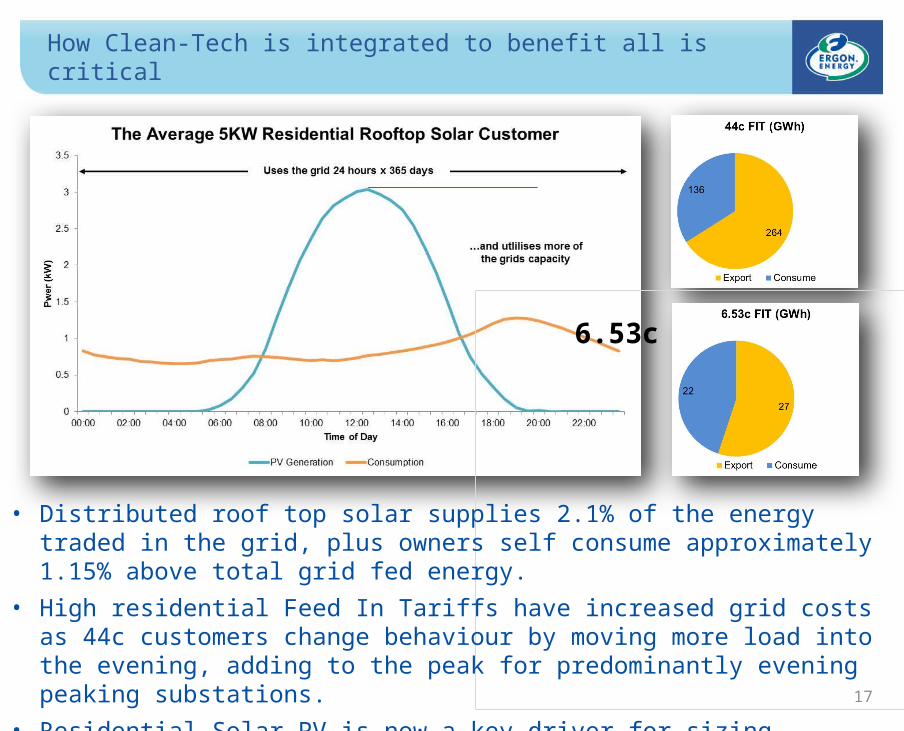
How Clean-Tech is integrated to benefit all is critical
17
6.53c FIT (GWh)
• Distributed roof top solar supplies 2.1% of the energy traded in the grid, plus owners self consume approximately 1.15% above total grid fed energy.
• High residential Feed In Tariffs have increased grid costs as 44c customers change behaviour by moving more load into the evening, adding to the peak for predominantly evening peaking substations.
• Residential Solar PV is now a key driver for sizing infrastructure in residential subdivisions
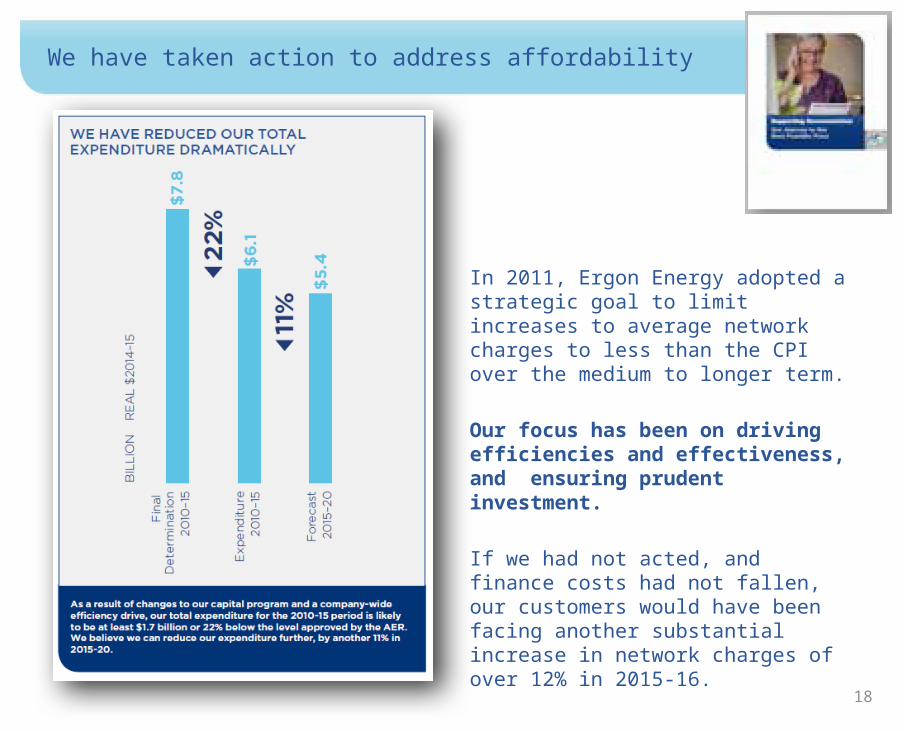
We have taken action to address affordability
18
In 2011, Ergon Energy adopted a strategic goal to limit increases to average network charges to less than the CPI over the medium to longer term.
Our focus has been on driving efficiencies and effectiveness, and ensuring prudent investment.
If we had not acted, and finance costs had not fallen, our customers would have been facing another substantial increase in network charges of over 12% in 2015-16.
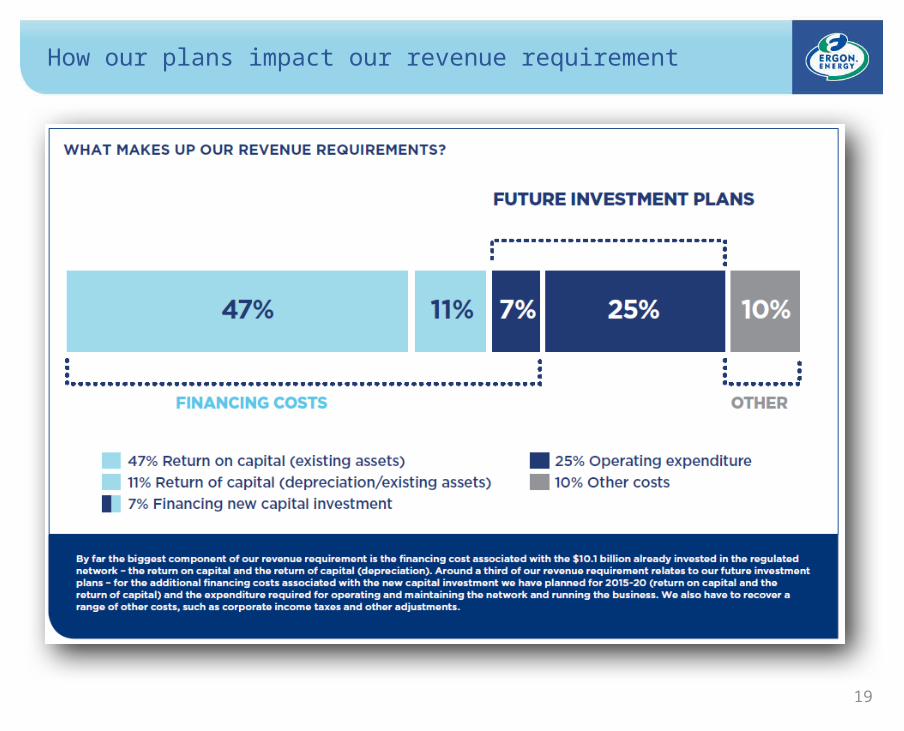
How our plans impact our revenue requirement
19
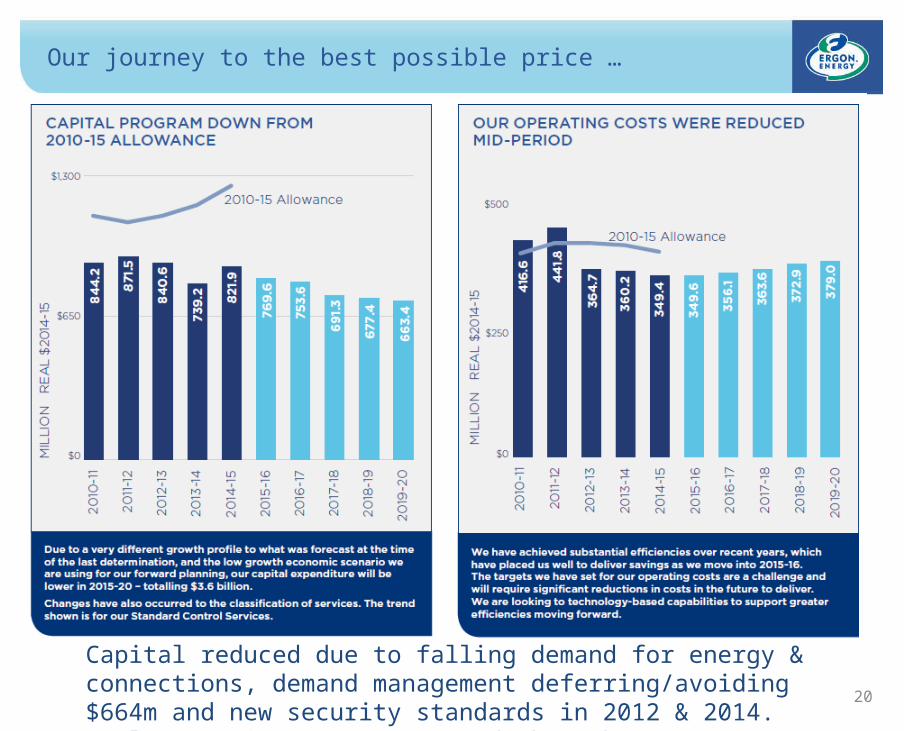
Our journey to the best possible price …
20
Capital reduced due to falling demand for energy & connections, demand management deferring/avoiding $664m and new security standards in 2012 & 2014. Cyclone Yasi costs not passed through.
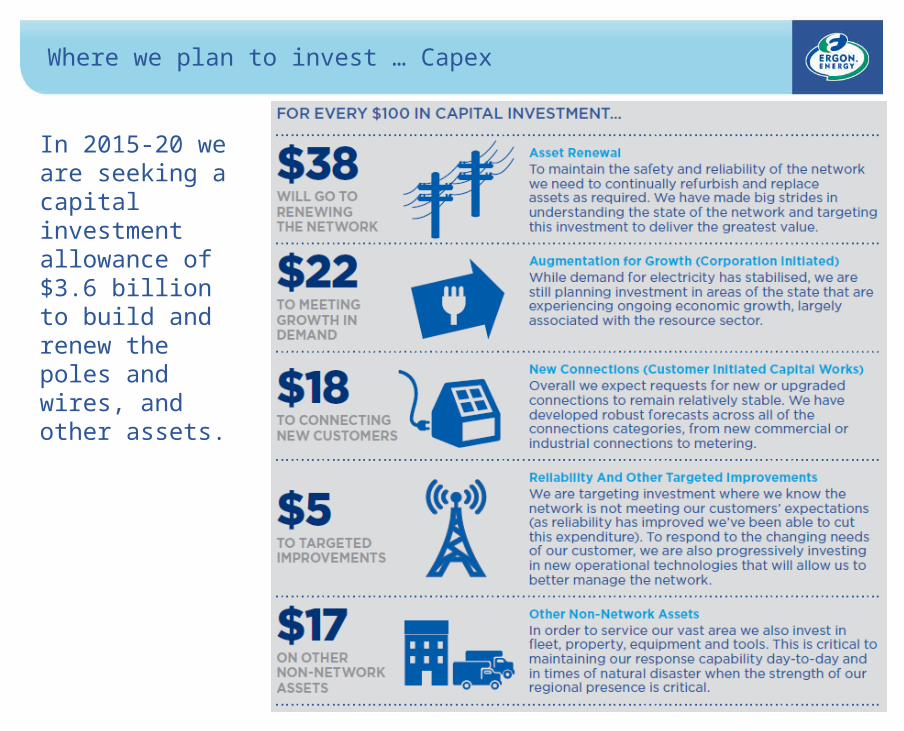
Where we plan to invest … Capex
21
In 2015-20 we are seeking a capitalinvestment allowance of $3.6 billion to build and renew the poles and wires, and other assets.

Maintaining reliability and safety performance…
22
With affordability such a significant issue, and given our improved performance, we have cut our reliability improvement investment.
Safety drivers account for 30% of our proposed asset renewal spend
Replacing assets nearing end of functional life accounts for 70% of our proposed asset renewal spend
We have allocated expenditure to address the performance of up to 45 feeder lines that are consistently underperforming.
We are targeting investment into operational technology and other improvement initiativeslike protection devices and network resilience (spreaders).
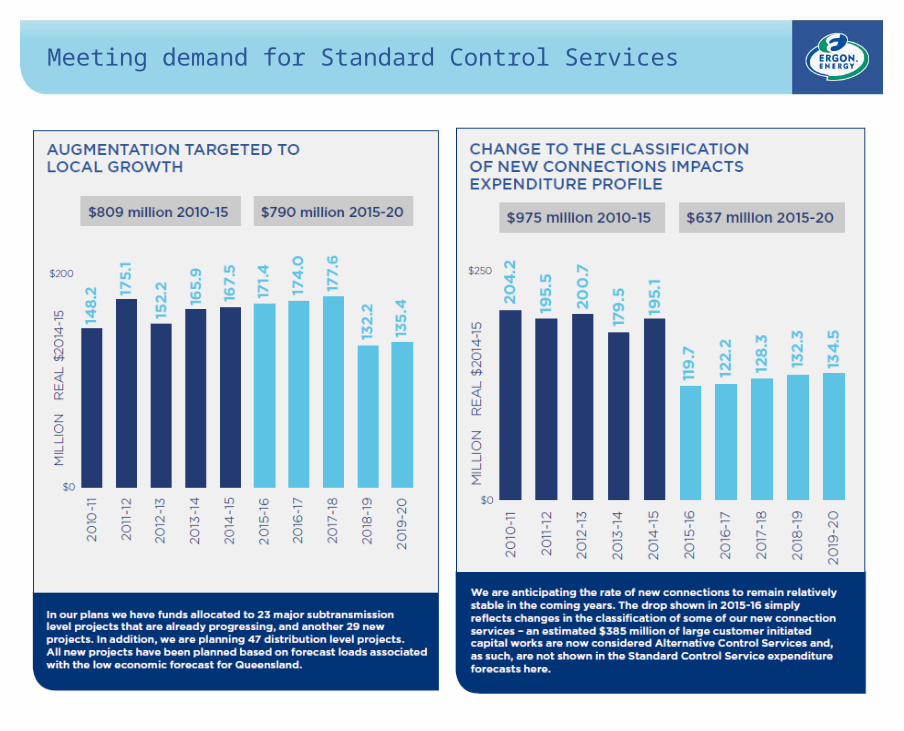
Meeting demand for Standard Control Services
23
24
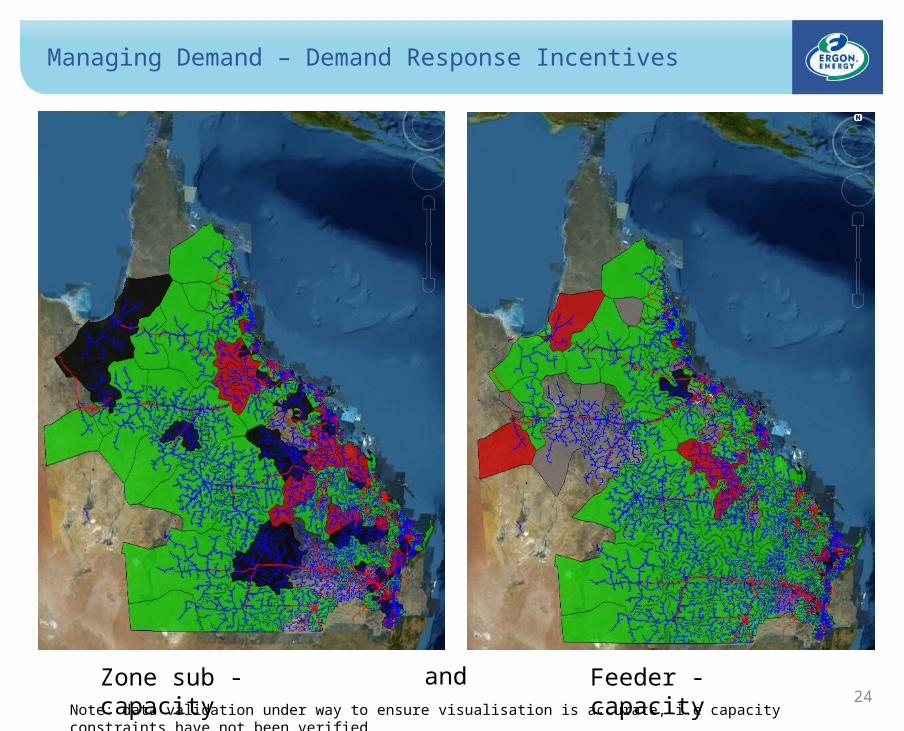
Managing Demand – Demand Response Incentives
Zone sub - capacity Feeder - capacityand Note: data validation under way to ensure visualisation is accurate, i.e capacity constraints have not been verified
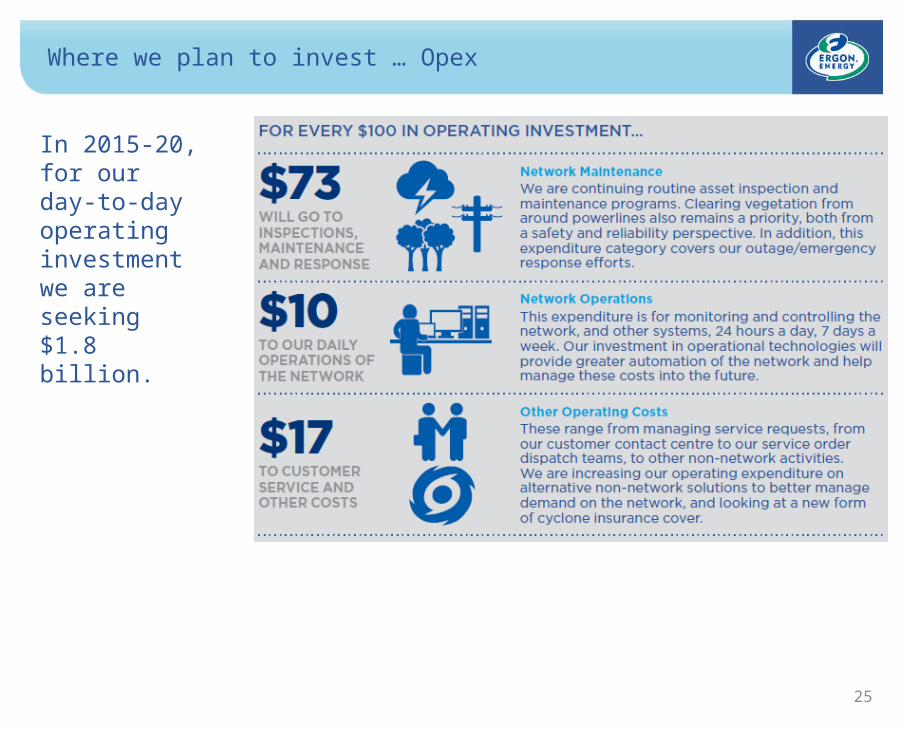
Where we plan to invest … Opex
25
In 2015-20, for our day-to-day operatinginvestment we are seeking $1.8 billion.
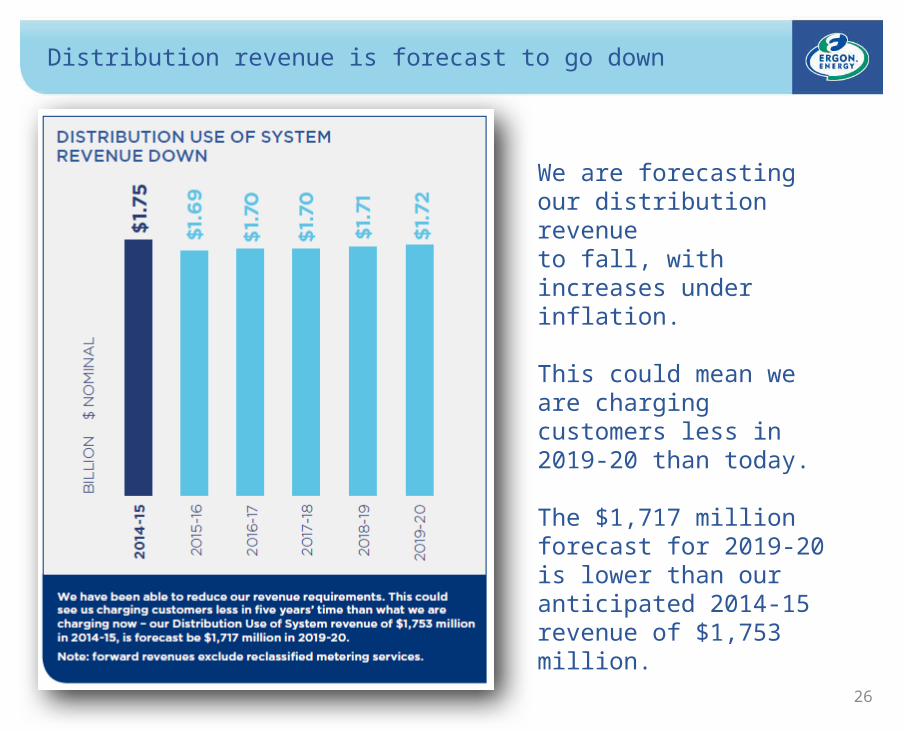
Distribution revenue is forecast to go down
26
We are forecasting our distribution revenueto fall, with increases under inflation.
This could mean we are charging customers less in 2019-20 than today.
The $1,717 million forecast for 2019-20 is lower than our anticipated 2014-15 revenue of $1,753 million.
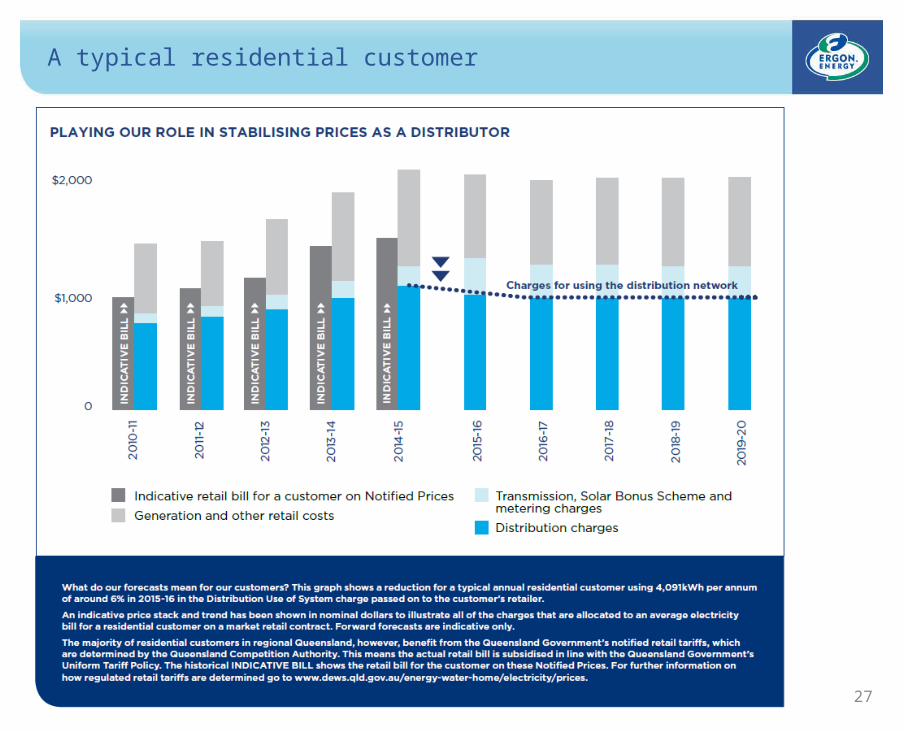
A typical residential customer
27
28
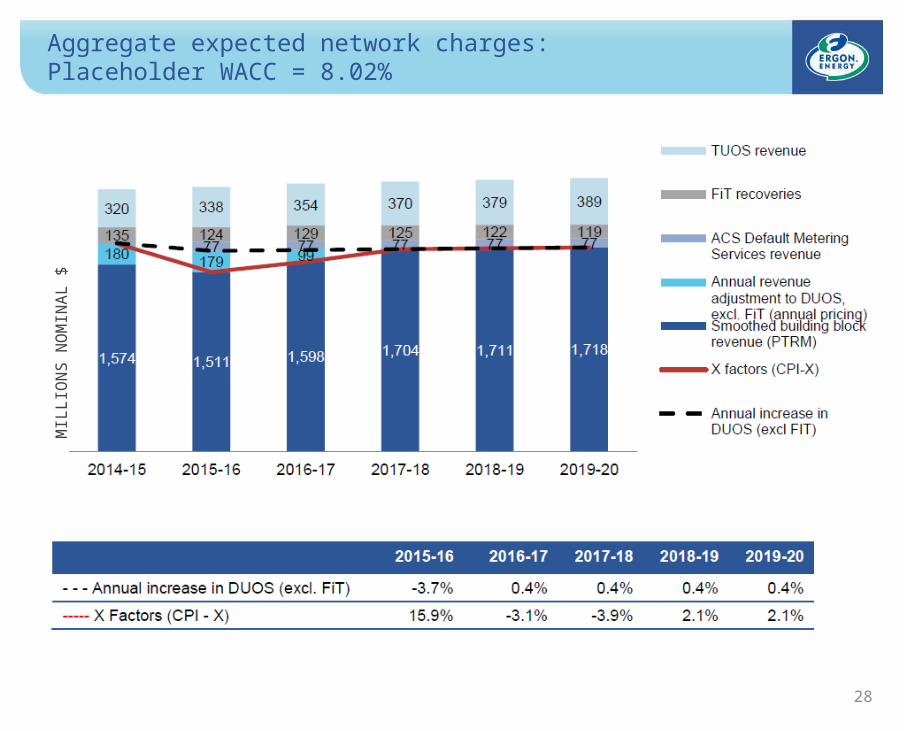
Aggregate expected network charges: Placeholder WACC = 8.02%
MIL
LIO
NS
NO
MIN
AL
$

The document library
29
A suite of documents are available for you to access on our web site:
www.ergon.com.au/futureinvestment
30
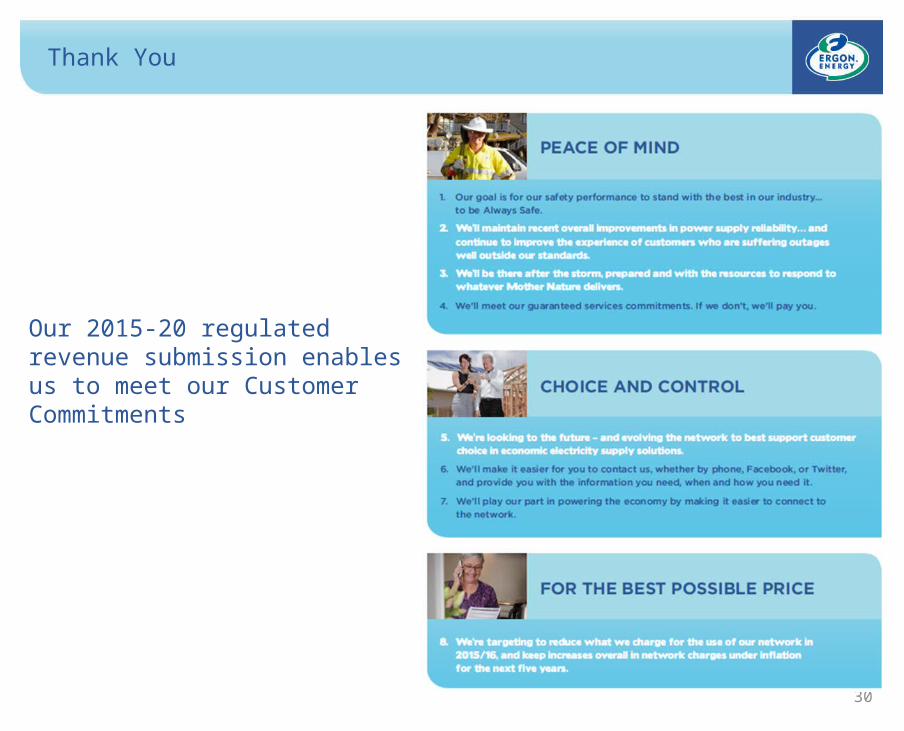
Thank You
Our 2015-20 regulated revenue submission enables us to meet our Customer Commitments