an overview of schools issues in the longfellow · pdf filean overview of schools issues in...
TRANSCRIPT
An Overview of Schools Issues in the
Longfellow Neighborhood
Anne Marie Rollings, Research Intern
Longfellow Community Council
August 31, 2004

2
Neighborhood Planning for Community Revitalization (NPCR) supported the work of the author of this work, but has not reviewed it for publication. The content is solely the responsibility of the author and is not necessarily endorsed by NPCR. NPCR is coordinated by the Center for Urban and Regional Affairs at the University of Minnesota. NPCR is supported by grants from the U.S. Department of Housing and Urban Development's East Side Community Outreach Partnership Center, the McKnight Foundation, Twin Cities Local Initiatives Support Corporation (LISC), the St. Paul Foundation, and The St. Paul. Neighborhood Planning for Community Revitalization 330 Hubert H. Humphrey Center 301 - 19th Avenue South Minneapolis, MN 55455 phone: 612/625-1020 e-mail: [email protected] website: http://www.npcr.org/

3
Table of Contents
Introduction (p.3)
I) Outline Introduction (p. 4)
II) Minneapolis Public Schools District (p. 4) A) Student Enrollment (p. 4) B) Student Demographics (p. 4) C) Student Achievement (p. 5) D) Budget (p. 6) E) Leadership (p. 6)
III) A Brief History of the Schools Issues in Minneapolis and the Longfellow Community A) Open Enrollment (p. 7) B) Community Schools (p. 8) C) NAACP Lawsuit (p. 8) D) Minneapolis Public Schools Marketing Campaign (p. 9) E) Minneapolis Public Schools All-Day Kindergarten Plan (p. 9) F) Minneapolis Renewal of Excess Levy (p. 9) G) Hiawatha Playground (p. 10) H) 2001 Minneapolis Public Schools closures (p. 10) I) East Area River Schools Task Force (p. 11) J) Fall 2003 Building Recommendations for the Neighborhood (p. 12) K) Spring 2004 Proposals (p. 14) L) Howe/Hiawatha Merger Proposal (p. 15) M) River Schools Collective (p. 15) N) Present Community Processes (p. 15)
IV) Schools in the Neighborhood A) Cooper (p. 16) B) Sanford (p. 17) C) Dowling Urban Environment (p. 18) D) Hiawatha (p. 18) E) Howe (p. 19) F) Minnesota Transitions Charter School (p. 19)
V) School Academic Statistics (p. 20)
VI) Research Review A) Charter Schools (p. 24) B) No Child Left Behind (p. 28) C) Community Impact of Losing a School (p. 30) D) Small Schools (p. 30) E) Historic Schools (p. 31) F) Financing Education in Minnesota (p. 32)
VII) Community Values (p. 34)

4
Introduction
The goals of this research were to provide a tool for the community to use
in its discussion of the schools’ issues in the neighborhood and explore the
schools’ issues for the possibility of further research. This research was a
project commissioned by the Longfellow Community Council. As the schools
issues in the Longfellow Community are complicated with many intertwining
issues and a deep history, this project explored some of the issues, but was
not able to provide a complete report of the schools’ issues.
The research focused on several areas that were deemed important to the
neighborhood. The first was compiling a brief history of the schools issues
within Minneapolis and within the Longfellow Community so that people could
frame present issues in their historical context. The second research area
was to provide a brief synopsis of local schools, their enrollments and
demographics and some fair comparison statistics. The third research area
was to provide a research review of several subjects that have affected
Longfellow’s schools, such as charter schools, No Child Left Behind, small
schools, and school finance. The last research area was compiling some of
the community values that shape the schools issues in the neighborhood.
This was done by conducting focus groups consisting of members of the
Longfellow community.
This project will be available for community members to review and use.
Sections of the research will be available on the Longfellow Community
Council’s website, www.longfellow.org. Additional complete copies of the
research will be available in the Longfellow Community Council’s office
5
located at 2727 26th Street South in Minneapolis. A presentation of some of
the findings will be compiled and offered to various community groups.

6
Introduction
A) “The stability of republican form of government depending mainly upon the intelligence of the people, it is the duty of the legislature to establish a general and uniform system of public schools. The legislature shall make such provisions by taxation or otherwise as will secure a thorough and efficient system of public schools throughout the state.” Minnesota Constitution, Article XIII, Section I.
II) Minneapolis Public Schools District (“Facts…, 2004)
A) Enrollments 1) Minneapolis Public School District is the largest school district in the
state with a present enrollment of 43,429 students 2) Changing Enrollments
(a) In the 1990s the school enrollment increased from 40,696 students to 49,046 students largely because of large numbers of immigrants coming into the area (Shah, 2002)
(b) In the 2000s, overall enrollment began to decline (MPS Communications, 2004) (i) The Southside of Minneapolis lost 1120 students from 1999
to 2003 in its schools (MPS Communications, 2004). The school age population from 1990 to 2000 increased by 58 students, but the 5 and younger population decreased by 63 children (US Census, 2000)
(ii) Sharp decline in immigration, especially after the September 11th attacks (Shah, 2002)
(iii) Increased charter school enrollment from 1,621 in 1999 to 2,833 in fall 2002 (Shah, 2003)
(iv) Increased suburban enrollment including the voluntary desegregation program (“Enrollment Shifts,” 2003; MPS Communications, 2004; Shah, 2002 & Shah, 2003) • However, private school enrollment has remained
constant (MPS Communications, 2004) (v) Decrease in birthrate throughout Minneapolis (Shah, 2002) (vi) Argument in the Southside area that enrollment has
declined because: • Lack of good marketing to area schools • Welcome Center misinforming parents about openings in
Longfellow’s schools (Boucher, 2004) • Changes in enrollment area so that some Longfellow
schools do not have as many students in their enrollment area (Davis, 2004)
• Limited Day Care facilities it will bus to and from for area community schools (Boucher, 2004)
B) Student Demographics
1) Present Student Demographics

7
(a) 43% African American (b) 31% Asian, Hispanic, and Native American (c) 26% White American (d) 23% English Language Learners (e) 68% Eligible for free or reduced price lunch (f) 14% Special Education (g) 15% Student inflow
2) Changing Demographics (a) Since the 1980s, the percentages of students of color, English
Language Learners, and students living in poverty has increased sharply (Grow, 1999; MPS Communications, 204 & “Twin Cities…,” 1999)
(b) However, in the last 5 years, the racial distribution of students in the district has stayed relatively constant (MPS Communications, 2004)
C) Achievement 1) 1997 Basic Standards Test Results (first year of testing)
(a) 33% of Minneapolis eighth graders passed the reading test and 36 percent passed the math test, but 24% of African American students passed the reading test and 21% passed the math (Peterson, 1997) (i) However, for non-ELL African Americans, the reading passing
rates were 32% and 21% for math with 7% the ELL African American passing their reading tests and 6% passing their math tests Minneapolis,” 2004)
(ii) Although this was the first year of testing for the Basic Standards test, which could have skewed results, the second year of testing only showed slight gains with 30% of African Americans passing the reading test and 19% passing the math test (“Minneapolis,” 2004)
(iii) Many mad because $500 million has been spent in past six years to help disadvantaged students, but the results still show that they are failing (Peterson, 1997)
2) Since 1997, test scores in Minneapolis Public School have increased dramatically; some increased by more than 20% and attendance and graduate rates have increased (MPS Communications, 2004 & Shah, 2001) (a) In 2003, 55 percent of Minneapolis eighth graders passed the
reading test and 47 percent passed the math test (b) In 2003, 44 percent of African American eighth graders passed
the reading test and 31% passed the math test (“Minneapolis,” 2004)
(c) The ELL passing rates are significantly lower than the non-ELL students in their ethnic group. For example, 22% of ELL African Americans passed the reading test and 19% passed the math tests (“Minneapolis,” 2004)
8
(d) There still is a large achievement gap between white students and African American and American Indian students (Shah, 2000)
(e) There is a large disciplinary gap between white and minority students as 3 times as many black students are suspended as white students (Shah, 2001)
(f) None of the Longfellow area schools has been on the endangered school list, which is a list of schools that are not showing adequate student progress and learning (Shah, 2000 & Shah, 2001)
D) Budget
1) In 1982, the district closed 18 schools and made huge budget cuts in a time of decreased enrollment (Shah, 2002)
2) In the 1990s due to increase enrollment, the Minneapolis Public Schools were building and expanding to accommodate the increasing enrollment and were in good financial position (Shah, 2002)
3) In the 2000s, the Minneapolis public schools are again making budget cuts (Hokkanen, 2001) (a) 2001-2002, cut $25 million (Hokkanen, 2001 & Shah, 2002) (b) 2002-2003, cut $31.5 million (O’Brien, 2002 & Shah, 2001) (c) 2003-2004 cut $30 million, then cut $870,000 in January 2004
(Nathanson, 2004) (d) 2004-2005 presenting cutting $32 million (Brandt, 2004)
4) Why is this happening (a) Lack of funding at state level for public education as the state
per pupil aid has remained flat for 6 of the last 10 years (Brandt, 2004; Cecconi, 2004; Shah, 2002 & Stoeckel, 2000)
(b) Student enrollment declines. As the population of the district decreases, so does the money as it is allocated on a per pupil rate (Brandt, 2004 & Shah, 2002)
(c) Increased costs of utilities, transportation, health benefits, educating immigrant and ELL students and special education needs (Hokkanen, 2001) (i) ELL money is only given to districts to provide ELL students
with ELL classes for 5 years, which is no enough time for them to learn academic English, and does not take into effect the costs of educating students that have had no prior formal education (Cecconi, 2004)
E) Leadership
1) Superintendent (a) Superintendent is responsible for carrying out the school board’s
policies and is the chief executive officer. He/she is responsible for being the professional advisor to the School Board, preparing a budget, recommending facilities and learning materials to the

9
Board, and directing expenditures in accordance to the budget (MPS Communications, 2004)
(b) Carol Johnson (i) Superintendent from 1997 to 2003 (ii) Carol Johnson is known for implementing middle school
reform and creating small learning communities into the high schools, which have improved attendance, promotion, and discipline (Associated Press “Minneapolis…”, 2003)
(iii) In July of 2003, Carol Johnson accepted a position at Memphis, her hometown state (Associated Press “Minneapolis…”, 2003)
(c) David Jennings (i) First, appointed chief operating officer in December 2001
because Carol Johnson thought the district needed his business experience in a time of budget cuts (Grow, 2001)
(ii) After Carol Johnson left suddenly for Memphis in summer of 2003, Jennings took over as interim superintendent of Minneapolis Public Schools (Sturdevant, 2003)
(iii) On September 23rd, 2003, Jennings was named superintendent of Minneapolis Public Schools, which allowed the board to forgo a costly search for another candidate (Shah, 2003)
(iv) Jennings turned down the job for superintendent after a small group of black community members sharply criticized the hiring of Jennings because of his lack of education and not following the hiring process (Bentley, 2003)
(d) Thandiwe Peebles: Current Superintendent since July 2004 2) School Board
(a) Responsible for selecting superintendent and overseeing the district’s budget, curriculum, personnel and facilities (MPS Communications, 2004)
(b) School board members are selected on a citywide basis, which means that there is not a particular school board member that represents a particular neighborhood (MPS Communications, 2004) (i) This has been criticized because it reduces the accountability
any one school board member has to a particular neighborhood and does not give people a contact person on the school board to contact them about issues
(ii) City of Minneapolis has no direct authority over the school board nor does the school board have any direct taxing authority (MPS Communications, 2004)
(c) The school board members receive an $800 a month stipend for their services (Grow, 1998)
(d) The school board has no power over larger issues affecting the schools, such as poverty and housing (Grow, 1998)
(e) The Citizens Budget Advisory Committee (CBAC) was founded in 1982 and is designed for participants to discuss budgets, explain
10
funding formulas, and make recommendations to the school board (Hookanen, 2001)
III) A Brief History of the School Issues in Minneapolis and the
Longfellow Community
A) Open Enrollment (Drew, 1997) 1) 1987 Minnesota open enrollment policy where students could
request to attend schools outside of their district if the entering and leaving districts approved
2) Minneapolis participated until the 1990s 3) Then to desegregate Minneapolis, white students in Minneapolis
could not open enroll outside the district 4) However, 67% of the students who were denied transfers moved
out of the district 5) In 1997, the district returned to the original open enrollment policy
and allowed white students to request transfers 6) With the open enrollment policy, students can transfer to suburban
schools while still living in the district. This has been affecting the Minneapolis Public Schools, especially since 2000 when more students have been transferring out of the district than have been transferring in, which has led to decrease in Minneapolis Public School’s enrollment (“Enrollment Shifts,” 2003; Shah, 2002 & Shah, 2003)
B) Community Schools
1) In 1995, community schools with enrollment areas were enacted. Community schools are schools with an attendance area that draws most of its students from the surrounding community. The district would no longer bus large populations of students to different schools, and instead students would attend their neighborhood schools (Stoeckel, 2000) (a) The district’s reason for this is that it would introduce stability
and simplicity into the choice system, increase community attachment to the schools, and increase parental involvement in the schools as neighborhood children would attend neighborhood schools (Smetanka, 1995)
(b) “Kids tend to have more pride or they have more responsibility for a neighborhood if they go to school in it. There’s a certain amount of anonymity if you get shipped across town, and you might be more likely to do something that isn’t appropriate” Minneapolis Parent (O’Connor, 1997)
(c) The plan did change the racial mix in many schools increasing some schools to having more white students and others to having less (Smetanka, 1995) (i) Because of this result, NAACP was critical of the policy
because they say it increases concentrations of poverty and

11
minority students in certain schools (“NAACP…,” 2000 & O’Connor, 1999)
(ii) “We have an underclass community, and the students here will not be able to have contact with the middle class and upper class. It’s better for kids to have contact with another culture, another economy, and another way of doing things” Minneapolis parent (O’Connor, 1997)
2) In December 2000, district proposed to give students 2 community school choices and a magnet choice in areas that do not have a designated community school (Shah, 2000)
C) NAACP Lawsuit
1) In 1995, the NAACP charged the state and other agencies (Minneapolis Public Schools were not named in the lawsuit) with “developing policies and practices that concentrate poverty in Minneapolis and make it impossible for the district to provide inner city students with the adequate education they are guaranteed under the state Constitution” (O’Connor, 1999)
2) In November 1999, mediation between NAACP and state agencies, including the Minneapolis Public Schools, failed because of a disagreement over busing students to suburban districts (O’Connor, 1999)
3) March 2000, NAACP lawsuit settled (Associated Press, “NAACP…,”2000 & “NAACP..,” 2000). Results of the settlement: (a) More school choice for Minneapolis school children
(i) Give families more information about school choice, opening parent resource center in Minneapolis (Powell, 2003)
(ii) Give eligible students priority for spots in magnet schools (Powell, 2003)
(iii) Gives more access to suburban schools through open enrollment
(iv) Open 500 seats in the west metro area for low-income Minneapolis students and provide busing to these schools (Powell, 2003). This contributes to the increasing amount of students who open enroll out of the district (“Enrollment Shifts,” 2003; Shah, 2002 & Shah, 2003)
(b) More accountability of Minneapolis Public Schools through a “School Report Card” for every school in the district (Powell, 2003) (i) Makes list of underachieving schools on the endangered
schools list (ii) If schools receive a low score, may have to audit and
students in those schools can choose a different school for next school year
D) Minneapolis Public Schools Marketing Campaign

12
1) February 1, 2000 Minneapolis Public Schools launched a metro wide marketing campaign with Carmichael Lynch advertising firm and donations from other businesses (Lynch, 2000)
2) Slogan, “Minneapolis Pubic Schools. Except Great Things (Lynch, 2000)”
3) Purpose was to “…change negative opinions into positive support for our schools” Minneapolis Public School district (Lynch, 2000)
E) Minneapolis Public Schools All-Day Kindergarten Plan
1) In February 2000, launched a plan to have at least 1 class of all-day kindergarten in every elementary school because of the shown long-term benefits on academic and social skills (O’Connor, 2000)
2) At that time, no Longfellow Schools had all-day kindergarten and no programs were to be put into effect until the 2000-2001 school year at Howe, Hiawatha, and Cooper with Dowling, Seward, and Sullivan having all day in 2001-2002 school year (O’Connor, 2000)
3) Now, all Longfellow elementary schools have all-day kindergarten (MPS Communications, 2004)
F) Minneapolis Renewal of Excess Levy in 2000
1) Levy to fund small class size and for early childhood programs (Shah, 2000)
2) First approved in 1990, again in 1996, and again in 2000 (Shah, 2000)
3) Provides Minneapolis Public Schools with $42.5 million annually in 2002 and increase to $52.5 million annually in 2010, a 3.89 increase from last 1996 levy (Shah, 2000)
4) Enabled the Minneapolis Public Schools to have some of the lowest classroom sizes in the state (O’Brien, 2002)
5) Why are small class sizes under threat if we have a levy to fund them? (a) This was the first time increasing class size was proposed as
Superintendent Carol Johnson proposed it so people would realize the “gravity of the situation” when talking about the budget cuts for the upcoming year (O’Brien, 2002)
(b) Presently, keeping class sizes the same, but taking state poverty aid to pay for it because the levy does not cover the full cost, thus other things will need to be cut (Brandt, 2004)
(c) Because a school levy is capped at 18% of per pupil income that schools receive and per pupil income has not kept up with inflation, school levies as well have not kept up with inflation and provide the schools with less money than they did in the 1990s (Cecconi, 2004)
G) Hiawatha Playground
1) In a project that started in 1998 and was dedicated in 2001, the Hiawatha school parents organized, raised money, and built a new playground and sensory area for the Hiawatha School, which gave

13
Hiawatha a new playground that was “extraordinarily” accessible to those with disabilities and added a “sensory walk” that entices children’s senses (Tinkleberg, 2000 & Tinkleberg, 2001)
2) The project was started because of the condition of the playground and that the district and Parks and Recreation Board did not plan to renovate it for several years (Tinkleberg, 2000)
3) The playground and park were built through a community effort mainly on October 13-15 with the whole project being named a success of community collaboration and togetherness (“Come Play,” 2000 & Tinkerberg, 2001)
4) Also, through this effort started the Rivers of Life program with the Longfellow Community Council, Hiawatha school, and Hamline University to teach the children about the history of the Mississippi River (Tinkleberg, 2001)
H) 2001 Minneapolis Public Schools Closures (Shah, 2001)
1) For fall 2002, due to long-term planning and budget reasons, Minneapolis Public School District proposes in August 2001 to close 6 schools: Mill City Montessori, Chiron Middle School, Edison/PPL Elementary, Brookside Elementary, Bottineau Early Education Center, and Shingle Creek Urban/Environmental Magnet
2) Three of these schools were innovative models for education that were unable to be sustained because of business partner pullouts (Target Corporation from Mill City Montessori), un-sustained community and business partnerships (Chioron Middle School), and failed academics (Edison/PPL)
3) Only one school of those set to close was on the district’s endangered list, which was Edison/PPL
4) The Minneapolis Public Schools held one public hearing before voting on the closures
5) As of 2004, all schools are closed except Bottineau Early Education Center and Shingle Creek Urban/Environmental (MPS Communications, 2004)
I) East Area River Schools Task Force 1) Spring 2002 project started by the Minneapolis Public School Board,
but many members continued to do additional work (Novodvorsky, 2004)
2) The Task Force consisted of a principal, three teachers, and three parents from Longfellow area schools in three clusters: Sullivan, Longfellow, and Cooper; Hiawatha, Howe, Dowling, and Sanford; Northrop, Keewaydin, Wenonah, and Morris Park (Berger, 2002)
3) Their goal was to study three factors affecting the schools issues: building condition, demographics, and ability to offer quality programming; find solutions to the declining enrollments in the area and propose school closures and mergers; and present their findings to the School Board (Berger, 2002)

14
4) Information Provided (a) Learned information about enrollment trends, demographics,
facilities, middle grades education, school programs, and budget (Berger, 2002)
(b) Information was first presented by the School Board on these topic areas; however, many members found that some information presented was inaccurate, especially information on the buildings and grounds, so went back to their schools and corrected the information (Novodvorsky, 2004)
(c) Did find enrollment declines as Longfellow River Schools had 17 percent decline in enrollment since 1996 and is continuing to decline (Berger, 2002)
5) River Schools Task Force Six Recommendations to the Minneapolis Public School Board (a) Close Morris Park Elementary School (b) Waiting for KT to tell me what the final ones are
6) Results (a) Superintendent Carol Johnson made a formal recommendations
to close Morris Park Elementary School (Brotz, 2002) (b) The process got delayed as participants in some of the clusters
were concerned about not having enough time to discuss and understand fully their recommendations (Brotz, 2002)
(c) “The Open Area Task Force (a similar task force from a different part Minneapolis) went forward to be publicly received. They did not bring forth the East Area Task Force. The Task Force did not come to a consensus. The Board did not go forward, and it took the superintendent’s recommendation. She recommended the closing of Morris Park with currently enrolled students going either to Keewaydin or Wenonah and we would change the school boundaries.” Kay McLean, assistant to the Superintendent (Brotz, 2002)
(d) Many on the Task Force were frustrated that little to no action was taken from their findings (Novodvorsky, 2004)
(e) Start of some unification in the neighborhood (Novodvorsky, 2004) (i) Beginning of the Howe/Hiawatha and Longfellow/Cooper
merger proposals (ii) Frustration with the district not selling itself to parents
J) Fall 2002 Closings 1) School Board voted to close Morris Park Community School in
South Minneapolis (Shah, 2002) (a) Students will go to either Keewaydin or Wenonah Elementary
schools (b) District said because of budget pressures and declining
enrollment (Shah, 2002) (c) East Area River Schools Task force also recommended closing
Morris Park (Brotz, 2002)

15
(d) “I don’t sense that that school ever became a core in its community in the same way as Pratt has. If you tried to close Pratt, we’d have a lot more people yelling and screaming at us.” Dennis Schapiro, School Board Member (Shah, 2002)
2) Voted to expand Pratt from K-3 to K-5 and expand Tuttle Elementary from K-5 to K-8 (Shah, 2002) (a) Said that these schools had support and money from
neighborhood groups (b) Said that Pratt was a model for desegregation of the city
K) Building Recommendation for the Longfellow Neighborhood (a) On September 9th, 2003, the Minneapolis Public School Board
proposed a series of long-range planning proposals to meet fiscal, facilities, and market demands, which included building a new school in the Longfellow neighborhood that would open in fall of 2006 (“MPS..”, 2003 & Shah, 2003)
(b) The proposal had 4 options (“MPS…”, 2003; Nathanson, 2003) (i) Build a consolidated (Dowling students enter at 6th grade) K-
8 at Hiawatha with 852 students at $28-35 million (ii) Build a traditional K-8 at Hiawatha with 684 students at $24-
30 million (iii) Create a K-8 dual campus. Dowling would be the K-4 site
and a new 5-8 building at the Hiawatha site with 500 students at each site at $20-28 million
(iv) No new construction in the area (c) The first 3 proposals would mean that:
(i) Sanford would close in fall of 2006 (ii) Howe and Hiawatha would merge
(d) Minneapolis Public Schools held two community information meetings after the proposal, one on September 10th, 2003 and one on September 15th, 2003
(e) Longfellow Response to Proposal (i) Hiawatha School Park and Playground Task Force Response
• Sent out a flyer encouraging people to oppose the proposal
• Wanted to preserve the K-5 playground and sensory area as felt they were a community asset
(ii) Sanford Middle School PTSA and Meredith Davis made a Riverside Preparatory Proposal (Sanford Middle School PTSA and Davis, 2003) • Build the “small” K-8 on Hiawatha site and keep Sanford
Middle School Open • Suggested changes for improving Sanford, such as
changing the name and adding programs (iii) Hiawatha PTO Response (Bennet, 2003)
1. Creation of K-8 option in the neighborhood 2. Separate plans for K-8 from plans for Sanford Middle
School
16
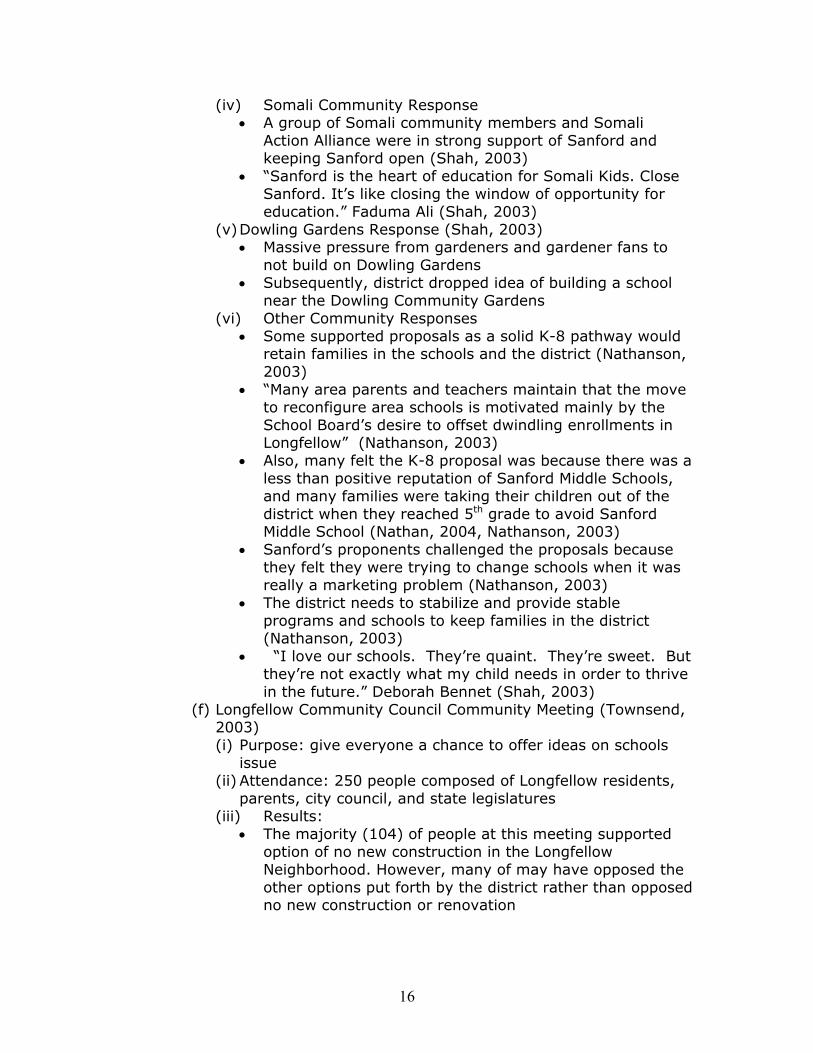
(iv) Somali Community Response • A group of Somali community members and Somali
Action Alliance were in strong support of Sanford and keeping Sanford open (Shah, 2003)
• “Sanford is the heart of education for Somali Kids. Close Sanford. It’s like closing the window of opportunity for education.” Faduma Ali (Shah, 2003)
(v) Dowling Gardens Response (Shah, 2003) • Massive pressure from gardeners and gardener fans to
not build on Dowling Gardens • Subsequently, district dropped idea of building a school
near the Dowling Community Gardens (vi) Other Community Responses
• Some supported proposals as a solid K-8 pathway would retain families in the schools and the district (Nathanson, 2003)
• “Many area parents and teachers maintain that the move to reconfigure area schools is motivated mainly by the School Board’s desire to offset dwindling enrollments in Longfellow” (Nathanson, 2003)
• Also, many felt the K-8 proposal was because there was a less than positive reputation of Sanford Middle Schools, and many families were taking their children out of the district when they reached 5th grade to avoid Sanford Middle School (Nathan, 2004, Nathanson, 2003)
• Sanford’s proponents challenged the proposals because they felt they were trying to change schools when it was really a marketing problem (Nathanson, 2003)
• The district needs to stabilize and provide stable programs and schools to keep families in the district (Nathanson, 2003)
• “I love our schools. They’re quaint. They’re sweet. But they’re not exactly what my child needs in order to thrive in the future.” Deborah Bennet (Shah, 2003)
(f) Longfellow Community Council Community Meeting (Townsend, 2003) (i) Purpose: give everyone a chance to offer ideas on schools
issue (ii) Attendance: 250 people composed of Longfellow residents,
parents, city council, and state legislatures (iii) Results:
• The majority (104) of people at this meeting supported option of no new construction in the Longfellow Neighborhood. However, many of may have opposed the other options put forth by the district rather than opposed no new construction or renovation
17
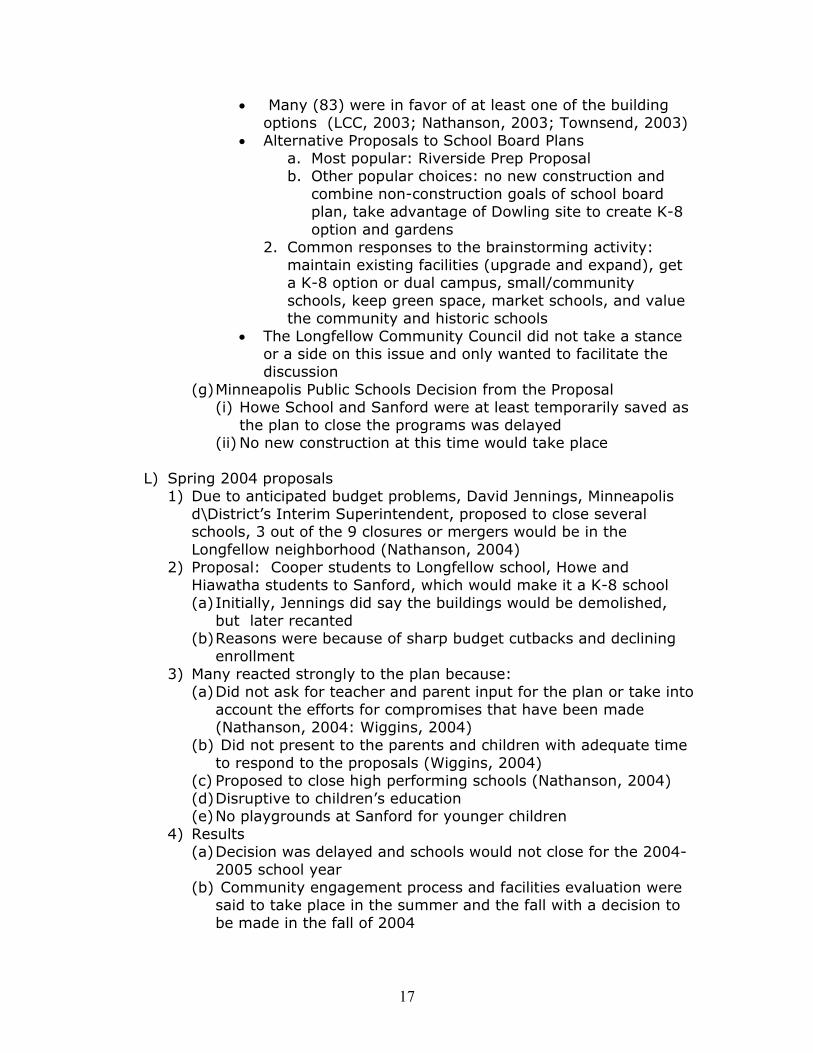
• Many (83) were in favor of at least one of the building options (LCC, 2003; Nathanson, 2003; Townsend, 2003)
• Alternative Proposals to School Board Plans a. Most popular: Riverside Prep Proposal b. Other popular choices: no new construction and
combine non-construction goals of school board plan, take advantage of Dowling site to create K-8 option and gardens
2. Common responses to the brainstorming activity: maintain existing facilities (upgrade and expand), get a K-8 option or dual campus, small/community schools, keep green space, market schools, and value the community and historic schools
• The Longfellow Community Council did not take a stance or a side on this issue and only wanted to facilitate the discussion
(g) Minneapolis Public Schools Decision from the Proposal (i) Howe School and Sanford were at least temporarily saved as
the plan to close the programs was delayed (ii) No new construction at this time would take place
L) Spring 2004 proposals 1) Due to anticipated budget problems, David Jennings, Minneapolis
d\District’s Interim Superintendent, proposed to close several schools, 3 out of the 9 closures or mergers would be in the Longfellow neighborhood (Nathanson, 2004)
2) Proposal: Cooper students to Longfellow school, Howe and Hiawatha students to Sanford, which would make it a K-8 school (a) Initially, Jennings did say the buildings would be demolished,
but later recanted (b) Reasons were because of sharp budget cutbacks and declining
enrollment 3) Many reacted strongly to the plan because:
(a) Did not ask for teacher and parent input for the plan or take into account the efforts for compromises that have been made (Nathanson, 2004: Wiggins, 2004)
(b) Did not present to the parents and children with adequate time to respond to the proposals (Wiggins, 2004)
(c) Proposed to close high performing schools (Nathanson, 2004) (d) Disruptive to children’s education (e) No playgrounds at Sanford for younger children
4) Results (a) Decision was delayed and schools would not close for the 2004-
2005 school year (b) Community engagement process and facilities evaluation were
said to take place in the summer and the fall with a decision to be made in the fall of 2004

18
M) Howe/Hiawatha Merger Proposal (Baker & Benson, 2004) 1) Howe and Hiawatha knew that their enrollments had dropped and
that mergers and/or closures would happen in the near future 2) In an effort to keep kids and teachers together and save resources
through collaboration, the PTOs along with the support of all the teachers at Howe and many at Hiawatha proposed merging Howe and Hiawatha for the 2004-2005 school year
3) They presented their proposal to the Minneapolis School Board, but no action was taken
N) W. Harry Davis, John B. Davis, and Joe Nathan’s proposal (Davis, et.
al., 2004) 1) W. Davis is a former chair of Minneapolis Board of Education, John
B. Davis is a former Superintendent of Minneapolis Public Schools, and Joe Nathan is Director of the Center for School Change the University of Minnesota’s Humphrey Institute
2) House two or more schools in one building (Davis, et. al., 2004) 3) Move schools out of rented facilities (Davis, et. al., 2004) 4) Examine district and contract alternative schools. Close non-
performing schools and retain those that are succeeding or improving
5) Learn and encourage successful charter schools 6) Work with families and community members
O) River Schools Collective (Johnson, 2004; Simon-Sharken, 2004) 1) Communication mechanism for the River Corridor Schools to
discuss common values and challenges unique to River Schools 2) Attempt to get parent leaders from every school to discuss school
issues together in attempt to find some unity among the River Schools
3) Trying to unify the neighborhood around the schools issues
P) Present Community Processes 1) Community Engagement Collaborative (“Community…”, 2004)
(a) The process is a way that the district is “recognizing the importance of community’s support for the Minneapolis Public Schools
(b) Citywide process of listening and learning to reestablish evolving community engagement actions that lead to effective decision making and a long-term change about how the district gathers and utilizes community input (Grey, et. al., 2004)
(c) Facilitators are Karen Gray and Nora Hall of Gray Hall LLP (d) Present work plan (Hall & Gray, 2004; Gray et. al., 2004)
(i) Connected with various stakeholders and groups in the Minneapolis community
(ii) Reviewed all the correspondence that the community has made with the district

19
(iii) Evaluated who they should bring together for the community engagement process
(iv) Phase I of the community engagement process • Identify what the shared and competing values are in the
community through meeting with those that have shared values
• Try to get all voices heard • Try to identify what the community wants to do about the
competing values (v) Phase II of the community engagement process
• Prioritize the values through a large community engagement process through meeting together with all stakeholders
• Make recommendations to the board about the community values and recommendations to the facilities committee about the values for use in their proposals
(vi) Values that have already been identified 1. Values the Minneapolis community has in common:
fiscal responsibility, community involvement, site based decision making, professional development, safe schools, and discipline
2. Values the Minneapolis community has differing opinions on: equity, diversity, choice, achievement
2) Facilities Process (“Community Open Houses,” 2003 (a) These processes are headed by an independent contracting firm
KKE architecture, which is composed of architects and engineers (b) The purpose of this process is to assess buildings and cost of
operation and identify strategies for change and their impacts on community needs that will be utilized in the process for a major district wide decision
(c) The purpose of the open house meetings was to identify general criteria that can be applied across the district
(d) After they identify the general criteria, they will look at specific buildings and ask for community input
(e) They will also utilize information put forth by the community engagement team
(f) They will utilize this information to develop a series of scenarios that they will present to the district in October of 2004
IV) Schools in Neighborhood
A) Cooper Community School (“School…., 2004) 1) Cooper is a small community elementary school with about 207
students enrolled in their 2002-2003. For the school year, they have 1 full-time principal, 15 classroom teachers, 13 non-licensed support staff, and 5 licensed support staff.

20
2) Their student ethnicity is over half African American, a quarter white American, less than a quarter American Indian, and then the remaining Asian American and Hispanic American
3) In the 2002-2003 school year, 81% of the school’s students were enrolled the full year, which is about average for Cooper. Fifty-eight percent of their students had 95% or above attendance for the year, which is a little below average for the district (n cooper = 58 vs. n district =64)
4) About three quarters of the students were eligible for free or reduced lunch, which is above average for the district
5) They have a slightly higher percent of their students with special needs than the district (n cooper = 16 vs. n district =12) and a higher percent of their students receiving ELL services (n cooper = 33 vs. n district =24)
6) For the 2003-2004 school year, Cooper had a total of 27 classrooms with 12 of them in use (MPS Communications, 2004)
7) Cargill Corporation works with Cooper elementary school to improve student achievement (Nathan, 2004; Nathan, 2004) (a) Relationship started in 2002 with a $50,000 grant to help
increase parent and community involvement and increase math learning at Cooper (“Cooper Community…,” 2002)
(b) Through research-based approaches to teaching and greater outreach to families, Cooper has made significant gains serving a population of low-income and English Language Learners in the number of students passing Minnesota Comprehensive math and reading assessments (Davis, et. al., 2004; Nathan, 2004)
B) Sanford Middle School
1) Sanford is a middle school serving 560 students in grades 6 through 8 for their 2002-2003 school year. They have 1 full-time principal and one assistant principal, 39 classroom teachers, 36 non-licensed support staff, and 6 licensed support staff
2) Their student ethnicity is over half African American, a quarter white American, less than a quarter American Indian, and than the remaining Asian American and Hispanic American
3) Percent of students at Sanford that are enrolled for the full year is similar to that of the district
4) About three quarters of the students were eligible for free or reduced lunch, which is above the average for the district
5) They have a slightly higher percent of their students with special needs than the district (n cooper = 16 vs. n district =12) and a higher percent of their students receiving ELL services (n cooper = 33 vs. n district =24)
6) A higher percentage of Sanford students are eliglible for free or reduced lunch compared to the district (77% for the 2002-2003 school year compared to 70% for the district)
7) A slightly higher percentage of the students compared to the district are receiving special education services (19% compared to

21
12%) while at the same time, a higher percentage are received services for ELL (28% compared to 24%)
8) For the 2003-2004 school year, Sanford had 36 available classrooms and 21 classrooms in use (MPS Communications, 2004)
9) Sanford’s principal went to Africa to learn more about refugees’ experiences to become a more effective principal (Brotz, 2003’ Davis, 2004) “Getting to know and understand the cultures of kids you teach is always valuable in itself,” Meredith Davis (Bortz, 2003)
10) Some students from North Minneapolis wanted to attend Sanford Middle school because they wanted a school where there was a supportive environment towards Somalians. There were 35 to 40 students who wanted to come to Sanford at a transportation cost to the district of 10,000 dollars per year. Despite numerous requests, the district refused to transport these students, so the students instead went to a charter school. Because many of these students were low-income students, their movement to charter schools costs the district several hundreds of thousands of dollars (David, 2004; Nathan, 2004)
C) Dowling Urban Environmental Magnet School
1) Dowling Urban Environmental School is a magnet program that stresses environmental themes. Four-hundred students are at Dowling in grades K-5. It is located across from the Mississippi River on 18 acres of land, part of which is the Dowling Community and Victory Gardens (“Dowling…,” 2004)
2) Dowling enrollment has been slightly increasing between 1998 and 2003, while enrollment at Howe, Hiawatha, and Sanford has declined by 25% (Nathanson, 2003)
3) Students at Dowling tend to be enrolled for the full year (89% for the 2002-2003 school year compared to the 79% for the district)
4) A significantly lower percentage of Dowling students are eliglible for free or reduced lunch compared to the district (38% for the 2002-2003 school year compared to 71% for the district)
5) A slightly higher percentage of the students compared to the district are receiving special education services (16% compared to 12%) while at the same time, a lower percentage are receiving services for ELL (7% compared to 24%)
6) A higher percentage of Dowling students are white students compared to that of the district (56% compared to 27%). Compared to the district, they have a lower percent of black, Hispanic and Asian students (black 29% compared to 42%; Asian Americans, 4% compared to 13%; Hispanic, 4% compared to 13%)
7) For the 2003-2004 school year, Dowling had 26 available classrooms and 23 classrooms in use (MPS Communications, 2004)
D) Hiawatha Community School
1) Hiawatha is a community school with 245 students in grades K-5

22
2) In 2000, Jane Ellis, the Hiawatha principal boasts that they have had the highest test scores increases of students continuously enrolled in the district (Stoeckel, 2000)
3) Students at Hiawatha tend to be enrolled for the full year (87% for the 2002-2003 school year compared to 79% for the district)
4) A lower percentage of Hiawatha students are eliglible for free or reduced lunch compared to the district (56% for the 2002-2003 school year compared to 71% for the district)
5) A slightly higher percentage of the students compared to the district are receiving special education services (14% compared to 12%) while at the same time, a lower percentage are receiving services for ELL (3% compared to 24%)
6) A higher percentage of Hiawatha students are white students than that of the district (39% compared to 27%). Compared to the district, they have a lower percent of black and Asian students (black 21% compared to 42%; Asian Americans, 2% compared to 13%), but a higher percentage of Hispanic students (31% compared to 13%)
7) For the 2003-2004 school year, Hiawatha had a total of 30 classrooms, with 17 available classrooms and 13 classrooms in use (MPS Communications, 2004)
8) In 2000, the Hiawatha School parents organized, raised money, and started to build a new playground and sensory area for the Hiawatha school, which gave Hiawatha a new playground that was “extraordinarily” accessible to those with disabilities and added a “sensory walk” that entices children’s senses (Tinkleberg, 2000). Also, they started the Rivers of Life program with the Longfellow Community Council, Hiawatha school, and Hamline University to teach children about the history of the Mississippi River (Tinkleberg, 2001)
E) Howe Community School
1) Howe is a community school serving 300 students from pre-K to 5(H5)
2) A lower percentage of students at Howe compared to the district tend to be enrolled for the full year (69% for the 2002-2003 school year compared to 79% for the district)
3) Howe students qualify for free and reduced lunches at a similar rate to that of the district
4) The same percentage of students at Howe are receiving special education services as compared to that of the district while a lower percentage of Howe students are receive ELL services (9% compared to 24%)
5) For the 2003-2004 school year, Howe had a total of 26 classrooms with 11 classrooms in use (MPS Communications, 2004)
6) Howe has a very active PTO who were instrumental in developing the Howe/Hiawatha merger proposal (Baker & Benson, 2004)

23
F) Minnesota Transitions Charter Schools 1) Minnesota Transitions is a group of charter schools that have
schools in the Longfellow area. The goal is to help students transition from the classroom to post-secondary and career and the schools. The school caters its curriculum to serve the middle, 20-60% of students (Scallon, 2004)
2) Pillsbury United sponsors the charter school, but the charter school is its own independent entity. The charter was one of the first starting in 1996 (Scallon, 2004)
3) These charter schools include: (a) MTS Technology High School located at 2872 26th Avenue
South, Minneapolis (b) Minnesota Transitions Middle School located at 3127 East Lake
Street, Minneapolis (c) MTS Elementary School located at 3216 East 29th Street,
Minneapolis (d) MTS Distance Learning located at 2872 26th Avenue South,
Minneapolis (e) MTS Independent Study Program located at 2872 26th Avenue
South, Minneapolis 4) These schools have higher percentages of free and reduced lunches
and students of color than the Minneapolis Public Schools. Overall, the 70% of the students are students of color and 70% of the students qualify for free or reduced lunches. They have similar percentages of special education students as Minneapolis Public Schools, but most are higher functioning special education needs (Scallon, 2004)
5) The schools are governed by a Board of Directors composed mainly of teachers and parents. By law, they have an annual meeting where all teachers are required and all parents are invited to vote for the Board of Directors (Scallon, 2004)
6) The Superintendent of Minnesota Transitions is Tony Scallon who receives a significantly smaller compensation than administrators in the Minneapolis Schools District. He sees charter schools as a long-term solution to many problems and believes that all schools should be chartered into small, focused schools that can run themselves independently with low administrative costs and allow parents and teachers to run the schools themselves. He is also pro-unions and belongs to the Minnesota Teachers’ Union (Scallon, 2004)
V) School Testing Scores and Academic Statistics
A) Statistical comparisons (Heisted, 2004)
1) Most statistics cannot be compared school to school because the student populations that are being compared did not start at the same base level

24
2) Especially important when looking at the passing rates for basic standards tests as the students that started may have had different base skill levels and with schools with high turnover, these students may not have been in the same school for the past school years (a) For example, if school A starts with students where 70% have
already passed the basic standards tests while school B starts with students where 20% have already passed the basic standards tests, comparing their passing rates would be unfair as their base skill levels are extremely different
3) Instead, students making one year growth statistics can be used to compare achievement between schools as that is a fairer comparison. (a) This is especially true when schools do not have high turnover
rate during the school year because the children will spend more time with the schools curriculum and staff
(b) Statistical comparisons should still be used with caution as they compare different populations of students with different circumstances
B) Cooper Community School
1) Cooper generally has higher percent of students making one year’s growth in both math and reading than the average for the district. This is especially note-worthy because in the 1999-2000 school year Cooper had much lower one year’s growth rates than the district. This means that the school has been making improvements and now is a high achieving school, especially as it compares to its own past
Percent of Students Making About One Year’s
Growth or More on Math Current Year Scale Score-Previous Year Scale Score ›= Expected Growth
Cooper Community Continuous Enrollment
District Continuous Enrollment
Spring ’01 to ‘02
Spring ’02 to ‘03
Spring ’01 to ‘02
Spring ’02 to ‘o3
% (N) % (N) % (N) % (N) Grades 2-3 71% (24) 38% (24) 62% (3,049) 51
% (2,905)
Grades 3-4 62% (21) 59% (24) 50% (3,191) 50%
(2,908)
Grades 4-5 63% (24) 63% (24) 58% (3,220) 59%
(3,109)
Total 65% (69) 53% (75) 53% (15,349)
51%
(14,886)
ELL 89% (9) 48% (23) 54% (3,360) 51%
(3,517)
SPED 33% (12) 65% (17) 44% (1,805) 45%
(1,740)

25
MAIN 69% (48) 51% (35) 55% (10,184)
52%
(9,629)
Percent of Students Making About One Year’s Growth or More on Reading
Current Year Scale Score-Previous Year Scale Score ›= Expected Growth Cooper Community
Continuous Enrollment District
Continuous Enrollment Spring ’01 to
‘02 Spring ’02 to
‘03 Spring ’01 to
‘02 Spring ’02 to
‘o3 % (N) % (N) % (N) % (N)
Grades 2-3 54% (24) 54% (24) 54% (3,037) 51%
(2,886)
Grades 3-4 57% (21) 70% (27) 54% (3,189) 55%
(2,897)
Grades 4-5 64% (25) 54% (24) 54% (3,229) 55%
(3,098)
Total 59% (70) 60% (75) 54% (15,337)
54%
(14,810)
ELL 44% (9) 74% (23) 53% (3,340) 53%
(3,486)
SPED 69% (13) 59% (17) 48% (1,808) 50%
(1,712)
MAIN 58% (48) 51% (35) 55% (10,189)
55%
(9,612)
B) Sanford Middle School (“School Information…, 2004)
1) Sanford’s rate of students making one year’s growth is generally at or below average for that of the district. Generally, they have been below average compared to other district middle schools in the percent of students making one year’s growth
Percent of Students Making About One Year’s
Growth or More on Math Current Year Scale Score-Previous Year Scale Score ›= Expected Growth
Sanford Middle Continuous Enrollment
District Continuous Enrollment
Spring ’01 to ‘02
Spring ’02 to ‘03
Spring ’01 to ‘02
Spring ’02 to ‘o3
% (N) % (N) % (N) % (N) Grades 5-6 26% (117) 37% (130) 46% (3,097) 43
% (3,025)
Grades 6-7 39% (127) 46% (157) 50% (2,792) 51%
(2,939)
Total 32% (244) 42% (287) 53% (15,349)
51%
(14,886)

26
ELL 41% (44) 49% (72) 54% (3,360) 51%
(3,517)
SPED 24% (38) 34% (56) 44% (1,805) 45%
(1,740)
MAIN 32% (162) 42% (159) 55% (10,184)
52%
(9,629)
Percent of Students Making About One Year’s
Growth or More on Reading Current Year Scale Score-Previous Year Scale Score ›= Expected Growth
Sanford Middle Continuous Enrollment
District Continuous Enrollment
Spring ’01 to ‘02
Spring ’02 to ‘03
Spring ’01 to ‘02
Spring ’02 to ‘o3
% (N) % (N) % (N) % (N) Grades 5-6 47% (116) 47% (130) 54% (3,093) 55
% (3,018)
Grades 6-7 55% (128) 54% (154) 53% (2,789) 53%
(2,911)
Total 51% (244) 51% (284) 54% (15,337)
54%
(14,810)
ELL 43% (44) 58% (73) 53% (3,340) 53%
(3,486)
SPED 33% (39) 41% (54) 48% (1,808) 50%
(1,712)
MAIN 58% (161) 51% (157) 55% (10,189)
55%
(9,612)
C) Dowling Urban Environmental Magnet School
1) Dowling’s students are higher than the district’s students in terms of percent of students making one year’s growth or more. Their percent of students making one year’s growth have been constantly at or above the average for the district for the past several years
Percent of Students Making About One Year’s
Growth or More on Math Current Year Scale Score-Previous Year Scale Score ›= Expected Growth
Dowling Urban Environmental
Continuous Enrollment
District Continuous Enrollment
Spring ’01 to ‘02
Spring ’02 to ‘03
Spring ’01 to ‘02
Spring ’02 to ‘o3
% (N) % (N) % (N) % (N) Grades 2-3 80% (54) 71% (56) 62% (3,049) 51
% (2,905)
Grades 3-4 61% (49) 52% (60) 50% (3,191) 50 (2,908)

27
% Grades 4-5 73% (44) 67% (48) 58% (3,220) 59
% (3,109)
Total 71% (147) 63% (164) 53% (15,349)
51%
(14,886)
ELL 50% (6) 50% (8) 54% (3,360) 51%
(3,517)
SPED 50% (20) 64% (22) 44% (1,805) 45%
(1,740)
MAIN 76% (121) 63% (134) 55% (10,184)
52%
(9,629)
Percent of Students Making About One Year’s Growth or More on Reading
Current Year Scale Score-Previous Year Scale Score ›= Expected Growth Dowling Urban
Environmental Continuous Enrollment
District Continuous Enrollment
Spring ’01 to ‘02
Spring ’02 to ‘03
Spring ’01 to ‘02
Spring ’02 to ‘o3
% (N) % (N) % (N) % (N) Grades 2-3 63% (54) 60% (55) 54% (3,037) 51
% (2,886)
Grades 3-4 54% (48) 55% (60) 54% (3,189) 55%
(2,897)
Grades 4-5 70% (44) 60% (48) 54% (3,229) 55%
(3,098)
Total 62% (146) 58% (163) 54% (15,337)
54%
(14,810)
ELL 83% (6) 75% (8) 53% (3,340) 53%
(3,486)
SPED 50% (20) 57% (21) 48% (1,808) 50%
(1,712)
MAIN 63% (120) 57% (134) 55% (10,189)
55%
(9,612)
D) Hiawatha Community Schools
1) Hiawatha had a large increase in their percent of students making one year’s growth or more between the 2001-2002 school year and the 2002-2003 school year. In the 2002-2003 school year, their rates of growth were higher than that of the district. However from 1999-2002, their rates were below that of the district
Percent of Students Making About One Year’s Growth or More on Math

28
Current Year Scale Score-Previous Year Scale Score ›= Expected Growth Hiawatha Community
Continuous Enrollment District
Continuous Enrollment Spring ’01 to
‘02 Spring ’02 to
‘03 Spring ’01 to
‘02 Spring ’02 to
‘o3 % (N) % (N) % (N) % (N)
Grades 2-3 44% (34) 57% (30) 62% (3,049) 51%
(2,905)
Grades 3-4 50% (30) 93% (27) 50% (3,191) 50%
(2,908)
Grades 4-5 50% (40) 61% (33) 58% (3,220) 59%
(3,109)
Total 48% (104) 69% (90) 53% (15,349)
51%
(14,886)
ELL (3) 54% (3,360) 51%
(3,517)
SPED 39% (18) 58% (12) 44% (1,805) 45%
(1,740)
MAIN 50% (86) 71% (75) 55% (10,184)
52%
(9,629)
Percent of Students Making About One Year’s Growth or More on Reading
Current Year Scale Score-Previous Year Scale Score ›= Expected Growth Hiawatha Community
Continuous Enrollment District
Continuous Enrollment Spring ’01 to
‘02 Spring ’02 to
‘03 Spring ’01 to
‘02 Spring ’02 to
‘o3 % (N) % (N) % (N) % (N)
Grades 2-3 59% (34) 47% (30) 54% (3,037) 51%
(2,886)
Grades 3-4 57% (30) 59% (27) 54% (3,189) 55%
(2,897)
Grades 4-5 47% (40) 61% (33) 54% (3,229) 55%
(3,098)
Total 54% (104) 56% (90) 54% (15,337)
54%
(14,810)
ELL (3) 53% (3,340) 53%
(3,486)
SPED 56% (18) 58% (12) 48% (1,808) 50%
(1,712)
MAIN 53% (86) 55% (75) 55% (10,189)
55%
(9,612)
E) Howe Community School
29
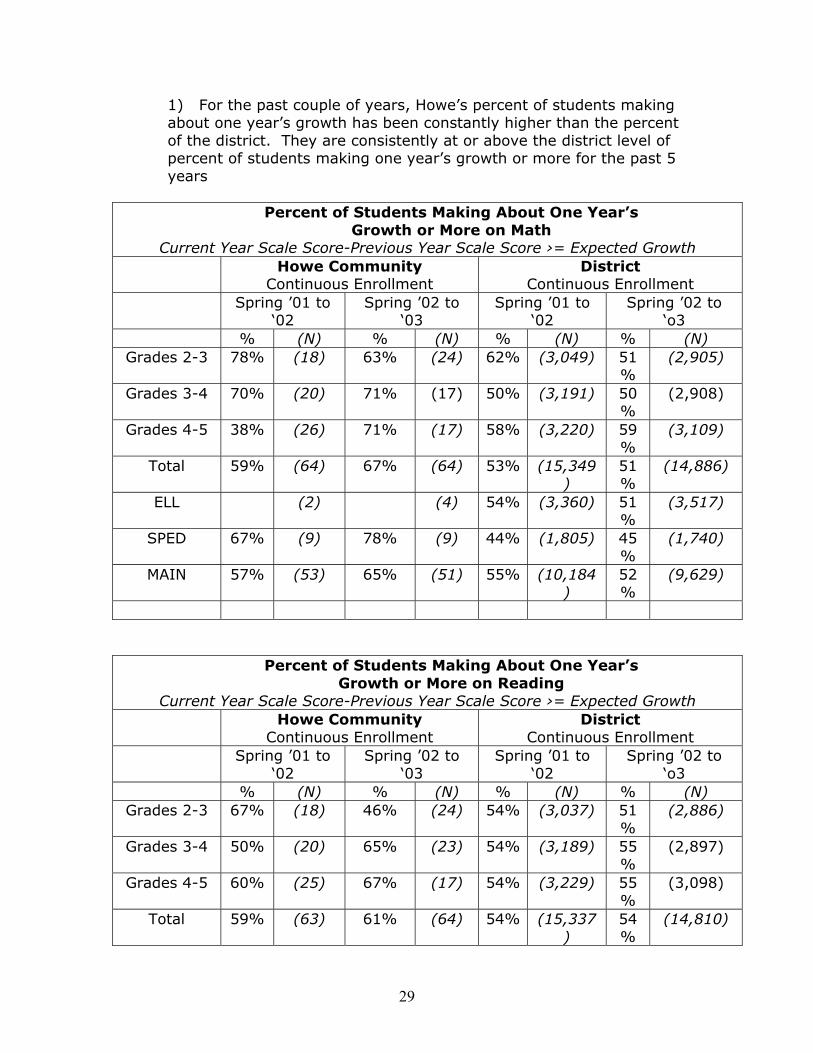
1) For the past couple of years, Howe’s percent of students making about one year’s growth has been constantly higher than the percent of the district. They are consistently at or above the district level of percent of students making one year’s growth or more for the past 5 years
Percent of Students Making About One Year’s
Growth or More on Math Current Year Scale Score-Previous Year Scale Score ›= Expected Growth
Howe Community Continuous Enrollment
District Continuous Enrollment
Spring ’01 to ‘02
Spring ’02 to ‘03
Spring ’01 to ‘02
Spring ’02 to ‘o3
% (N) % (N) % (N) % (N) Grades 2-3 78% (18) 63% (24) 62% (3,049) 51
% (2,905)
Grades 3-4 70% (20) 71% (17) 50% (3,191) 50%
(2,908)
Grades 4-5 38% (26) 71% (17) 58% (3,220) 59%
(3,109)
Total 59% (64) 67% (64) 53% (15,349)
51%
(14,886)
ELL (2) (4) 54% (3,360) 51%
(3,517)
SPED 67% (9) 78% (9) 44% (1,805) 45%
(1,740)
MAIN 57% (53) 65% (51) 55% (10,184)
52%
(9,629)
Percent of Students Making About One Year’s Growth or More on Reading
Current Year Scale Score-Previous Year Scale Score ›= Expected Growth Howe Community
Continuous Enrollment District
Continuous Enrollment Spring ’01 to
‘02 Spring ’02 to
‘03 Spring ’01 to
‘02 Spring ’02 to
‘o3 % (N) % (N) % (N) % (N)
Grades 2-3 67% (18) 46% (24) 54% (3,037) 51%
(2,886)
Grades 3-4 50% (20) 65% (23) 54% (3,189) 55%
(2,897)
Grades 4-5 60% (25) 67% (17) 54% (3,229) 55%
(3,098)
Total 59% (63) 61% (64) 54% (15,337)
54%
(14,810)

30
ELL (2) (4) 53% (3,340) 53%
(3,486)
SPED 56% (9) (56%) (9) 48% (1,808) 50%
(1,712)
MAIN 60% (52) 63% (51) 55% (10,189)
55%
(9,612)
VI) Research Review
A) Charter Schools 1) What is a charter school?
(a) Charter schools are public schools under a contract, called a charter, from a public agency to an interested party (Bulkley & Fisler, 2003; Lubienski, 2001 & Weil, 2000)
(b) Contracts are usually for 3 to 5 years (c) Largely independent of government regulation in their
management (Henig, et. al., 2003) (d) In trade for their independence, charter schools are held
accountable to the public and if they are not performing, they should shut down (Hassel, 2004 & Lubienski, 2001)
(e) They are not private schools, magnet programs, vouchers or alternative schools (Lubienski, 2001 & Weil, 2000) (i) They cannot be religious based (Nathan, 2002 & Weil, 2000) (ii) Random selection of students that apply (Nathan, 2002 &
Weil, 2000) (iii) Like traditional public schools, charter schools receive
money on a per pupil basis and cannot charge students fees for attending (Shah, 2003)
2) Theory of charter schools (Bulkley & Fisler, 2003 & Henig et.al., 2003) (a) Charter schools allow the creation of new schools or reinvention
of old schools to expand variety and school choice and break down the government’s monopoly on education
(b) These schools have more autonomy and flexibility because they are governed by the people who are directly involved with them
(c) More accountable because of market forces and short-term contracts as students will withdraw from school not serving them well; unlike traditional public schools, those that are failing will be closed
(d) This will lead to more student achievement, higher involvement and higher parental and student satisfaction
3) Charter School Legislation (a) No federal charter school policy; each state has different charter
school legislation that may vary dramatically between states (Weil, 2000)
(b) Minnesota Charter School Law (“Minnesota,” 2004) (i) Unlimited number of charter schools possible
31
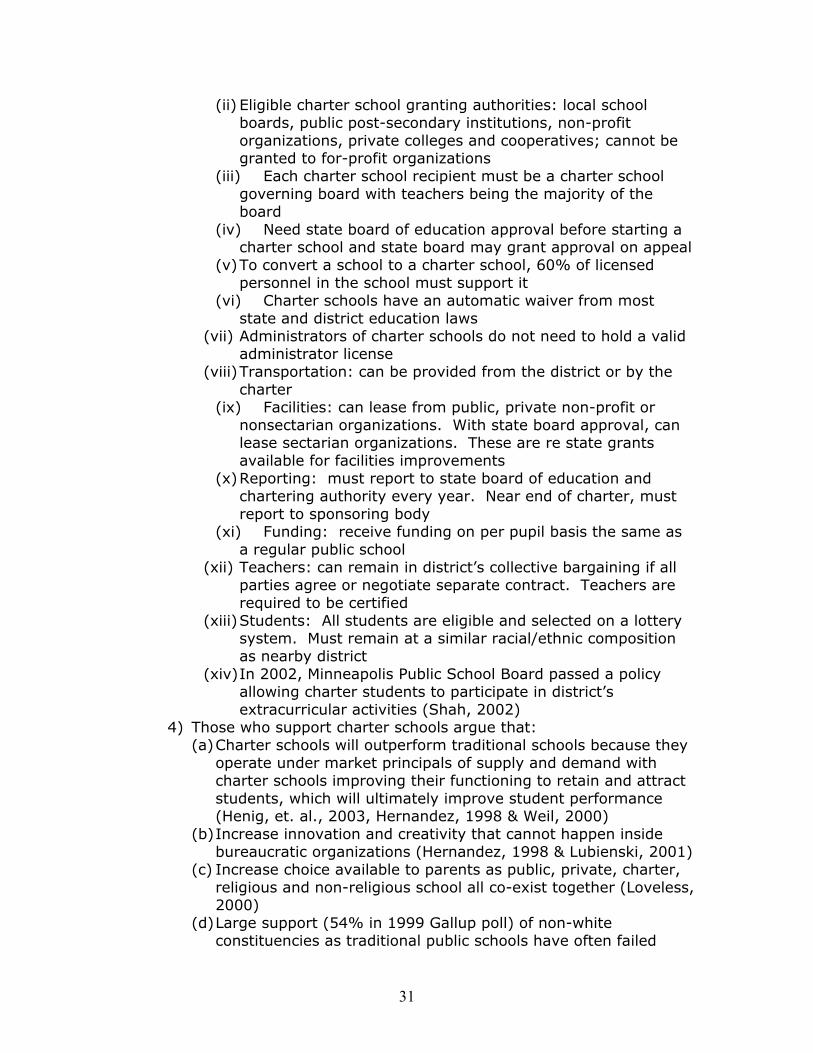
(ii) Eligible charter school granting authorities: local school boards, public post-secondary institutions, non-profit organizations, private colleges and cooperatives; cannot be granted to for-profit organizations
(iii) Each charter school recipient must be a charter school governing board with teachers being the majority of the board
(iv) Need state board of education approval before starting a charter school and state board may grant approval on appeal
(v) To convert a school to a charter school, 60% of licensed personnel in the school must support it
(vi) Charter schools have an automatic waiver from most state and district education laws
(vii) Administrators of charter schools do not need to hold a valid administrator license
(viii) Transportation: can be provided from the district or by the charter
(ix) Facilities: can lease from public, private non-profit or nonsectarian organizations. With state board approval, can lease sectarian organizations. These are re state grants available for facilities improvements
(x) Reporting: must report to state board of education and chartering authority every year. Near end of charter, must report to sponsoring body
(xi) Funding: receive funding on per pupil basis the same as a regular public school
(xii) Teachers: can remain in district’s collective bargaining if all parties agree or negotiate separate contract. Teachers are required to be certified
(xiii) Students: All students are eligible and selected on a lottery system. Must remain at a similar racial/ethnic composition as nearby district
(xiv) In 2002, Minneapolis Public School Board passed a policy allowing charter students to participate in district’s extracurricular activities (Shah, 2002)
4) Those who support charter schools argue that: (a) Charter schools will outperform traditional schools because they
operate under market principals of supply and demand with charter schools improving their functioning to retain and attract students, which will ultimately improve student performance (Henig, et. al., 2003, Hernandez, 1998 & Weil, 2000)
(b) Increase innovation and creativity that cannot happen inside bureaucratic organizations (Hernandez, 1998 & Lubienski, 2001)
(c) Increase choice available to parents as public, private, charter, religious and non-religious school all co-exist together (Loveless, 2000)
(d) Large support (54% in 1999 Gallup poll) of non-white constituencies as traditional public schools have often failed

32
them and is an opportunity for them to receive a better education (Hernandez, 1999 & Weil, 2000)
5) Those who oppose charter schools argue that: (a) Further stratify schools (Weil, 2000)
(i) Take away from public school funding (Weil, 2000) (ii) Pull the highest achieving students with the most active
parents away from the public schools (Hernandez, 1998) (b) These school cannot provide for special needs students (Weil,
2000) (c) The market argument for charter schools does not take into
affect the socially undesirable inefficiencies of markets (Mintrom, 2003)
(d) Market argument is only valid if families are factoring a better education and the payoffs from it in the long-term and are knowledgeable about the system. However, many families are focused on immediate needs and do not focus on the long-term rewards of an education (Loveless, 2000)
(e) Feel they are a step to privatization of schools (Weil, 2000) (f) They increase transportation costs (Weil, 2000) (g) Are not run by qualified personnel (Nathan, 2002) (h) Those that pay taxes but have no children in school have no
input into charter school because they do not have a child to put in or take out of a school nor can they vote or be on a charter school board (Lubienski, 2001)
6) Research on charter schools (a) Charter schools do have similar demographics compared to
students of all public schools (Loveless, 2000) (i) Racial composition: in Minnesota and in Minneapolis, charter
schools have a higher percent of minority students than the public schools (“Minneapolis Charter Totals, 2004)
(ii) Poverty rates: in both Minnesota and Minneapolis, charter school students are more likely to live in poverty than those that attend regular public schools (“Minneapolis Charter Totals, 2004)
(iii) English language learners (ELL): charter schools in Minnesota and Minneapolis have a larger percentage of ELL than the regular public schools (“Minneapolis Charter Totals, 2004)
(b) Charter schools do have a lower percentage of special education students (i) These special education students may also have less severe
problems than those in the public schools (Bulkley & Fisler, 2003)
(ii) In Minneapolis for the 2003-2004 school year, 8.20% of Minneapolis charter schools students are special education students compared in 13.30% of Minneapolis Public School District students (“Minneapolis Charter…., 2004)

33
(c) No evidence that charter schools are only getting the best, most motivated students (Bulkley & Fisler, 2003)
(d) Charter schools do tend to be much smaller than traditional schools (137 students for charter schools versus 475 students for traditional schools) (Bulkley & Fisler, 2003 & Loveless, 2000) (i) Charter schools do have less administration and
subsequently less administration costs (Loveless, 2000) (ii) Charter schools are more likely to have non-traditional grade
configurations (Bulkley & Fisler, 2003) (e) Charter school do have difficulties with teacher unions
(i) Teachers in charter schools are less likely to be in unions (68% of charter school teachers reported little or no union involvement) while teacher unions want charter schools to be more unionized (Bulkley & Fisler, 2003 & Hernandez, 1998)
(ii) Charter schools want more flexibility with hiring and firing of teachers, which is counter to many teacher contracts (Hernandez, 1998)
(f) Parental Involvement/Satisfaction (i) Charter schools are more likely to use innovative methods to
encourage parental involvement than traditional public schools (Mintrom, 2004)
(ii) Charter school parents are more likely to attend parent/teacher conferences (Mintrom, 2004)
(iii) Charter schools have high levels of parent, teacher, and student satisfaction (Bulkley & Fisler, 2003)
(g) Achievement (i) The research on charter school achievement is inconclusive
because of the mobility of these students, the time charter schools have been active, and other reasons. Thus far, the results have been mixed (Bulkley & Fisler, 2003)
(ii) In Minneapolis, charter schools have had state test scores that are well above and well below average (Shah, 2003)
(iii) The NATL scores for Minneapolis Charter Schools showed that 50% of the charter school students made national norm gains in reading and 49% made national norm gains in math (“Minneapolis,” 2004)
(h) Some evidence has shown that charter schools are not working strictly through market forces (i) Charter schools are supposed to be held accountable for
student performance, but almost all that have closed did so because of reasons unrelated to student performance. Almost all charter schools are now using standardized assessment, which will give them measurable goes to identify schools that should be closed (Bulkley & Fisler, 2003)
(ii) Some evidence has shown that charter schools are using strategic political behavior more than adjusting to consumer demand (Henig, et. al., 2003)
34
(iii) Because charter schools are required by law to not charge additional tuition and select students based on a lottery system, they are not complying with the rules of supply and demand (Henig, et. al., 2003)
(iv) Are more likely to use innovative methods and course offerings than traditional public schools which may show that they are trying to meet demand of parents and students (Mintrom, 2004)
B) No Child Left Behind
1) A federal act that has both helped encourage school improvement and provided a stream of controversies (Nathan, 2004)
2) The goal of this legislation is to close the achievement gap between disadvantaged and minority students especially in reading and math (“Executive Summary,” 2004; “Fact…,” 2004 & “Four…,” 2004)
3) Acts’ Main Objectives (“Introduction…,” 2004 & McCarthy, 2004) (a) Increase accountability and school safety (b) Emphasis on using scientifically recognized methods (c) Expanded parental options (d) Expanded local control and flexibility (e) Increase teacher quality
4) Basic Accountability (“Fact…,” 2004) (a) Schools will create and implement annual assessments for
students in grades 3-8 in reading and math and an assessment in grades 10 through 12 (“Executive Summary,” 2004; “Fact…,” 2004; “Four…,” 2004, “Introduction…,” 2004)
(b) The results of these assessments will be available in an annual report (“Executive Summary,” 2004 & “Fact…,” 2004)
(c) If schools are failing to meet standards of the scores of their students or any subpopulation of student, they will be designated as “needs improvement.” If they do not improved, they will be labeled as a “failing” school (“Executive Summary,” 2004 & “Fact…,” 2004)
(d) If a school is failing for 2 consecutive years, parents can transfer their child to a non-failing school with the school providing the transportation costs or a charter school and/or the schools can provide tutoring services and summer school programs. If they continue to not improve for 5 years, the school must dramatically change its approach (“Executive Summary,” 2004; “Fact…,” 2004 & “Four…,” 2004)
5) Reading First Initiative (“Executive Summary,” 2004; “Fact…,” 2004 & “Four…,” 2004) (a) Goal is that all children are reading by 3rd grade (b) Reading would be taught using scientifically proven methods
6) Timeline (McCarthy, 2003) (a) July 2003:List of underachieving schools revealed
35
(b) 2004 and beyond: Penalties phased in for underachieving schools
(c) 2005-6: Students take math and reading tests annually in grades 3-8 and once in grades 10-12
(d) May 2006: States must have science and grade-level standards in place
(e) 2007-2008: Students take science tests in grades 3-5, 6-9, and 10-12
(f) 2013-2014: All students in all schools must be proficient under state standards. This means that if one child is does not meet standards, the school will be designated as failing
7) Funding (a) Schools have more control of some of the funding they receive
from the federal government (“Executive Summary,” 2004; “Fact…,” 2004 & “Four…,” 2004)
(b) Increased federal education funding by 59.8% from 2001 to 2003 (Introduction…, 2004)
8) 8% of Minnesota schools have been designated as needs improvement
9) Controversies (a) No Child Left Behind Act is not adequately funded
(i) To just develop new state math and reading tests to comply with the act will cost $1.3 million per grade level (Nathan, 2004)
(b) Difficult to improve a “needs improvement” status (Nathan, 2004)
(c) In time, most schools will be designated as “needs improvement” as the Office of the Legislative Auditor predicted that in 2014 when all schools are expected to meet this standard that 80-100% of schools may be designated as “needs improvement” (Nathan, 2004)
C) Community Impact of Losing a School
1) Schools contribute to the long-term development of a neighborhood community as they add to local economies (Brunner & Sonstelie, 2003 & Lawrence, et. al., 2002)
2) Houses in neighborhoods with good public schools have higher property values than those with bad public schools (Brunner & Sonstelie, 2003) (a) Loss of a school causes property values to decline (Lawrence,
et.al., 2002) (b) Without a school, it is difficult to attract young families and
population and subsequently economic development falls (Lawrence, et.al., 2002)
3) Schools increase community cohesion (Lawrence, et.al., 2002) 4) Loss of citizen control over the schools, which may decrease civic
participation overall (Lawrence, et.al., 2002)

36
5) Long-term school performance and perceptions of school performance in the community affect housing prices (Gale, et. al., 2003)
6) A study by Brain Jacob in the Chicago Public schools found that improvements in testing scores had more to do with parental involvement and student effort than funding inputs (Gale, et. al., 2003)
D) Small Schools
1) The average school size and district size has been increasing since the 1940s with the United States; average school size 127 in 1940, now 653 students today (Lawrence, et.al., 2002)
2) Small Schools Research (a) It has been 30 years since a study recommended bigger schools
(Irmsher, 1997 & Lawrence, et.al., 2002) (b) Large volume of research has shown that smaller schools are
better for students, especially low-income students, minority, female, and/or special-needs students (Irmsher, 1997; Lawrence, et.al., 2002; MPS Communications, 2004; Nathan & Febey, 2001 & Raywid, 1999) (i) Safer – less violence, less vandalism (ii) Graduate higher percentage of students
• Small school graduate rates: 64% • Large school graduate rates: 51-56%
(iii) More go on to post-secondary education (iv) Better attendance (v) Increased sense of belonging (vi) Higher grade point averages (vii) Increased participation in extracurricular activities (viii) Increased parent and community involvement (ix) Higher outcomes on standardized tests (x) Increased student performance (effect found to be more
than classroom size) (xi) Increased teacher collaboration and team teaching (xii) Less formal bureaucracy (xiii) People know each other better
3) Researchers are unsure of how small, “small” is and the numbers of students in a “small” school is debatable. Although the exact numbers vary almost all research recommends no fewer than 300 students or more than 900 students (Irmsher, 1997; Lawrence, et. al., 2002 & Raywid, 1999)
4) Cost Analysis of Small Schools (a) Larger school argument was that larger schools would be
cheaper because of economies of scale, but recent research has shown that larger schools have much inefficiency because of the added administration, security, maintenance and operations employees that are needed to run a larger school (Lawrence, et. al., 2002 & Lawrence, 2003)
37
(b) Because dropout rates are lower for smaller schools, the cost per graduate in a smaller school compared to a larger school is actually lower and there is an additional societal cost of more dropouts in larger schools (Irmsher, 1997; Lawrence, et.al., 2002 & Raywid, 1999)
(c) Some small scale efficiencies (Lawrence, et. al., 2002) (i) Guidance counselors are more effective when they have a
smaller caseload and know the students better (ii) Transportation costs are rising overall and are especially
bigger for larger, consolidated schools (Lawrence, et.al., 2002 & Nathan & Febey, 2001)
(d) Smallest schools should exist in the poorest communities (Lawrence, et.al., 2002)
(e) Budget cuts tend to affect smaller schools more than larger schools (Schoeckel, 2000)
5) Cost saving strategies for small schools (a) Can widen the grade span of each school to lower the number of
students in each grade and keep smaller schools (Lawrence, et.al., 2002)
(b) Utilize web-based technology and have specialized courses taught from experts away from the school (Lawrence, et.al., 2002)
(c) Share staff and teachers with other schools (Lawrence, et. al., 2002).
(d) Building sharing: house 2 or more separate functioning schools in one building (Irmsher, 2004; Lawrence, 2003 & Nathan & Febey, 2001)
(e) Find community partners for the schools (Lawrence, et.al., 2002 & Nathan & Febey, 2001)
(f) Lease unused or underused space (Lawrence, et. al., 2002 & Lawrence, 2003)
E) Historic Schools
1) “They have recycling bins in the cafeteria, and yet they were planning to cart the whole school off to the landfill.” Parent trying to save his daughter’s historic school from demolition (Beaumont & Pianca, 2002)
2) In June 2000, the National Trust for Historic Preservation added historic neighborhood schools to its list of “America’s 11 most endangered places” (Beaumont & Pianca, 2002) (a) This was due in part because of:
(i) Lack of money for repairs (ii) Assuming that new is always better than old (iii) Public policy that discourages old school maintenance (iv) The construction of mega schools in remote locations
(b) This was also due in part because schools were important civil landmarks that represented community pride and public participation

38
3) Several public policies hinder the ability to keep historic schools (Beaumont & Pianca, 2002) (a) Minimum acreage requirements with Minnesota recommending 2
times the acreage for high schools as are recommended federally, 60 acres per high school, plus 1 acre for every 100 students (Beaumont & Pianca, 2002 & Lawrence et.al, 2002))
(b) Funding formulas that favor new schools over old schools. In Minnesota, if the cost of renovation of an older school exceeds 60% of the cost of a new school, the school district should build a new if the district wants to receive state financial assistance (Beaumont & Pianca, 2002 & Lawrence, et. al., 2002)
(c) Schools are being exempt from local zoning and planning laws (Beaumont & Pianca, 2002)
(d) Building codes are written for new construction, not for updating old construction
(e) In Minnesota, there is a state policy that favors new school construction over renovation and with the state’s funding assistance program for new schools, a new school that may cost more overall but will cost districts less (Beaumont & Pianca, 2002)
4) Problems with large, mega schools built outside of the neighborhood (a) New construction favors the trend for bigger schools
(i) Bigger is not always better (Beaumont & Pianca, 2002) (ii) Many studies have found that small schools produce better
academic achievement, less behavior problems, and lower dropout rates
(b) Schools are a vital part of the community and keep the neighborhood thriving
(c) Children cannot walk or ride bikes to schools outside their community, and instead have to ride the bus or have their parents drive them to school
5) Recommendations for Local Practices (Beaumont & Pianca, 2002) (a) Devote a certain percentage of budget to building maintenance (b) Keep community meetings open and the community informed (c) Select firms that are not biased towards new construction and
know about renovation (d) Be wary of the interest of developers (e) Example of a historic building success is in Hibbing, Minnesota
when their preserved historic school is a landmark and an icon in the community
F) Financing Issues
1) Financing Education in Minnesota (a) 42 cents of every dollar in state tax money is spent on
education (Cecconi, 2004)

39
(b) K through 12 financing is through a combination of state-collected taxes (income and sales) and locally collected property taxes (Crowe, 2002)
(c) Basic General Education Formula Revenue (i) This basically is the amount of money the schools get per
pupil. For the last few years, the amount has been $ 4,601 per pupil (Cecconi, 2004 & Crowe, 2002)
(ii) Of this money, some money must be set aside to have kindergarten and elementary classes have a 1 to 17 teacher to student ratio (Crowe, 2002)
(d) Compensatory Revenue is the amount of money school sites receive when their students qualify for free and reduces lunches. The amount increases as the percent of students who qualify increases, but the percent is capped (Cecconi, 2004 & Crowe, 2002) (i) At this time, the percent cap is 25% meaning that those
schools with over 25% free and reduced lunch students do not receive anymore compensatory revenue. This especially affects Minneapolis Public Schools when 68% of the students receive free and reduced lunches (Cecconi, 2004)
(e) Limited English Proficiency is the revenue schools receive for having English Language Learners in their school. Those with high concentrations of English Language Learners receive more funding (Cecconi, 2004 & Crowe, 2002). However, schools only receive 5 years of Limited English Proficiency money per student although it takes longer than 5 years to learn academic English (Cecconi, 2004)
(f) Equity Revenue is revenue that tries to keep school funding for all Minnesota schools within a similar range. This particular revenue does not include Minneapolis
(g) Referendum is a system that allows tax payers to vote to increase their revenue to their general fund (i) This amount is capped at 18.2 percent of the basic general
education formula allowance (Cecconi, 2004 & Crowe, 2002) (ii) Levies are for increasing spending on learning and in
classroom costs, such as the current Minneapolis Public Schools levy that is to decrease classroom size (Cecconi, 2004 & Crowe, 2002)
(iii) Bonds are for buildings, either remodeling or building new facilities (Cecconi, 2004 & Crowe, 2002)
(h) Other Revenues (Crowe, 2002): (i) Sparsity revenue (ii) Operating Capital Revenue (iii) Training and Experience Revenue (iv) Special Education Revenue (v) School Lunch Aid (vi) Debt Service Equalization Aid
(i) Why have districts been losing money?
40
(i) Changes to property tax laws have affected school revenues • Tax rate for businesses have been decreased from 4
percent to 1 percent • Property taxes on summer cabins going to local schools
has been eliminated (Cecconi, 2004) (ii) The per pupil general education revenue has only increased
1.14% in real terms since 1992 while the rate of inflation has been 14.9% (Cecconi, 2004)
(iii) Since referendums can only be 18.2% of the general education revenue and the general education revenue has not kept up with inflation, the referendums have also not kept up with inflation (Cecconi, 2004)
(iv) 2001 General Education Buy Down; the state decided to take a larger burden of school funding as part of the state’s budget, but they did not increase their revenues to take on this additional $2 billion burden of this policy (Cecconi, 2004)
(j) Pawlenty’s Education Finance Reform (i) His July 2004 report from a education finance reform task
force calls for a new funding formula for schools that would cover the real costs of educating students with state’s academic requirements (Draper, 2004)
(ii) Has faced criticism that it does not add any big new ideas and that it is taking away from the need for more real dollars in the schools; system (Draper, 2004)
2) Has been found that indirect effects of policy change, such as households moving to other districts and switching to alternatives from traditional public schools, is having a greater effect on school performance than funding levels and resources (Gale, et. al., 2003)
3) When state aid targets poorer schools, all schools have greater improvement (Gale, et. al., 2003)
VII) Present Community Values about the Schools in Longfellow
Neighborhood A) The information contained in this section is based on focus groups
conducted by Anne Rollings during the summer of 2004 1) Recruitment was based from existing list serves and parent groups
in the neighborhood 2) Participation in these focus groups was voluntary 3) Participants were not randomly selected, and thus are not wholly
representative of the Longfellow Community 4) Participants were from every Longfellow school, area private
schools, charter schools, teachers from Longfellow schools, administrators from Longfellow schools, and community members
B) What do people like about the Longfellow neighborhood?
41
1) Common responses were: sense of community, parks and gardens, location as a contained community close to downtown, has/had (may not anymore) affordable housing
2) Some conflicting responses: lack of diversity vs. diversity, like the number of schools vs. feel it is a problem
C) What do parents value in schools?
1) Common Responses: safe school, educationally challenging, caring staff, neighborhood connection to community, proximity to home, “feel” of the schools, curriculum options
2) Conflicting Responses: choice D) How have Longfellow schools lived up to parental expectations?
1) Vast majority liked their children’s schools 2) Many were surprised at how much their schools lived up to and
surpassed their expectations, especially those that send their children to community schools after not getting into magnet schools
3) Some parents were concerned about sending children to Sanford because it is a much bigger school and because of behavioral issues there
E) How do Longfellow community members view Minneapolis Public
Schools? 1) Vast majority agreed that they had no general direction or goal 2) Other viewpoints expressed: abandoning communities, not having
community connections, no valid community input method, not doing anything about children leaving the district, inadequate funding affecting their ability to work effectively, focus on parts of the district and certain schools, but not the whole picture
3) Many felt that the district’s building statistics and general statistics were not accurate, thus were frustrated when the district made decisions based on outdated data
F) What would Longfellow community members like to see for
Minneapolis Public Schools? 1) Vast majority wanted stability in the system. This was a common
and strongly expressed viewpoint. Almost everyone wanted a long-term solution so that the schools and programs offered to students would remain consistent.
2) Most people agreed that they need a better marketing/public relations strategy, especially in terms of marketing community schools
3) Most wanted community and parents to come together 4) Many wanted the district to model schools after successful schools
in the district 5) Other suggestions: educate adults about importance of education
and educational funding, reduce size of districts or decentralize the

42
district, build ties between community and the school system, encourage schools that are part of the community, PTO, principal, staff, community summit of area schools
G) Ideas for Minneapolis Public Schools Budget Deficit Problems
1) The majority thought that the problem lies in the present political power, so that we need to educate people about how state and federal policies are affecting the school board
2) Most wanted a marketing campaign to increase enrollment, thus increasing revenue
3) Many thought they needed a more concise discussion of the budget 4) Many thought they needed to engage businesses in investing in the
schools
H) Ideas and models for community involvement in Longfellow Schools 1) Widely expressed that the community, parents, and students need
to have more after hours access to the buildings 2) If there is additional room in schools, house community agencies in
those places so that families have multiple resources in one location
3) Have day care programs in the schools, which may bring revenue to the schools as well as convenience for parents
4) Cooper community night sited as a great example of getting parents and kids involved in the schools
5) Need more use of the buildings by the community. Find a solution for the paying the janitor to stay past working hours policy.
6) Need LCC Education Night 7) Schools need to advertise their space to let the community know it
is available I) View of charter schools
1) There were many misconceptions about what a charter school is and is not and how they differ from magnet, vouchers, and other initiatives
2) Most had a negative or neutral view of charter schools 3) Some wanted traditional public schools to look at charter schools
that were successful and use them to help change their own policies
4) Some question why parents want to send their children to charter schools as they are not proven to be better academically: is it because of racism or because they want smaller schools?
5) Some expressed that charter schools still do not attract the most difficult behavioral and special education cases leaving Minneapolis Public Schools with the neediest children
J) Interesting Notes

43
1) Many non-parent and parent community members felt there needs to be more outreach to the whole community
2) Most people wanted a shared vision and unity in the neighborhood, but many unsure if one exists
3) Some people had a very negative view of the Welcome Centers and school fairs citing that they were contributing to Longfellow enrollment declines (a) A few stories about the Welcome Center telling parents that
some Longfellow Schools were closed when in fact they were not (b) A few stories about the Welcome Center and school fairs giving
negative view of Longfellow’s schools 4) Most people accepted that some of Longfellow schools would be
closed/merged, but many just wanted the buildings to be used for a community purpose, not for other development
5) Many people praised the idea of small schools, but were willing to accept that schools with 200 children is not feasible
6) Widely expressed opinion was that School Board members should be accountable to an area, not picked from the city at large
7) A few expressed that parents should be held more accountable for their child’s achievement and behavior
8) Some did not like the sense of competition between private, charter, and traditional public schools, but instead wanted people to work together for better education
9) Some private school parents thought that private schools had a multicultural environment that does not set races against each other
10) All private and charter school parents were concerned about the future of public schools and believed that they should be more heavily funded
Working Bibliography 1. “Come Play at Hiawatha School Park Playground.” Editorial.
Longfellow/Nokomis Messenger December 2000, 18(9):5. 2. “Community Engagement Process.” Minneapolis Public Schools. July
2004 (www.mpls.k12.mn.us/Community-Engagement_Process). 3. “Cooper Community Schools pairs up with Cargill, U of MN.”
Longfellow/Nokomis Messenger January 2002, 21(12): 7. 4. “Dowling Urban Environment.” Minneapolis Public Schools Dowling
Urban Environmental Magnet. Retrieved 26 August 2004 (http://dowling.mpls.k12.mn.us).
5. “Enrollment shifts; Replicate the best programs.” Minneapolis Star Tribune 17 November 2003: Metro Edition.

44
6. “Facts You Should Know.” Minneapolis Public Schools. 21 June 2004 (www.mpls.k12.mn.us/MPS_Facts.html).
7. “Get Involved in Minneapolis Public Schools’ Issues.” Editorial. Longfellow/Nokomis Messenger June 2004, 21(3):1.
8. “Hiawatha.” Minneapolis Public Schools. Retrieved 26 August 20044 (https://secure.mpls.mn.us/schoolinfo/elementary_school.cfm).
9. “Howe Community School.” Minneapolis Public Schools Howe Community School. Retrieved 26 August 2004 (http://howe.mpls.k12.mn.us).
10.“Minneapolis Public Schools Districtwide Assessment Results 2002-2003 School Year.” Minneapolis Public Schools Research and Development: Minneapolis, MN, retrieved on 15 August 2004 (http://rea.mpls.k12.mn.us/realink.html).
11.“MPS Board of Education to Consider Long-Range Planning to Provide Better School and Program Options.” Minneapolis Public Schools. 9 September 2003 (www.mpls.k12.mn.us/September_9).
12.“NAACP Lawsuit settlement yields more school choice, accountability.” Minneapolis Star Tribune 20 March 2000, State and Regional Section.
13. “No Families Left for Longfellow.” Editorial. Longfellow/Nokomis Messenger March 2004, 20(12):5.
14.“Sanford Middle School Receives $4,000 Arts Grant from State Board.” Longfellow/Nokomis Messenger February 2004, 20(11):3.
15.“School Information Report 2002-2003.” Minneapolis Public Schools. 10 July 2004 (www.incschools.com/mpls).
16.“Twin Cities' schools swamped with immigrants.” Minneapolis Star Tribune, 20 September 1999: State and Regional Section.
17.“Welcome Center Information could have Impacted Howe Schools Enrollment.” Editorial. Longfellow/Nokomis Messenger October 2003, 20(7):1.
18.Aaron, Novodvorsky, member of East Area River Schools Task Force. Personal Interview. 26 August 2004.
19.Abernathy, Scott F. ”Charter Schools, Parents, and Public Schools in Minnesota.” Cura Reporter 34(2004): 1-7.
20.Associated Press. “Minneapolis Superintendent accepts Memphis job.” Star Tribune Minneapolis, MN: 31 July 2003: State and Regional Section.
21.Associated Press. “NAACP, state settles lawsuit over Minneapolis Public Schools.” Minneapolis Star Tribune 13 March 2000: State and Regional Section.
22.Baker, Lisa & Katy Benson, members of the Howe parent/teacher organization. Personal interview. 4 August 2004.
23. Beaumont, Constance E. & Elizabeth G. Pianca. “Why Johnny Can’t Walk to School.” National Trust for Historic Preservation 2nd Edition, Washington D.C., October 2004.
24.Bennet, Deborah. “Real Progress” email to Minneapolis Public school board, Interim Superintendent David Jennings, and Longfellow Community Council. 28 October 2003.

45
25.Bentley, Rosalind. “Coalition’s quest puts it in limelight.” Minneapolis Star Tribune 9 October 2003: 21A.
26.Berger, Kevin J. “East River School Task Force weighs school closure options.” Longfellow/Nokomis Messenger May 2002, 22(4): 2.
27.Berger, Kevin J. “East River Schools Task Force making six recommendations to district.” Longfellow/Nokomis Messenger June 2002, 22(5):1 &5.
28.Berger, Kevin J. “Task force charger with developing recommendations for school closings.” Longfellow/Nokomis Messenger April 2002, 22(3): 1.
29.Bielick, Stacey, Chandler, Kathryn, and Broughman, Stephen. ”Home-Schooling in the United States:1999.” National Center for Education Statistics , 2001 (http://nces.ed.gov/pubsearch/pubsinfo.asp?pubid=2001033).
30.Brandt, Steve. “Minneapolis schools face 4th year of cuts; Once again, there will be fewer teachers, aides and classrooms.” Minneapolis Star Tribune 29 June 2004: 1B.
31.Brasington, David M. “Which Measures of School Quality Does the Housing Market Values.” Journal of Real Estate Research. 18(1999):395-413.
32.Brasington, David M. “Which Measures of School Quality Does the Housing Market Value.” Journal of Real Estate Research 12(1999): 395-413.
33.Brasington, David M. School District Consolidation, Student Performance, and Housing Values. Department of Economics: Ohio State University, Columbus, Ohio, 12 March 1998.
34.Brotz, Deborah. “Cargill Corp. grant helps Sanford Middle School boost parent involvement in the classroom.” Longfellow/Nokomis Messenger March 2002: 22(1): 14.
35.Brotz, Deborah. “Parents, staff grapple with complaints of bullying at Sanford Middle School.” Longfellow/Nokomis Messenger June 2003: 20(3): 2.
36.Brotz, Deborah. “Sanford Middle Schools Students Study History “Hands-on” in England, France.” Longfellow/Nokomis Messenger June 2004: 21(3):1.
37.Brotz, Deborah. “Sanford Principal Experiences Life in Nairobi, Kenya.” Longfellow/Nokomis Messenger November 2003: 20(8):1.
38.Brotz, Deborah. “School Board vote on school closures/mergers expected October 8th.” Longfellow/Nokomis Messenger October 2002: 22(8): 2.
39.Brunner, Eric and Job Sonstelie. “Homeowners, Property Values, and the Political Economy of the School Voucher.” Journal of Urban Economics. 54(2003):239-257.
40.Bulkley, Katrina & Fisler, Jennifer. “A Decade of Charter Schools: From Theory to Practice.” Educational Policy. 17(2003):317-342.
41.Cecconi, Mary, State Director of Parent United Network. Personal Interview. 6 August 2004.
46
42.Center for School Change and the Mason-Dixon Polling Firm. CSC Public School Choice Poll Summary. Minneapolis: University of Minnesota Humphrey Institute, February 2004.
43.Crowe, Greg. “Financing Education in Minnesota.” Minnesota House of Representative Fiscal Analysis Department. Saint Paul, Minnesota. August 2002.
44.Davis, Harry W., Davis, John B., & Nathan, Joe. “School board Should Take to Heart Lessons of Strong Schools.” Minneapolis Star Tribune 26 February 2004: A17.
45.Davis, Meredith, Principal of Sanford Middle School. Personal interview. 13 July 2004.
46.Dietrich, Neil. “Reapportionment and retirements change legislative races; four school board seats also up for election.” Longfellow/Nokomis Messenger November 2002: 22(8):2.
47.Draper, Norman. “Aplenty on school funding report: Nice start.” Minneapolis Star Tribune 9 July 2004: 1A.
48.Draper, Norman. “Doing the Math; Public versus Private.” Minneapolis Star Tribune 30 June 2002: 1A.
49.Drew, Duchesne Paul. “District drops transfer ban; White students at Minneapolis public schools now may go outside the city.” Minneapolis Star Tribune 1 March 1997: 1A.
50.Dry food, Joy G. Evaluation of Community Schools: Findings to Date. Coalition for Community Schools: Washington, D.C., 2001 (www.communityschools.org/evaluation/evalprint.html).
51.Duchesne, Paul Drew. “Debating Black Students’ Education: Observers say both district, families must make fixes.” Minneapolis Star Tribune13 February 2000: 1B.
52.Gale, William G., Meghan McNally & Janet Rothenberg Pack. An Economic Perspective on Urban Education: Policy Brief #15. The Brookings Institute: Washington D.C., 2003 (http://www.brook.edu/printme.wbs?page=/comm/conferencereport/cr15.htm).
53.Gray, Karen, Hall, Nora, Grayhall LLP Deanna Mills and Michael Scandrett, Halleland Health Consulting, Tony Looking Elk, and Urban Coalition. “Proposal to Design and Implement a Community Engagement Process.” Minneapolis Public Schools, Minneapolis Public Schools Community Engagement Processes 27 April 2004 (www.mpls.k12.mn.us/Community_Engagement_Process).
54.Grow, Doug. “A thankless job she’s willing to do.” Minneapolis Star Tribune 6 September 1999: 2B.
55.Grow, Doug. “School board chief remains focused on helping kids.” Minneapolis Star Tribune 11 February 1998: 2B.
56.Grow, Doug. “Spending to save just might work; School’s finance offer has history of getting things done.” Minneapolis Star Tribune 17 December 2001: 2B.
57.Hall, Nora D., & Gray, Karen, Consultants for GrayHall LLP, consulting firm for the Minneapolis Public Schools 2004 community engagement
47
process, “River Schools Collective meeting”. Resource Center of the Americas, Minneapolis. 22 July 2004.
58.Hardy, Lawrence. “Learning without School.” American School Board Journal (2001) 14-19.
59.Hassel, Brain C., president, public impact. The Charter School Debate. The Brookings Institute: Washington D.C., 18 February 2004 (http://www.brook.edu/comm/events/20040218.html).
60.Heistad, David, Director of Minneapolis Public Schools Department of Research, Evaluation, and Assessment. Personal interview. 1 July 2004.
61.Henig, Jeffrey R., Holyoke, Thomas, T., Lacireno-Paguet, & Moser, Michele. “Privatization, Politics, and Urban Services: The Political Behavior of Charter Schools.” Journal of Urban Affairs 25(2003):37-54.
62.Hernandez, Raymond. ”Pressure Grows For Schools Led By the Parents.” The New York Times 28 February 1998: A1 & A8.
63.Hill, Paul T. “How Home Schooling Will Change Public Education.” Hoover Digest summer 2000 (http://www.brook.edu/views/articles/hill/2000hoover.html).
64.Hokkanen, Nancy. “Governor’s plan cuts another $3.1 million.” Longfellow/Nokomis Messenger March 2001: 18(12): 7.
65.Hokkanen, Nancy. “Minneapolis schools grapple with shortage of supplies.” Longfellow/Nokomis Messenger January 2001: 18(10): 5.
66.Irmsher, Karen. “School Size.” Eric Clearinghouse on Educational Management. 113(July 1997): 2-3.
67.Kennedy, Mike. “Charter Schools: Threat of Boon to Public Schools.” American Schools and University (2002):19-26.
68.Lawrence, Barbara Kent. “Back to the Agora: Workable Solutions for Small Urban School Facilities.” Eric Clearinghouse on Rural Education and Small Schools. (September 2003).
69.Lawrence, Barbara Kent., Bingler, Steven., Diamond, Barbara M., Hill, Bobbie, Hoffman, Jerry L., Howley, Craig B., Mitchell, Stacy., Rudolph, David, & Washor., Elliott. Dollars and Sense: The Cost Effectiveness of Small Schools. Knowledge Works Foundation: Cincinnati, Ohio, 2002.
70.Levy, Paul. “FYI: School Marketing.” Minneapolis Star Tribune1 February 2000: 1B.
71.Loveless, Tom, Senior Fellow in Governmental Studies and Director of the Brown Center on Education Policy. Education Vouchers and Charter Schools. Brookings Institute: Washington D.C., 24 February 2000 (http://www.brook.edu/comm/chat/loveless000224.htm).
72.Lubienski, Chris. “Redefining “Public” Education: Charter Schools, Common Schools, and the Rhetoric or Reform.” Teachers College Record 103(2001): 634-666.
73.McAuliffe, Bill. “School closing plan may speed exodus; Some parents looking outside of Minneapolis.” Minneapolis Star Tribune, 13 February 2004: 1B.
74.McCarthy, Maureen. “No Child Left Behind explained.” Minneapolis Star Tribune 26 January 2003: 14A.
48
75.Minneapolis Public Schools Facilities Planning Team. “Community Open Houses: Minneapolis Public Schools Facility Utilization Planning Team.” Lucy Craft Laney School. Cleveland Park. 3 August 2004.
76.Minnesota State Department of Education and Center for Schools Change. Minneapolis Charter Totals. Minneapolis: University of Minnesota Humphrey Institute, June 2004.
77.Mintrom, Michael. “Market Organizations and Deliberative Democracy: Choice and Voice in the Public Service Delivery.” Administration and Society 35(2003): 52-81.
78.MPS Communications Department, An Overview of Minneapolis Public Schools. Minneapolis Public Schools Communications Department: Minneapolis, MN 6 April 2004 (www.mpls.k12.mn.us).
79.Nathan, Joe & Karen Febey. Smaller, Safer, Saner Successful Schools. National Clearinghouse for Educational Facilities, Center for School Change, Humphrey Institute of the University of Minnesota: Minneapolis, MN, 2001.
80.Nathan, Joe, Director of Center for School Change. Personal interview. 25 June 2004.
81.Nathan, Joe. “A Charter School Decade.” Education Week (2002): 32-35.
82.Nathan, Joe. Early Trends of the No Child Left Behind Act for Upper Midwestern States. Center for the Study of Politics, Hubert H. Humphrey Institute of Public Affairs of the University of Minnesota: Minneapolis, MN, 2004.
83.Nathanison, Iric. “Longfellow Bears the Brunt of the Citywide School Closing Plan.” Longfellow/Nokomis Messenger March 2004: 20(12):1.
84.Nathanison, Iric. “Longfellow Community urges Minneapolis School Board to Delay Facilities Decision.” Longfellow/Nokomis Messenger October 2003: 20(7):1.
85.Nathanison, Iric. “Longfellow/Nokomis schools feel tip of budget ax.” Longfellow/Nokomis Messenger January 2004: 20(10): 2.
86.Nathanson, Iric. “Howe, Sanford Schools Win Temporary Reprieve.” Longfellow/Nokomis Messenger November 2003: 20(8):6.
87.Nathanson, Iric. “Longfellow/Nokomis schools feel tip of budget ax.” Longfellow/Nokomis Messenger January 2004: 20(10):2.
88.O’Brien, John, “Minneapolis reeling from $30 million budget deficit.” Longfellow/Nokomis Messenger February 2002: 22(1): 1 & 12.
89.O’Brien, John, “Minneapolis residents vote with hearts, minds on School District woes.” Longfellow/Nokomis Messenger March 2002: 22(1):2.
90.O’Connor, Anne. “Fair to poor opinion of Twin Cities schools similar to ’95; Minneapolis: Public optimistic about shift to community schools.” Minneapolis Star Tribune 6 September 1996: 1B.
91.O’Connor, Anne. “Mediation between state and NAACP falls through; Parties couldn’t solve busing issue.” Minneapolis Star Tribune19 November 1999: 1A.
92.O’Connor, Anne. “Minneapolis schools are in good financial shape.” Minneapolis Star Tribune 26 November 1997: 3B.

49
93.O’Connor, Anne. “Minneapolis superintendent widely praised for first year.” Minneapolis Star Tribune 20 August 1998: 1B.
94.O’Connor, Anne. ”Full-Day Class gives kids more help earlier; Minneapolis plans to offer all-day kindergarten in each of its elementary schools.” Minneapolis Star Tribune 25 February 2000: 1A.
95.Peterson, David. “Millions spent, but test scores still low.” Minneapolis Star Tribune 22 April 1997: 1B.
96.Powell, Allen II. “Centers aim to school parents about schools; The Minneapolis NAACP is trying to help black parents help their kids.” Minneapolis Star Tribune 16 August 2003: 1B.
97.Raywid, Mary Anne. “Current Literature on Small Schools.” Eric Digest (January 1999) (http://www.ael.org/eric/digests/edorc988.htm).
98.Reddick, Robert Nelson. “History, Myth, and the Politics or Educational Reform.” Educational Theory 54(2004):73 – 89.
99.Sanford Middle School PTSA and Meredith Davis. “Riverside Preparatory Proposal.” E-mail to the Minneapolis Public School Board from Meredith Davis.
100. Scallon, Tony, Superintendent of Minnesota Transitions School. Personal Interview. 29 July 2004.
101. Shah, Allie. “After years of addition, schools in Minneapolis start subtraction.” Minneapolis Star Tribune 3 March 2002: 1B.
102. Shah, Allie. “District insider to head Minneapolis schools; Jennings is board’s head.” Minneapolis Star Tribune 24 September 2003: 1A.
103. Shah, Allie. “Hundreds rally for school money; Minneapolis voters urged to pay more to cut class sizes.” Minneapolis Star Tribune 20 September 2000: 1B.
104. Shah, Allie. “Innovative schools nearing end; The planned closing of six Minneapolis schools in 2002 shows how hard it is to maintain the edge they were intended to provide.” Minneapolis Star Tribune 26 August 2001: 1B.
105. Shah, Allie. “Jennings glad he can help schools; The Minneapolis district’s new finance expert is ready to tackle the budget challenges.” Minneapolis Star Tribune 17 December 2001: 1B.
106. Shah, Allie. “Losing out to charter schools.” Minneapolis Star Tribune January 2003: 1B.
107. Shah, Allie. “Minneapolis District offers guarantee on school choice.” Minneapolis Star Tribune 7 December 2000: 3B.
108. Shah, Allie. “Minneapolis School Board Candidates; On Nov. 6, all Minneapolis votes get to choose three school board candidates from a field of six citywide hopefuls. Ross Taylor is the only incumbent seeking reelection.” Minneapolis Star Tribune 29 October 2001: 7B.
109. Shah, Allie. “Minneapolis schools face wider racial learning gap; A new report also cites 8 schools with severe problems.” Minneapolis Star Tribune 29 November 2000: 1A.
110. Shah, Allie. “Minneapolis schools plan stirs emotions.” Minneapolis Star Tribune17 September 2003: 5B.
50
111. Shah, Allie. “Minneapolis superintendent gets pay raise; In its annual review of Carol Johnson, the school board noted the district’s successes, raised pay by $10,000.” Minneapolis Star Tribune13 December 2000; 3B.
112. Shah, Allie. “Minneapolis Won’t Build on School Garden Land; District Looking at Changes, but Rejects that One.” Minneapolis Start Tribune 4 September 2003: 3B.
113. Shah, Allie. “Minneapolis’ Morris Park school to close next spring; School board votes to expand 2 other elementary schools.” Minneapolis Star Tribune 9 October 2002: 2B.
114. Shah, Allie. “Progress, problems in schools; The Measuring Up report offers a mixed view of the Minneapolis district.” Minneapolis Star Tribune 25 October 2001: 1B.
115. Shah, Allie. “School Budget Shortfalls; Minneapolis aims for $30 million trim.” Minneapolis Star Tribune 9 January 2002: 1A.
116. Shah, Allie. “Teachers protest in Minneapolis; Hundreds paraded against what they called violations of their contract. “ Minneapolis Star Tribune 10 September 2003: 1B.
117. Simon-Sharken, Judy, Parent Teacher Organization President for Cooper Elementary School and River School Collective Founder. Personal interview. 21 June 2004.
118. Smetanka, Mary Jane. “Remapping the schools; Minneapolis ready for neighborhood schools again.” Minneapolis Star Tribune 28 November 1995: 1A.
119. Stoeckel, Christina. “School grappling with budget cuts… Hiawatha School parents send out S.O.S.,” Longfellow/Nokomis Messenger May 2000: 18(2): 7.
120. Sturdevant, Lori. “For Jennings, yet another hat; His strengths should serve Minneapolis schools well.” Minneapolis Star Tribune 10 August 2003: 4A.
121. Talluto, Rebecca. “Accountability for Home-Schoolers.” American School Board Journal (2001): 20-21.
122. Tanick, Marshall H. “Schools make it easy for chief to leave.” Minneapolis Star Tribune August 2003: 13A.
123. The Center for Educational Reform. Minnesota Charter Law. Washington D.C. 27 July 2004. (Http://www.edreformcom/index.cfm?fuseAction=cLaw&stateIC=42).
124. Tinkleberg, Aaron. “Hiawatha School parents prove ‘It Takes A Village’ to raise a playground,” Longfellow/Nokomis Messenger October 2000: 18(4): 1&15.
125. Tinkleberg, Aaron. “Hiawatha School Playground will be dedicated to community that built it.” Longfellow/Nokomis Messenger September 2001: 21(8): 1 & 20.
126. Toch, Thomas. “Whittling Away the Public School Monopoly.” The Wall Street Journal 15 November 1999 (http://www.brook.edu/views/op-ed/toch/19991115.html).
127. Townsend, Dwayne and Longfellow Community Council. Letter to Minneapolis school board members, 16 October 2003.
51
128. United States Census Bureau, City of Minneapolis Census Information by Neighborhood. 2000 (http://www.ci.minneapolis.mn.us/citywork/planning/census2000).
129. United States Department of Education. Executive Summary. 28 July 2004 (http://www.ed.gov/print/nclb/overview/intro/execsumm.html).
130. United States Department of Education. Fact Sheet on the Major Provisions of the Conference Report to H.R. 1, the No Child Left Behind Act. 28 July 2004 (http://www.ed.gov/print/nclb/overview/intro/factsheet.html).
131. United States Department of Education. Four Pillars of NCLB. 28 July 2004 (http://www.ed.gov/print/nclb/overview/intro/4pillars.html).
132. United States Department of Education. Introduction: No Child Left Behind. 28 July 2004 (http://www.ed.gov/print/nclb/overview/intro/index.html).
133. Weil, Danny. Charter Schools: A Reference Handbook, Danny Weil, 2000.
The University of Minnesota is committed to the policy that all persons shall have equal access to its programs, facilities, and employment without regard to race, color, creed, religion, national origin, sex, age, marital status, disability, public
assistance status, veteran status, or sexual orientation.