an overview of the carbon dioxide pilot test in the hall ... · ad astra per aspera to the stars...
TRANSCRIPT

An Overview of the Carbon Dioxide Pilot Test in the Hall
Gurney Field in Russell County, Kansas
G. Paul WillhiteTertiary Oil Recovery Project
University of Kansas
10th ANNUAL CO2 FLOODING CONFERENCEMidland, Tx
December 2004www.spe-pb.org

AD ASTRA PER ASPERAAD ASTRA PER ASPERA
To The Stars Through DifficultiesTo The Stars Through Difficulties

Outline of Presentation
• Background• Scope of Project• Objectives• Results to Date• What We Have Learned• Remaining Challenges

http://www.kgs.ku.edu/CO2/reports.html
Field Demonstration of CO2Miscible Flooding
in the Lansing-Kansas City Formation, Central Kansas
Class II Revisited DE-AC26-00BC15124Project Began March 8,2000
Murfin and WI Partners

Project Funding-DOE Class Revisited Program
• Budget Period 1: Reservoir Characterization and Advanced Recovery AnalysisMarch 2000-February 2004(DOE Cost Share 45%)
• Budget Period 2: Field Demonstration and Analysis: February 2004- December 2008(DOE Cost Share 35%)
• Budget Period 3:Monitoring and Post Flood Analysis: January 2009-March 2010(DOE Cost Share 10%)

Pilot Site Located in Largest LKC Field: Hall-Gurney
55 MMBO
19 MMBO

Murfin Colliver and Carter
Leases-LKC C Zone Murfin
Colliver
MurfinTB Carter
KM Carter
28
33
14S-13W Russell Co., Kansas
7
10
12
9
1318
COLLIVERCOLLIVER•• OOIP = 4238 MSTB OOIP = 4238 MSTB •• P&S = 2383 MSTBP&S = 2383 MSTB (56%)(56%)•• REM= 1855 MSTBREM= 1855 MSTB
CARTERCARTER•• OOIP = 1974 MSTB OOIP = 1974 MSTB •• P&S = 852 MSTB(43%)P&S = 852 MSTB(43%)•• REM = 1122MSTBREM = 1122MSTB
•• Waterflood ended ~1984Waterflood ended ~1984•• Lease owned by GE, MV Lease owned by GE, MV
Energy Energy •• Operated by MurfinOperated by Murfin
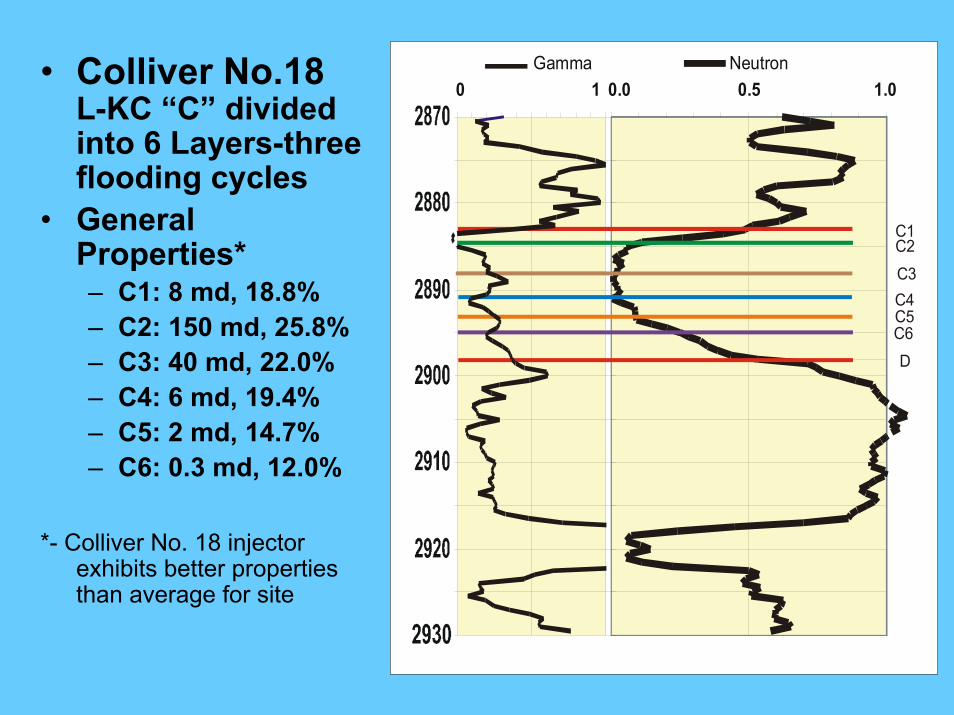
0.0 0.5 1.0Neutron
C1C2C3C4C5C6D
Gamma10• Colliver No.18
L-KC “C” divided into 6 Layers-three flooding cycles
• General Properties*– C1: 8 md, 18.8%– C2: 150 md, 25.8%– C3: 40 md, 22.0%– C4: 6 md, 19.4%– C5: 2 md, 14.7%– C6: 0.3 md, 12.0%
*- Colliver No. 18 injector exhibits better properties than average for site

Lansing Kansas City Reservoir Rock C-Zone
Remaining Oil=44-57% of Original Oil in PlaceSorw ~30%

Lansing Kansas City C Zone
• Waterflooded successfully from 1965-1984• Average reservoir pressures during water flood
at least 1400 psi.• Wells in good condition• Average porosity=25%• Interstitial water saturation=23%• Estimated waterflood residual oil
saturation=30%• Effective thickness ~8 feet

Requirements for Carbon Dioxide Miscible Flooding
• Must be possible to re-pressure reservoir to reach minimum miscibility pressure (MMP) during the displacement process
• Carbon dioxide must be available at a price that will make the process economic
• Demonstrate sufficient field performance (oil in the tank) to verify technical and economic viability
Tertiary Oil Recovery Project

Minimum Miscibility Pressure in Hall-Gurney LKC
0102030405060708090
100
1000 1050 1100 1150 1200 1250 1300 1350
Average Slimtube Pressure (psig)
Slim
tube
Rec
over
y (%
)
API = 37.5o-38.4oAPI = 37.5o-38.4o

Scope of Project• Determine the technical and economic
feasibility of using CO2 miscible flooding to recover residual and bypassed oil in LKC shallow shelf carbonates.
• Develop reservoir data for the LKC and Hall-Gurney for other floods
• Develop operating costs and operating experience for CO2 miscible flooding in Lansing-Kansas City reservoirs
• Produce oil in tank with sufficient information to expand to commercial scale

14S-13W Russell Co., Kansas
MurfinColliver
MurfinTB Carter
KM Carter
28
33
7
10
12
16
1318
CO2I-1
Murfin and WI CO2 Project
• 70 acre lease• ~10 acre half of
five spot• One CO2 injector• Two Producers• Two Containment
Injectors• 0.290 BCF CO2
injected• 4.6 year operating
life

Location of Ethanol Plant & CO2 EOR Site
MurfinColliver
MurfinTB Carter
KM Carter
28
33
7
10
12
16
1318
CO2I-1
MurfinColliver
MurfinTB Carter
KM Carter
28
33
7
10
12
16
1318
CO2I-1
Kansas Geological Survey


CO2 Injection Facilities


AplexA-50
Portable Storage Tank
ControlValve
Vent
P TFlowmeters
Data Acquisition Control System
P
CorkenCharge Pump

Summary of CO2 Injection
Continuous Injection December 2,2003-Present• Cumulative Injected-September 2004
– 72.73 MMSCF• CO2 Available for Project
– 290 MMSCF• % Injected
– 25.1• % Surface Losses
– 16.34 of amount injected• PPV Injected
– 22%• CO2 Loss to North and Out of Zone
– 29-39%
0
0.5
1
1.5
2
2.5
3
3.5
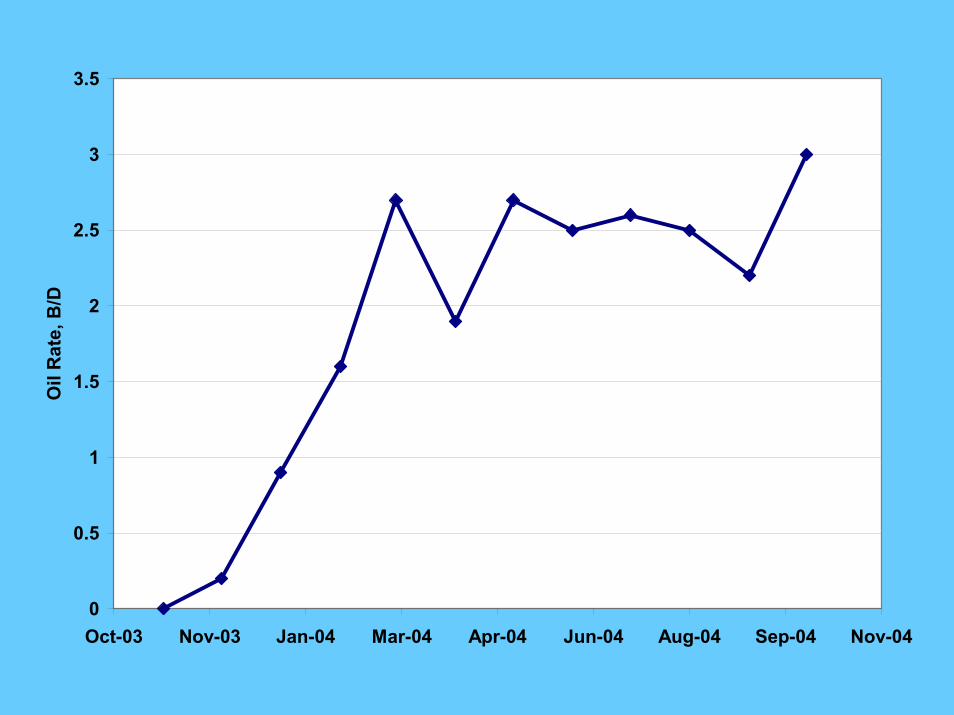
Oct-03 Nov-03 Jan-04 Mar-04 Apr-04 Jun-04 Aug-04 Sep-04 Nov-04
Oil
Rat
e, B
/D
0
5
10
15
20
25
30
35
40
45
50
2003 2003 2004 2004 2004 2004 2004 2004 2004 2004 2004 2004
Nov Dec Jan Feb March April May June July Aug Sept Oct
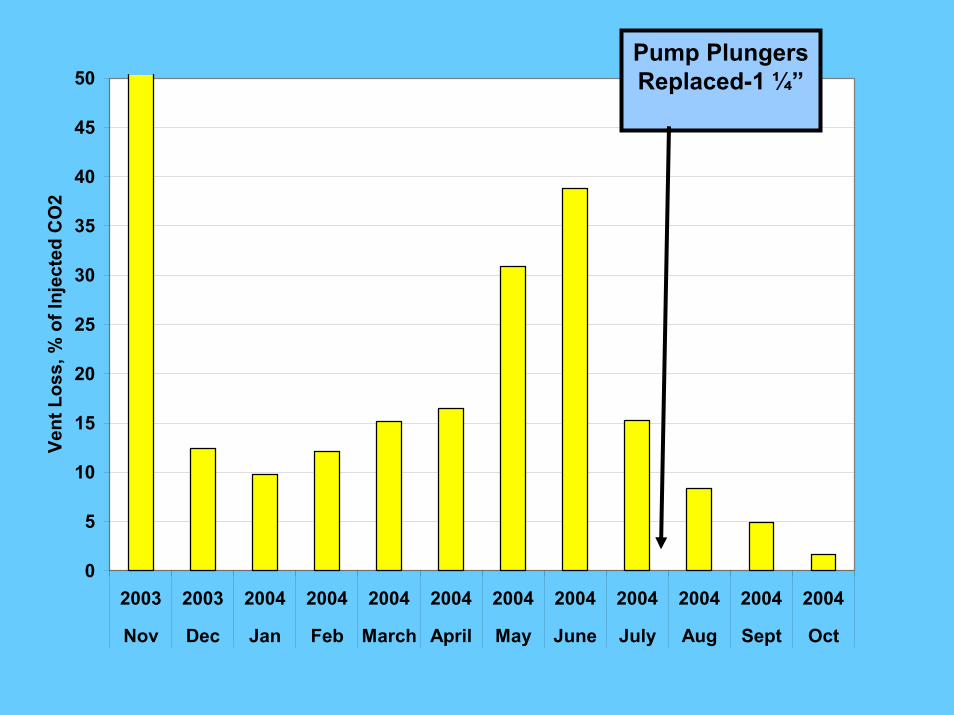
Vent
Los
s, %
of I
njec
ted
CO
2Pump Plungers Replaced-1 ¼”

0
0.5
1
1.5
2
2.5
3
3.5
Oct-03 Nov-03 Jan-04 Mar-04 Apr-04 Jun-04 Aug-04 Sep-04 Nov-04
Oil
Rat
e, B
/D

0
100
200
300
400
500
600
700
Oct-03 Nov-03 Jan-04 Mar-04 Apr-04 Jun-04 Aug-04 Sep-04
Cum
ulat
ive
Oil
Prod
uced
, STB

0
1000
2000
3000
4000
5000
6000
Oct-03 Nov-03 Jan-04 Mar-04 Apr-04 Jun-04 Aug-04 Sep-04 Nov-04
GO
R, S
CF/
STB
CO2 Production in CO2#12
CO2 Production in CO2#13

What We Learned• Injectivity of carbon dioxide in CO2I-1 is more than
required for minimum PPV rate to complete project in 4.6 years.
• Rapid breakthrough of carbon dioxide did not occurreven though estimated permeability distribution in CO2I-1 has a high perm streak in upper two feet of the formation that was thought to be continuous between wells.
• Pulsation of pumps on metering skid affected measurement of rates. Cumulative volume of carbon dioxide injected at flow meter was consistently high.
• Flow meter, temperature and pressure sensors must be installed at CO2I-1 wellhead for management of the project.

What We Learned(continued)• Triplex oversized for the design injection rate
resulting in recycle of 80%. Vent losses became excessive during May and June.
• Injection capacity of triplex reduced by installation of smaller plungers. Vent loss reduced substantially.
• Injection of carbon dioxide is handled as routine field operation.
• Injection water treated to removed oxygen and filtered through 10 micron filters. No evidence of pressure buildup due to particulates that were not removed from the water.

Remaining Challenges• Permeability restriction identified between
CO2I-1 and CO2#13. Revised reservoir description under development
• Maintain adequate pressure in the CO2 bubble by balancing injection into CO2I-1, withdrawal from CO2#12 and CO2#13 and injection rates in the confinement wells.
• Anticipating the arrival of high GORs and conversion to WAG

Project ManagementPPV = Processable pore volume Reservoir volume contacted by carbon dioxide that
can be produced from CO2#12 and CO2#13
• PPV~170,000 RB• Must be able to inject at 84.8 RB/D(to account for
losses) and produce from PPV at a rate of 14 PPV%/year(65.2 RB/D).to complete demonstration project within the 5 year time window in the DOE project.
• Must maintain pressure in CO2 contacted region to retain miscibility
)1( 2orCOiwp SSVPPV −−=

CO2#13
CO2#16
CO2#10
Carter 2
CO2#I-1
CO2#12
CO2#18
Carter 5
PPV
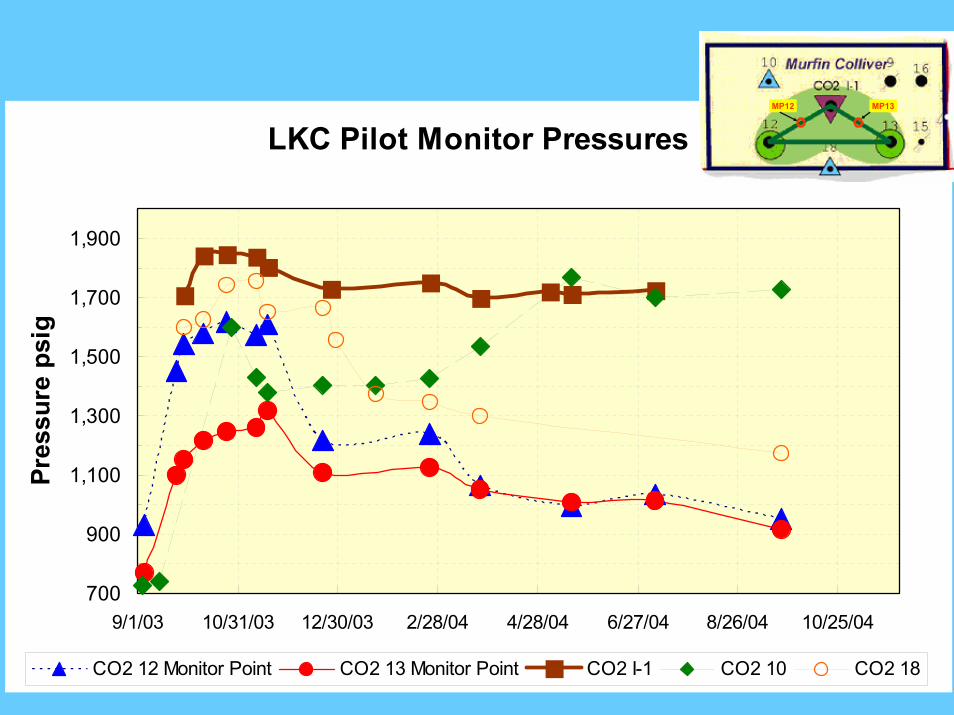
LKC Pilot Monitor Pressures
700
900
1,100
1,300
1,500
1,700
1,900
9/1/03 10/31/03 12/30/03 2/28/04 4/28/04 6/27/04 8/26/04 10/25/04
Pres
sure
psi
g
CO2 12 Monitor Point CO2 13 Monitor Point CO2 I-1 CO2 10 CO2 18
MP12 MP13MP12 MP13


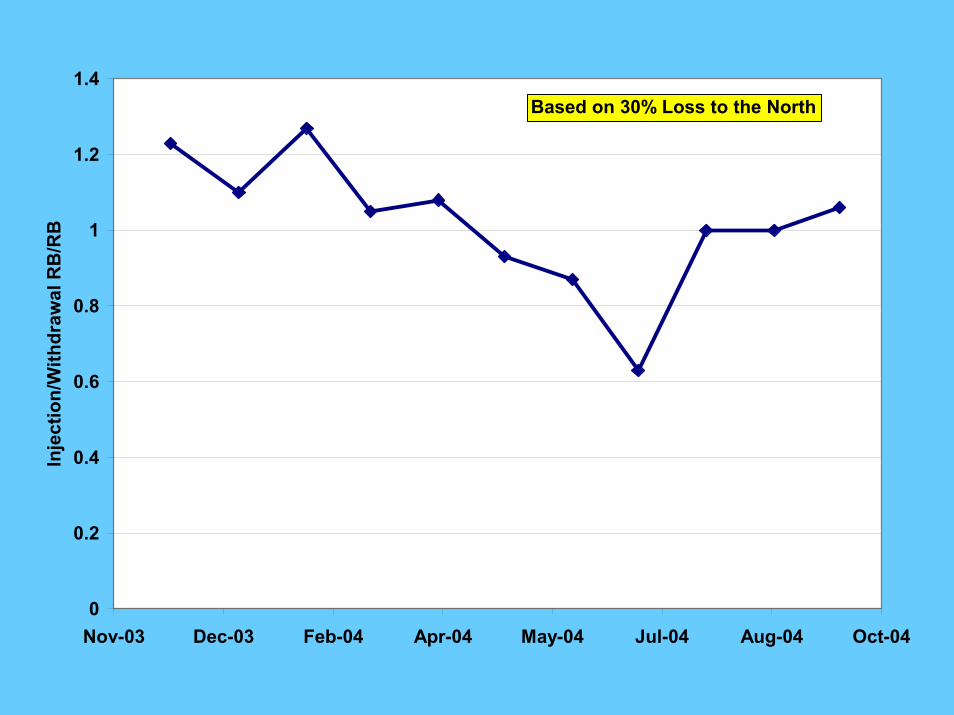
Managing Injection/Withdrawal• Loses to north were included in design of
pilot. Estimates based on reservoir simulation.
• Must be restrained within values that do not add large uncertainty to extrapolation of pilot results to larger, confined regions.
• Requires estimation of:– Losses to north– Percentage of production from CO2#12 and #13
that is produced from PPV.• Maintenance of specified carbon dioxide
monthly injection volumes.
0
0.2
0.4
0.6
0.8
1
1.2
1.4
Nov-03 Dec-03 Feb-04 Apr-04 May-04 Jul-04 Aug-04 Oct-04
Inje
ctio
n/W
ithdr
awal
RB
/RB
Based on 30% Loss to the North

0
0.05
0.1
0.15
0.2
0.25
0.3
2003 2003 2004 2004 2004 2004 2004 2004 2004 2004 2004 2004
Nov Dec Jan Feb March April May June July Aug Sept Oct
Cum
ulat
ive
CO
2 In
ject
ed, F
ract
ion
of P
PV
Loss to North at 30%Remaining in PPV Region

Summary
• Project implemented, operational problems identified and resolved
• Field activities considered within the range of normal oil field operations
• Project management requires monitoring of average pressure and injection/withdrawal ratio from PPV
• Waiting for the oil bank to arrive