an overview of the north american monsoon and seasonal ...castro/presentations/p-16.pdf · an...
TRANSCRIPT
An Overview of the An Overview of the North American Monsoon and North American Monsoon and
Seasonal Outlook for 2008Seasonal Outlook for 2008Christopher L. CastroChristopher L. Castro
Department of Atmospheric SciencesDepartment of Atmospheric SciencesUniversity of ArizonaUniversity of Arizona
UA Climate Science Applications Program (CSAP) and UA Climate Science Applications Program (CSAP) and Climate Assessment for the Southwest (CLIMAS)Climate Assessment for the Southwest (CLIMAS) Web BriefingWeb Briefing
June 4, 2008June 4, 2008

Presentation Outline
Overview of the North American Monsoon and what it means for Arizona
Current state of monsoon forecasting
Outlook for the 2008 monsoon
Department of Atmospheric Science Monsoon Briefings

A definition of “monsoon”
A seasonal reversal of the atmospheric circulation, accompanied by dramatic shifts in winds and precipitation. Caused by the heat differential between a continent and the surrounding ocean.
Classic example: Indian monsoon

Why a North American Monsoon?
Similar to Asia, North America has a giant elevated plateau in the western U.S. and Mexico.
Mexican plateau is only about 4000-7000 ft. in elevation.
Though it is not as high as Tibet, it IS high enough that there is a regular seasonal reversal of circulation.
MEXICAN PLATEAU
MEXICAN PLATEAU

Average Low-Level Flow: July
(Douglas et al. 1993)
Low level winds (900-mb) are directed onshore.
East of the Rockies, moisture is transported at low-levels from the Gulf of Mexico
West of the continental divide, low-level moisture transport from the Gulf of California and East Pacific.

Upper-level flow (~18,000 ft.)
WESTERLIESWESTERLIESDRY IN AZDRY IN AZ
Before monsoon During Monsoon
WesterliesHigh pressure ridge to the south.Little moisture at upper levels.
EASTERLIES EASTERLIES WET IN AZWET IN AZ
EasterliesHigh pressure ridge to north (and east)Moisture transport from Gulf of Mexico

Monsoon in Tucson
Monsoon onset used to be defined as when dew point exceeds 54°F for three consecutive days.
Premonsoon Onset Peak Decay

The daily cycle of thunderstorm development: central to monsoon rainfall
Imagery from CuPido Experiment
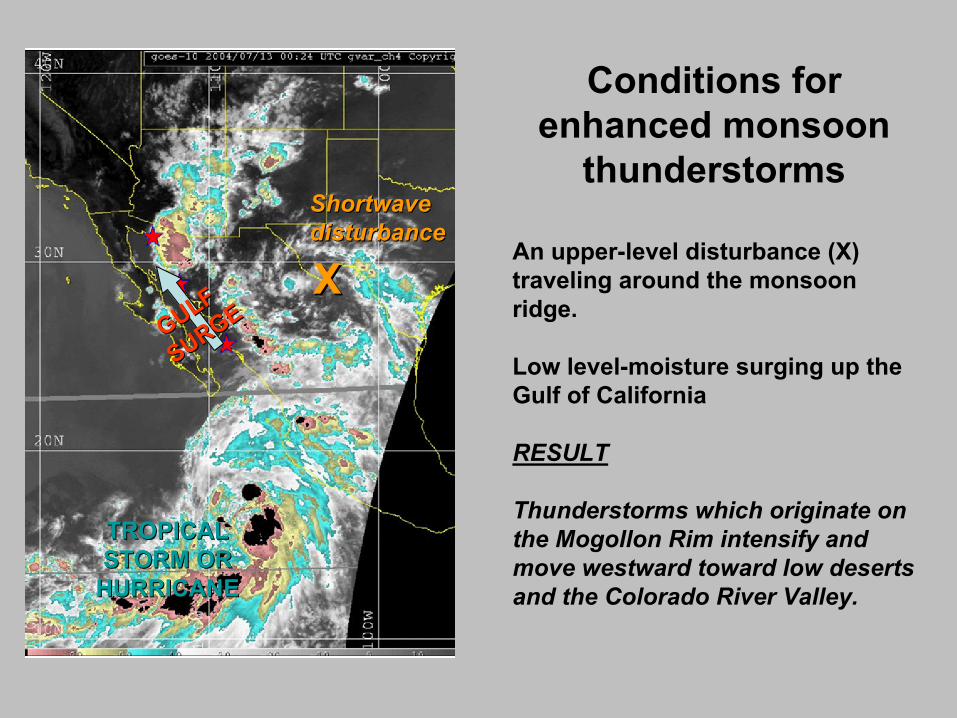
Conditions for enhanced monsoon
thunderstorms
An upper-level disturbance (X) traveling around the monsoon ridge.
Low level-moisture surging up the Gulf of California
RESULT
Thunderstorms which originate on the Mogollon Rim intensify and move westward toward low deserts and the Colorado River Valley.
GULF GULF
SURGESURGE
XX
ShortwaveShortwavedisturbancedisturbance
TROPICAL TROPICAL STORM OR STORM OR
HURRICANEHURRICANE

Principal factors to consider with respect to monsoon variability
Mid-latitude teleconnections, or alterations to the climatologicalcirculation patterns, related principally to Pacific SST variability
Variation of tropical rainfall patterns within a given season
Occasional passage of weather disturbances
Moisture transport and possible teleconnections from Atlantic and inter-American seas
Land surface feedback processes
Anthropogenic climate change

Combined Pacific Variability Mode (CPVM)
(Castro et al. 2007)

Climatology delayed
Climatology accelerated
Monsoon Ridge Position at Onset(Late June, July)
(Castro et al., 2001)

Correlation of JJ 2mo. PRISM-derivedSPI with antecedent MAM CPVM
(onset period)
For Arizona Negative phase of the mode = more rainfall
(Castro et al. 2008)
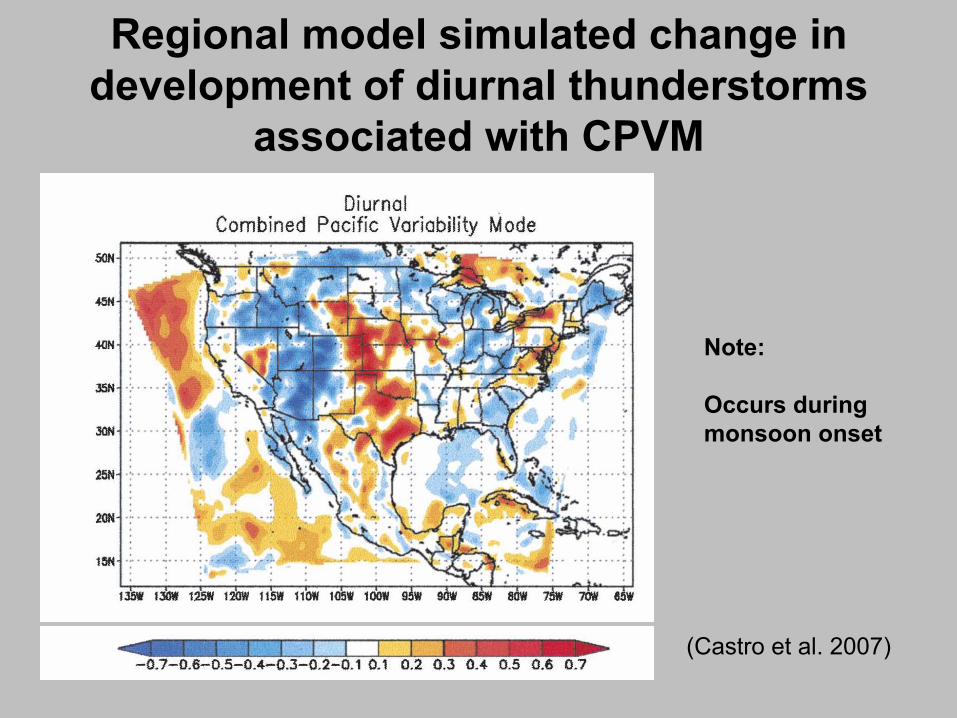
Regional model simulated change in development of diurnal thunderstorms
associated with CPVM
Note:
Occurs during monsoon onset
(Castro et al. 2007)

Change in frequency of upper level disturbances: negative minus positive
CPVM years (1979-2003)
Late June, early July August
X(Bieda et al., submitted)

Change in lightning counts (1996-2005) associated with negative phase
of CPVM in June
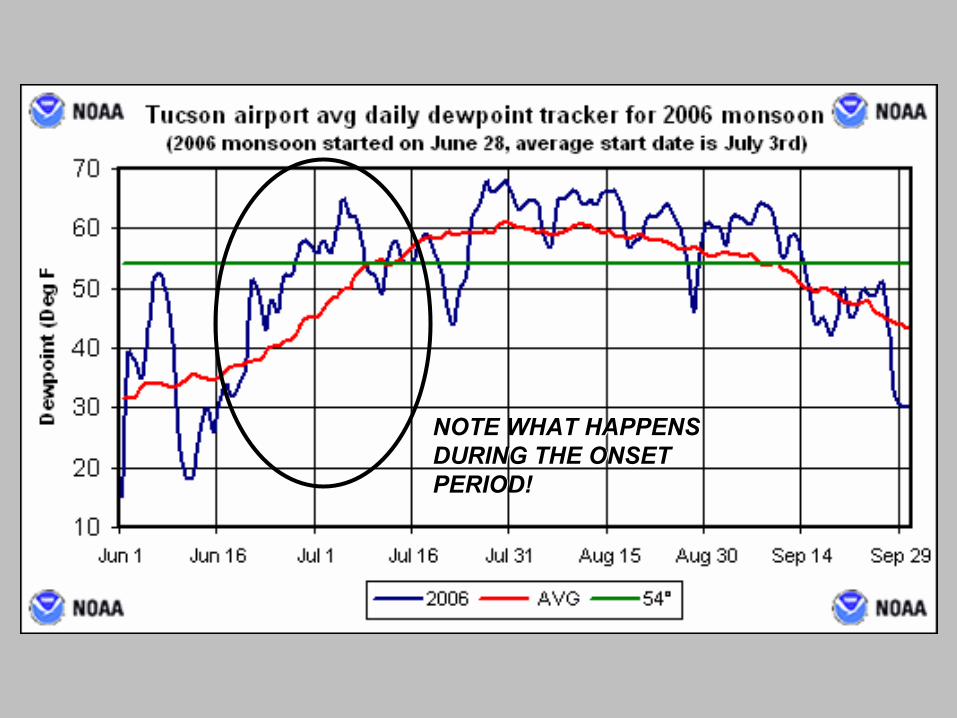
NOTE WHAT HAPPENS NOTE WHAT HAPPENS DURING THE ONSET DURING THE ONSET PERIOD!PERIOD!

Tools used in seasonal forecasting
Current:
General circulation models (e.g. Climate Forecast System model)
Statistical analogs, or compositing
Multiple regression using large-scale climate signals as predictors
Pattern recognition (e.g. Canonical correlation analysis)
Statistical downscaling
Future:
Dynamical downscaling with a regional climate model (WRF)

http://www.cdc.noaa.gov/map/
Current Pacific Sea Surface
Temperature Anomalies
Current Outgoing LongwaveRadiation (OLR) Anomalies
Warm colors = More RainfallCool colors = Less Rainfall

Official Climate Prediction Center Forecast
Temperature forecasts are becoming more dominated by long-term trends, probably due to climate change.
“Equal chances” for monsoon precipitation in the Southwest.
http://www.cdc.noaa.gov

An “equal chances” monsoon CPC forecast is typical. Why??
Likely reason: CPC forecasts are partly based on a global model (CFS). These models cannot resolve the local scale processes which lead monsoon rainfall very well.
Also a major caveat in IPCC global warming projections for the Southwest!!

Alternatives to the official CPC forecast?

SMN Seasonal Forecast
http://smn.cna.gob.mx/productos/map-lluv/hmproduc.html
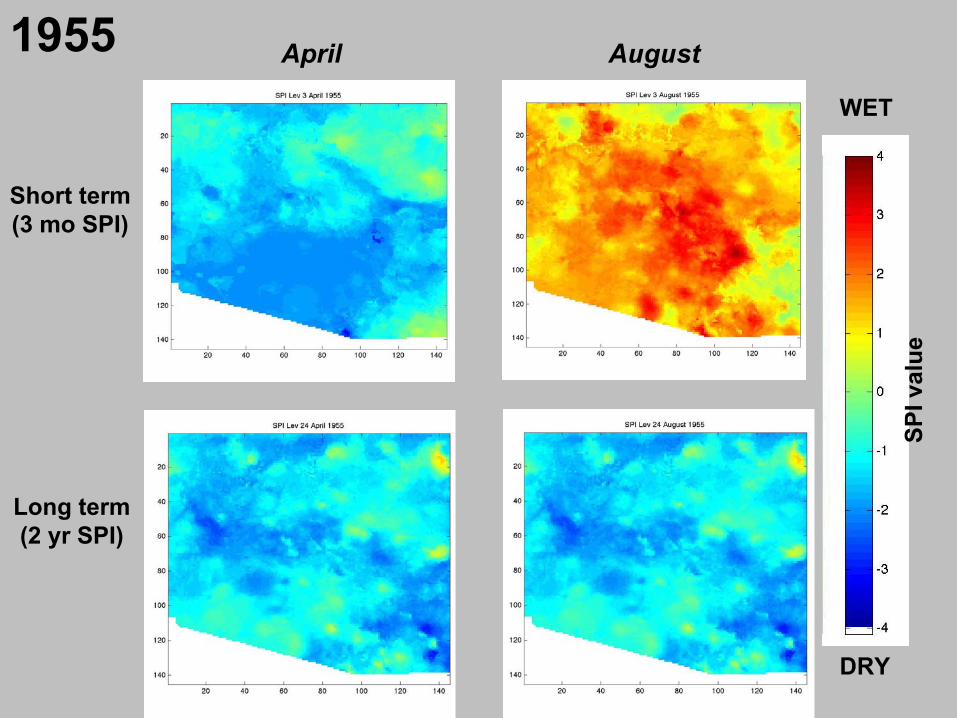
April August
Short term(3 mo SPI)
Long term(2 yr SPI)
WET
DRY
SPI v
alue
1955

Experimental Forecast by Dr. Klaus Wolter of NOAA CDC
http://www.cdc.noaa.gov/people/klaus.wolter/SWcasts/
The forecast guidance based on a screening stepwise multiple regression procedure that requires that each new predictor explains at least an additional 10% of the predictand'svariance.
The predictors include a variety of large-scale climate indices and regional precipitation anomalies.

Medium Range Statistical Downscaling of MRF Reforecasts at NOAA CDC
Use MRF reforecasts to find days in the past where the old forecasts were similar to the current forecast, and note the analyzed conditions associated with those forecasts.
With knowledge of the dates of the similar forecasts, collect an ensemble of high-resolution analyzed precipitation conditions from the North American Regional Reanalysis (NARR)
http://www.cdc.noaa.gov/reforecast/narr/
Probability that precipitation in the next 8-14 days (June 10th-17th) will be in upper tercile of the climatologicaldistribution (i.e. above normal)

500-mb Height Forecast for June 14 (from NCEP)
HH
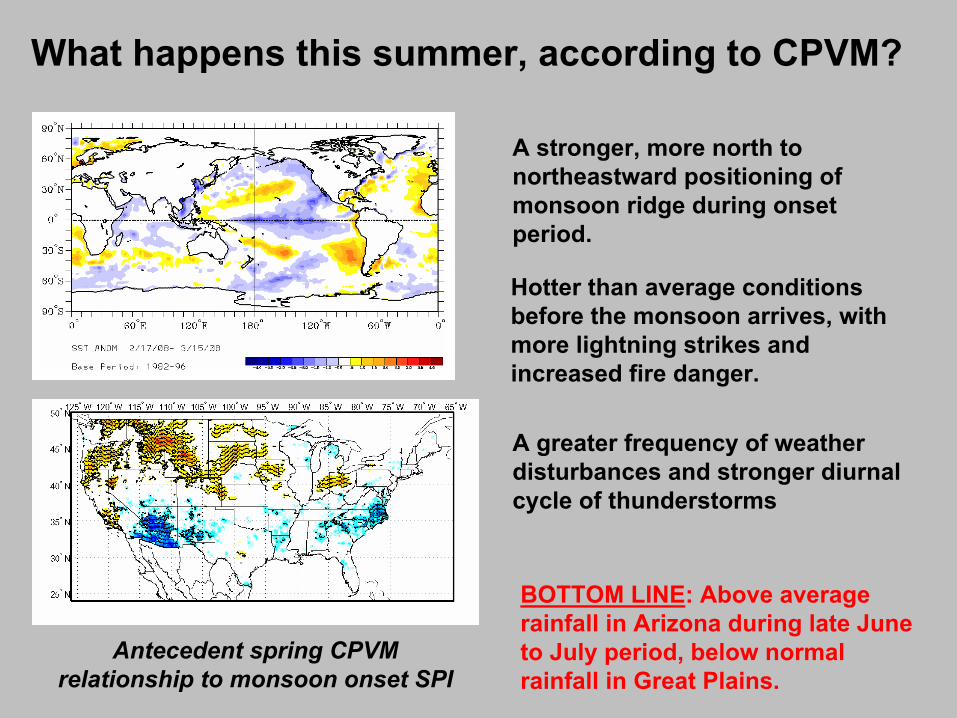
What happens this summer, according to CPVM?
A stronger, more north to northeastward positioning of monsoon ridge during onset period.
A greater frequency of weather disturbances and stronger diurnal cycle of thunderstorms
BOTTOM LINE: Above average rainfall in Arizona during late June to July period, below normal rainfall in Great Plains.
Antecedent spring CPVM relationship to monsoon onset SPI
Hotter than average conditions before the monsoon arrives, with more lightning strikes and increased fire danger.

Other notes
What forecast guidance cannot provide:
A precise estimate of monsoon onset date at a given location, such as the previous Tucson NWS definition. All that can be said is that the onset is likely to be in late June to early July (before July 7 in Tucson).
Where exactly the most rain will fall. Depending on where the monsoon ridge is located will determine which specific regions in the Southwest will be the wettest. In general, though, the present scenario favors above normal precipitation for western new Mexico and most of Arizona.

Department of Atmospheric Science Monsoon Forecast Discussions
Start June 15
Physics and Atmospheric Sciences Building Rm. 488 at 1 pm.
Will utilize high resolution WRF model output for Arizona (1.8 km)
If interested contact Mike Leuthold in ATMO ([email protected])
Daily forecast summaries will be posted and available through the Department of Atmospheric Sciences website.

Updated Monsoon Weather Pages from Tucson NWS
http://www.wrh.noaa.gov/twc/monsoon/monsoon_tracker.php
Topics:
Monsoon statisticsDewpoint dataMonsoon rainfallWhat is the monsoon?Tracking the monsoon
Information on monsoon background updated with latest “state of the science” from North American Monsoon Experiment.