an overview of the scv simulator for vehicular networks
TRANSCRIPT

Copyright © 2017, the Authors. Published by Atlantis Press.This is an open access article under the CC BY-NC license (http://creativecommons.org/licenses/by-nc/4.0/).
An Overview of the SCV Simulator for Vehicular Networks
Jihene REZGUI1,*, Cédryk DOUCET2 and Phillipe ALEXANDRE3
123 Laboratoire Recherche Informatique Maisonneuve (LRIMa), Montreal, Canada
Keywords: VANET, Active safety, Global perception, Periodic messages, Alert messages, SCV.
Abstract. The increasing number of vehicles on roads brings more risks associated
with vehicular travel. In fact, 50 million victims of accidents with personal injury on the
roads are reported around the globe every year. Therefore, it is important to have new
technologies that enhance active safety and ensures early detection of dangers. A good
solution would be to equip vehicles with wireless, fast and safe communication
capacity, called DSRC (Dedicated Short-Range Communication) to coordinate sensory
information and perceptions of all vehicles. In order to analyze the success of such
technology, we develop a discrete event simulator for modeling vehicle active safety
networks, called SCV. Active safety systems are those whose actions begin a few
seconds up to a few tenths of a second before the advent of an accident, to prevent or
mitigate it. SCV evaluates the success of vehicle-to-vehicle (V2V) and
vehicle-to-infrastructure (V2I) communications. It also extends the perceptions of the
vehicles environment so that they evaluate situations independently and exploit the
redundancy of perception generated maps. Eventually, vehicles react much more
quickly in case of danger. Results show that with SCV, we act on cooperative
communication systems and we present the overall perception of the road.
Introduction
Intelligent Transportations Systems (ITS) allow the use of emerging technologies,
such as wireless communications and sensors to save lives, time and energy. Vehicular
ad hoc networks (VANETs) are currently considered a key technology of ITS for
bringing more safety on the road. These networks make use of Wireless Access for
Vehicular Environment architecture (WAVE) [1-3] to communicate with each other
and with the road infrastructure. WAVE defines how vehicles communicate with each
other (V2V communications) and with infrastructure equipment (V2I communications)
using DSRC; a wireless spectrum allocated by the regulator in the 5.850–5.925 GHz
band[4].
Figure1. DSRC : Wireless spectrum in the 5.850–5.925 GHz band
DSRC spectrum is made up of seven 10 MHz wide channels as shown in Figure 1.
Channel 178 is the Control Channel (CCH), which is the default channel for common
518
Advances in Computer Science Research (ACRS), volume 54International Conference on Computer Networks and Communication Technology (CNCT2016)
safety communications. The two channels at the ends of the spectrum band are reserved
for special uses. The rest are Service Channels (SCH) available for both safety and
non-safety use.
VANETs are currently considered an essential technology for future road safety and
telematics applications. Different protocols and mechanisms were proposed to achieve
better network performance or solve different issues related to the harsh VANET
environment. Most of those contributions highlight the importance of the beaconing
service where each vehicle periodically broadcasts Cooperative Awareness Messages
(CAM [5]) containing collected data about the vehicle's position, speed, etc. This
information can be readily available for vehicles in the transmission range. Indeed,
some vehicles embed a range of sensors to give them a local perception of their
environment (using cameras for example, etc.). The exchange of periodic messages can
then enhance their perception by compiling all the information gathered by surrounding
vehicles and therefore increase their awareness about upcoming threats (see Figure 8).
It is worth noting the lack of simulation tools that principally focus on vehicular
communications and easily offer a simulation platform to various research groups to
integrate to their projects based on JAVA programming. Our proposed simulation
platform, SCV, is dedicated to presenting global perception [6] on the road based on
V2V and V2I communications to avoid accidents. Besides, SCV evaluation aligns with
empirical results with more accuracy to reality using Nagakami-m model [10].
In this paper, we introduce a new JAVA based discrete event simulator for modeling
vehicular communication networks, called SCV Simulator of Vehicles
Communications [11]. The remainder of this paper is organized as follows. Section 2
highlights comparison with other simulation tools. In Section 3, we present Nakagami
model while defining its parameters and why we choose it rather than other models.
Section 4 presents the design of SCV simulation tool. We finally evaluate the V2V and
V2I communications through SCV using DSRC in section 5 and conclude the paper.
Comparison with Other Tools
This section presents an overview of various commercial and non-commercial network
simulation tools [8] in wide use today, and compares them to our proposed simulator
SCV.
A. NS-2/NS-3
Presently, NS-2[7] is the most popular network simulator in academic and research
groups. Both SCV and OMNET++ present clear separation of simulation kernel and
models which is not the case of NS-2. In fact, NS-2 code contains the models alongside
their supporting infrastructure, as one indivisible unit [7]. SCV intends to provide a
simulation platform for vehicular DSRC communications, on which various research
groups can build their own simulation frameworks. Whereas the NS-2 project goal was
to build a network simulator. The key difference is the different tools and infrastructure
components that SCV can provide that are aimed towards vehicular networking while
NS-2 cannot: for instance, GUI-based environment (except for nam in NS), separation
of models from experiments, graphical analysis tools, simulation library features and
support for hierarchical models.
NS-2 is considered as a dual-language simulator since simulation models are scripts
in Tcl (Tool command language), while the simulation kernel and various components
(protocols, channels, agents, etc) are implemented in C++ and are made accessible from
the Tcl language. In a Tcl script, we define the network topology, the settings
519
Advances in Computer Science Research (ACRS), volume 54

parameters and the recording statistics. The latter characteristics of NS-2 make the
creation of graphical editors difficult to implement. However, it is worth mentioning
that NS-3 is an ongoing effort to consolidate all patches and recently developed models
into a new version of NS that enhances old versions.
B. OMNET++
OMNeT++ [8] was designed from the beginning to support network simulation on a
large scale. In OMNeT++ simulation models are hierarchical, and built from reusable
components whenever possible. The proposed simulation software facilitates
visualizing and debugging of simulation models in order to reduce debugging time,
which traditionally takes up most the simulation time. Its simulation software, as our
proposed simulator SCV, is modular, customizable and allows embedding simulations
into larger applications such as network planning software.
Both OMNET++ and SCV provide permissions to make digital or hard copies of
part or all for personal or classroom use is granted without fees provided that copies are
not made or distributed for profit or commercial advantage. Data interfaces are open in
both SCV and OMNET++. It is possible to generate and process input and output files
with commonly available software tools. Both of them provide an Integrated
Development Environment that largely facilitates model development and analyzing
results.
SCV offers a more interesting GUI-based execution environment than OMNET++,
for instance, the global perception propagation of each vehicle and its environment.
C. OPNET Modeler
OPNET Modeler[9] is a commercial product which is freely available worldwide to
qualifying universities. OPNET probably has the largest selection of ready-made
protocol models (including IPv6, WiMAX, QoS, Ethernet, MPLS, OSPFv3 and many
others). OPNET, SCV and OMNET++ provide rich simulation libraries of roughly
comparable functionalities. The OPNET simulation library is based on C, while the one
in SCV is a Java class library. OPNET's architecture is similar to OMNeT++ and SCV
as it allows hierarchical models, but with some restrictions (namely, the "node" level
cannot be hierarchical). A significant difference from OMNET++ and SCV is that
OPNET models are always of fixed topology, while both OMNeT++'s NED and SCV
allow parametric topologies. SCV and OMNeT++ models are simple text files which
can be generated e.g. with XML while in OPNET, the preferred way of defining
network topology is by using the graphical editor. The editor stores models in a
proprietary binary file format, which means in practice that OPNET models are usually
difficult to generate by program (it requires writing a C program that uses an OPNET
API).
Both SCV and OPNET provide a graphical debugger and some form of automatic
animation which is essential for easy model development. OPNET does not provide
source code to the simulation kernel. SCV like OMNeT++, NS-2 and most other
non-commercial tools – is fully public-source allowing much easier source level
debugging.
OPNET's main advantage over SCV and OMNET++ is definitely its large protocol
model library, while its proprietary binary file formats and the lack of source code
makes development and problem solving harder.
520
Advances in Computer Science Research (ACRS), volume 54

D. Other characteristics of SCV
SCV is more of a complete and self-sustaining simulator than a simulation
library, because it works as-is, while still maintaining the usability and
capabilities of a simulation library.
Its main advantages over other simulation tools are its graphical representation,
its ease of use for simple simulations and its vehicular communications
specificity.
Researchers and developers have a full access to SCV’s source code in order to
accommodate the simulator to their research goals [11].
Nakagami Model is Implemented in SCV
A. NAKAGAMI-m in SCV
To simulate wave propagation in an urban environment, we use the Nakagami-m
propagation model [10]. It represents the fluctuation and the variability of a DSRC
communication. A radio wave can be victim of interference, reflection or refraction that
are too demanding for a simulator to quantify. Hence, it is more appropriate to
approximate the propagation of those waves using a statistical model.
There are other propagation models that have been used in commercial and
non-commercial network simulation tools. However, SCV implemented Nakagami-m
model, because it was shown that it aligns with empirical results with more accuracy
than other models. Moreover, it is a more accurate statistical model to reality, because it
emphasizes the physical aspect of propagation of radio waves in the air and through
obstacles. The value returned by the Nakagami distribution is the received message
power. Its formula is expressed as follows:
1
In which
• m is a variable which varies according to the distance as follows:
- If distance <80 meters: m = 1.5, otherwise: m = 0.75
• Ω is the vehicle transmission power.
• x is a random variable following the Gamma distribution with
α = m && β = Ω / m
In Figure 2, we varied the distance between two vehicles to study the signal strength.
This result shows that vehicle power transmission tends to decrease with distance,
while retaining a partially random power. This aligns with the observations in reality
where the reception power can vary even for two vehicles that are at the same distance
from the transmitter.
521
Advances in Computer Science Research (ACRS), volume 54

Figure 2. Nakagami-m Model of propagation
B. Why is Nakagami-m fading channel good in practice?
A number of channel models exist to describe the statistics of the amplitude and phase
of multipath fading signals. Nakagami-m distribution has the following advantages
versus the other models [10]:
It is a generalized distribution which can model different fading environments.
It has greater flexibility and accuracy in matching some experimental data than
the Rayleigh, lognormal or Rice distributions.
Rayleigh and one-sided Gaussian distribution are special cases of Nakagami-m
model.
Thus, the Nakagami-m channel model is of more general applicability in practical
fading channels.
The Design of SCV
A. SCV Model Structure
SCV is a discrete event simulator aimed at simulating vehicular communications. To
this end, it was designed to work with SUMO, a reliable traffic simulator. SUMO
handles vehicle movements and communicates with SCV so it can simulate network
communications between the vehicles. To do so, it uses the TraCI for Java library,
which permits communications to the TraCI interface in SUMO (see Figure 3).
Figure 3. Communications between SUMO and SCV
Also, in order for our simulator to better represent real life, we organized our system
(our classes) with the layered network system in mind. We created classes that are
associated with different layers of typical network protocols (see Figure 4). Our
simulator works as follows, it takes vehicle positions form SUMO, shows
corresponding vehicles on the screen and simulates V2V and V2I communications. The
522
Advances in Computer Science Research (ACRS), volume 54

success of the communications then depends on the wave propagation model
(Nakagami-m) and packets collision.
Figure 4. Diagram of classes with UML
B. Input of SCV
In SCV, you can change different parameters related to the vehicles and their
communications. These inputs include:
Information decay time
Periodic messages frequency
DSRC radio sensibility
Percentage of vehicles with the communication technology
It is also possible to change the vehicle's routes by creating or modifying an existing
XML file. This file specifies where vehicles appear and where they are headed on the
map. It also dictates the number of vehicles, their maximum speed, their acceleration,
their deceleration, etc. (see Figure5).
Figure 5. Example of an XML input file
The user can then load their file of choice in SCV and analyze the network scenario
in different environments, like in Figure 6.a and Figure 6.b, where two different input
files are loaded to show how the behavior of the vehicles can be manipulated.
Figure 6.a
523
Advances in Computer Science Research (ACRS), volume 54

Figure 6.b
Figure 6.a and Figure 6.b are an example of the impact loading 2 different XML input files on the
simulation. These two figures were taken at approximately the same simulation time (around 98 seconds)
Another interesting input to note is the crash input. At any given time during the
simulation, a user can select a vehicle and choose to make the vehicle crash. The user
can then observe the impact on the surroundings and how the message is sent to nearby
vehicles.
C. Design of the Simulation Library
The simulation library is designed to be an easy-to-use and modify network simulator,
while still being aimed at the simulation of vehicular communications. Consequently,
its uses are obviously limited to vehicular simulations. Researchers could still add their
own modules to the simulator if they need to see the impact on the spread of
information over the vehicular network. Doing so would require knowledge of the Java
programming language, but it would still be a basic task due to the low complexity and
openness of the simulator (they could change the way the discrete event system works
to better suit their needs). In order to follow these goals, SCV was coded as simply as
possible, while still being as easy to understand as possible.
D. Contents of the Simulation Library
This section will briefly describe the uses of the different classes as seen in Figure 4.
Firstly, the animation and interactions happen in the ScvAnimation class. It contains
the discrete event simulator and all of the vehicles and obstacles present on the map. It
then goes through a list of Event and animate the vehicles.
There are currently two main types of Events: Update events and Dsrc events.
Update events handle getting the information from SUMO, updating the statistical data
for results analysis and passing the new car information to the main animation class.
Then, Dsrc events handle the different types of messages exchanged in V2V and V2I
communications.
Vehicles that do not have the communication capabilities are represented by the
ScvVehicle class and do not contain any networking related objects. Vehicles that use
the DSRC technology are called DsrcVehicle and contain an UpperLayer, which
handles the analysis of received information, and a PhysicLayer, which handles the
receiving and sending of the messages.
These messages are represented by the Information class, which can include car
positions and their sensory information. When a message is sent from a vehicle to
another, it will send a list of all Information it knows and the receiver will then see if
they already know any of these Information and add the ones it does not know to their
own list of Information.
Infrastructure is also an important part of the simulation. In fact, one can add
antennas (i.e. infrastructure equipment) to the simulation in order to increase the range
of communications and to receive V2I messages.
524
Advances in Computer Science Research (ACRS), volume 54

E. Messages exchanged on SCV
In our simulator, two types of safety messages are exchanged (see Table 1). The first
type is the periodic messages which are sent at regular intervals between vehicles and
transmit relevant information to increase the perception and coordination of movements.
The second type of messages is the alert (warning) messages which are sent when there
is an emergency, such as a collision detection (see Table 2).
This type of message has a higher priority than periodic messages as it is used in an
emergency and must be treated as soon as possible. Thus, the exchange of these two
message types allows many vehicles to organize and to promote active vehicular safety.
Table1. Different messages exchanged in SCV
Table2. Eight safety applications defined by the National Highway Traffic Safety Administration in USA.
Results Analysis
The main purpose of SCV is, of course, to gather data and analyze the impact of certain
parameters on vehicular communications. To do this, the simulator can show a vehicle's
extended perception by highlighting certain parts of the graphical representation of the
simulation. In Figure 7, we can see what a certain vehicle (the green car in the
bottom-left corner) can see by highlighting in pink the information it knows. It also
knows that a car outside of its line of sight has crashed and that it causes slowdowns in
this section of the road.
With this information, it is valuable to say that it is possible to analyze results simply
by looking at the vehicles' extended perception. Other results that are available
alongside a vehicle’s extended perception are its important information, shown by SCV
in a panel next to the animation panel.
525
Advances in Computer Science Research (ACRS), volume 54

Figure 7. Extended perception with an antenna (infrastructure equipment), in black on a building's roof,
helping to increase the communication range
As seen in Figure 8, it is possible to know the selected vehicle’s speed, position as
well as other relevant data.
Figure 8. Information about a selected vehicle shown to the left of the screen
Figure 9. Example of the manipulating of charts in SCV
It is also important to gather actual data in order to produce a chart that is both useful
and meaningful. As such, it is important to give researchers a basic set of important data
526
Advances in Computer Science Research (ACRS), volume 54
and charts to analyze. These include the communication reliability rate, for example. It
is also important for researchers to be able to easily add their own charts and analyze
them. For this, the chart plotting algorithm has been made with flexibility in mind and
will accommodate plenty of type of charts, as seen in Figure 9. It also needs to be able to
export the data outside of the application for researchers to manipulate more easily.
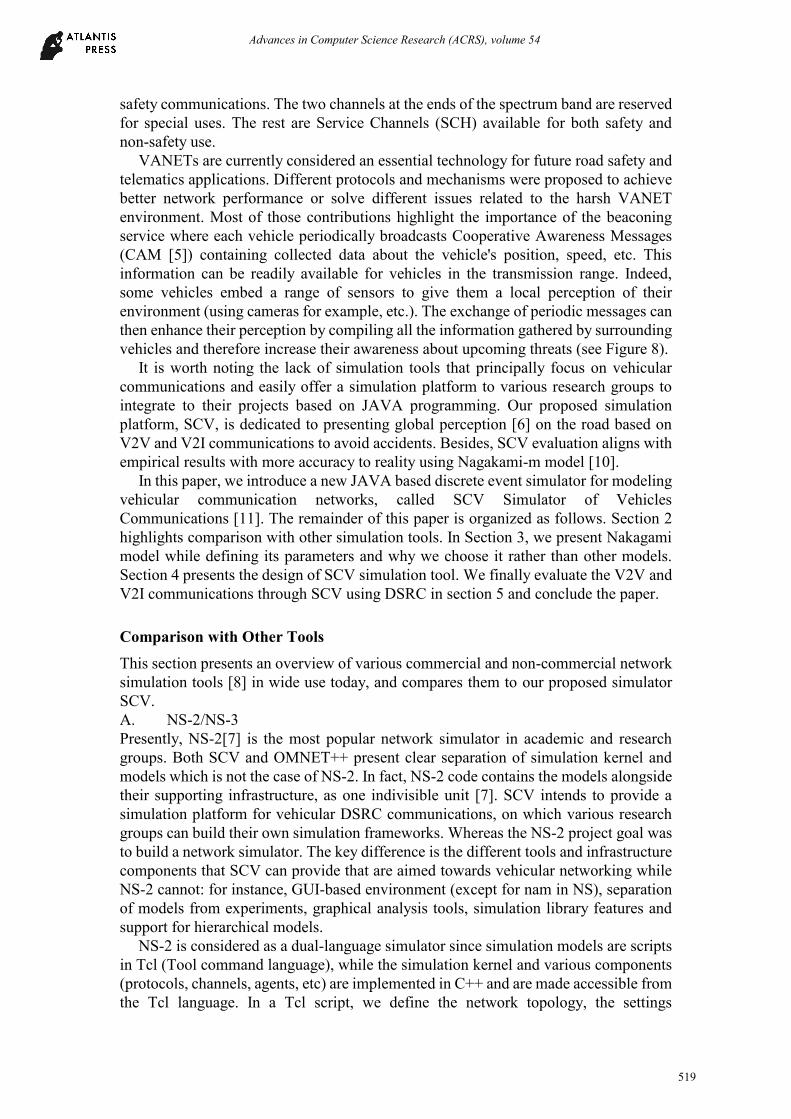
An example of the charts in SCV can be seen in Figure 10, where we can see the
communication reliability rate of a vehicle in black the number of successfully
established connections in red. We can see in this chart that when more messages are
successfully received, the reliability rate has the tendency to also rise. This is due to the
fact that our vehicle’s density stayed mainly similar throughout the simulation, so there
was an almost constant amount of tried connections (vehicles with communication
capabilities in range).
Figure 10. Chart of the Packet reliability rate (top curve in black) and successfully established
connections (bottom curve in red). The left vertical axis is for the black curve and the right vertical axis is
for the red curve.
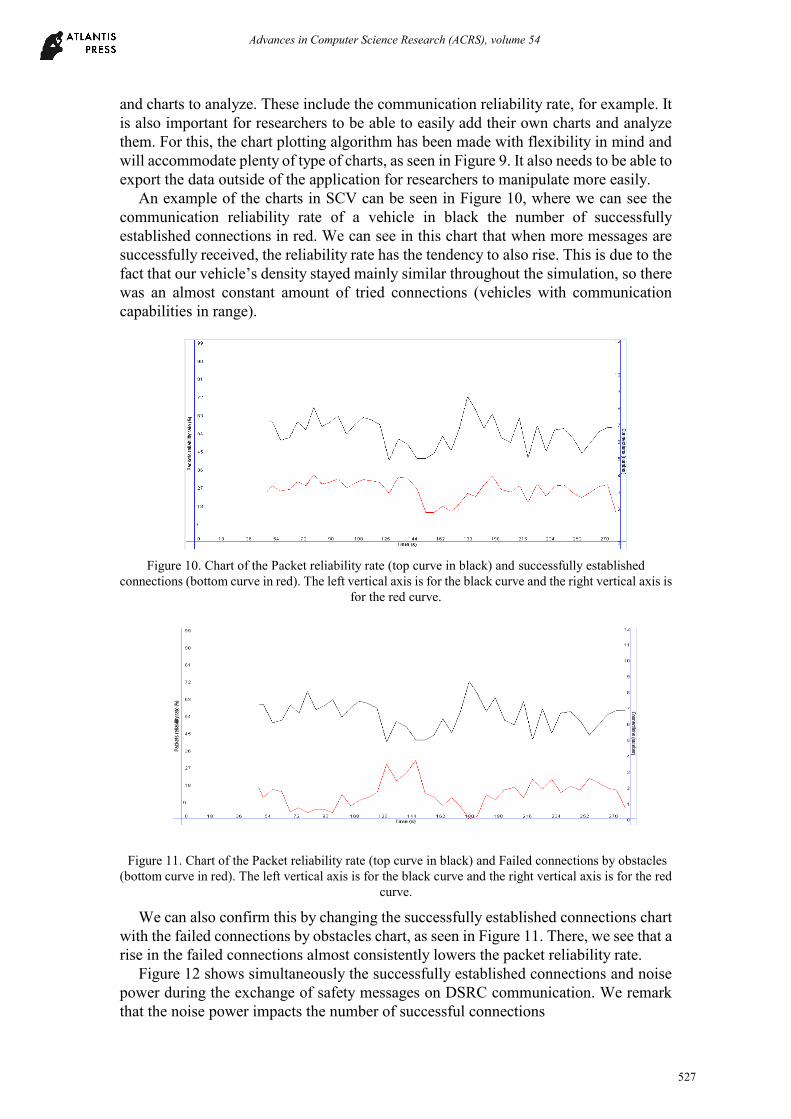
Figure 11. Chart of the Packet reliability rate (top curve in black) and Failed connections by obstacles
(bottom curve in red). The left vertical axis is for the black curve and the right vertical axis is for the red
curve.
We can also confirm this by changing the successfully established connections chart
with the failed connections by obstacles chart, as seen in Figure 11. There, we see that a
rise in the failed connections almost consistently lowers the packet reliability rate.
Figure 12 shows simultaneously the successfully established connections and noise
power during the exchange of safety messages on DSRC communication. We remark
that the noise power impacts the number of successful connections
527
Advances in Computer Science Research (ACRS), volume 54

Finally, researchers that would like to have more complex charts and values, like the
packet reception reliability rate will be able to do so by using SCV’s simple chart
algorithm.
Figure 12. Chart of the successfully established connections (top curve in black) and Noise power (bottom
curve in red). The left vertical axis is for the black curve and the right vertical axis is for the red curve.
Conclusion
In this paper, we show how we build global perception on the road based on V2V and
V2I DSRC communication. We develop a new simulator, SCV, which takes into
account high-priority safety-oriented periodic or emergency applications to avoid
hazardous situations on the roads. Using SCV simulation platform, we showed that the
DSRC communications over 802.11p, which integrates Nakagami-fading-m model,
enhances the global perception of each vehicle on the road. Besides, through extensive
results, we demonstrate that SCV shows good performances in terms of Packet
reliability rate in presence of noise or obstacles.
Acknowledgement
This research was financially supported by the "Fonds Québécois de la recherche sur la
nature et les technologies (FRQNT)". We would like to thank Caroline Houle and
Nader Chaabouni for their valuable comments.
References
[1] "IEEE Guide for Wireless Access in Vehicular Environments (WAVE)
-Architecture," IEEE Std 1609.0-2013, pp. 1-78, 2014.
[2] J. Rezgui, S. Cherkaoui, O. Chakroun, "Improving delay performance of IEEE
802.11p vehicular safety communication", published in Int. J. Autonomous and
Adaptive Communications Systems 7(1/2): 91-109, 2014.
[3] J. Rezgui, S. Cherkaoui, "About Deterministic and non-Deterministic Vehicular
Communications", published in DSRC/802.11p. Wireless Communications and
Mobile Computing 14(15): 1435-1449, 2014.
[4] "Trial-Use Standard for Wireless Access in Vehicular Environments (WAVE) -
Resource Manager," IEEE Std 1609.1-2006, pp. 1-71, 2006.
528
Advances in Computer Science Research (ACRS), volume 54

[5] E. T. ETSI, "102 638 Technical Report, V1. 1: Intelligent Transport Systems (ITS),
Vehicular Communications (VC), Basic Set of Applications, Definitions," ed: June,
2009.
[6] N. Chaabouni, A. Hafid, J. Rezgui, S. Cherkaoui, "Setting up an extended
perception in a vehicular network environment: A proof of concept", accepted in IEEE
WCNC, 2016.
[7] Bajaj, S., L. Breslau, D. Estrin, K. Fall, S. Floyd, P. Haldar, M. Handley, A. Helmy,
J. Heidemann, P. Huang, S. Kumar, S. McCanne, R. Rejaie, P. Sharma, K. Varadhan, Y.
Xu, H. Yu and D. Zappala. 2000. Improving simulation for network research. IEEE
Computer. (to appear, a preliminary draft is currently available as USC technical report
99-702)
[8] Varga, A. and Hornig, R. (2008), "An overview of the OMNeT++ simulation
environment", Simutools '08: Proceedings of the 1st international conference on
Simulation tools and techniques for communications, networks and systems &
workshops: 1--10
[9] OPNET Technologies, Inc. OPNET Modeler. http://www.opnet.com.
[10] N. C. Beaulieu and C. Cheng, "Efficient Nakagami-m fading channel Simulation,"
in IEEE Transactions on Vehicular Technology, vol. 54, no. 2, pp. 413-424, March
2005. doi: 10.1109/TVT.2004.841555.
[11] Cedryk Doucet, Philippe Alexandre, Jihene Rezgui, "Simulateur de
communications véhiculaires", https://gitlab.com/polkio7/SCV, 2016.
529
Advances in Computer Science Research (ACRS), volume 54