an overview of wisconsin and us agricultural economy bruce l. jones director, renk agribusiness...
TRANSCRIPT
An Overview of Wisconsin and US Agricultural Economy
Bruce L. JonesDirector, Renk Agribusiness Institute
August 2013

Outline for Presentation
• Wisconsin Ag Financial Status
• Diversification & Dairy Farm Performance
• Farm Bill Issues
• Ag Enterprise Performance
• USDA Long Term Outlook
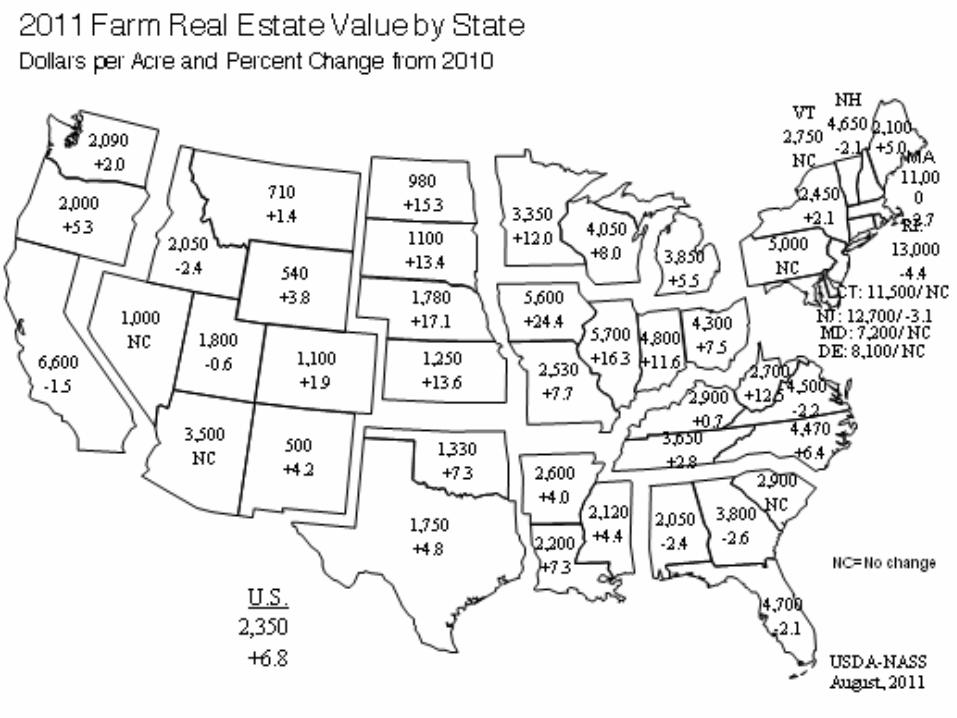
• Farmland Values: Wisconsin and Neighboring States

Net Farm Income: U.S. and Wisconsin
0
500
1,000
1,500
2,000
2,500
3,000
3,500
4,000
1993
1994
1995
1996
1997
1998
1999
2000
2001
2002
2003
2004
2005
2006
2007
2008
2009
2010
2011
2012
*
$M
illi
on
0
20
40
60
80
100
120
140
160
$B
illi
on
Wisconsin (Left Axis)
United States (Right Axis)
Source: Economic Research Service, USDA*2012 Wisconsin Income Estimated by Authors

Wisconsin Farm Balance Sheet, December 31, 2007-2011
2007 2008 2009 2010 2011
$Million
Current Assets 5,558 6,818 6,038 6,463 6,552
Noncurrent Assets 56,681 56,850 58,460 59,100 63,359
Total Farm Assets 62,239 63,668 64,497 65,563 69,911
Current Liabilities 1,712 1,624 1,836 1,815 1,820
Noncurrent Liabilities 5,818. 5,203 5,839. 6,565 7,256
Total Farm Liabilities 7,531 6,827 7,675 8,379 9,076
Farm Equity 54,708 56,841 56,823 57,184 60,835


Agricultural Credit Conditions: Seventh Federal Reserve District
50
60
70
80
90
100
110
120
130
140
150
160
170
180
2009
-1
2009
-2
2009
-3
2009
-4
2010
-1
2010
-2
2010
-3
2010
-4
2011
-1
2011
-2
2011
-3
2011
-4
2012
-1
2012
-2
2012
-3
Year-Quarter
Ind
ex
*
Loan Demand Index
Fund Availability Index
Loan Repayment Index
Source: Chicago Federal Reserave Bank, Agricultural Letter .See Source for explanation of how indices are constructed.

Interest Rates on Farm Loans: Seventh Federal Reserve District
4.00
4.50
5.00
5.50
6.00
6.50
7.00
7.50
8.00
8.50
9.0020
05-1
2005
-2
2005
-3
2005
-4
2006
-1
2006
-2
2006
-3
2006
-4
2007
-1
2007
-2
2007
-3
2007
-4
2008
-1
2008
-2
2008
-3
2008
-4
2009
-1
2009
-2
2009
-3
2009
-4
2010
-1
2010
-2
2010
-3
2010
-4
2011
-1
2011
-2
2011
-3
2011
-4
2012
-1
2012
-2
2012
-3
Year-Quarter
Pe
rce
nt
Operating Loans
Farm Real Estate Loans
Source: Chicago Federal Reserve Bank, Agricultural Letter
Dairy


U.S. Milk production: 2011 and preliminary 2012
2011 2012 Percent Change
United States:
Average number of milk cows (1,000)
9,194 9,235 +0.5%
Milk per cow (pounds) 21,346 21,640 +1.4%
Total milk production (Billion Lbs.)
196.245 199.8 +1.9%
Wisconsin
Average number of milk cows (1,000)
1,265 1,270 +.4%
Milk per cow (pounds) 20,645 21,383 +3.6%
Total milk production (Billion Lbs.)
26.1 27.2 +4.1%

2013 Milk Price Forecasts
Quarter
Jan-Mar Apr-Jun Jul-Sep Oct-Sep
Class III $18.40±0.10 $18.70±0.10 $18.90±0.15 $18.20±0.35
Class IV $18.65±0.30 $18.50±0.30 $18.00±0.15 $17.70±0.10
WI All Milk $19.95±0.10 $20.25±0.10 $20.40±0.10 $19.75±0.30

Livestock

Changes in Production and Prices for Livestock Products
Livestock Species/Product
Production in Million Pounds Price in Cents per Pound
20092012
Forecast% Change 2009
2012 Forecast
% Change
Choice Steers 25,963* 25,872* -0.4% 83.25 122.85 48%
Lambs 171 156 -8.8% 90.10 113.55 26%
Barrows and Gilts 22,993* 23,178* 0.8% 41.24 61.10 48%
Broilers 35,511 36,939 4.0% 77.60 86.8 12%
Turkey 5,663 5,981 5.6% 79.50 105.7 33%
Eggs** 6,485 5,981 3.0% 103.00 118.0 15%
*Total production of beef and pork**Volume in million dozen and price in cents/dozen. See source for pricing points.
Source: USDA, Livestock, Dairy and Poultry Outlook, December 2011 and December 2012.

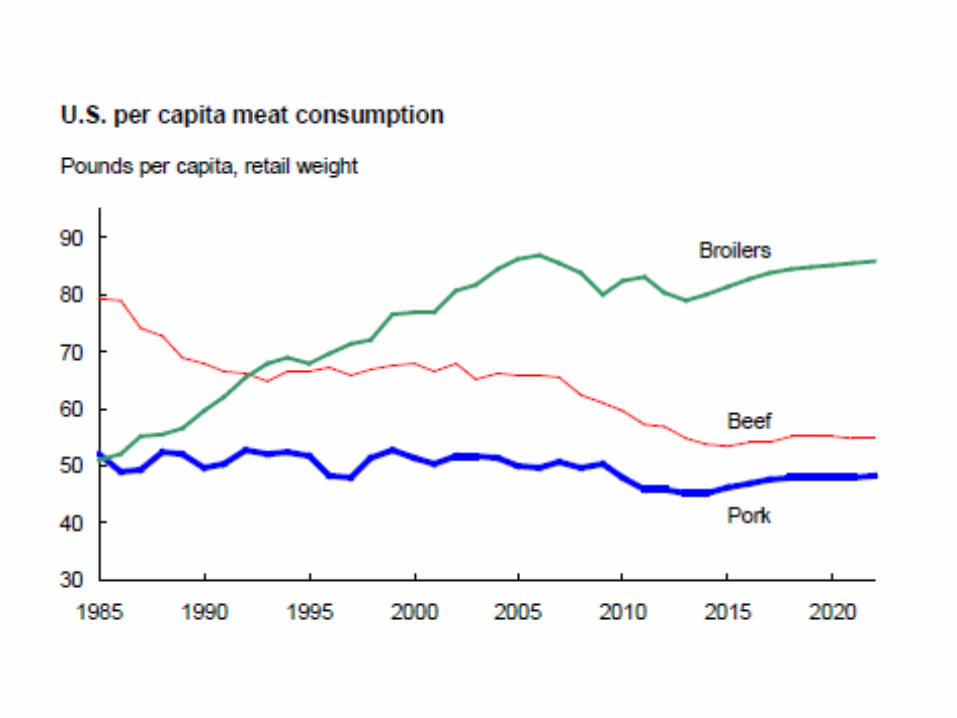
Total U.S. Per Capita Meat Consumption
219.5
215.3
220.5218.9
221.6 221 221.3 221.6
216.1
210.5208.9
204.6
202.2
197.1
180
185
190
195
200
205
210
215
220
225
230
2000 2001 2002 2003 2004 2005 2006 2007 2008 2009 2010 2011 2012* 2013**
Po
un
ds
Source: USDA, World Agricultural Supply and Demand Estimates*2012 is estimated. **2013 is forecast
Corn and Soybeans

U.S. Corn Balance Sheet (Sep-Aug)
Marketing Year 05/06 06/07 07/08 08/09 09/10 10/11 11/12* 12/13**
Million Bushels (Except as Noted)
Beg. Stocks 2,114 1,967 1,304 1,624 1,674 1,708 1,128 988
Imports 9 12 20 14 10 28 29 100
Acres Planted (Mil.) 81.5 78.3 93.5 86.0 86.5 88.2 91.9 96.9
Acres Harvested (Mil.) 75.1 70.6 86.5 78.6 79.6 81.4 84.0 87.7
% Harvested 92.1 90.2 92.5 91.4 92.0 92.2 91.4 90.5
Yield (Bu/A) 148 149.1 150.7 153.9 164.7 152.8 147.2 122.3
Production 11,114 10,535 13,038 12,101 13,110 12,447 12,358 10,728
Total Supply 13,237 12,514 14,362 13,739 14,792 14,262 13,515 11,806
Feed and Residual 6,155 5,595 5,913 5,254 5,159 4,792 4,547 4,150
Food/See/Industrial 2,981 3,490 4,387 4,953 5,938 6,428 6,437 5,867
Ethanol 1,603 2,119 3,049 3,677 4,568 5,021 5,011 4,500
Exports 2,134 2,125 2,437 1,858 1,987 1,835 1,543 1,150
Total Demand 11,270 11,210 12,737 12,065 13,084 13,054 12,527 11,167
Ending Stocks 1,967 1,304 1,624 1,674 1,708 1,128 988 647
Stocks to Use (%) 17.45 11.63 12.75 13.87 12.95 8.64 7.9 5.8
Average Farm Price ($/Bu.)
$2.00 $3.04 $4.20 $4.06 $3.55 $5.18 6.22$6.80 –
$8.00
* December Estimate ** December Forecast. Source: USDA, World Agricultural Supply and Demand Estimates.


U.S. Soybean Balance Sheet (Sep-Aug)
Marketing Year 05/06 06/07 07/08 08/09 09/10 10/11 11/12* 12/13**
Million Bushels (Except as Noted)
Beg. Stocks 256 449 574 205 138 151 215 169
Imports 3 9 10 13 15 14 16 20
Acres Planted (Mil.) 72.0 75.5 64.7 75.7 77.5 77.4 75.0 77.2
Acres Harvested (Mil.) 71.3 74.6 64.1 74.7 76.4 76.6 73.8 75.7
% Harvested 99.0 98.5 99.0 98.7 98.5 99.0 98.4 98.1
Yield (Bu/A) 43 42.7 41.7 39.7 44 43.5 41.9 39.3
Production 3,063 3,188 2,677 2,967 3,359 3,329 3,094 2,975
Total Supply 3,322 3,647 3,261 3,185 3,512 3,495 3,325 3,160
Crush Sep/Aug 1,739 1,808 1,803 1,662 1,752 1,648 1,703 1570
Exports 940 1,116 1,159 1,283 1,501 1,501 1,362 1345
F/S/R 194 149 93 101 108 130 91 115
Total Demand 2,873 3,073 3,056 3,047 3,361 3,280 3,156 3031
Ending Stocks 449 574 205 138 151 215 145 115
Stocks to Use (%) 15.62 18.28 6.71 4.53 7.01 6.55 5.4 4.3
Average Farm Price ($/Bu.) $5.66 $6.43 $10.10 $9.97 $9.59 $11.30 $12.50
$13.55-15.55
* December Estimate ** December Forecast. Source: USDA, World Agricultural Supply and Demand Estimates.


Diversification and Dairy Farm Performance

RES ULTS
Income/ExpenseTotalAdjDairyCropping
5,129,000-1,414,1035,038,0001,505,103Total Income
3,300,626-1,414,1024,061,478653,250Total Expenses
1,828,3740976,522851,853Net Income
35.65%19.38%56.60%Profit margin
Sample Dairy Operations

Hay price (PH) as a function of corn price (PC)
• PH = 70.39 + 15.73 PC
(6.65)
• R2 = .9046
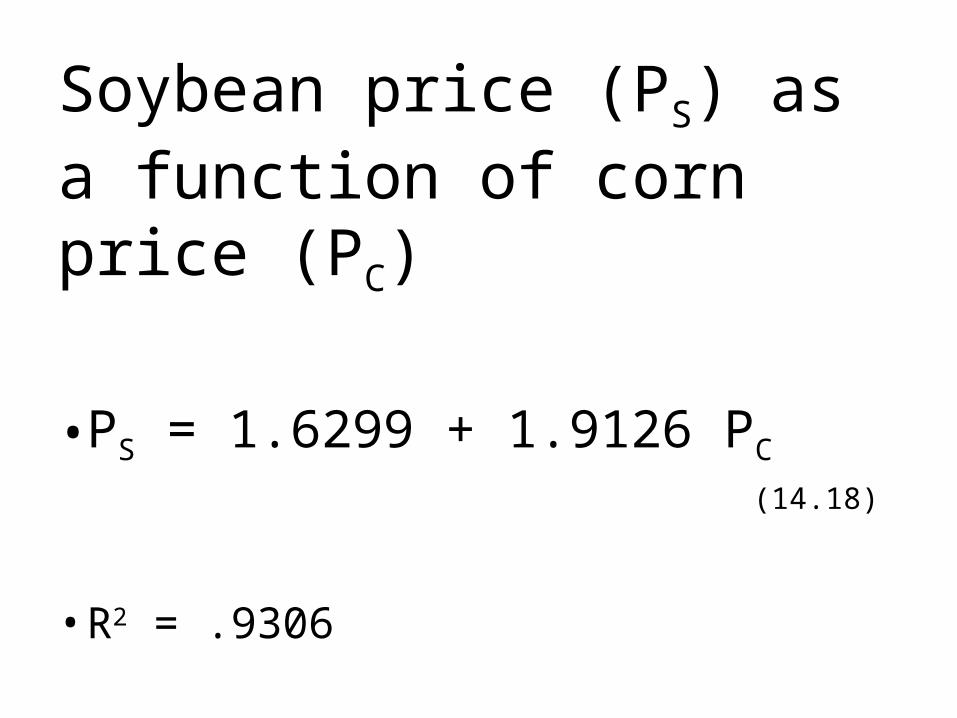
Soybean price (PS) as a function of corn price (PC)
• PS = 1.6299 + 1.9126 PC
(14.18)
• R2 = .9306

Soybean Meal price (PSBM) as a function of soybean price (PS)
• PSBM = 36.7135 + 27.917 PS
(16.017)
• R2 = .9379

CroppingS BMCorn S ilageCornAlfalfa
400450650Acres Raised181803.7Crop Yield / Acre
455.9770.007180.5Market Price
808020S eed15015095Ferti lizer
35355Pesticide303020Other variable cost
12012080Labor / management
225Rent Charge Per Acre ($)800Owned Acres
Cropping Assumptions
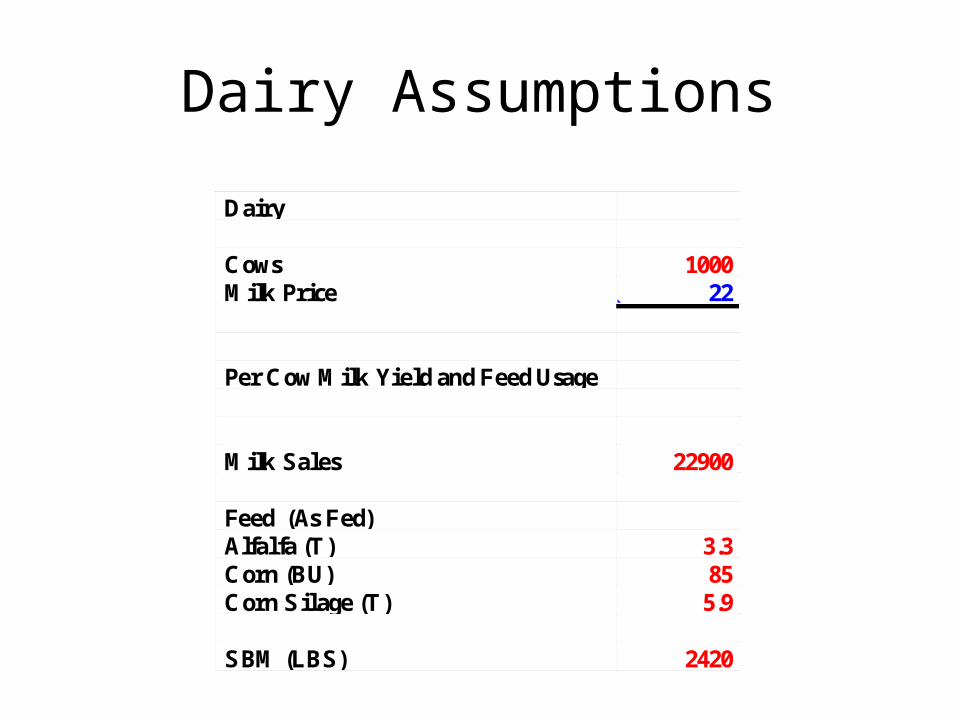
Dairy
1000Cows22Milk Price
Per Cow Milk Yield and Feed Usage
22900Milk Sales
Feed (As Fed)3.3Alfalfa (T)85Corn (BU)
5.9Corn S ilage (T)
2420S BM (LBS)
Dairy Assumptions
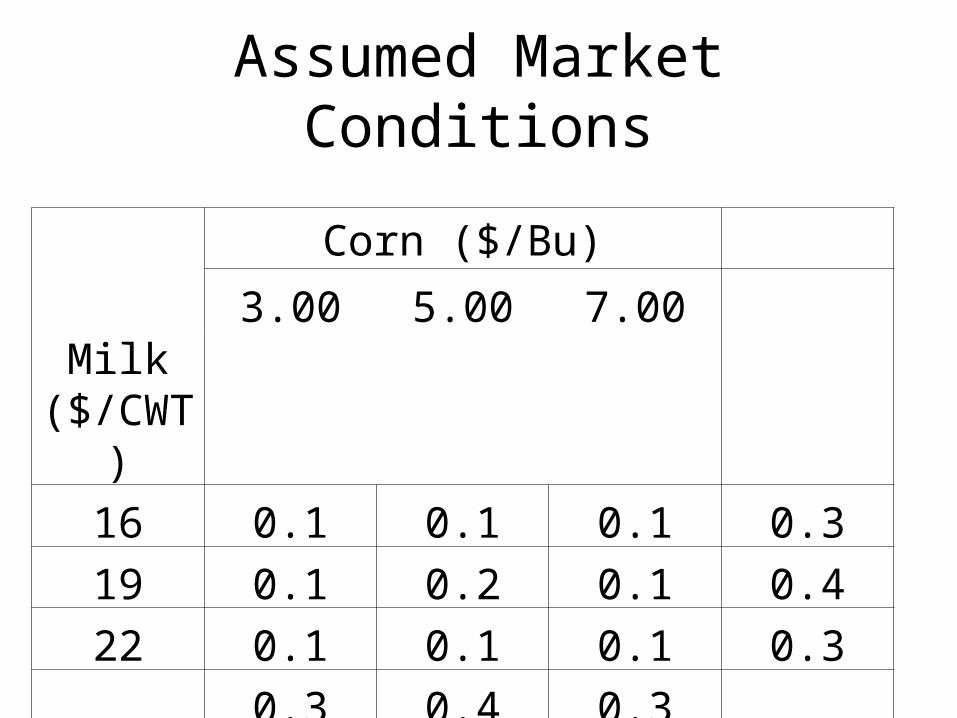
Assumed Market Conditions
Milk ($/CWT)
Corn ($/Bu)3.00 5.00 7.00
16 0.1 0.1 0.1 0.319 0.1 0.2 0.1 0.422 0.1 0.1 0.1 0.3
0.3 0.4 0.3
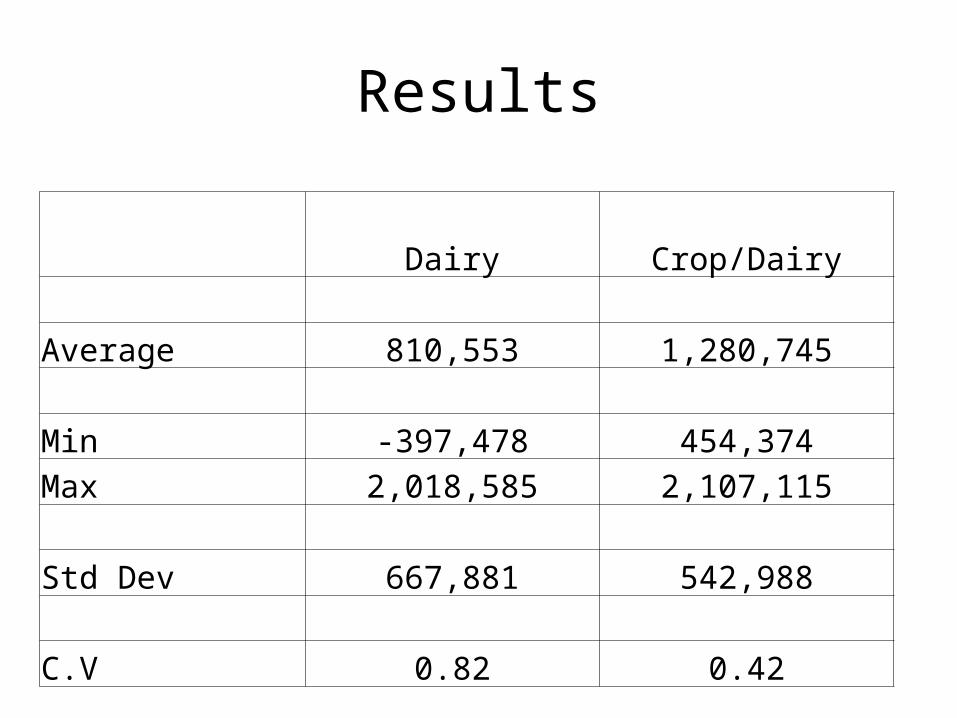
Results
Dairy Crop/Dairy
Average 810,553 1,280,745
Min -397,478 454,374
Max 2,018,585 2,107,115
Std Dev 667,881 542,988
C.V 0.82 0.42

Farm Bill Issues


Likely 2013 Farm Bill
• Subsidized crop insurance – Voluntary
• Reduced protections for dairy• Dairy Security Act -- Senate• Dairy Freedom Act -- House

Dairy Security Act
• Dairy Producer Margin Protection Plan– Voluntary– “Guarantees” producers $4/CWT Income over
Feed Costs (IOFC) on 80% historic production– Producers can purchase higher IOFC protection– Administrative fee of up to $2500– Requires participation in Dairy Market
Stabilization Program – Supply Control

Dairy Freedom Act
• Voluntary
• Margin insurance program where payments of higher premiums can increase IOFC per CWT guarantee from $4 to as much as $8

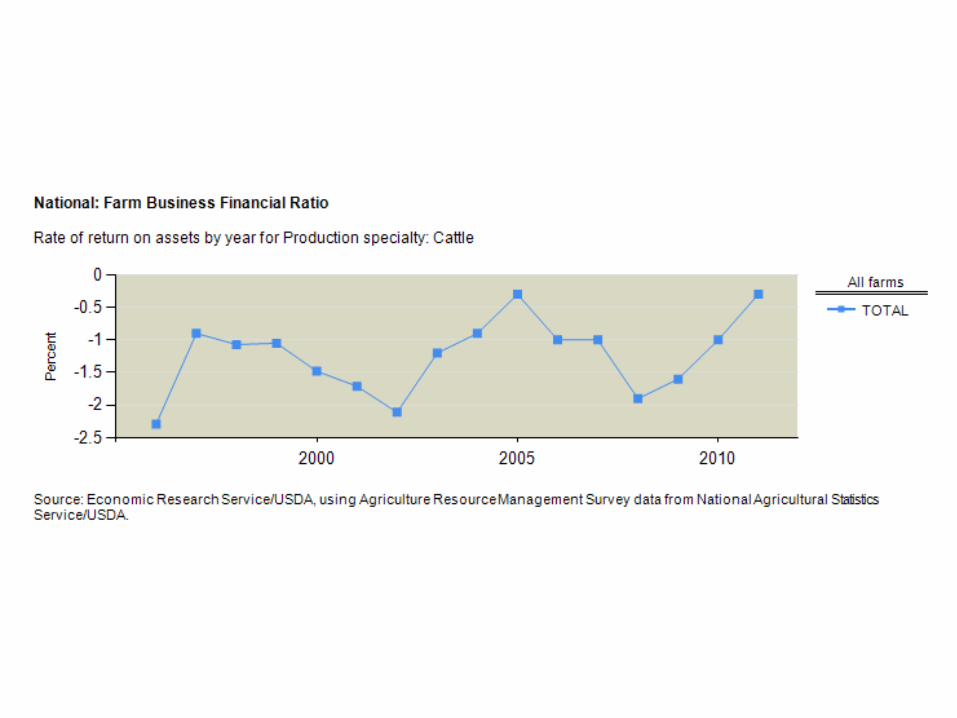
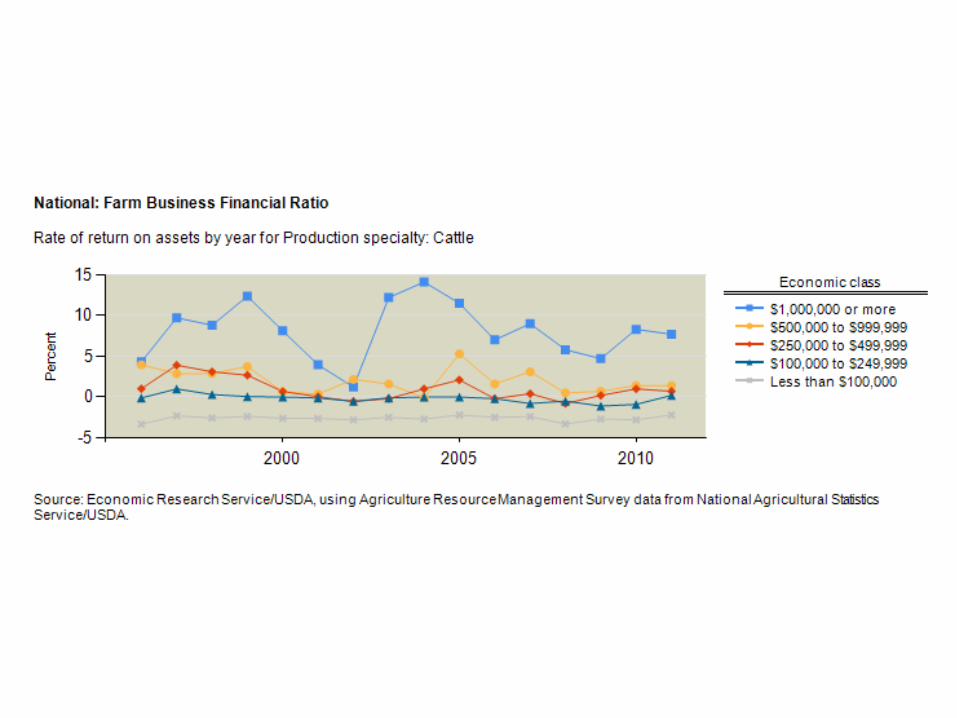
Enterprise PerformanceUSDA-ERS ARMS


USDA-ERS Long Run Outlook


Farmland Values

(1 )
( )
gV R
r g
Land Valuation Model
V = Value of Land
R = Return From Land
g = Annual Growth in Return (R)
r = Opportunity Cost of Capital

Trend – Growth of 6.74 % per year

Trend – Growth of 5.14 % per year

Trend – Growth of 5.26 % per year


Trend – Growth of 2.83 % per year

Trend – Growth of 3.15 % per year
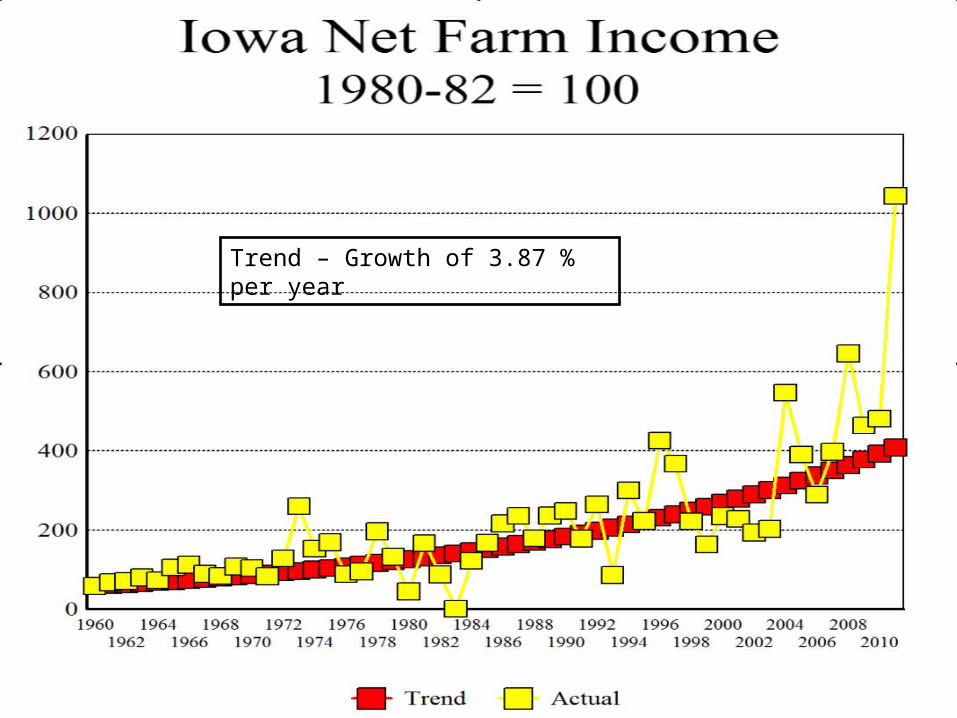
Trend – Growth of 3.87 % per year
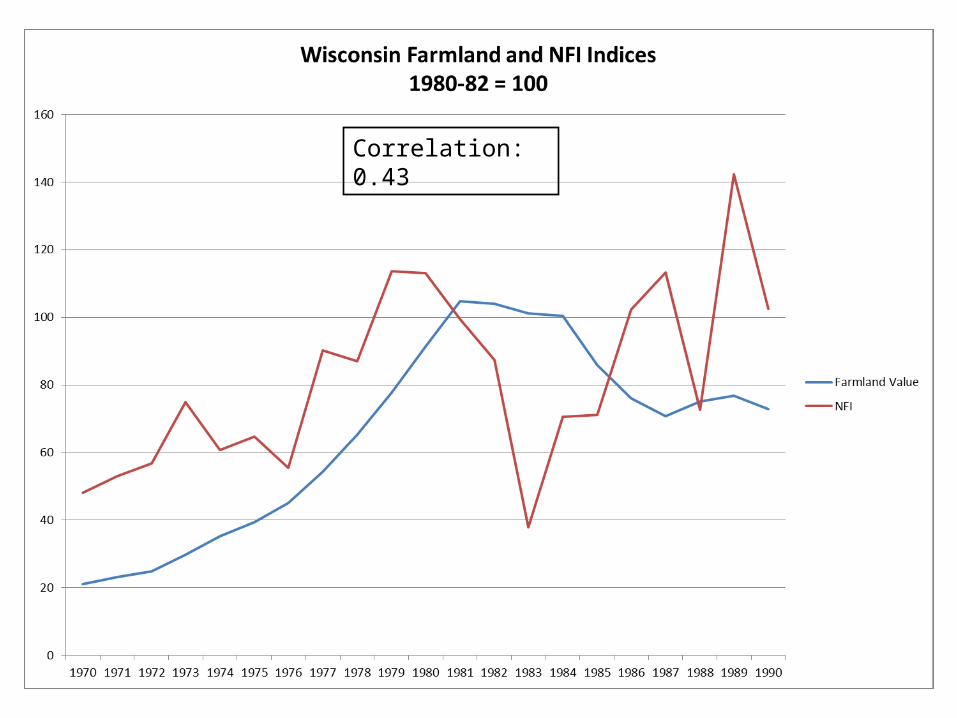
Correlation: 0.43

Correlation: 0.72

Correlation: -0.21

Correlation: 0.77

Correlation: -0.33

Correlation: 0.84
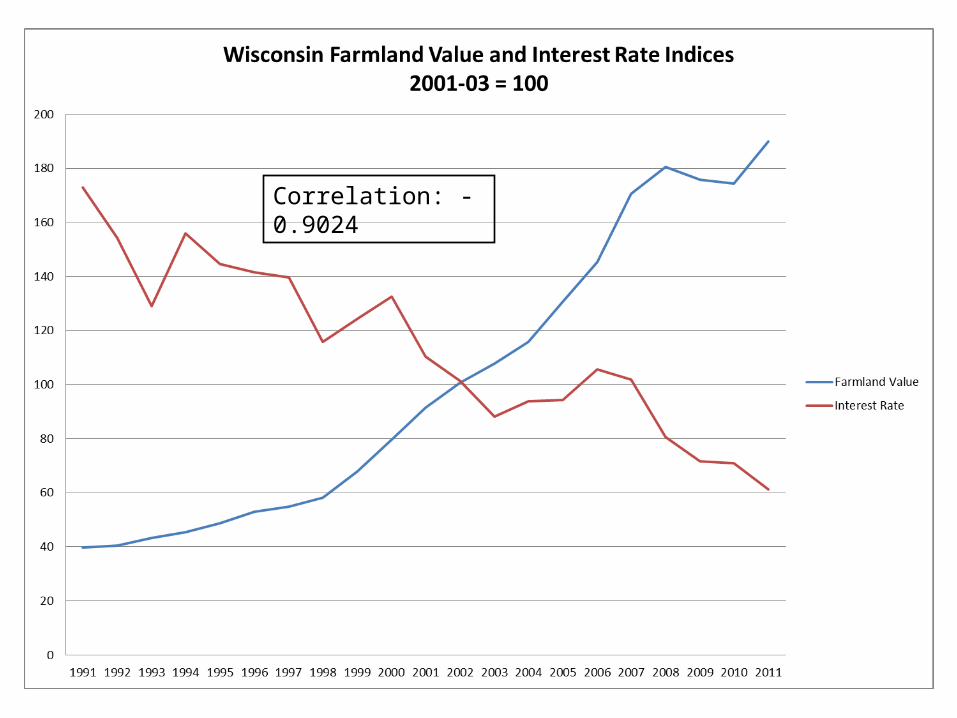
Correlation: -0.9024

Correlation: -0.8616
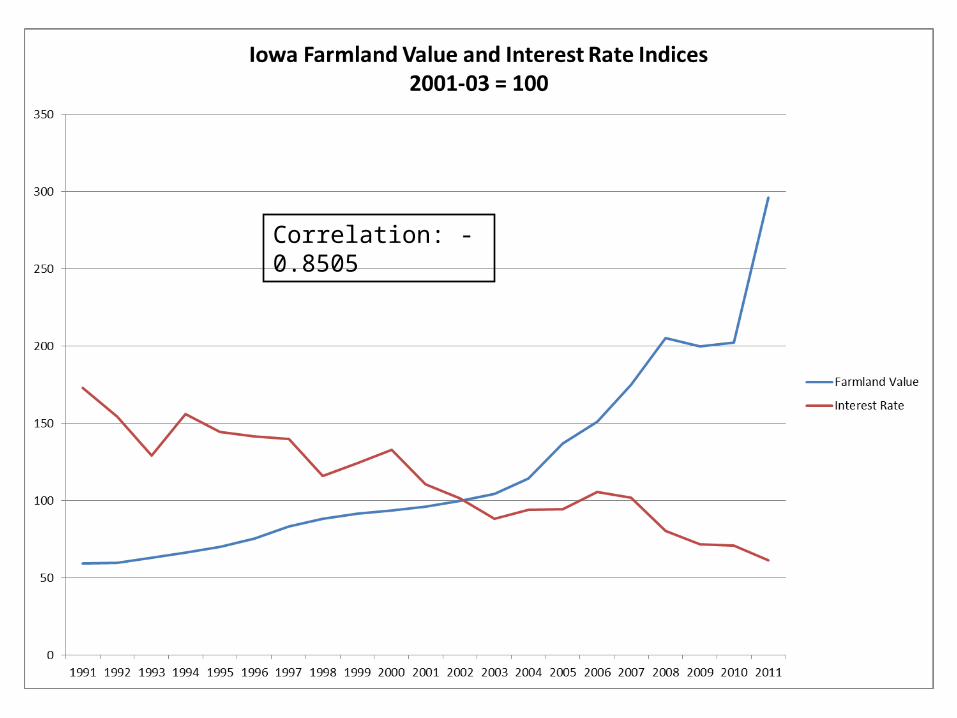
Correlation: -0.8505


Grain Markets and Ethanol Production

US Gasoline Consumption
367 Million Gallons / Day --- 134 Billion Gallons / Year
Energy Information Administration
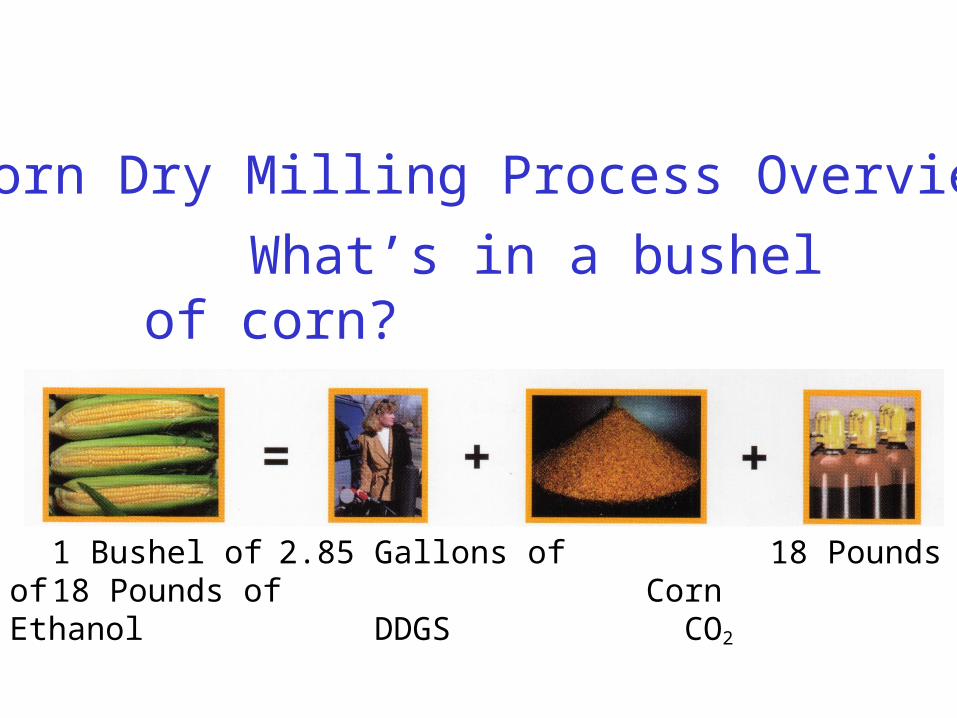
What’s in a bushel of corn?
Corn Dry Milling Process Overview
1 Bushel of 2.85 Gallons of 18 Pounds of 18 Pounds of Corn Ethanol DDGS CO2

Corn Demands To Meet Ethanol Blending Needs Associated With 134 Billion Gallons Of
Annual Gasoline Consumption
Blend rate (%) Corn needs (Billions of Bu.)
10 4.7
12.5 5.9
15 7.1
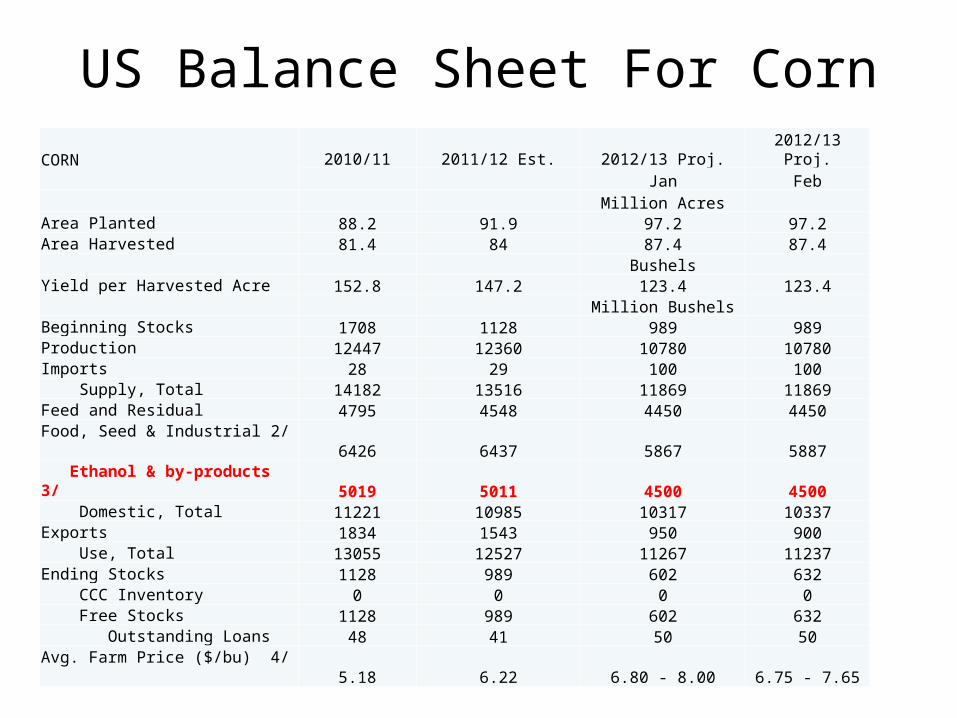
CORN 2010/11 2011/12 Est. 2012/13 Proj. 2012/13 Proj. Jan Feb
Million AcresArea Planted 88.2 91.9 97.2 97.2Area Harvested 81.4 84 87.4 87.4 BushelsYield per Harvested Acre 152.8 147.2 123.4 123.4 Million BushelsBeginning Stocks 1708 1128 989 989Production 12447 12360 10780 10780Imports 28 29 100 100 Supply, Total 14182 13516 11869 11869Feed and Residual 4795 4548 4450 4450Food, Seed & Industrial 2/
6426 6437 5867 5887 Ethanol & by-products 3/
5019 5011 4500 4500 Domestic, Total 11221 10985 10317 10337Exports 1834 1543 950 900 Use, Total 13055 12527 11267 11237Ending Stocks 1128 989 602 632 CCC Inventory 0 0 0 0 Free Stocks 1128 989 602 632 Outstanding Loans 48 41 50 50Avg. Farm Price ($/bu) 4/
5.18 6.22 6.80 - 8.00 6.75 - 7.65
US Balance Sheet For Corn