an update on the mlds synthetic data project...mmm nnn ooo ppp qqq sss rrr ttt uuu vvv www xxx...
TRANSCRIPT

An Update on the MLDS Synthetic Data ProjectLaura Stapleton, UMCPTerry Shaw, UMB(and a host of many others!)

What is the Synthetic Data Project?○ In 2015, the State of Maryland received a grant from the U.S.
Department of Education’s State Longitudinal Data Systems program. A portion of these award dollars (about $2.7M) was to create a synthetic data system of the data in the MLDS.
○ Synthetic data are generated based on models to mimic the relational patterns among variables, so statistical analyses with such “fake” synthetic data should yield findings substantially similar to the real data
○ Simultaneously, reduces the risk of privacy breach
2

Background
○ State education and longitudinal data systems are advancing and growing in number, and the use of these data systems for education and workforce research holds great promise (Figlio, Karbownik, & Salvanes, 2017).
○ Since 2005, the USDOE has supported 47 states, as well as the District of Columbia, Puerto Rico, the Virgin Islands, and American Samoa in their development of statewide education data systems (SLDS Grant Program, 2018b), representing an overall investment of $721 million in federal funding as of May 2018 (SLDS Grant Program, 2018a).
3

Benefits of State Longitudinal Data Systems
○ provide a number of advantages to researchers as compared to traditional survey measures, including
○ larger data sets, ○ fewer problems with attrition, ○ low rates of non-response bias, and ○ more data for rare populations○ relatively cost-effective approach to answering policy
questions as no need for costly and time-consuming primary data collection
4

Limited Access: Example state policies
○ MS and WA require an MOU between the researcher and any institution or state agency that provides data for the research
○ In FL, a minimum of three months should be expected from the time a completed data request proposal is submitted to the receipt of the final approval decision
○ ID requires the applicant to submit the SQL code to extract the data
○ NC limits access to state and local government officials who must first register with the North Carolina identity management system
5

Questions in Development of the Maryland SDP
○ What challenges arise in the process of creating synthetic data from a statewide longitudinal data system?
○ What are the best methods for assessing the quality of the synthesized data?
○ How successfully do the synthesized data fulfill the needs of the MLDS Center to provide accessible data that can inform policy while protecting individual privacy?
○ To what extent do end users (applied researchers) find the synthetic data useful, and to what extent are the data actually used in analyses that inform policy?
6

The Process…
We found that we needed to split the project into three broad steps:
1) creation of gold standard datasets (GSDS),
2) synthesization of the GSDS, and
3) evaluation of the utility and safety of the synthetic data sets (SDS)
7

The Process, continued…
8

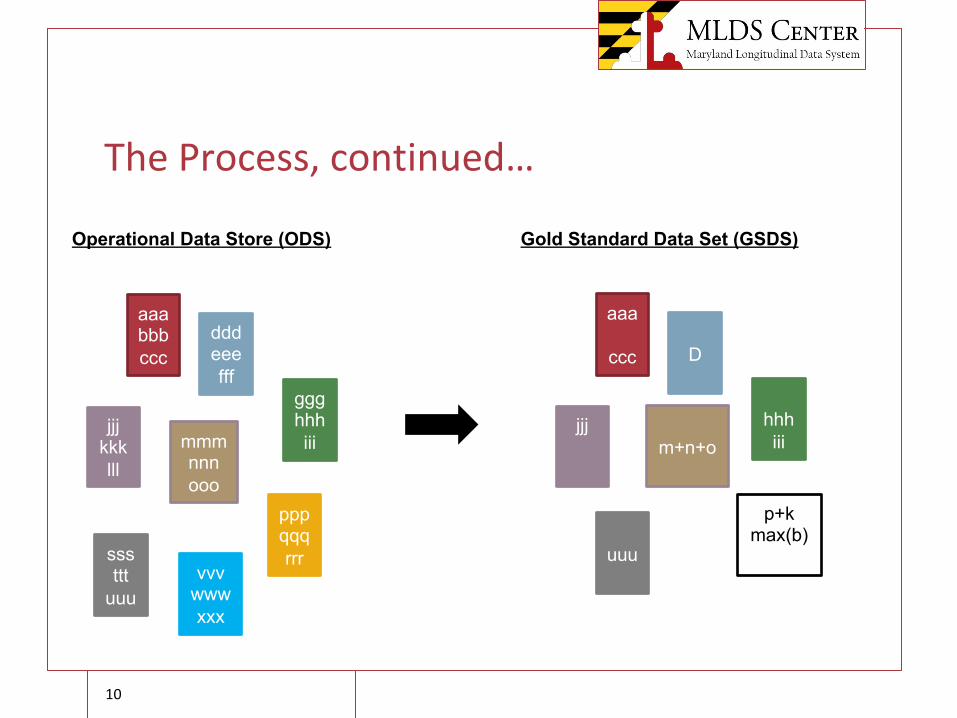
The Process, continued…
○ The creation of the SDS is built upon the structure and definition of the GSDS
○ We cannot synthesize the entire database; the GSDS is a simplified version of the original data that contains the variables to be synthesized
○ Synthetic datasets then serve as a mirror image of the GSDS○ Because we create the synthetic data by running predictive
models on the GSDS, the definition and structure of the GSDS are of critical importance as they directly dictate the definition and the structure of the synthetic data
9
The Process, continued…
aaabbbccc
dddeeefff
ggghhhiii
jjjkkklll
mmmnnnooo
pppqqqrrrsss
tttuuu
vvvwwwxxx
Operational Data Store (ODS) Gold Standard Data Set (GSDS)
aaa
ccc D
hhhiii
jjj
p+kmax(b)
uuu
m+n+o
10

Data Study (Step 1.1)
For each variable, we:○ studied the data coding by checking the consistency between
the data dictionary and the values stored in the system ○ examined the descriptive statistics—especially regarding
outliers, missing data patterns, and in some cases the pattern of “not applicable” for some variables
○ investigated the presence of redundant or overlapping information as we have multiple data sources
Exploring these data issues played an important role in variable selection and information aggregationOne of the identified challenges at this step was potential record linkage errors
11

Evaluation of Existing Research Questions (Step 1.2)
○ While investigating data elements in the larger data system, we evaluated the research analyses that have used the data housed in the MLDS data system along with the current research agenda of the Center. https://mldscenter.maryland.gov/ResearchAgenda.html
○ For example, studies have evaluated the effect of dual enrollment on college attendance and performance, the impact of a state financial aid program on college persistence, and the longitudinal impact of school-level and individual-level poverty on students’ academic outcomes and employment outcomes
○ https://mldscenter.maryland.gov/ResearchReports.html○ To be of the greatest use, the GSDS should contain the data
needed for these reports/studies
12

End User Input About Research Questions And Methods (Step 1.3)
○ Convened a group of institutional researchers, scholars in the areas of education and workforce outcomes, and policy analysts and presented them with non-confidential, simplified versions of the data tables.
○ We asked about their research interests, the analytic methods they would use if given access to synthesized datasets of a similar type, and the desired format.
○ They were interested in conducting analyses on longitudinal panel data, or trajectories, covering a wide range of topics, including students’ attendance, academic performance, and employment conditions.
○ They encouraged us to focus on a single cohort.
13

Definition of Cohort and Variables (Step 1.4)
Cohort definition○ HS -> PS 9th graders in 2010-11 until 2015-16○ HS -> WF 9th graders in 2010-11 until 2015-16○ PS -> WF first-time freshmen in 2010-11 until 2015-16
Variable selection○ defining and creating the GSDS were completed under two
anticipated constraints: 1) practicality constraints and 2) legal constraints
14

Decision point: Pass Stakeholder Review (Step 1.5)
○ We presented the cohort definitions, list of variables, and simplified data structure to the major stakeholders within the MLDS Center.
○ Although we discuss this decision at the end of Step 1, the creation of the GSDS is an iterative process
○ This step should be repeated throughout the entire course of creating the GSDS, from cohort definition to variable selection and information aggregation. (And still continues to this date…)
15

The Process, continued…
aaabbbccc
dddeeefff
ggghhhiii
jjjkkklll
mmmnnnooo
pppqqqrrrsss
tttuuu
vvvwwwxxx
Operational Data Store (ODS) (v=460) Gold Standard Data Set (GSDS) (v=65, 50, 55)
aaa
ccc D
hhhiii
jjj
p+kmax(b)
uuu
m+n+o
(But there are many rows of data per person!)
16

The Process, continued…
17
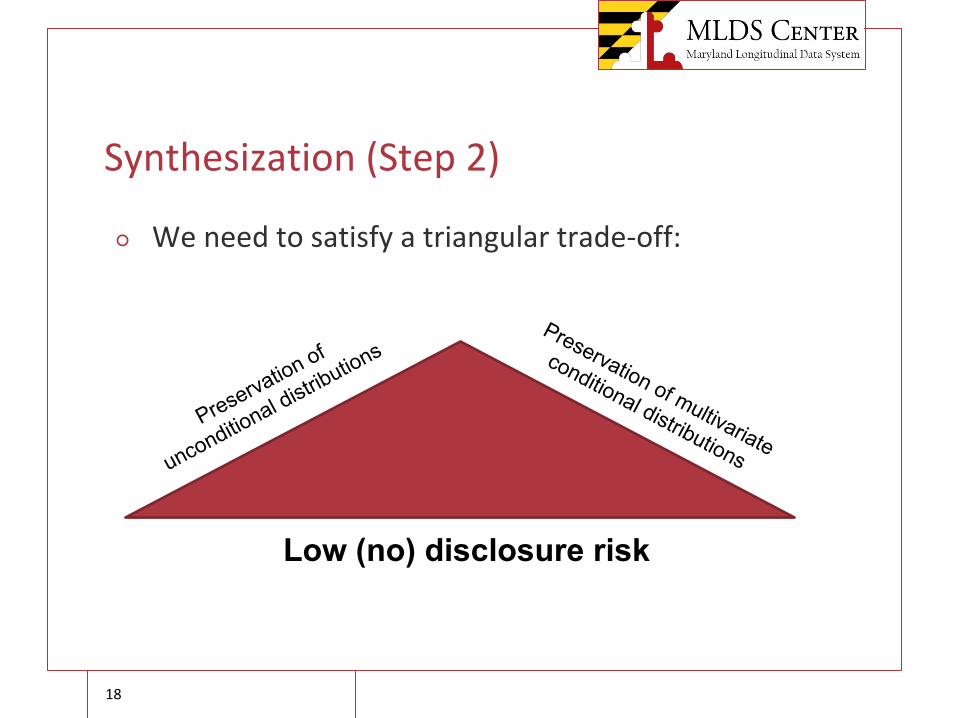
Synthesization (Step 2)
○ We need to satisfy a triangular trade-off:
Low (no) disclosure risk
Preservation of
unconditional distributionsPreservation of multivariate
conditional distributions
18

Creation of Synthetic Data
○ There are various methods that can be used to generate synthetic data, all of which require some kind of strategy for modeling relations among variables in the raw data
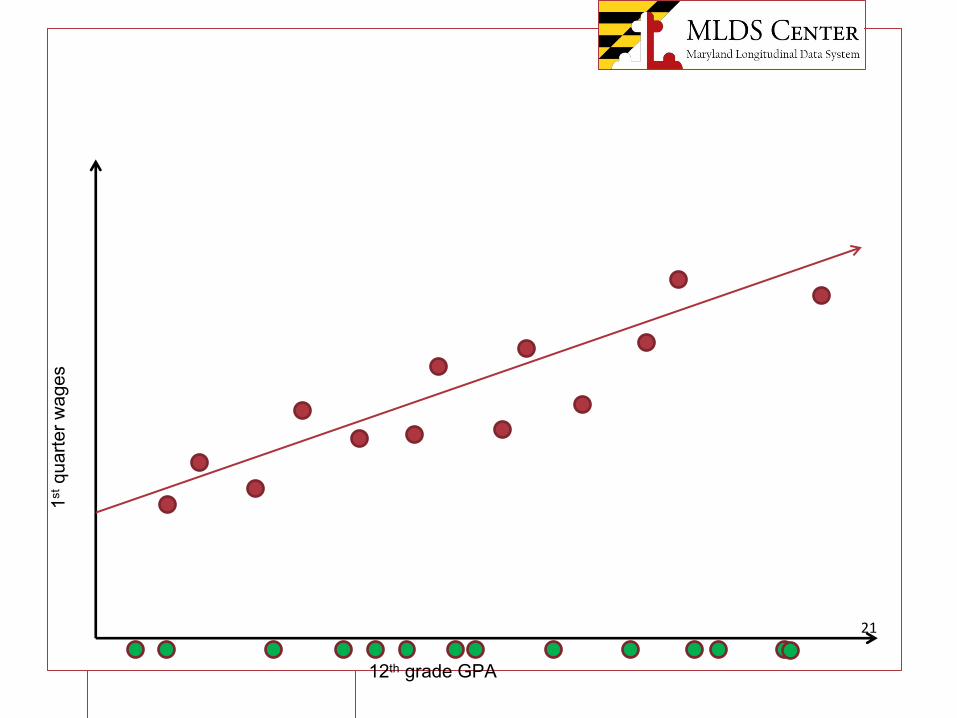
○ Synthetic data generation is traditionally accomplished with sequential regression models. Variables are arranged, and therefore synthesized, in a certain order
○ For each variable, a regression model is developed against a selection of predictors among the preceding variables. The models are developed in a sequential manner until a model is developed for each variable in the data. Synthetic data are thus generated sequentially from the posterior predictive distribution for each variable
19

20
12th grade GPA
1stqu
arte
r wag
es
21
12th grade GPA
1stqu
arte
r wag
es

22
12th grade GPA
1stqu
arte
r wag
es
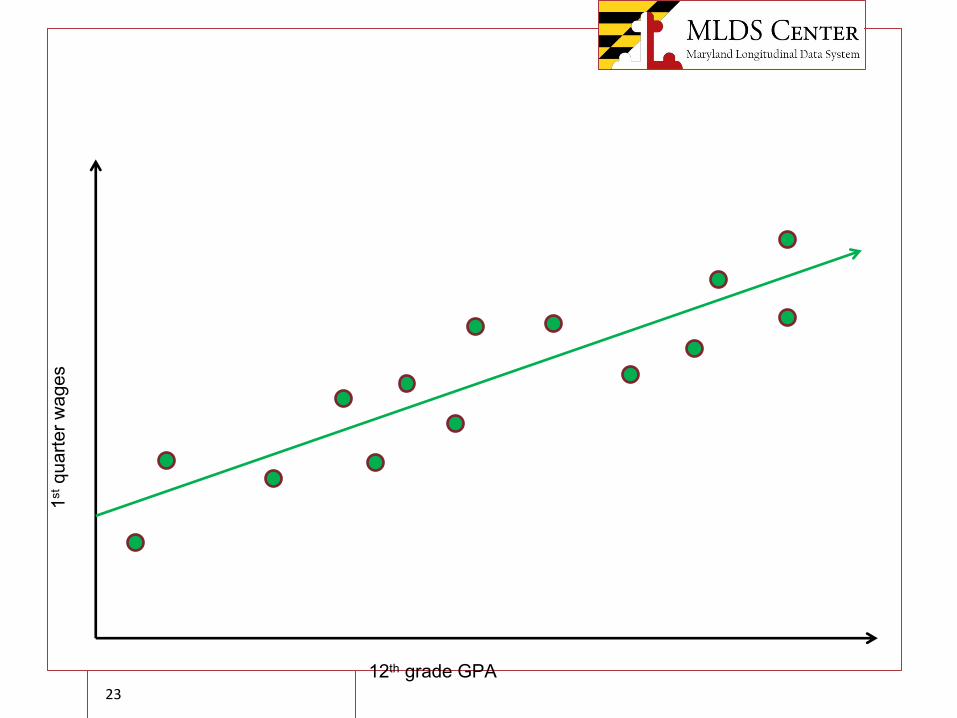
12th grade GPA
1stqu
arte
r wag
es
23
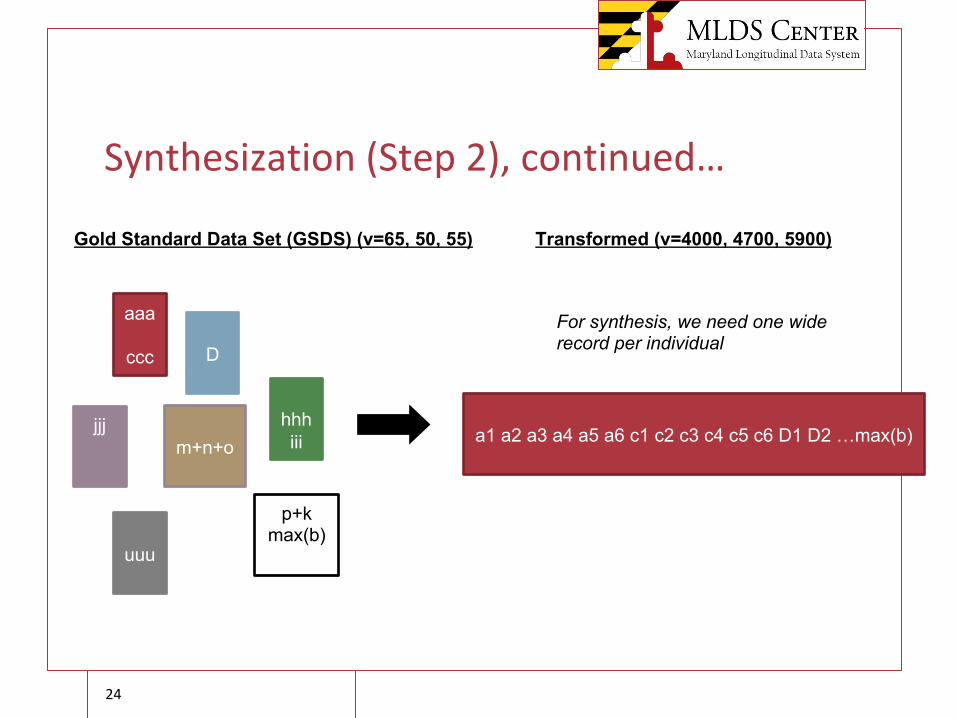
Synthesization (Step 2), continued…
Gold Standard Data Set (GSDS) (v=65, 50, 55)
aaa
ccc D
hhhiii
jjj
p+kmax(b)
uuu
m+n+o
Transformed (v=4000, 4700, 5900)
a1 a2 a3 a4 a5 a6 c1 c2 c3 c4 c5 c6 D1 D2 …max(b)
For synthesis, we need one wide record per individual
24
Synthesization (Step 2), continued…
○ Given the sheer number of variables (in wide format) and the potential for interactions and non-linearities….
○ After initial testing and evaluation of the different existing methods, the decision was made to implement the CART method (described in Reiter, 2005b)
○ A CART is the outcome of a general empirical method to model a dependent variable conditionally to a set of predictor variables. It partitions the joint predictor space obtained after applying a binary partition recursively.
25

Synthesization (Step 2), continued…
○ Each binary partition consists of finding the best split, e.g. identifying the predictor variable and threshold that will split the dataset in two sub-datasets (nodes) for which the within-node dispersion of the dependent variable is minimal.
○ The process is repeated in the resulting two sub-datasets until no potential split results in a significant between-node dispersion (or we reach an alternate stopping rule, such as N=30).
26
Example of A Classification Tree for Term Grade Point Average
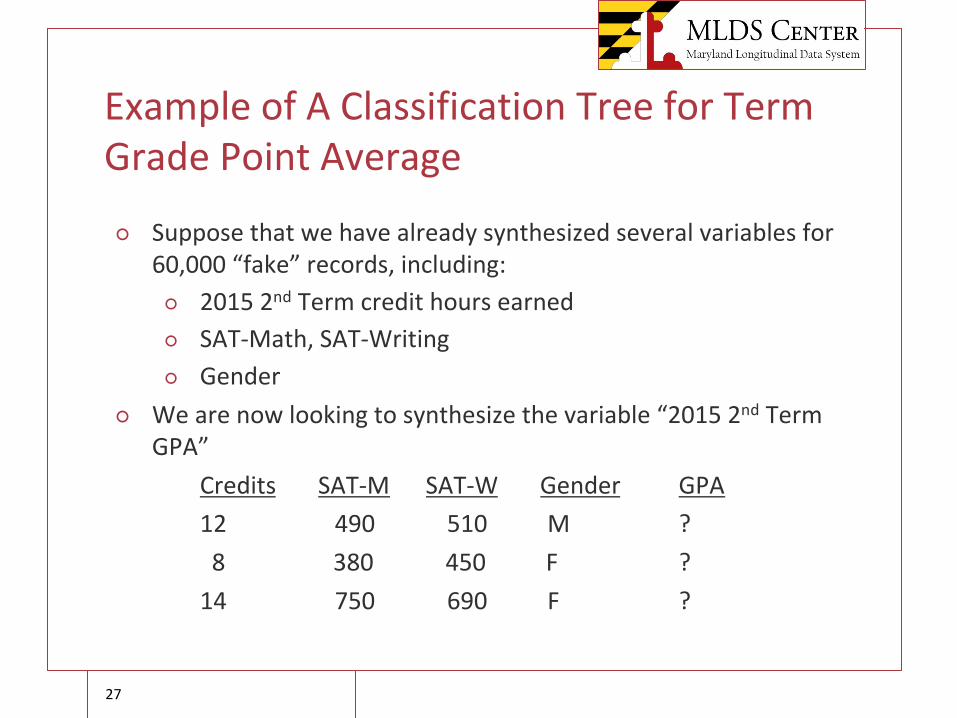
○ Suppose that we have already synthesized several variables for 60,000 “fake” records, including:
○ 2015 2nd Term credit hours earned○ SAT-Math, SAT-Writing○ Gender
○ We are now looking to synthesize the variable “2015 2nd Term GPA”
Credits SAT-M SAT-W Gender GPA12 490 510 M ?8 380 450 F ?
14 750 690 F ?
27

Example of a classification tree for term grade point average
○ We will use the REAL data from GSDS to build a set of possible values for each these “fake” students
Suppose the GSDS data contained these values:Credits SAT-M SAT-W Gender GPA11 490 510 M 2.115 380 450 F 3.29 750 690 F 3.6 0 380 410 F .
12 710 750 M 3.816 450 590 M 2.9 We will divide up the full distribution into homogeneous sets
28

Example of a classification tree for term grade point average
29
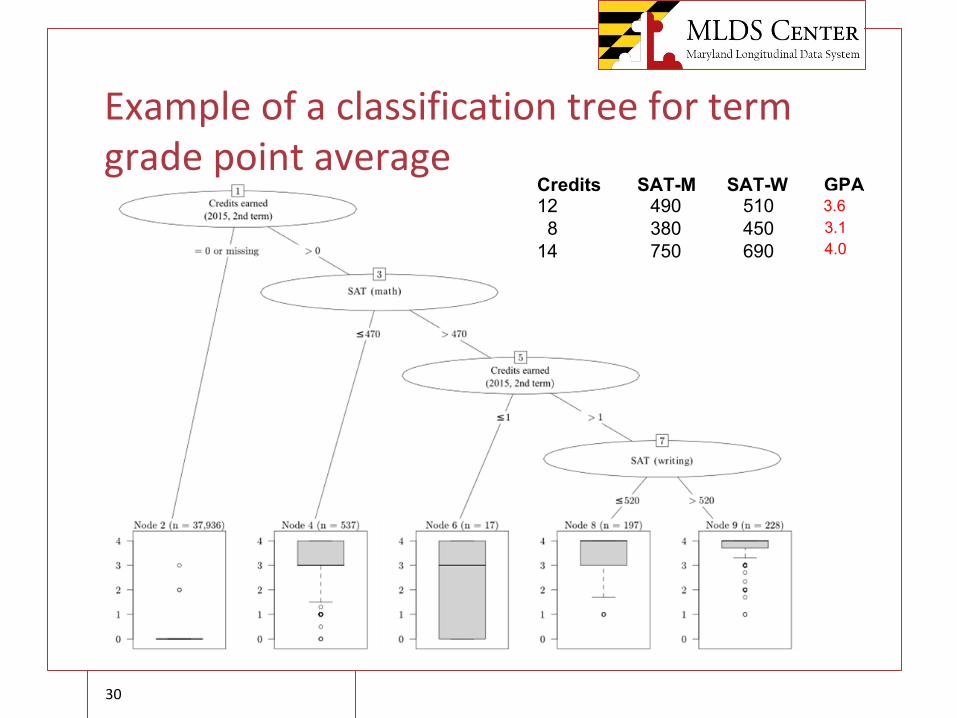
Example of a classification tree for term grade point average
Credits SAT-M SAT-W GPA12 490 510 ?8 380 450 ?
14 750 690 ?
3.63.14.0
30
Synthesization (Step 2), continued…
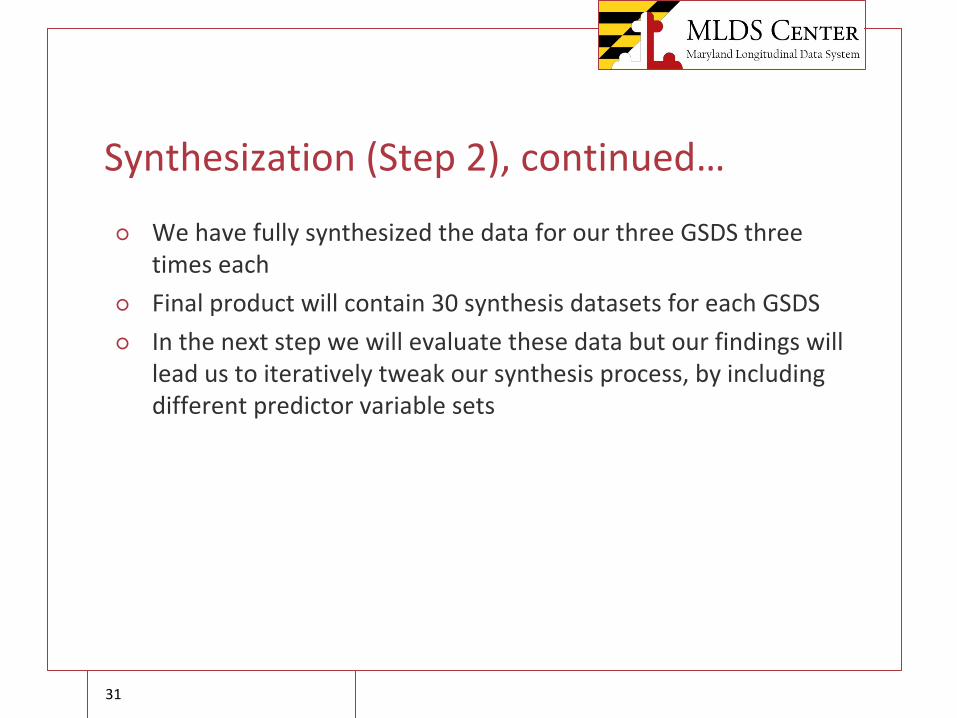
○ We have fully synthesized the data for our three GSDS three times each
○ Final product will contain 30 synthesis datasets for each GSDS○ In the next step we will evaluate these data but our findings will
lead us to iteratively tweak our synthesis process, by including different predictor variable sets
31

The process, continued…
32
Evaluation (Step 3)
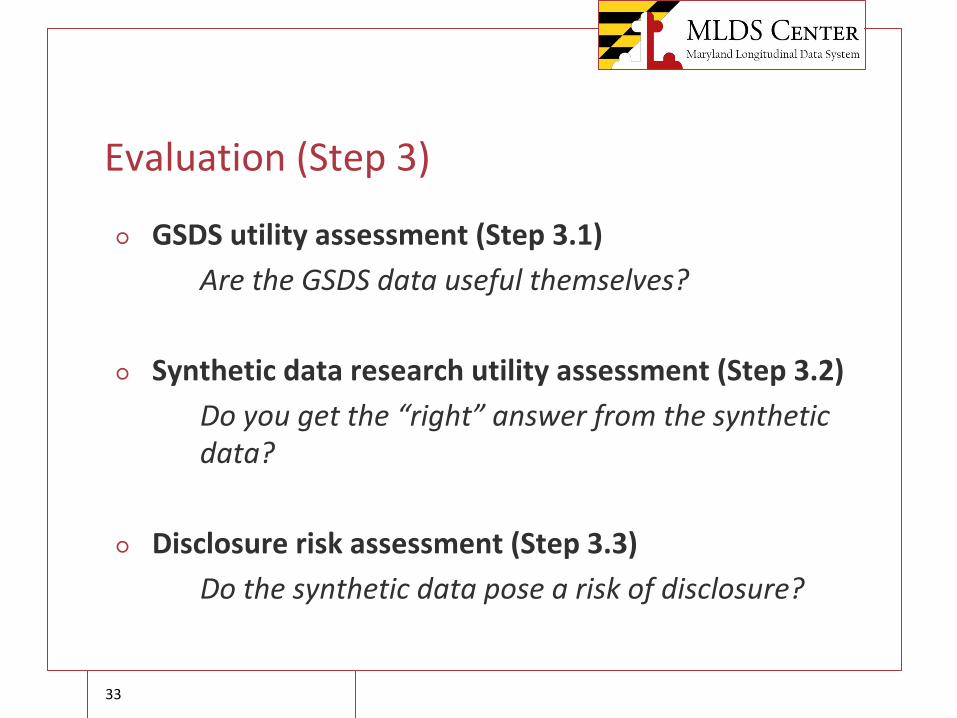
○ GSDS utility assessment (Step 3.1) Are the GSDS data useful themselves?
○ Synthetic data research utility assessment (Step 3.2) Do you get the “right” answer from the synthetic data?
○ Disclosure risk assessment (Step 3.3) Do the synthetic data pose a risk of disclosure?
33

Research Utility Assessment (Step 3.2)
○ To illustrate components of utility assessment, we use a subset of the PS->WF GSDS and three SDSs.
○ Regressed (log transformed) 2016 wages on gender, SAT-Math, transformed 2015 wages, and race/ethnicity categories
○ The sample size of this cohort was 51,863 students○ We calculate the standardized difference between the estimates
of interest based on the GSDS and for each SDS as
SDS GSDS
GSDS
SDSE
b b-=
34

Research Utility Assessment (Step 3.2)
○ We also calculate the measure of confidence interval overlap for each estimate (Karr, Kohnen, Organian, Reiter, & Sanil, 2006) as
○ where UCLSDS and LCLSDS represent, respectively, the average upper and lower confidence limits for the replicated estimates based on the SDSs and where UCLGSDS and LCLGSDS are the confidence limits for the estimate based on the GSDS
○ Note that when the two confidence intervals do not overlap, the further they are away from each other the more negative the IOestimate will become.
min( , ) max( , ) min( , ) max( , ).5 SDS GSDS SDS GSDS SDS GSDS SDS GSDS
GSDS GSDS SDS SDS
UCL UCL LCL LCL UCL UCL LCL LCLIOUCL LCL UCL LCL
ì ü- -= +í ý- -î þ
35

Comparisons of Standardized Multiple Regression Coefficient Estimates
36
Comparisons of Standardized Multiple Regression Coefficient Estimates
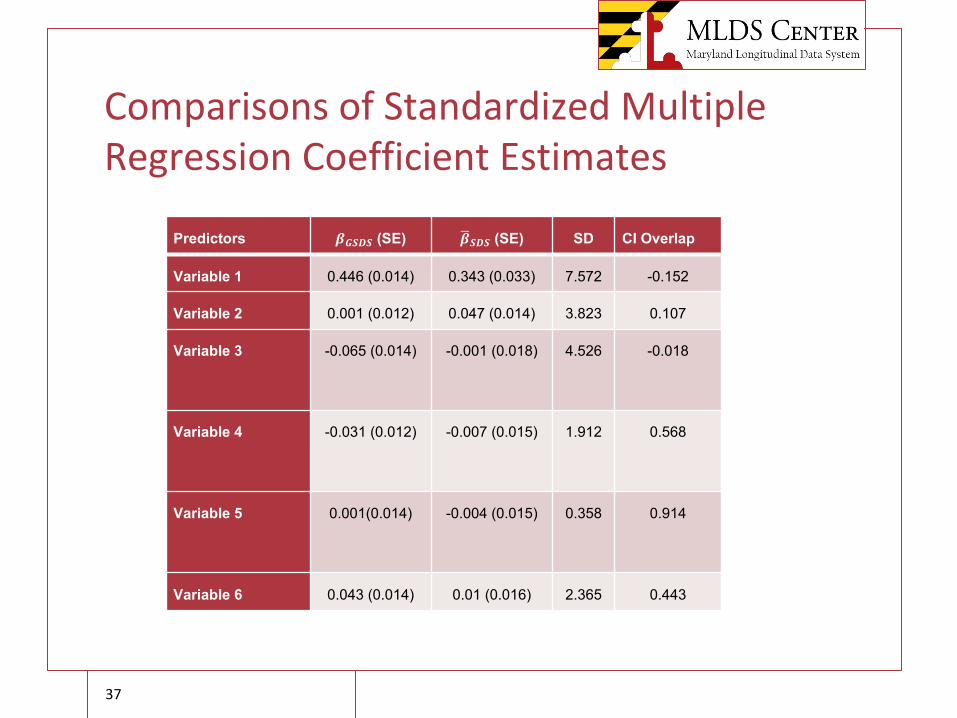
Predictors 𝜷𝑮𝑺𝑫𝑺 (SE) %𝜷𝑺𝑫𝑺 (SE) SD CI Overlap
Variable 1 0.446 (0.014) 0.343 (0.033) 7.572 -0.152
Variable 2 0.001 (0.012) 0.047 (0.014) 3.823 0.107
Variable 3 -0.065 (0.014) -0.001 (0.018) 4.526 -0.018
Variable 4 -0.031 (0.012) -0.007 (0.015) 1.912 0.568
Variable 5 0.001(0.014) -0.004 (0.015) 0.358 0.914
Variable 6 0.043 (0.014) 0.01 (0.016) 2.365 0.443
37

Research Utility Assessment (Step 3.2)
38
Research Utility Assessment (Step 3.2)
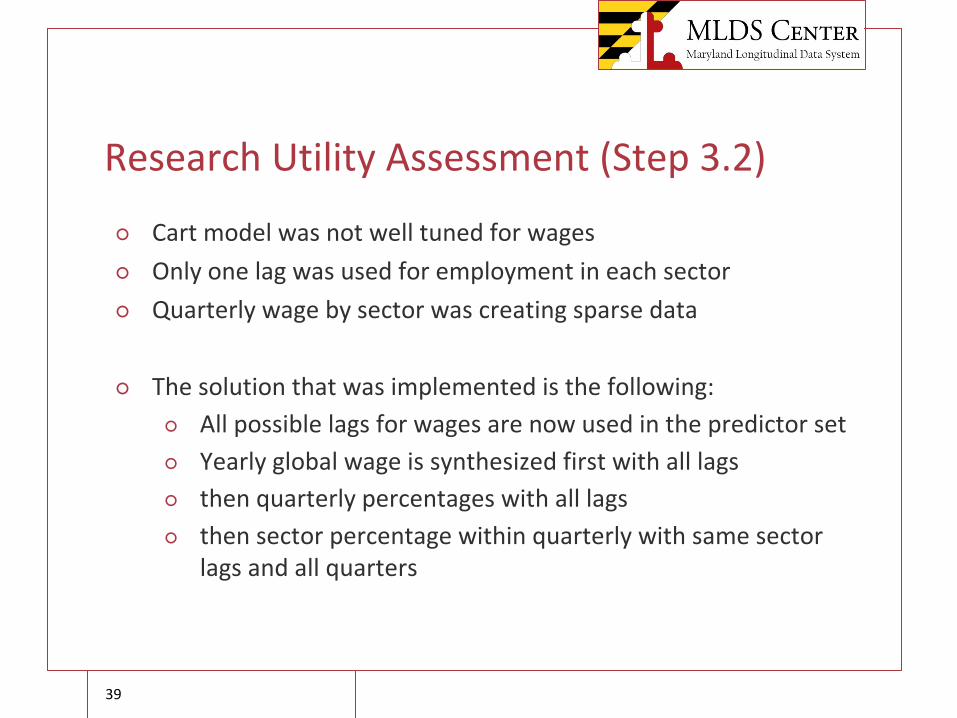
○ Cart model was not well tuned for wages○ Only one lag was used for employment in each sector○ Quarterly wage by sector was creating sparse data
○ The solution that was implemented is the following:○ All possible lags for wages are now used in the predictor set○ Yearly global wage is synthesized first with all lags○ then quarterly percentages with all lags○ then sector percentage within quarterly with same sector
lags and all quarters
39

Research Utility Assessment (Step 3.2)
40

Disclosure Risk Assessment (Step 3.3)
1) identification disclosurerelates to the potential for an intruder to match a given record with a specific individual
2) attribute disclosurerefers to the possibility that even aggregate data collected from these systems have the potential to disclose aspects of different subpopulations that may be sensitive in nature
41
Disclosure Risk Assessment (Step 3.3)
○ The below table examines the probability of identification of specific records in the synthesized data given specific levels of knowledge by an intruder. The information in the table is for demonstration purposes. The probabilities in the table were developed based on the methodology that is being utilized to calculate the disclosure risk for the synthetic data project but is based on simulations using 51,106 individual records from the Current Population Survey as described in a manuscript by Jerome P. Reiter (2005). The probabilities are calculated by dividing 1 over the total number of records identified as having the known characteristics.
42

Disclosure Risk Assessment (Step 3.3)Probabilities of Identification of a specific Record in Synthesized Data1
Intruder knows…Demographic Characteristics
Demographic Characteristics and Educ outcomes
Demographic Characteristics, Educ. Outcomes, and Wages
The individual is unique within the source data.
Intruder knows a specific record of interest is in the dataset2.
0.00045 0.00069 0.00097 0.0047
Intruder does not know a specific record of interest is in the dataset2
and has knowledge of the underlying process used to synthesize data.
0.0016 0.0028 0.0088 0.01
43

Disclosure Risk Assessment (Step 3.3)
○ 1The data for this project is fully synthesized meaning that there are no individual records from the original ‘gold standard’ data and the synthetic datasets. Individual observations in the synthetic data contain distributed predicted values based on the analytical predictive model. For the purposes of this table the fully synthesized data is being compared to data where multiple perturbations of the data occurred.
○ 2The synthetic dataset will be based on samples of the entire universe of records so it will not be possible for an intruder to know whether a record could be in the synthetic file.
○ Reiter, J.P. (2005). Estimating Risks of Identification Disclosure in Microdata. Journal of the American Statistical Association (472), 1103-1112.
44

Governing Board Approval (Step 3.4)
○ Before the data can be released to the public, the board must approve it
○ Evidence of utility○ Evidence of data disclosure prevention○ Consideration of “verification server” or “dual mode
release”
○ If approved, we will need to develop web-delivery infrastructure and procedures for release of data
45

Summary
○ The progress over the past year has been substantial○ This synthesis of data is much more difficult than it appears;
many decisions to be made and documented○ …difficult but exciting!
○ Other states are seeking our advice as they embark on similar projects (e.g. Rhode Island, New Jersey)
○ We hope to present our recommendations to the board in September for their consideration
46

Thank you!
○ Contributors:○ Daniel Bonnery, Yi Feng, Angie Henneberger, Tessa Johnson, Mark
Lachowicz, Bess Rose, Terry Shaw, Laura Stapleton, Mike Woolley ○ Email: [email protected]
○ Acknowledgement:○ This presentation was prepared by the Research Branch of the
Maryland Longitudinal Data System Center (MLDSC) as part of funding from the U.S. Department of Education (R372A150045)
○ The Research Branch would like to thank the entire staff of the MLDSC for their assistance with the work and the presentation.
47