an updated inhalation unit risk factor for arsenic and inorganic
TRANSCRIPT

An Updated Inhalation Unit Risk Factor for Arsenic and Inorganic Arsenic
Compounds
Neeraja (Neera) Erraguntla, Ph.D., DABT and
Roberta Grant, Ph.D.
1

What’s in a name?
Background
Goal: To protect the general population including children and pregnant women from Lung Cancer/Respiratory Cancer from chronic exposure to inorganic arsenic in ambient air. Problem Formulation focused on Inhalation
Pathway & Human Epidemiology Studies
3

Background
The Toxicology Division (TD) of TCEQ has developed Inhalation Screening values called Air Monitoring Comparison Values (AMCVs) for ambient air monitoring These values are similar to EPA’s Reference
Concentrations (RfC) and California’s Reference Exposure Levels (RELs)
4

TCEQ’s Process Using the Toxicity Factor Guidelines TCEQ developed a
Unit Risk Factor (URF) based on Updated and New Epidemiological data with Statistical Support provided by Sielken & Associates
Toxicology Excellence For Risk Assessment (TERA) organized a Peer-Review. Dr. David Gaylor, Dr. Kyle Steenland, & Dr. Kirk
Kitchin were the peer-reviewers. 2 Rounds of Public Comment period URFs are available on the Toxnet website http://toxnet.nlm.nih.gov/
5

TCEQ Arsenic Unit Risk Factor (URF) Erraguntla NK, Sielken RL Jr, Valdez-Flores C, Grant
RL. (2012)An updated inhalation unit risk factor for arsenic and inorganic arsenic compounds based on a combined analysis of epidemiology studies. Regul Toxicol Pharmacol 64(2):329-41.
Development Support Document (DSD) is available
http://www.tceq.state.tx.us/toxicology/dsd/final.html
6

Table 1. Summary of the 4 epidemiological studies of arsenic with adequate dose-response data for cancer risk assessment
7
Study location and exposure period
Most recent dose-response data
Last year of cohort follow-up
Number of workers Person-years (PY)
Cancer site SMRa (p-value) (Standard Mortality Ratios)
Range of cumulative arsenic exposure(mg/m3- yr)b
Tacoma, WAAsarco copper smelter(1940-64)
Enterline et al. (1995)
1986 2,802 84,916
Respiratory 209.7 (p<0.01)
<0.750 to 45+
Montana copper smelter (1938-1958)
Lubin et al. 2000; Lubin et al. 2008
1989 8,014 144,851c (restricted cohort) 256,850 (full cohort)
Respiratory 187 (P<0.001) (restricted cohort) 156 (p<0.001) (full cohort)
1 to 26.2+
Ronnskar, copper smelter (1928-1967)
Järup et al. (1989); Viren and Silvers (1994)
1981 3,916 127,189
Lung 372 (p<0.001)
<0.25 to 100+
United Kingdom tin smelter (1937-1991)
Jones et al. 2007
2001 1,462 35,942
Lung 161 (p<0.001)
<0.002 to 4.5+

Figure 1. Lung Cancer Mortality Rates versus
Incidence Ratesa
0
50
100
150
200
250
300
350
400
450
0 20 40 60 80
Lu
ng
Can
cers
per
100
,000
Age (years)
Mortality and Incidence Lung Cander Rate: US Population
IncidenceMortality
Lung cancer mortality is reasonably predictive of lung cancer incidence (i.e., five-year survival is only about 15% according to the American Cancer Society 2005)
8

Dose Metric & Dose-Response Assessment Occupational concentrations were converted to
environmental concentrations for the general population using standard procedures.
The dose metric used for the dose-response assessments is cumulative arsenic exposure (µg/m3-yr)
9

URFs Contd… The models used here are based on human
epidemiological studies and have been fit to a linear equation (linear multiplicative relative risk model) for use with the BEIR IV methodology (NRC 1988).
Air concentrations are solved iteratively with life-table analyses using the BEIR IV approach (NRC 1988). Air concentrations based on extra risk are calculated as opposed to added risk.
Mortality and survival rates are used to calculate air concentrations based on a lifetime exposure of 70 years, the default used by TCEQ for exposure analysis (TCEQ 2006).
10

Texas and US Specific Mortality Rates
Texas-specific mortality rates for 2001-2005 for lung cancer and Texas-specific survival rates for 2005 are used in the calculation of PODs and URFs.
Didn’t make much difference in final URF what mortality rates were used.
11
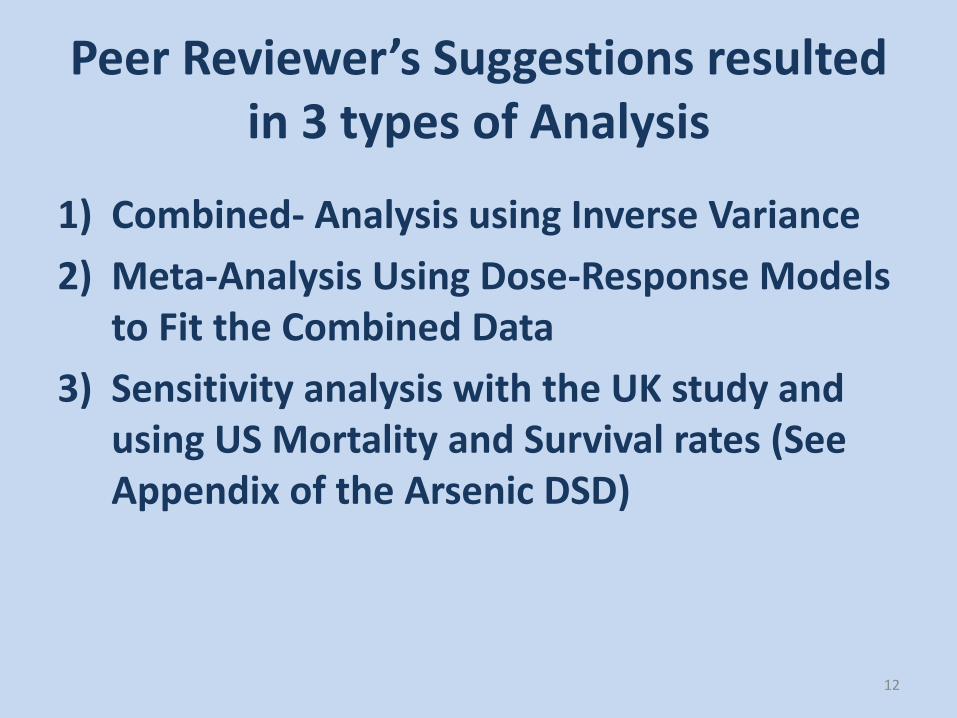
Peer Reviewer’s Suggestions resulted in 3 types of Analysis
1) Combined- Analysis using Inverse Variance 2) Meta-Analysis Using Dose-Response Models
to Fit the Combined Data 3) Sensitivity analysis with the UK study and
using US Mortality and Survival rates (See Appendix of the Arsenic DSD)
12

Combined- Analysis using Inverse Variance
The individual URF’s were weighted based on inverse variance The individual weighted URFs were then
combined together to calculate a final URF.
13

Preferred URFs and 10-5 Risk Air Concentrations Tacoma, Montana & Swedish Cohorts
rates
14

Final URF Final URF (Risk per µg⁄m3) = = [(URF1 x Weight1) + (URF2 x Weight2) + (URF3 x
Weight3)]/[Weight1 + Weight2 + Weight3] Where, Weighti = [1/SE(URFi)]2 for i=1, 2, and 3. = 1.5 E-04 per µg/m3 (Rounding to 2 significant
figures) The resulting air concentration at a 1 in 100,000
excess lung cancer risk is 0.067 µg/m3 (rounded to two significant figures).
15
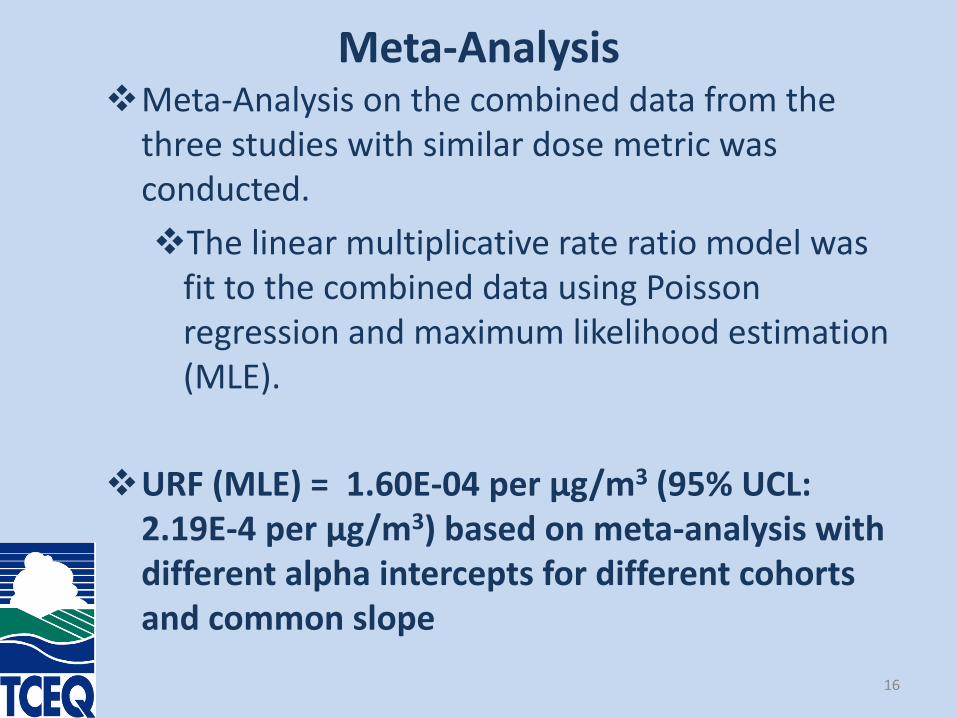
Meta-Analysis Meta-Analysis on the combined data from the
three studies with similar dose metric was conducted. The linear multiplicative rate ratio model was
fit to the combined data using Poisson regression and maximum likelihood estimation (MLE).
URF (MLE) = 1.60E-04 per µg/m3 (95% UCL:
2.19E-4 per μg/m3) based on meta-analysis with different alpha intercepts for different cohorts and common slope
16

Summary
Combined- Analysis Using Inverse Variance of the URFs to Weight Individual URFs:
URF (MLE) =1.5E-04 per µg/m3 (95 % UCL: 2.05 ×10⁻⁴ per μg/m3)
Meta-analysis URF (MLE) = 1.60E-04 per µg/m3 (95% UCL: 2.19E-4
per μg/m3)
17

Uncertainty Analysis Uncertainty in Dose-Response modeling due
to use of cumulative dose as the dose-metric Estimating risks for the general population
from occupational workers Co-exposures to other compounds
18

Questions [email protected] 512-239-2492
Sign Up for TCEQ Toxicology Related
Announcements [email protected]
19