analisa faktor-faktor perusahaan yang …repository.unand.ac.id/2210/1/draft_vol_1_no_1.doc · web...
TRANSCRIPT

Jurnal Bisnis&ManajemenJurnal Business & Manajemen Vol. 1, No.1, 2005
Analisa Faktor-Faktor Perusahaan Yang Mempengaruhi Kinerja Ekspor (Studi Kasus Perusahaan Ekspor Di Sumatera Barat)
Abrar AnasHerri
Syafruddin Karimi
Abstract
Globalization will bring opportunities for the companies to enter foreign market. However, to success in that kind of market it will depends on some factors. This study try to find out what factors basically contribute to the success of companies in West Sumatera in entering international market. Using twenty seven companies that involved in exporting activities in West Sumatera, the study found out that statistically internal and external factors do have contribute to the firms’s export performance. Moreover, this study among others conclude that government should play their roles in creating conducive atmosphere for the business sectors by reducing high cost economy. Limitations, suggestions and implication of this research are also discussed
Key words: international business, export performance, developing countries
I. PENDAHULUAN
Perdagangan luar negeri pada era globalisasi sekarang ini merupakan suatu keharusan yang tidak dapat dihindari oleh suatu negara, karena tanpa itu suatu negara tidak akan mampu untuk dapat bertahan. Perdagangan luar negeri merupakan suatu sarana dan stimulator penting bagi pertumbuhan ekonomi, yaitu: memperbesar kemampuan konsumsi suatu negara, meningkatkan output dunia dan memberikan jalan bagi pasaran produk-produk seluruh dunia, yang tanpa melalui perdagangan tidak akan mungkin dapat bagi negara-negara miskin untuk berkembang.
Peranan perdagangan luar negeri dalam proses pembangunan ekonomi, baik secara langsung maupun tidak langsung adalah dapat meningkatkan pendapatan, membuka kesempatan kerja, meningkatkan penghasilan devisa, mentransfer modal dan teknologi dari luar negeri, dan dapat mengembangkan industri baru didalam negeri atau usaha industrialisasi (Muchtar et al,1992). Disamping itu, perdagangan luar negeri juga menyebabkan terjadinya perubahan dari beberapa variabel dalam sektor ekonomi yang akan mendorong laju pertumbuhan ekonomi negara tersebut (Masrizal, 1993).
Salah satu bentuk perdagangan luar negeri tersebut adalah ekspor, dimana ekspor memainkan peranan penting dalam pertumbuhan ekonomi, terutama bagi negara-negara berkembang. Industri ekspor merupakan sektor yang menjadi landasan bagi perkembangan produktifitas, kemudian produktifitas ini berangsur-angsur menjalar keseluruh sektor ekonomi.
Perkembangan ekspor ini menjadi bagian utama dari substansi 2 perspektif ekonomi yakni, perspektif ekonomi makro, dimana kegiatan ekspor memungkinkan ekonomi nasional menjadi lebih baik untuk memperbesar cadangan valuta asing, menyediakan lapangan kerja, menciptakan backward dan forward linkages, dan akhirnya mencapai sebuah standar hidup yang lebih tinggi (Czinkota, Rivoli, Ronkainen,1992). Sedangkan dari perspektif mikro, kegiatan ekspor dapat memberikan sebuah competitive advantage bagi perusahaan individual, meningkatkan posisi financial perusahaan, meningkatkan kegunaan kapasitas, dan menaikkan standar teknologi (Terpstra dan Sarathy,1994).
Jurusan Manajemen Fakultas Ekonomi Universitas Andalas
1

Jurnal Bisnis&ManajemenJurnal Business & Manajemen Vol. 1, No.1, 2005
Dalam melakukan kegiatan ekspor ini, suatu perusahaan dapat melakukan transfer barang dan jasa melewati batas-batas negara dimanapun yang merupakan tujuan dari ekspor perusahaan tersebut. Kegiatan ekspor juga mempertimbangkan persoalan pasar luar negeri, terutama diantaranya perusahaan kecil dan menengah, yang akan mengurangi resiko bisnis, dimana komitmen terhadap sumber daya yang sedikit dan tingginya fleksibilitas aksi yang ditawarkan (Young et al, dalam Leonidou, 1996).
Penelitian ini dimaksudkan untuk menganalisis permasalahan yang dihadapi perusahaan ekspor di Sumatera Barat selama ini dalam mendorong perdagangan ekspornya. Dalam hal ini, penulis melakukan penelitian yang menganalisa tentang faktor-faktor perusahaan yang mempengaruhi kinerja ekspor Di Sumatera Barat.
1.2 Perumusan Masalah Permasalahan yang ingin dijawab dalam penelitian ini adalah:1. Faktor-faktor apa saja yang mempengaruhi kinerja ekspor
perusahaan di Sumatera Barat dalam melakukan ekspor.2. Bagaimanakah pengaruh masing-masing faktor tersebut terhadap
kinerja ekspor perusahaan yang ada di Sumatera Barat.
1.3 Tujuan Penelitian Berdasarkan dari permasalahan diatas, maka tujuan dari penelitian ini
adalah sebagai berikut:1. Melihat faktor yang mempengaruhi kinerja ekspor perusahaan di
Sumatera Barat.2. Mengetahui seberapa besar pengaruh masing-masing faktor tersebut
terhadap kinerja ekspor perusahaan di Sumatera Barat.
II. TINJAUAN PUSTAKA2.1 Konsep Perdagangan Internasional
Perdagangan internasional adalah kegiatan perdagangan barang-barang dan jasa, yang dilakukan oleh penduduk suatu negara dengan penduduk negara lain. Perdagangan luar negeri timbul karena pada hakekatnya tidak ada satupun negara didunia ini yang dapat menghasilkan semua barang dan jasa untuk memenuhi kebutuhan seluruh penduduknya (Deliarnov,1995).
Teori Keunggulan Absolut (Keunggulan Mutlak) dari Adam Smith mengemukakan bahwa setiap negara akan melakukan spesialisasi terhadap dan ekspor suatu jenis barang tertentu, dimana negara tersebut memiliki keunggulan absolute (absolute advantage), dimana tidak memproduksinya lebih efisien dibandingkan negara lain. Teori ini menekankan efisiensi dalam penggunaan inputnya, misalnya tenaga kerja, didalam proses produksi sangat menentukan keunggulan atau tingkat daya saingnya. Tingkat daya saing ini diukur berdasarkan nilai tenaga kerja yang sifatnya homogen (Boediono,1994).
Menurut Teori Keunggulan Komparatif dari Mill (dalam Boediono, 1994) beranggapan bahwa suatu negara akan mengkhususkan diri pada ekspor barang tertentu bila negara tersebut memiliki keunggulan komparatif (comparative advantage) terbesar, dan akan mengkhususkan diri pada impor barang bila negara tersebut memiliki kerugian komparatif (comparative disadvantage). Teori ini pada dasarnya menyatakan bahwa nilai suatu barang ditentukan oleh banyaknya tenaga kerja yang dicurahkan untuk memproduksi barang tersebut. Makin banyak yang dicurahkan untuk memproduksi suatu barang, makin mahal barang tersebut (Nopirin, 1991).
Sedangkan teori modern tentang perdagangan internasional menurut Hecksher dan Ohlin adalah faktor proporsi menyatakan bahwa perbedaan dalam opportunity cost suatu negara dengan negara lain karena adanya perbedaan faktor produksi yang dimilikinya (Boediono.1994). Teori ini menyatakan bahwa suatu negara akan mengekspor barang-barang yang lebih intensif dalam faktor-faktor yang berlebih. Oleh karena itu, teori ini menekankan peranan yang saling berkaitan antara bagian-bagian dimana faktor-faktor yang berbeda dalam produksi dapat
Jurusan Manajemen Fakultas Ekonomi Universitas Andalas
2
Jurnal Bisnis&ManajemenJurnal Business & Manajemen Vol. 1, No.1, 2005
diperoleh diberbagai negara dan proporsi-proporsi dimana mereka dipergunakan dalam memproduksi berbagai macam-macam barang (Hadis,1996).
Kemudian teori Hecksher-Ohlin ini disempurnakan oleh Samuelson yang banyak mempopulerkan dan mengembangkan teori ini. Sehingga lebih dikenal dengan teori perdagangan modern Hecksher-Ohlin-Samuelson (H-O-S). Teori ini menyatakan bahwa suatu negara akan mengekspor barang yang menggunakan faktor produksi yang relatif berlimpah secara intensif, dan mengimpor barang yang menggunakan faktor produksi secara intensif dimana barang tersebut relatif langka. Berdasarkan teori ini suatu negara akan mendapatkan manfaat dari perdagangan internasional yaitu meningkatnya kesejahteraan (welfare) penduduknya (Bachtiar,1990).
Sedangkan Porter (dalam Simamora, 2000) mengemukakan tesis bakunya yang dikenal dengan “Berlian Porter” bahwa terdapat empat atribut dari sebuah negara yang membentuk lingkungan dimana didalamnya perusahan-perusahaan lokal bersaing. Dia menyebutkan bahwa perusahaan-perusahaan besar kemungkinan untuk berjaya dalam industri atau segmen dimana berliannya paling menguntungkan. Keempat atribut tersebut saling mengukuhkan satu sama lain. Disamping itu, Porter dalam Simamora (2000), juga menunjuk ada dua variabel tambahan yang mempengaruhi berlian nasional yaitu perubahan dan pemerintah. Keempat atribut tersebut dapat mempromosikan atau menyumbat penciptaan keunggulan kompetitif (competitive advantage).
2.2 Faktor-faktor Yang Mempengaruhi Kinerja Ekspor
2.2.1 Faktor Eksternal2.2.1. 1 Kebijaksanaan Pemerintah
Perkembangan ekspor dipengaruhi strategi yang dipilih oleh negara berkembang dalam melaksanakan industrialisasi. Industri tidak dapat dikatakan menghambat perkembangan ekspor, tetapi strategi yang dipilih mempengaruhi pertumbuhan ekspor yang berdampak pula pada pertumbuhan ekonomi (Karimi, 1987). Bagi negara yang berorientasikan ekspor, ia akan mengekspor berdasarkan prinsip “comparative advantage” (keunggulan komperatif), yaitu mengatakan suatu negara akan cenderung untuk memproduksi lebih banyak barang-barang yang proses produksinya relatif lebih efisien dan mengekspornya pada gilirannya menukarkannya dengan barang-barang lain yang memiliki keunggulan relatif lebih sedikit (Lindert,1993).
Rintuh (1995) menjelaskan intervensi pemerintah dalam perekonomian dilakukan untuk meningkatkan pengeluaran pemerintah. Peranan pemerintah dalam meningkatkan ekspornya hendaknya mendapat respon dari pihak perusahaan. Keadaan ini dapat menggairahkan mereka untuk melakukan peningkatan usahanya untuk memasuki pasar internasional. Hal ini terlihat semenjak Indonesia merubah kebijakan perdagangan luar negerinya dari substitusi impor ke tahap promosi ekspor dengan menerbitkan sejumlah paket deregulasi.
Peran pemerintah dalam promosi ekspor merupakan modal awal untuk perusahaan memperkenalkan produknya untuk memasuki pasar internasional, sehingga kebijaksanaan ini bisa mendorong perusahaaan untuk meningkatkan kinerja ekspornya menjadi lebih baik. Disamping itu, kebijakan melalui proteksi terhadap industri baru lebih dominan, dimana pemerintah memaksa industri baru untuk menggunakan target ekspor untuk melakukan produksi dengan cepat pada tingkat harga dunia.
2.2.1.2 Sosial BudayaLingkungan sosial budaya perlu mendapat perhatian yang baik dari
perusahaan. Karena setiap negara memiliki kultur sosial budaya yang berbeda satu sama lainnya. Perbedaan ini hendaknya bisa dijadikan suatu peluang yang baik bagi perusahaan dalam menjual produknya. Dengan memahami kultur, nilai dan sikap, bahasa, kebiasaan dan tata krama negara tujuan dengan baik setidaknya memberikan nilai tambah bagi perusahaan dalam memperlancar produknya memasuki pasar negara tersebut (Simamora,2000).
Jurusan Manajemen Fakultas Ekonomi Universitas Andalas
3

Jurnal Bisnis&ManajemenJurnal Business & Manajemen Vol. 1, No.1, 2005
Dengan memahami sosial budaya negara yang menjadi tujuan ekspornya, pihak manajemen dapat mempermudah terjalinnya kerjasama dalam perdagangan kedua belah pihak. Hal yang paling mendasar yang perlu diperhatikan dalam memasuki pasar internasional ini adalah kemampuan bahasa yang dimiliki oleh manajer ( Schlegelmich, 1988) dimana memiliki kontribusi terhadap kinerja ekspor perusahaan, sehingga memudahkan terjalinnya komunikasi yang lancar. Sebab dengan menguasai bahasa dengan baik berarti mempelajari kultur dari mana bahasa itu berasal (Simamora, 2000).
2.2.1.3. PolitikDitinjau dari segi perspektif ekonomi industri, faktor politik dapat menjadi
penghalang dalam melakukan ekspor kesuatu negara. Begitu juga dengan undang-undang yang berlaku pada suatu negara dapat menjadi penghalang perdagangan internasional. Misalnya kebijakan tariff yang diterapkan oleh suatu negara akan meningkatkan harga jual suatu produk, sehingga sulit bersaing dengan produk lainnya (Baldauf etal,.2000). Untuk itu, perusahaan perlu hati-hati dalam memasuki pasar dalam suatu negara. Sebab, setiap negara memiliki kontrol terhadap perdagangan asing yang masuk kenegaranya.
Jurusan Manajemen Fakultas Ekonomi Universitas Andalas
4

Jurnal Bisnis&ManajemenJurnal Business & Manajemen Vol. 1, No.1, 2005
2.2. 2 Faktor InternalKarakteristik perusahaan lebih mudah dikontrol oleh pihak manajemen
perusahaan dibandingkan dengan faktor lingkungan. Karakteristik perusahaan akan menentukan keunggulan komparatif perusahaan. Karakteristik perusahaan terdiri dari ukuran perusahaan, pengalaman ekspor, kemampuan dalam perdagangan internasional, hal ini akan mempengaruhi kinerja ekspor perusahaan tersebut. Hasil studi menunjukan bahwa kinerja ekspor yang tinggi sangat dipengaruhi oleh karakteristik perusahaan (Baldauf et al. 2000).
2.2.2 1 Ukuran Perusahaan Ukuran perusahaan mempengaruhi alokasi sumber, kapasitas produksi dan
skala ekonomi, kesemuanya ini mempunyai hubungan positif dengan kinerja ekspor. Hal ini juga dapat dikatakan bahwa semakin besar ukuran perusahaan maka semakin tinggi kinerja ekspornya. Ukuran suatu perusahaan dapat dilihat dari jumlah tenaga kerjanya, siklus produk maupun total penjualan ekspornya. Menurut Schlegelmilch (1988) mengemukakan bahwa perusahaan yang memiliki tenaga kerja kurang dari 300 orang kurang berminat dalam melakukan kebijakan ekspor.
2.2.2 2 Pengalaman EksporDisamping ukuran perusahaan, kinerja ekspor juga ditentukan oleh
pengalaman perusahaan dalam kegiatan ekspor, dimana semakin berpengalaman suatu perusahaan dalam kegiatan ekspor maka kinerjanya juga semakin tinggi. Kotabe dan Cankota (Ross and Michael, 1999) menyatakan bahwa untuk meningkatkan pengalaman eksportir, tingkat keahlian mereka saja tidak mencukupi, makanya perlu dipertimbangkan lagi secara jernih keahlian khusus yang memerlukan survey bagi eksportir. Keahlian yang lebih penting adalah keahlian logistik dan manajemen umum pemasaran dan keuangan. Hal ini memungkinkan suatu perusahaan yang telah melakukan ekspor dalam jangka waktu yang lama dapat terus bertahan dalam pasar ekspor.
2.2.2. 3 Motif ProaktifMotif dari pihak manajemen sangat mempengaruhi kinerja ekspor suatu
perusahaan. Motif manajemen ini terdiri dari dua bagian, yaitu motif proaktif dan motif reaktif. Motif proaktif adalah rangsangan keterlibatan dalam aktivitas perdagangan internasional, hal ini disebabkan oleh besarnya permintaan terhadap produk ekspor di negara - negara industri. Biasanya produk yang diekspor merupakan komoditi primer.
2.2.2. 4 Motif ProaktifSedangkan motif reaktif adalah usaha perusahaan dalam merespon
perubahan lingkungan, misalnya laba, kekhasan produk, pajak dan biaya produksi (Baldauf, et al, 2000). Motif ini lebih dilandasi oleh kelebihan produksi perusahaan dimana melakukan perdagangan ekspor disebabkan oleh telah terpenuhinya pasar domestik. Menurut Pavord dan Bogard (Schlegelmilch,et al, 1988) menyimpulkan bahwa motif dasar untuk mengekspor adalah telah dipenuhinya pasar domestik dan menghasilkan perhatian manajer senior mengenai penurunan penjualan domestik. Sedangkan Simpson (Schlegelmilch,et al, 1988) menemukan bahwa tindakan melakukan ekspor merupakan sebagai alat untuk meningkatkan keuntungan ketika terjadinya permintaan domestik mengalami penurunan.
2.2.2 5 Strategi Efisiensi Biaya Menurut Porter (1994) mengemukakan ada tiga pilihan strategi generik yang
sering digunakan oleh suatu bisnis, yakni : differensial, cost leadership dan fokus. Strategi menekan biaya produksi (cost leadership) mengharuskan perusahaan untuk menekan biaya serendah mungkin dengan cara meningkatkan efisiensi operasi atau kualitas produk. Keunggulan biaya merupakan satu dari dua jenis keunggulan bersaing yang dimiliki oleh perusahaan. Perusahaan yang berorientasi ekspor dapat mencapai dan mempertahankan keseluruhan keunggulan biaya maka perusahaan
Jurusan Manajemen Fakultas Ekonomi Universitas Andalas
5

Jurnal Bisnis&ManajemenJurnal Business & Manajemen Vol. 1, No.1, 2005
akan memiliki kinerja diatas rata-rata dalam industrinya dengan asumsi dapat menguasai harga rata-rata industri (Porter,1994).
Menurut Porter (1994) agar suatu perusahaan lebih unggul dari para pesaingnya, maka perusahaan terus harus mampu memproduksi barang atau jasa sejenis dengan yang diproduksi oleh pesaingnya dengan harga lebih murah. Agar perusahaaan mampu menghasilkan barang atau jasa dengan biaya yang seminimum mungkin, maka haruslah perusahaan tersebut bekerja dengan optimal.
III. METODE PENELITIAN3.1 Kerangka Teori
Adapun yang menjadi fokus dari kajian ini dilihat dari dua faktor yaitu faktor eksternal dan internal. Faktor ekternal terdiri dari kebijaksanaan pemerintah, sosial budaya, dan politik. Sedangkan dari faktor internal terdiri dari ukuran perusahaan, pengalaman ekspor, motif proaktif, motif reaktif dan strategi efisiensi biaya. Kedua faktor ini merupakan independent dari penelitian ini. Untuk dependent variabelnya adalah kinerja perusahaan .
Keterkaitan antara faktor eksternal dan faktor internal perusahaan mempengaruhi kinerja ekspor yang terdapat di Sumatera Barat. Dari semua variabel dari faktor eksternal dan internal ini, perusahaan di Sumatera Barat dapat mengetahui faktor apa saja yang mempengaruhi kinerjanya selama ini. Hal ini bisa dilihat dari model penelitian dibawah ini.
Faktor Eksternal Faktor Internal
Sumber : Baldauf, Arthur, et al (2000)
3.2 Populasi dan SampelPopulasi dalam penelitian ini adalah perusahaan yang telah melakukan
perdagangan ekspor ke pasar internasional yang ada di Sumatera Barat, dimana jumlahnya sebanyak 50 perusahaan (Depperindag, 2003). Karena populasi yang akan diteliti relatif terbatas, maka peneliti mengambil seluruh populasi untuk diteliti sebagai objek penelitian.
3.3 Metode Pengumpulan Data Dalam penulisan ini digunakan data primer dan sekunder. Data primer
digunakan untuk membantu proses penelitian ini melalui media wawancara dengan pimpinan perusahaan yang mempengaruhi dalam proses pengambilan keputusan perusahaan. Kuisioner perusahaan secara garis besar terbagi atas 4 bagian. Bagian 1 meliputi Identitas perusahaan. Bagian 2 meliputi identitas Responden. Sedangkan bagian 3 meliputi pertanyaan tentang Faktor Ekaternal, yang terdiri dari Kebijaksanaan Pemerintah, Sosial Budaya, dan Politik. Bagian 4 merupakan pertanyaan terhadap Faktor Internal yangmeliputi : Ukuran Perusahaan, Pengalaman
Jurusan Manajemen Fakultas Ekonomi Universitas Andalas
Kebijaksanaan Pemerintah (X1)Karakteristik Perusahaan
Ukuran Perusahaan (X4)Pengalaman Ekspor (X5)Motif Proaktif (X6)Motif Reaktif (X7)
Strategi Efisiensi Biaya (X8)
Lingkungan:Sosial Budaya (X2)Politik (X3)
Kinerja Ekspor (Y)
6

Jurnal Bisnis&ManajemenJurnal Business & Manajemen Vol. 1, No.1, 2005
Ekspor, Motif proaktif, Motif Reaktif dan Strategi Efisiensi Biaya. Untuk Data sekunder didapat dengan mempelajari perdagangan ekspor perusahaan yang ada di Sumatera Barat. Disamping itu data yang relevan dalam membantu penelitian ini dari berbagai instansi, seperti Badan Pusat Statistik (BPS), Departemen Peridustrian dan Perdagangan, Gabungan Perusahaan Ekspor Indonesia (GPEI) Cabang Padang dan buku-buku, jurnal, tulisan dan karya ilmiah yang berhubungan dengan penelitian ini.
Jurusan Manajemen Fakultas Ekonomi Universitas Andalas
7

Jurnal Bisnis&ManajemenJurnal Business & Manajemen Vol. 1, No.1, 2005
3.4 HipotesisDari penelitian ini diajukan hipotesis sebagai berikut:“Adanya pengaruh faktor internal dan eksternal terhadap Kinerja ekspor
perusahaan di Sumatera Barat”
3.5 Pengukuran variabelPenelitian ini menggunakan metode pengukuran pengisian secara sendiri
dengan menggunakan beberapa pertanyaan secara langsung dengan responden dengan skala dummy. Sedangkan untuk pertanyaan motif proaktif, motif reaktif dan strategi menggunakan skala likert. Dimana responden diminta untuk memberi rangking tiap pertanyaan yang diajukan dari sangat tidak setuju (1) sampai dengan sangat Setuju (4).
3.6 Pembentukan ModelBerdasarkan pengujian hipotesis diatas, menggunakan model regresi
berganda sebagai berikut:Y = a + b1 X1 + b2 X2 + b3X3 + b4 X4 + b5X5 +b6 X6 + b7 X7 + b8 X8
Dimana :Y = Rasio Penjualan Ekspor / domestik Perusahaan ( dalam ton)X1 = Kebijakan Pemerintah.X2 = Sosial Budaya. X3 = PolitikX4 = Jumlah tenaga kerja (dalam orang)X5 = Lamanya Melakukan Perdagangan Ekspor (dalam tahun)X6 = Motif Proaktif.X7 = Motif ReaktifX8 = Efisiensi Biaya
3.4 Metode Analisa1. Pengujian secara Individu (Uji t)
Uji ini dilakukan untuk mengetahui pengaruh masing-masing variabel dependen secara individu terhadap variabel dependen
2. Pengujian Berganda (Uji F)Adapun uji ini dilakukan untuk mengetahui signifikansi pengaruh variabel-
variabel Independen secara bersama terhadap variabel Dependen.
IV HASIL ANALISIS4.1 Karakteristik Perusahaan
Hasil penelitian menunjukkan perusahaan berdiri sebagaian besar kurang dari 20 tahun, sisanya diatas 20 tahun. Hal ini memperlihatkan bahwa perusahaan sampel telah cukup lama berdiri. Bila dilihat dari pengalaman ekspornya, sebagian besar perusahaan telah berpengalaman dalam berkecimpung di pasar ekspor. Ini terlihat sebagian besar telah melakukan ekspor diatas 10 tahun. Dari jumlah tenaga kerja sebanyak 23 perusahaan memiliki tenaga kerja kurang dari 200 orang, sisanya 4 perusahaan memiliki jumlah tenaga kerja diatas 200 orang. Ini dapat disimpulkan bahwa perusahaan ekspor di Sumatera Barat masih tergolong relatif kecil. Ini tidaklah beralasan dengan melihat produk ekspor Sumatera Barat sendiri yang sebagain besar merupakan komoditi primer, seperti karet, sawit, damar, gambir, cassiavera, dan pinang. Sedangkan kalau dari penggunaan teknologi oleh perusahaan masih secara tradisonal dan belum maju, hanya beberapa perusahaaan yang sudah berskala besar saja yang memiliki teknologi yang modern.
4.2 Analisa Faktor-faktor Perusahaan Yang Mempengaruhi Kinerja EksporPengujian dengan regresi berganda ini dimaksudkan untuk mengetahui
gambaran kinerja ekspor terhadap faktor eksternal dan faktor internal yang mempengaruhi perusahaan dalam melakukan ekspor. Pengujian ini dilakukan dengan memakai uji t dan uji F yang nantinya akan terlihat gambaran hasil regresi baik secara parsial maupun simultan terhadap kinerja ekspor. Sehingga dari model
Jurusan Manajemen Fakultas Ekonomi Universitas Andalas
8

Jurnal Bisnis&ManajemenJurnal Business & Manajemen Vol. 1, No.1, 2005
diperoleh besarnya pengaruh masing-masing variabel baik eksternal maupun internal yang mempengaruhi kinerja ekspor di Sumatera Barat.
4.2.1 Uji T (Uji Parsial)Dari hasil pengujian regresi diperoleh hasil koefisien determinasinya (R²)
sebesar 0,561. Bila dilihat dari hasil korelasi tidak satupun variabel yang berada diatas hasil t hitung. Hal ini menunjukkan bahwa pengujian model regresi hanya dilakukan satu kali pengulangan saja. Ini mengindikasikan bahwa model regresi telah memenuhi syarat dimana tidak ada satupun variabel independent yang dikeluarkan dari model. Selanjutnya adalah melihat besarnya nilai t hitung terhadap t tabel. Adapun kriteria yang dikemukakan adalah apabila Ho diterima jika t hitung < t tabel. Sebaliknya Ho akan ditolak apabila t hitung > t tabel . Dalam analisa ini nilai t tabel ( α/2, n-2 ) (0,025, 25) adalah 2,060. Jika dilihat dari hasil t tabel dan dengan membandingkan dengan seluruh t hitung dari masing-masing variabel independent, ternyata lebih kecil dari pada nilai t tabel kecuali variabel politik (X3) yaitu sebesar 2,671 > 2,060. Ini menunjukkan bahwa hanya variabel politik saja yang mempengaruhi kinerja ekspor dari persamaan model regresi yang ada. Sedangkan variabel lain tidak mempengaruhi. Secara keseluruhan hasilnya dapat dilihat pada tabel dibawah ini.
Dari hasil hipotesis diatas menunjukkan bahwa secara partial variabel independen hanya satu variabel saja yang mempengaruhi yaitu variabel politik (X3). Sedangkan beberapa variabel seperti ukuran perusahaan (X4), pengalaman ekspor (X5), dan strategi efisiensi biaya (X8) memiliki nilai positif namun nilai t hitung yang diperoleh lebih kecil dari nilai t tabel. Untuk variabel kebijakan pemerintah (X1), sosial budaya (X2), motif proaktif (X6), motif Reaktif (X7) memiliki hasil yang negatif. Sehingga keempat variabel ini tidak mempengaruhi kinerja ekspor.
4.2.2 Uni F (Uji Simultan)Selanjutnya dapat dilakukan pengujian secara simultan atau uji F untuk
mengetahui apakah semua variabel independen mempunyai pengaruh yang sama terhadap variabel dependen (Algifari,2000). Yaitu dengan cara membandingkan antara nilai kritis F (F tabel ) dengan F hitung yang terdapat dalam tabel Analisis of Variance dari hasil perhitungan . Adapun kriteria yang digunakan adalah Ho diterima jika F hitung < F tabel dan apabila F hitung > F tabel hal ini berarti Ho ditolak. Sedangkan dalam analisis ini F hitungnya adalah sebesar 2,873 sementara nilai F tabel adalah 2,51 dengan α 0,05 dengan derajat kebebasan sebesar (8,18) maka dari analisis tersebut ternyata nilai F hitung lebih besar dari pada F tabel. Hal ini membuktikan bahwa seluruh variabel independent secara bersama-sama sangat mempengaruhi variabel dependen. Untuk lebih mengetahui seberapa besar seluruh variabel independent dapat menjelaskan variabel dependen dilihat dengan koefisien determinasi (R²). Dari hasil ini dapat dikatakan bahwa seluruh variabel independen dapat menjelaskan variabel dependen dimana sebesar 56,1% dan sisanya sebesar 43,9% dijelaskan oleh variabel lain diluar model ini.
Untuk lebih rincinya dapat dijelaskan pengaruh masing-masing variabel independent terhadap variabel dependen dapat dijelaskan sebagai berikut.
1. Kebijaksanaan PemerintahDari hasil penelitian diperoleh bahwa kebijakan pemerintah memiliki
pengaruh negatif dalam mempengaruhi kinerja ekspor perusahaan, dimana koefisien regresi kebijakan tersebut adalah sebesar -63,502. Ini berarti jika terjadi peningkatan kebijakan pemerintah dalam membantu peningkatan kinerja ekspor perusahaan yang ada di Sumatera Barat, maka akan mengalami penurunan kinerja sebesar -63,502. Hal ini menunjukkan bahwa apa yang telah dilakukan oleh pemerintah selama ini dalam meningkatkan kinerja ekspor perusahaan memiliki hubungan yang negatif. Dengan demikian kebijakan yang telah dilakukan oleh pemerintah selama ini tidak mempengaruhi kinerja ekspor perusahaan, bahkan cenderung menurunkan kinerja ekspor, meskipun secara uji partial kebijakan ini memiliki nilai t hitung yang tinggi, namun nilainya negatif. Bila dilihat dari hasil lapangan, ada beberapa perusahaan yang tidak pernah merasa mendapatkan
Jurusan Manajemen Fakultas Ekonomi Universitas Andalas
9

Jurnal Bisnis&ManajemenJurnal Business & Manajemen Vol. 1, No.1, 2005
bantuan dari pemerintah sampai saat ini. Disamping itu, banyak sekali terjadinya pungutan-pungutan liar yang sering perusahaan keluarkan selama ini selama proses produksi hingga penjualan ekspor. Selanjutnya, ada sebagian responden menganggap bahwa pelatihan-pelatihan yang dilakukan oleh pemerintah lebih merupakan suatu agenda rutin yang memberatkan perusahaan dimana terkadang proses pelatihan tersebut sepenuhnya dibiayai perusahaan. Sedangkan kebijakan pemerintah dalam memberikan pelatihan tidak memberi kontribusi yang berarti bagi peningkatan ekspor perusahaan. Hal inilah yang mungkin menyebabkan hasil t hitung variabel kebijakan pemerintah menjadi negatif atau tidak mempengaruhi kinerja ekspor perusahaan di Sumatera Barat.2. Sosial Budaya
Bila dilihat dari hasil regresi terhadap faktor sosial budaya ternyata memiliki hubungan yang negatif, dengan nilai t hitung hanya sebesar -0,613. Dari hasil koefisien regresi diperoleh bahwa peningkatan variabel sosial budaya akan mengurangi kinerja ekspor sebesar -31,787. Ini mengindikasikan bahwa pengaruh dari lingkungan sosial budaya tidaklah begitu berarti dalam kinerja ekspor perusahaan. Ini disebabkan lingkungan sosial budaya seperti kultur budaya negara tujuan, agama, dan penelitian terhadap sifat budaya dianggap bukanlah sebagai hal penting yang mempengaruhi kinerja ekspor dan terjalinnya perdagangan ekspor perusahaan selama ini. Sehingga variabel sosial budaya ini tidak mempengaruhi kinerja ekspor di Sumatera Barat.
3. Kondisi PolitikKondisi politik memiliki pengaruh positif bagi peningkatan kinerja ekspor
perusahaan. Hal ini bisa dilihat dari hasil pengujian empiris sebesar 146,392, dimana mempengaruhi kinerja ekspor. Hasil ini mengindikasikan bahwa jika keadaan stabil saja, maka kondisi politik meningkatkan kinerja ekspor perusahaan sebesar 146,392. Dengan demikian kondisi politik tidak dapat dipisahkan begitu saja pengaruhnya terhadap perdagangan ekspor suatu negara/ daerah, dimana stabil tidaknya kondisi politik membuat kinerja ekspor perusahaan bergantung padanya.
Dengan stabilnya kondisi politik akan berdampak pula dengan nilai tukar. Bila terjadi penurunan nilai mata uang dalam negeri dapat membuat terjadi penurunan harga bagi komoditi dalam negeri dalam pandangan konsumen luar negeri, begitu juga sebaliknya. Ini disebabkan ada sebagian perusahaan yang telah terikat kontrak dalam melakukan ekspor yang dimana sangat dipengaruhi oleh niali tukar.
4. Ukuran Perusahaan Dari hasil penelitian terdahulu diperoleh bahwa ukuran perusahaan sangat
mempengaruhi kinerja ekspornya. Semakin besar ukuran perusahaan akan semakin tinggi kinerja ekspornya, dimana penelitian Schlegelmilch (1988) mengemukakan bahwa perusahaan yang memiliki tenaga kerja kurang dari 300 orang kurang berminat dalam melakukan kebijakan ekspor.
Dari hasil penelitian diperoleh hubungan yang positif terhadap kinerja ekspor dimana koefisiennya sebesar 35,168.. Dari hasil tersebut, jika terjadi penambahan tenaga kerja sebanyak 1 orang, maka akan terjadi penambahan kinerja ekspor sebesar 35,168. Ini menunjukkan bahwa semakin besar jumlah tenaga kerja yang dimiliki maka akan semakin besar keinginan perusahaan untuk meningkatkan kinerja ekspornya. Hal ini dapat disimpulkan bahwa perusahaan yang memiliki tenaga kerja lebih besar cenderung untuk turut serta dalam perdagangan ekspor. Kemungkinan ini disebabkan bahwa perusahaan memandang perdagangan ekspor merupakan langkah yang tepat untuk dapat bersaing didalamnya dalam memasarkan produk perusahaaan dan dapat meningkatkan kinerja ekspornya dengan kapasitas tenaga kerja yang dimiliki.
5. Pengalaman EksporPengalaman ekspor disini dilihat dari lamanya suatu perusahaan
berkecimpung didalam perdagangan ekspor. Dari hasil pengolahan data diperoleh bahwa variabel pengalaman ekspor memiliki hubungan yang positif dengan
Jurusan Manajemen Fakultas Ekonomi Universitas Andalas
10

Jurnal Bisnis&ManajemenJurnal Business & Manajemen Vol. 1, No.1, 2005
koefisien sebesar 36,317. Jika terjadi penambahan pengalaman ekspor 1 tahun, maka terjadi peningkatan kinerja ekspor sebesar 36,317. Dengan demikian perusahaan yang telah lama berkecimpung dalam perdagangan ekspor di Sumatera Barat telah memiliki kinerja yang lebih tinggi dalam pasar internasional. Ini bisa dilihat dari jumlah tahun perusahaan melakukan perdagangan ekspor di Sumatera Barat rata-rata diatas 10 tahunan. Sehingga semakin berpengalaman ekspor suatu perusahaan akan semakin meningkatkan kinerka ekspornya.
6. Motif ProaktifMotif proaktif disini adalah suatu rangsangan atas keterlibatan aktivitas
perusahaan dalam melakukan ekspor yang dipengaruhi oleh adanya ketersediaan pasar. Hal inilah yang mendasari perusahaan untuk terjun kedalam pasar ekspor. Dari penelitian diperoleh hampir seluruh perusahaan yang ada di Sumatera Barat memilih motif ini dalam melakukan ekspornya. Ini disebabkan produk yang diekspor merupakan komoditi primer dan industri dimana permintaan terhadap produk tersebut besar dari negara-negara Eropa, Asia, dan Amerika. Sedangkan permintaan terhadap komoditi primer yang besar membuat perusahaan melakukan ekspor produk primer dan industrinya hampir secara keseluruhan dari total penjualan perusahaan.
Dari hasil pengujian diperoleh koefisien regresi sebesar -33,829. Ini menunjukkan bahwa setiap terjadi 1 kali peningkatan motif proaktif, maka akan mengurangai kinerja ekspor sebesar -33,829. Ini menunjukkan bahwa motif proaktif yang diambil oleh perusahaan dapat mempengaruhi pengurangan kinerja ekspor perusahaan. Hal ini terjadi sebagai akibat tidak terdapatnya industri pengolahan terhadap komoditi primer yang diekspor yang membuat terjadinya penurunan setiap terjadinya permintaan akan produk oleh pasar ekspor.
Disamping itu, ada kemungkinan disebabkan oleh rendahnya mutu produk ekspor tersebut yang disebabkan oleh teknologi yang sederhana dan tradisional, dan belum adanya standar yang baku terhadap mutu produk pada beberapa produk komoditi primer, seperti damar, gambir, dan cassiavera. Adanya ketergantungan terhadap siklus panen yang tidak menentu karena budi daya yang masih tradisional, yang nantinya berpengaruh terhadap kapasitas produksi produk.
7. Motif ReaktifMotif reaktif merupakan suatu respon yang diambil perusahaan dalam
meningkatkan kinerja ekspornya. Motif ini diambil sebagai langkah untuk melakukan penjualan produk sebagai akibat kelebihan produksi. Dari hasil di lapangan hanya beberapa perusahaan saja yang melakukan hal tersebut. Umumnya mereka memproduksi untuk memenuhi pasar domestik terlebih dahulu, kelebihan produksi yang membuat perusahaan melakukan ekspor.
Dari hasil pengujian didapat koefisien sebesar -49,289 yang menyatakan bahwa setiap penambahan satu kali saja akan mengakibatkan pengurangan kinerja ekspor sebesar -49,289. Ini memperlihatkan bahwa semakin banyak perusahaan yang melakukan motif ini akan semakin menurunkan kinerjanya. Dengan demikian kebijakan yang telah dilakukan perusahaan untuk memenuhi pasar domestik sudah benar, karena kebijakan itu memberikan keuntungan yang lebih besar bila dibandingkan dengan melakukan ekspor. Ini disebabkan komoditi yang diekspor oleh perusahaan memiliki pangsa pasar yang sigifikan di dalam negeri, dimana lebih efisien dan menguntungkan dalam melakukan penjualan bagi kebutuhan domestik dibandingkan ekspor.
8. Strategi Efisiensi BiayaStrategi efisiensi biaya merupakan salah satu dari tiga strategi yang ada
dan biasa dipergunakan oleh perusahaan dalam melaksanakan kinerjanya. Dengan melihat hasil koefisien sebesar 28,187, mengindikasikan bahwa setiap penggunaan strategi dalam melakukan perdagangan ekspor maka mengakibatkan terjadinya peningkatan kinerja sebesar 28,187. Ini memberikan gambaran bahwa strategi efisiensi biaya memiliki peran bagi peningkatan kinerja ekspor perusahaaan yang ada di Sumatera Barat. Perusahaan yang menggunakan strategi ini membuat
Jurusan Manajemen Fakultas Ekonomi Universitas Andalas
11

Jurnal Bisnis&ManajemenJurnal Business & Manajemen Vol. 1, No.1, 2005
peningkatan terhadap kinerja ekspor menjadi lebih baik lagi. Dengan demikian para eksportir di Sumatera Barat yang terdiri dari eksportir yang bersifat pengumpul dan produsen sudah menerapkan efisiensi biaya dalam pengoperasian perusahaan dalam menunjang kinerja ekspornya.
V. KESIMPULAN DAN REKOMENDASI5.1 Kesimpulan
Dari hasil penelitian yang telah dilakukan menggambarkan bahwa struktur ekspor Sumatera Barat mencerminkan masih didominasi oleh produk primer. Hal yang sama juga terjadi pada negara tujuan ekspor yang masih dominan ke negara Amerika disusul dengan masyarakat Eropa. Selama orientasi keluar yang diberlakukan dalam perdagangan Sumatera Barat, telah membawa perkembangan yang pesat terhadap kegiatan ekspor Sumatera Barat. Ini membuktikan bahwa perdagangan internasional memberikan kontribusi yang nyata bagi peningkatan pendapatan daerah / negara.
Dari hasil penelitian yang dilakukan terhadap perusahaan eksportir yang ada di Sumatera Barat berlawanan dari hasil-hasil penelitian terdahulu, dimana faktor eksternal menjadi prediktor yang kuat dalam mempengaruhi kinerja ekspor perusahaan yang ada di Sumatera Barat. Hal ini mungkin tidaklah beralasan, dimana dilihat dari sisi komoditi yang di ekspor sampel perusahaan di Sumatera Barat sebagian besar merupakan komoditi primer dan industri berskala kecil dan menegah. Sedangkan dalam penelitian terdahulu merupakan industri berskala menegah dan besar yang sudah merupakan industri maju, baik dalam skalanya maupun komoditi yang dihasilkan. Disamping itu, penelitian ini memiliki lingkup sampel yang sangat kecil yaitu propinsi, sedangkan penelitian terdahulu memiliki lingkup suatu negara. Ini juga mempengaruhi terjadinya perbedaaan kedua penelitian tersebut.
Dari hasil penelitian yang telah dilakukan, maka dapat ditarik suatu kesimpulan sebagai berikut:
1. Faktor Ekternal yang terdiri dari kebijakan Pemerintah dan Sosial budaya memiliki hubungan yang negatif terhadap kinerja ekspor perusahaan.Ini menunjukkan bahwa kebijaksanaan yang telah dilakukan oleh pemerintah dapat menghambat peningkatan kinerja ekspor perusahaan secara keseluruhan. Untuk sosial budaya, perbedaan kultur sosial, agama dan budaya setiap negara tidak mempengaruhi kinerja perusahaan dalam melakukan ekspor. Sedangkan untuk variabel Politik memiliki pengaruh dalam meningkatkan kinerja ekspor perusahaan. Ini membuktikan kestabilan politik dalam negeri ternyata mempengaruhi kinerja ekspor yang ada di Sumatera Barat. Sedangkan untuk faktor Internal yang terdiri dari Ukuran Perusahaan , Pengalaman Ekspor, Motif Proaktif, Motif Reaktif dan Strategi Efisensi biaya ternyata Motif Proaktif dan Motif Reaktif memiliki hubungan yang negatif atau tidak mempengaruhi kinerja ekspor. Sedangkan untuk Ukuran Perusahaan, Pengalaman ekspor dan Strategi efisiensi biaya memiliki hubungan yang positif. Dari ketiga variabel internal perusahaan ini hendaknya perlu mendapatkan perhatian dalam upaya memperbaiki kinerja ekspor kedepan. Hal ini dikarenakan potensi internal yang dimiliki oleh perusahaan saat ini merupakan modal bagi pengembangan dan peningkatan kinerja ekspor perusahaan yang ada di Sumatera Barat dalam memasuki perdagangan internasional ke depan.
2. Dari Hasil Pengolahan regresi diatas dengan menggunakan uji t (uji parsial) diperoleh bahwa faktor-faktor yang mempengaruhi secara signifikan adalah Politik. Secara keseluruhan dari faktor Eksternal dan Faktor Internal diatas ditemukan bahwa faktor politik yang stabil dapat meningkatkan kinerja ekspor perusahaan. Dengan demikian hanya faktor inilah yang mempengaruhi kinerja ekspor perusahaan di Sumatera Barat. Sedangkan bila dilihat dari uji F (uji simultan) ternyata seluruh faktor yang ada baik eksternal maupun internal mempengaruhi kinerja perusahaan dalam melakukan ekspor di Sumatera Barat. Ini membuktikan bahwa persamaan model regresi pada penelitian ini dengan penelitian sebelumnya memiliki kesamaan secara keseluruhan
Jurusan Manajemen Fakultas Ekonomi Universitas Andalas
12

Jurnal Bisnis&ManajemenJurnal Business & Manajemen Vol. 1, No.1, 2005
mempengaruhi kinerja ekspor perusahaan. Meskipun penelitian ini membuktikan bahwa faktor eksternal lebih kuat dalam mempengaruhi kinerja ekspor berlawanan dengan penelitian terdahulu menghasilkan faktor internal yang mempengaruhi kinerja ekspor, namun secara umum perusahaan ekspor yang ada di Sumatera Barat sudah termasuk dalam advanced fase, dimana perusahaan telah melakukan ekspor secara teratur dengan secara bertahap tetap eksis dalam mempeluas pasar ekspornya di pasar Internasional.
5.2 Rekomendasi Dari hasil penelitian empiris terdahulu menyimpulkan bahwa faktor internal
merupakan prediktor yang kuat dalam mendorong perusahaaan melakukan ekspor. Sedangkan faktor eksternal dianggap lemah dalam mempengaruhi perusahaan memasuki pasar internasional.
Dari hasil penelitian dilapangan di Sumatera Barat, ditemukan bahwa terjadi perubahan fenomena yang terbalik dimana faktor eksternal yang mempengaruhi kinerja perusahaan untuk melakukan ekspor. Dari temuan empiris dapat memperlihatkan bahwa kinerja ekspor perusahaan yang ada di Sumatera Barat di pengaruhi oleh faktor eksternal yaitu faktor politik. Untuk faktor internal perusahaan tidak ada yang mempengaruhinya. Ini disebabkan variabel internal memiliki hasil yang lebih kecil dari hasil uji partialnya terhadap kinerja ekspor. Hal ini memperlihatkan bahwa semakin baik kinerja ekspor perusahaan yang ada di Sumatera Barat tidak terlepas dari faktor politik.
Sedangkan kebijaksanaan pemerintah tidak berpengaruh dalam mendorong kinerja ekspor perusahaan. Hal ini disebabkan apa yang telah dilakukan oleh pemerintah seperti memberikan pelatihan dan workshop dianggap mengganggu kinerja ekspor perusahaan. Ini disebabkan dengan keikutsertaan tenaga kerja akan mengurangi efektifitas kinerja perusahaan dan hasil pelatihan tidak begitu berarti bagi peningkatan ekspor. Dan lagi, perusahaan ekspor yang ada di Sumatera Barat merupakan pengekspor komoditi primer dimana terjadinya ekspor disebabkan oleh peningkatan permintaaan terhadap produk yang begitu besar di pasar internasional untuk kebutuhan industri oleh negara-negara yang menjadi tujuan ekspor Sumatera Barat. selama ini.
Bila dilihat dari ukuran perusahaan, tenaga kerja yang dimiliki perusahaan relatif kecil dan sangat berbeda dari hasil penelitian terdahulu, dimana perusahaaan akan melakukan ekspor jika memiliki jumlah tenaga kerja melebihi 300 orang. Untuk kasus di Sumatera Barat, jumlah tenaga kerja yang dimiliki rata-rata dibawah 100 orang. Inilah fenomena yang terjadi dengan ukuran perusahaan ekspor Sumatera Barat bila dibandingkan dengan sampel penelitian terdahulu ternyata lebih kecil. Disamping itu, lingkup penelitian ini masih daerah / propinsi, sedangkan penelitian terdahulu merupakan negara dimana perusahaan ekspornya berskala industri dan maju.
Untuk pengalaman ekspor, perusahaan Sumatera Barat sudah memiliki pengalaman dimana sebagian telah berkecimpung dalam pasar ekspor diatas 10 tahun lebih. Dengan pengalaman tersebut, perusahaan di Sumatera Barat sudah memiliki basic yang kuat dalam memasuki pasar internasional. Disamping itu, dengan pengalaman ini setidaknya sudah memiliki pasar ekspor tetap dalam melakukan perdagangan ekspor dan dapat memudahkan dalam memperluas pasar ekspornya
Dari hasil penelitian ini dapat diperoleh suatu gambaran tentang perdagangan ekspor Sumatera Barat selama ini terutama dilihat dari sisi perusahaannya, dimana ekspor Sumatera Barat masih sangat bergantung pada komoditi primer dan industri. Disamping itu, kinerja ekspor terjadi sebagai akibat meningkatnya jumlah permintaan produk komoditi primer dari negara industri, dan hanya beberapa saja yang melakukan ekspor berdasarkan kelebihan pasar domestik.
Adapun implikasi kebijakan yang perlu dilaksanakan dari hasil temuan empiris ini bagi peningkatan perdagangan ekspor adalah :
1. Pemerintah perlu memikirkan langkah yang tepat dalam meningkatkan kinerja ekspor perusahaan selama ini dengan terus menjaga
Jurusan Manajemen Fakultas Ekonomi Universitas Andalas
13

Jurnal Bisnis&ManajemenJurnal Business & Manajemen Vol. 1, No.1, 2005
kestabilan kondisi politik di dalam negeri. Karena dengan stabilnya kondisi politik dalam negeri dapat meningkatkan kinerja ekspor Sumatera Barat menjadi lebih baik lagi. Disamping itu, dapat menciptakan iklim usaha yang kondusif bagi pengembangan dan perluasan ekspor Sumatera Barat kedepan.
2. Pemerintah hendaknya memperlancar sarana dan prasarana pelabuhan teluk bayur sebagai alat transportasi komoditas ekspor. Karna sejauh ini pelabuhan teluk bayur masih dirasakan kurang optimal sehingga banyak mendorong eksportir mengangkut komoditas ekspornya melalui pelabuhan lain yang berada diluar Sumatera Barat. Kelancaran pelabuhan akan mempercepat terbukanya pasar baru bagi pengembangan ekspor perusahaan. Hal ini akan berdampak pada peningkatan ekspor dan perluasan pasar ekspor Sumatera Barat kedepan.
3. Pemerintah perlu merobah pola kebijakan yang dilakukan selama ini, dimana bukan hanya ditujukan pada perusahaan saja sebagai pengekspor tetapi lebih terarah dan langsung kesasaran utama yaitu petani sebagai ujung tombak dari produksi komoditi primer Sumatera Barat. Dengan mendorong kegiatan penelitian dan pengembangan diberbagai bidang dapat meningkatkan dan mengembangkan komoditi primer khususnya yang selama ini menjadi komoditi andalan ekspor Sumatera Barat. Disamping itu perlu menyediakan sarana dan prasarana mendukung, dan memperkenalkan teknologi yang modern dan tepat guna dalam peningkatan mutu dan kapasitas produksi komoditi primer tersebut. Sehingga produk ekspor Sumatera Barat tidak hanya dapat bersaing dari mutu / kualitasnya tetapi juga memiliki harga yang kompetitif dengan negara lain yang merupakan pengekspor produk yang sama dalam pasar internasional.
Daftar PustakaAct, Zoltan J. et al, (2001), “Enterpreneurship, Globalization, and Public Policy”,
Journal of International Management 7.Addo, Edward and Robert Marshall, (2000), “Ghana’s Non Traditional Export Sector :
Expectations”, Achievements and Policy Issues, Geoforum 31hal 355-370.Algifari, (2000) “ Analisa regresi, Teori, Kasus dan Solusi” Edisi II, BPFE Yogyakarta.Anshori, Muslich (1999) “Kemampuan Produksi dan Kemampuan Pemasaran :
Pengaruhnya dalam Penentuan Strategi Bisnis pada Perusahaan Manufaktur Produsen Produk Konsumsi di Indonesia”, Majalah Ekonomi Tahun IX No 3.
Arif, Sirtua (1993) “ Metode Penelitian Ekonomi”, UI PRESS.Bachtiar, Nurzaman (1990) “Perkembangan Paling akhir Teori Perdagangan
Internasional : Pendekatan Empirik”, Kongres ISEI XI, Bandung.Baldauf, Arthur, et al (2000). “Examining Determinant of Export Performance in
Small Open Economies”, Journal of World Bussiness hal 61-79.Boediono, DR, (1994), “Ekonomi Internasional”, BPFE, Yogyakarta. Cadogan, John. W et, al (2003) “A measure of Market Orientation : Scale
Development and Cross-Cultural Validation”, Journal of International Bussiness Studies, Volume 30 hal689-707.
Cravens, (1996), “Pemasaran Strategis”, Erlangga, Jakarta.Dean,David L. et, al. (2000). “Revisiting Firm Karakteristic, Strategi and Export
Performance Relationship : A Survey of the Literature and an Investigation of New Zealand Small manufacturing Firms”, Industrial Marketing Management 29 hal 461-477.
Deliarnov, (1995), “Pengantar Ekonomi Makro”, Bina Grafika, Jakarta.Ditchtl, Erwin, et al (2003), “International Orientation as a Precondition for Export
Success”, Journal of Internasional Business Studies Volume 21 hal 23-40.Djoyohadikusumo, Sumitro. (1994), “Perkembangan dan Pemikiran Ekonomi Dasar
Teori Ekonomi Pertumbuhan dan Ekonomi Pembangunan”, LP3ES Jakarta.Edward, Sebastian, (2003), “Trade, Policy, and Income Distribution”, The American
Economic Review hal 205-210.Gomez, Luiz R dan Mejia,(1988), “The Role of Human Resoaurces Strategy in Export
Performance : A Longitudinal Study”. Strategic management Journal, Vol 9 hal 493-505.
Jurusan Manajemen Fakultas Ekonomi Universitas Andalas
14

Jurnal Bisnis&ManajemenJurnal Business & Manajemen Vol. 1, No.1, 2005
Hadis, Syafril (1996) “Ekonomi Internasional”, Rajawali Pers, Jakarta.Herri, (2000) “Strategi, Karakteristik Manajer, Budaya perusahaan dan Prestasi”,
Jurnal Ekonomi Bisnis dan Koperasi FE Univ Bung Hatta No 1 Hal 93-125.Jamal, Abdul dan Muhammad Nur, (2002). “Analisis Ekspor Kelapa Sawit Indonesia
1986-2000”, Jurnal Ekonomi dan Bisnis Vol 1.Jaurino, Mohammad Rizieq (2002) “Analisis Fungsi Produksi Perusahaan Manufaktur
Di Indonesia”, Jurnal Ekonomi dan Bisnis.Karimi, Syafruddin (1987), “Ekspor dan Pertumbuhan Ekonomi di Negara
berkembang”, Fakultas Ekonomi Universitas Andalas, Padang.Karimi,Syafruddin et al, (1989) “Strategi Industrialisasi Orientasi Ekspor Indonesia”,
Pusat Penelitian Universitas Andalas, Padang.Karimi, Syafruddin, (2003) “ Dampak Pembangunan Ekonomi Regional dan Global
terhadap Sumatera Barat “ Warta Perdagangan Luar Negeri Edisi 1.Kindleberger, Charles P dan Peter H. Lindert, (1986), “Ekonomi Internasional” Edisi
Ketujuh, Erlangga Jakarta.Kotler, Philip. (1999) “Manajemen Pemasaran “, Andi Yogyakarta.Kotler, Philip et al (1998) “Pemasaran Keunggulan Bangsa”, PT Prenhallindo
Jakarta.Kumcu, et,al. (1995). “Managerial Perceptions of the Adequacy of Export Incentive
Programs : Implications for Export-Led Economic Development Policy”, Journal of Bussiness Research hal 163-174.
Lee, Woo-Young and John. J Brasch, (1978), “The Adoption of Export as an Innovative Strategy”, Journal of Internasional Bussiness Studies, Volume 9 Hal 85-93.
Leonidou, Leonidas C. et,al (2002) “Marketing Strategy Determinants of Export Performance : A Meta Analysis”, Journal Of Bussiness Research 55 hal 51-67.
Leonidou, Leonidas C. and Constantine S. Katsikeas, (2003), “The Export Development Process: An Integrative Review of Empirical Models”, Journal of International Business studies, Vol 27 hal 517-551.
Lindert. Peter H, (1993) “Ekonomi Internasional”, Edisis kesembilan. Penterjemahan A. Subukti, Bumi Aksara, Jakarta.
Muchtar, Raisuddin et al, (1992) “Perdagangan Luar negeri Indonesia”, Universitas Andalas, Padang.
Masrizal, Drs (1993), “Ekspor, Dana Luar Negeri dan Pertumbuhan Ekonomi : Kasus Indonesia”, Pusat Penelitian Universitas Andalas, Padang.
Nopirin PhD, (1991) “Ekonomi Internasional Edisi 2”, BPFE Yogyakarta.Porter, M.E (1992) “Competitive Advantage, Greeting and Sustaining Superior
Performance”, terjemahan oleh Agus Dharma dkk, Erlangga, SurabayaReksohadiprodjo (1993), “Manajemen Strategi Edisi 2”, BPFE, Yogyakarta.Rintuh, C (1995) “Perekonomian Indonesia”, Edisi Pertama. Liberty, Yogyakarta.Ross, Donald G. and Michael P. Whalen (1999) “The Importance of Practical Export
Skills : The Evidence From Canadian Agribusiness”. Journal of International Business Studies Hal .
Salusu, Prof.Dr,MA (1996), “Pengambilan Keputusan Strategik”, Gramedia, Jakarta. Santoso, Singgih (2002), “ Buku Latihan SPSS Statistik Parametrik” PT Elex Media
Komputindo, Gramedia Jakarta.Schlegelmilch , B.B and J.N Crook, (1988), “Firm-Level Determinants of Export
Intensity”, Managerial and Decision Economics Vol 9 Hal 291-300.Simamora, Henry (2000) “Manajemen Pemasaran Internasional Jilid I”, Salemba
Empat, Jakarta.…………………….(2000) “Manajemen Pemasaran Internasional Jilid II”, Salemba
Empat, Jakarta.Sjahrir,(1993). “Refleksi Perekonomian Indonesia”, Gramedia, JakartaSukirno. S, (1997). “Pengantar Teori Mikroekonomi”, PT Raja Grafindo Persada,
Jakarta.Supranto, J (1986), “Riset Pengembangan Untuk Pengembangan Ekspor”, Erlangga,
Jakarta.Swastha, Basu (1993), “Pengantar Bisnis Modern”. Liberty, Yogyakarta.………………. (1981), “Lingkungan Perusahaan”, Liberty, Yogyakarta.
Jurusan Manajemen Fakultas Ekonomi Universitas Andalas
15

Jurnal Bisnis&ManajemenJurnal Business & Manajemen Vol. 1, No.1, 2005
Tambunan, Tulus. (2000), “Perdagangan Internasional dan Neraca Pembayaran Teori dan Temuan Empiris”, LP3ES, Jakarta.
………………….(2000) “Transformasi Ekonomi Di Indonesia Teori dan Temuan Empiris”, Salemba Empat, Jakarta.
Todaro, Michael. P (2000) “Pembangunan Ekonomi di Dunia Ketiga Edisi Ketujuh”, Erlangga, Jakarta.
Weidersheim-Paul, Finn et al, (1978) ”Pre-Export Activity : The First Step in Internationalization” , Journal of International Business Studies, Vol 9 Hal 47-58.
Westphal, Larry. E. (1988), “Industrial Polycy in an Export-Propelled Economy : Lesson From South Korea’s Experience” , The Journal of Economic Perspektives, Volume 4 Hal 41-59.
Wild J.John, Kenneth, and Jerry (2000), “Internasional Bussiness ab Integrated Approach” Prentice Hall.
Jurusan Manajemen Fakultas Ekonomi Universitas Andalas
16

Jurnal Bisnis&ManajemenJurnal Business & Manajemen Vol. 1, No.1, 2005
Predictability of Returns:Can Momentum and Contrarian Strategies Work
In The Malaysia Stock Exchange?
Tafdil Husni 1
Zamri Ahmad 2
Abstract
Using daily data on the Main Board of the Malaysian Bourse (formerly Kuala Lumpur Stock Exchange / KLSE) for the period 1988 through 2002 and following the strategy quite similar to Jegadeesh and Titman (1993), we find that only one strategy, 3-month ranking, 3-month testing period, has statistically significant abnormal returns for momentum strategies. If we construct shorter ranking and test periods, we found that the momentum payoff still work for 2-month ranking and 2 month testing strategy. Whereas, the contrarian strategy appears to work for 1-month ranking, 1-month testing period. Both results are statistically significant at 5% level. These findings are in line with prior studies, which found that the profitability of momentum is achievable in medium term, whereas contrarian strategy works in short term.
Keyword: stock return, momentum strategy
INTRODUCTIONAn extensive body of finance literature has been written on the issue of
whether there is investment strategies based on stock price data. There are two investment strategies based on historical return that has been recognized. First, there is the contrarian strategy, which arranges stocks on their performance over some previous period and suggests buying past losers and selling past winners. This strategy is based on the premise that market overreacts to information. Second, momentum strategy makes an equivalent ranking but recommend buying past winners and selling past losers. Momentum strategy is based on the premise that market underreacts to information. Both strategies normally maintain prior ranking periods and subsequent investment holding periods of similar length. What keeps contrarian and momentum strategies from being mutually inconsistent is that the former is based on long-term ranking and short term periods, usually of three years or more for long term and of several days to several weeks for the short term, while the latter are based on medium-term ranking periods, usually between three and twelve months.
The profitability of momentum and contrarian strategies has been investigated in many equity markets. For example, in developed market, Ahmet and Nurset (1999) examine abnormal profits of long- term contrarian strategies in the stock markets of seven non-US industrialized countries. In Japan stock market, Rosita et al. (1995) investigate abnormal profit of short-term contrarian strategies. The same result also found by Hameed and Ting (2000) in the Malaysia stock markets. Rouwenhorst (1999) investigate the profitability of momentum strategies in six (out of 20) emerging equity markets. Hameed and Yuanto (1999) find that a momentum strategy yields small but statistically significant profits in six Asian stock markets. Schiereck et al. (1999) examine profitability of momentum and contrarian strategies in the Germany equity market.
In this paper, we investigate the predictability of return in short and medium term in the Malaysia Stock Exchange. This research is different from prior studies in the Malaysian Bourse such as Hameed and Ting (2000) and Ahmad and Hussain (2001). In term of contrarian investment, first, we use daily price instead of weekly 1 Tafdil H. is a lecturer at Faculty of Economics, Andalas University, Padang, Indonesia2 Dr. Zamri Ahmad is a lecturer at the School of Management, Universiti Sains Malaysia
Jurusan Manajemen Fakultas Ekonomi Universitas Andalas
17

Jurnal Bisnis&ManajemenJurnal Business & Manajemen Vol. 1, No.1, 2005
price that used by Hameed and Ting. Second, we examine the profitability of contrarian strategy in short-term rather long term that has been investigated by Ahmad and Hussain. Third, this is the first study that examines the profitability of both contrarian and momentum investment that simultaneously occur to the same assets in stock returns in the Malaysia Stock Exchange.LITERATURE REVIEW
Many studies have documented the long-term and short-term contrarian strategies, for the UK, the US and other countries as well. One of the most important early test of study is by DeBondt and Thaler (1985) in US. They based on research in experimental psychology suggesting that most people overreact to unexpected and dramatic events, and tested whether the same thing occurs in the stock market. Their study points out that portfolio of prior extreme “losers” dramatically outperform prior extreme “winners” even if the latter are more risky. In other words, the work of DeBondt and Thaler find a long-horizon return reversal. Overreaction phenomenon in the financial market, who observed by DeBond and Thaler; 1985, can be explained by the finding in psychology reported by Kahnemen and Tversky (1973) that people tend to make prediction using behavioral heuristic known as representativeness rather than Bayes’ rule. This finding in psychology infers that investors in stock market overreact and make extreme prediction based on extrapolation of recent trends. On the other hand the underreaction shows that stock prices underreact to information that is incorporated gradually into prices
Profit generated by contrarian strategies are seen not only in the US market, but also in stock markets across the continent i.e.; UK, Canada, and Australian; see Clare and Thomas (1995), Mun et al (1999), and Gaunt (2000) etc. There are also some studies that investigate the overreaction hypothesis in the securities of Pacific-Rim market like Hong Kong and Malaysia. For example, Kwok-Wah Fung (1999) supports the overreaction hypothesis, using the monthly returns (capital gains and dividends) of all 33 constituent stocks in the HIS in Hong Kong from January 1980 to December 1993, and finds that the losers portfolio, on average, outperform the winner portfolio by 9.9% 1 year after the formation periods. Ahmad and Hussein (2001) investigate overreaction in Malaysian (KLSE) returns during 1986-96, and also observe several factors which have been linked with the overreaction effect: firm size, time-varying risk, and seasonalities with regard to Chinese New Year Effect. They find that the result is consistent with the overreaction hypothesis that stocks in the best /worst performing decile experience a reversal of fortune in the following three years.
Some evidences of overreaction are also documented in the short term. For example, Howe (1986) using daily stocks returns data from the University of Chicago’s CRSP tape, which were converted to weekly data, finds that the evidence is strongly consistent with the overreaction hypothesis. Specifically, stocks that experience large positive returns (good news) performed poorly in the 50-week period following that event, with returns averaging about 30 % below the market. Zarowin (1989) examined evidence regarding the existence of stock market overreaction in the short-run. He ranks common stocks according to their performance during a given month, and find that in subsequent month a portfolio the past month’s losers outperforms a portfolio of the past month’s winners by 2.5 per cent., regardless of which group is smaller.
Using the weekly share price data were obtained from datastream for 47 individual shares registered on the Kuala Lumpur Stock Exchange over the period January 1990 to December 1994, Arifin and Power (1996) find that some evidence of short-run overreaction in share price, particularly in the firs two weeks after portfolio formation date. The trading strategy of buying a portfolio of underperforming shares and selling a portfolio of outperforming shares earns a significant profit.
Conrad and Gultekin and Kaul (1997) reject the evidence of short-term overreaction. Based on their bid-return analysis for the 1990-1991 NYSE/AMEX sample reveals that most, but not all, of the profit from price reversal can be explained by the bid-ask bounce. Given some evidence of overreaction for NYSE/AMEX firms, they find that very low levels of transaction cost (typically less
Jurusan Manajemen Fakultas Ekonomi Universitas Andalas
18

Jurnal Bisnis&ManajemenJurnal Business & Manajemen Vol. 1, No.1, 2005
than 20%) eliminate all profits to strategies that attempt to benefit from any potential overreaction
Bowmen and Iverson (1998) examine the behavior of stock prices in New Zealand after a large weekly change in price and found that the stock market significantly overreact, especially in the case of price declines and significant reversal is confined to the following week They observed the result is affected by risk, size, seasonal and bid-ask bounce.Schnusenberg and Madura (2001) investigate the short-term over-or underraction of six U.S. stock market indexes:The Dow, the S&P 500, the Nasdaq, NYSE, the Russel, and the Wilshire 5000 index. They find evidence of a one-day stock market underreaction to highly positive and negative news release using two methods to predict returns for these indexes on the following day. Over a sixty-day interval, they reveal strong evidence of a stock market underreaction for winner but an overreaction for losers.
Subsequent studies of contrarian strategies have sought explanations for return reversal. The followings are some of the explanation put forward in the literature: (i) overreaction (DeBondt and Thaler 1985, 1987 (ii) change in risk (Chan 1988, Ball and Kothari 1989); (iii) seasonality effects (Chopra, Lakanishok & Ritter 1992); (iv) the size effect (Zarowin 1990, Clare & Thomas 1995, Dissainake 1997); market-microstructure biases (Conrad and Kaul 1993); and (v) behavioral aspects (Barberis, Shleifer and Vishny 1998, Daniel and Titman 2001).
In contrast, Jegadeesh & Titman (1993) is among the first study to test the momentum strategy. They document significant positive returns when stocks are bought and sold based on short-to medium-run historical returns. Using a U.S. sample of NYSE / AMEX stocks over the period from 1965 to 1989, portfolios based on stocks’ relative strength were constructed. At the end of each month, all stocks with a return history of at least 12 months were ranked into deciles based on their past J-month return ( J equals 3,6,9, or 12) and assigned to one of ten relative strength portfolios. Portfolio1 consisted of the past lowest performing stocks, or (losers), while portfolio 10 was made up by the past best performing stocks or (winner). These portfolios are equally weighted at formation, and held for K subsequent months (K = 3, 6, 9 or 12 months). Jegadeesh & Titman found that the 6 x 6 momentum strategy generates returns of about 1% per month, while their most profitable, 12 x 3 momentum strategy generates returns of as much as 1.49% per month. They documented that past winners on average continue to outperform past losers, so that there was momentum in stock prices.
The evidence of momentum in stock prices over the medium terms is well accepted and supported for the developed market in the US. For instance, see Chan, Jegadeesh and Lakonishik (1996, 1999), Maskowit and Grinblat (1999), Hong and Stein (1999), O’Neal (2000), Lewellen (2002), Chordia and Shivakumar (2002), Cooper et al (2004) etc. Similar result are found on other stock markets Outside the US as well; see for example, Schiereck, Debondt, and Weber (1999), Rouwenshort (1998, 1999), Liu et al (1999), Chan, Hameed and Tong (2000), Glaser and Weber (2001), etc. However, these papers do not cover the same period of time and the methodologies used to detect momentum are not uniformed.
From the previous studies of momentum, the source of the profit and the interpretation of the evidence are also widely debated. The behaviorist argues that momentum profits provide strong evidence of market inefficiency, and are due to stock prices’ under-reaction to information, investors’ herding behavior, etc. On the other hand, market efficiency supporters argue that either risk (cross-sectional and/or time-varying expected returns) is the main source of momentum profits or that abnormal return is a product of data mining.
These work on contrarian and momentum effect, stand in stark contras to well-accepted doctrine of the efficient market hypothesis. Under the null hypothesis of weak-form market efficiency, the performance of portfolios of stocks should be independent of past returns. However, these researches have shown that assets returns do exhibit some form of positive autocorrelation in the medium; but mean-revert over short and longer horizons.
Jurusan Manajemen Fakultas Ekonomi Universitas Andalas
19

Jurnal Bisnis&ManajemenJurnal Business & Manajemen Vol. 1, No.1, 2005
DATA AND METHODOLOGYDaily price are obtained from Pusat Komputer Professional, a company
based in Pahang, Malaysia. Adjustment is made to take account into of stock split, rights, and dividend. All companies selected for analysis are from the main board and the period covered in January 1988 to December 2002. The numbers of companies will increase every year as we add new companies in the sample as they get listed.
To analyze the profitability of price momentum strategies and contrarian, we employ the methodology used by Jegadesh and Titman (1993). We consider ranking periods of r = 3, 6, 9 and 12 months and subsequent holding periods of h = 3, 6, 9 and 12 months, giving a total of 16 r x h momentum strategies and then we continue to examine in short term of 2 and 1 months. Unlike Jegadeesh and Titman’s study, where portfolios involve overlapping periods, this study examines non-overlapping periods. This modification can at least reduce the bias arising form double counting resulting from the use of overlapping periods. In addition, Pan and Hsueh (2001) found that the International momentum effect appears to disappear when the analysis is conducted using non overlapping data. So, they conclude that the result is simply an empirical illusion due to the use of overlapping data.The profits of momentum and contrarian strategies are calculated for the returns on buy-and hold method for both winner and loser portfolios which stocks are ranked based on their returns over the past 1, 2 and 3, 6, 9 and 12 months, labeled here as the ranking period (RP). Stocks are divided into 10 equal-weighted portfolios. P1 represents the loser portfolio with the lowest returns, and P10 represents the winner portfolio with the highest returns. We prefer buy-hold returns instead of cumulative abnormal returns because they accurately reflect the actual return that investors receive from their investment, see Barber and Lyon (1997), Kothari and Warner (1997).
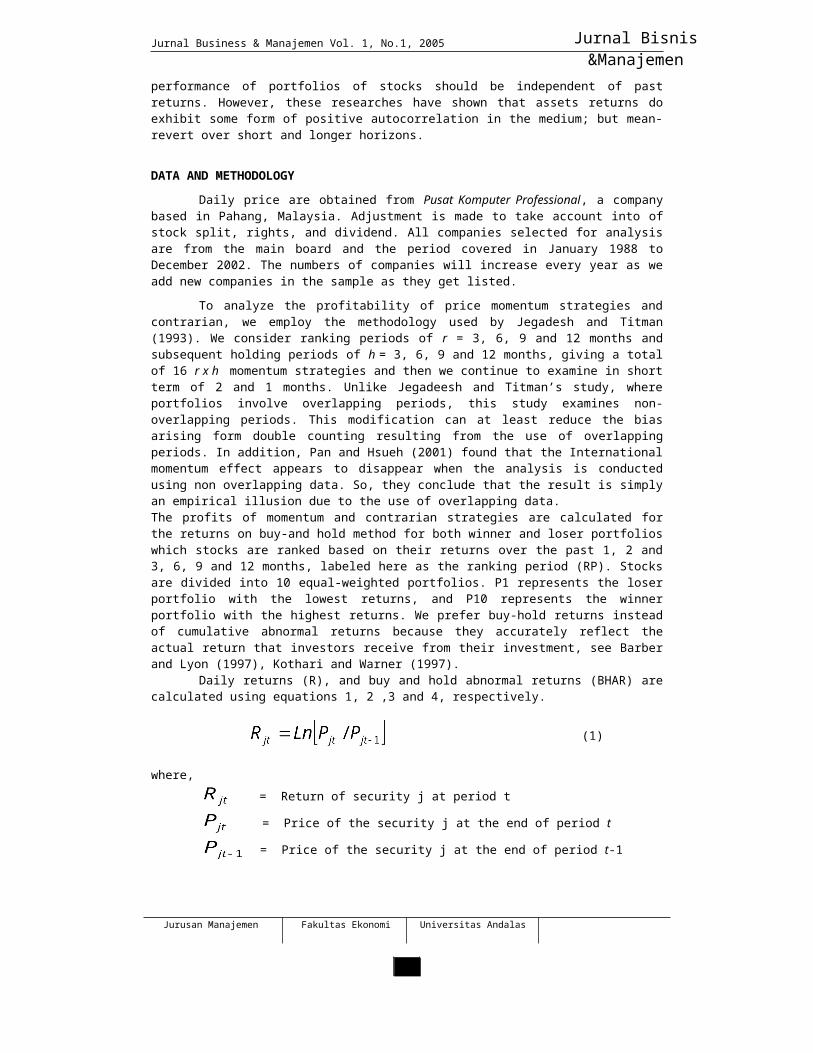
Daily returns (R), and buy and hold abnormal returns (BHAR) are calculated using equations 1, 2 ,3 and 4, respectively.
(1)
where, = Return of security j at period t = Price of the security j at the end of period t
= Price of the security j at the end of period t-1
(2)
where,
= Buy and hold abnormal returns of security j = The return of market, using the KLSE CI returns as the proxy
T = The number of day in the 1, 2, 3, 6, 9, 12 month periods
In the following 1, 2, 3, 6, 9 and 12 months, described here as the test period (TP), the for all stocks in the winner and loser portfolios are calculated. The mean of these represent the cumulative buy and hold abnormal return for an equal weighted portfolio is measured as
Jurusan Manajemen Fakultas Ekonomi Universitas Andalas
20

Jurnal Bisnis&ManajemenJurnal Business & Manajemen Vol. 1, No.1, 2005
(3)
Where is the cumulative buy and hold abnormal return in month t of test period z for portfolio p, and N is the number of stocks in each portfolio.
This procedure is replicated for each non-overlapping periods. The portfolio are then averaged across the all test period:
(4)
where is the average BHAR across the z test period for each portfolio, p, across each month, t, of the test period.
The final step of the trading rule is to determine the difference between returns on the winner portfolios and the loser portfolios that will generate significant abnormal profit. If momentum strategy works, then we will find that in the test period:
.If contrarian strategy works, then we will find that in the test period:
,where is the winner portfolios and is the loser portfolios.
RESULTSTable 1 shows the average returns of winners and losers in the rank periods
and also the average returns of winner minus loser (W-L) portfolio for the r x h strategies.In the test period, we find that there are 3 out of 16 trading strategies where momentum returns are positive. All of them come from 3-month ranking. However, only one of them appears to be significant at 5 % level.
Scanning through the table in the test period, we find that the highest profit is for 3-month ranking periods, 3-month holding periods (3x3). It shows that the performances of past winners remain better in the future periods and the performance of past losers continues under-perform in the next periods. It means that the average difference between P10 (top- winner) and P1 (top-loser) portfolio returns during the 15-year period is 0.0466, which is statistically different from zero at 5%, level, as well as their performance is above the market.The underreaction hypothesis suggests that the strategy of buying the winners portfolio and selling the losers portfolio can earn profits. This is what table 1 shows i.e. the mean difference between winner and losers portfolio in the test periods. If we look at the rest of strategies (beyond 3-month ranking) that gives the result of momentum are negative. It finds that contrary to the hypothesis, the results generally show otherwise. However, as indicated by the t-statistics, these negative abnormal returns are not significant. Therefore, a strategy of buying the winner and selling the losers will not give investor any profit. In fact, this strategy will lose investor money.
As there is only one strategy that has a significantly positive of momentum profit in Table 1, we try to examine shorter period i.e. one and two months. Table 2 shows that the profitability of momentum still appears to work for 2-month ranking
Jurusan Manajemen Fakultas Ekonomi Universitas Andalas
21

Jurnal Bisnis&ManajemenJurnal Business & Manajemen Vol. 1, No.1, 2005
period, 2-month testing period and earn abnormal return a 2.1 % two-month, which is statistically different from zero at level 5%. It means past winners still outperformed past losers. On the other hand, for1-month ranking, 1-month testing period, we found that the prior loser portfolios significantly outperformed the prior winner in the holding period, which yield abnormal return a 1.40 % one-month. This means that there is the overreaction phenomenon in the stocks. The overreaction suggests contrarian strategy, which is long positions in past worst performing, stocks (losers) and short positions in past best performing stocks (winner) can yield abnormal returns.
Our result is in line with previous studies, which found that the momentum strategy is in medium term and contrarian strategy in short-term.
Jurusan Manajemen Fakultas Ekonomi Universitas Andalas
22

Jurnal Bisnis&ManajemenJurnal Business & Manajemen Vol. 1, No.1, 2005
Table 1. Returns of Momentum Strategy
R Portfolio Return Strategy Portfolio Observation Return
Winner (W) 0.405 W – L 0.0466Loser (L) -0.2671 t-stat (2.052)*
W – L 0.0389t-stat -1.079W – L 0.0145t-stat -0.503W – L 0.0025t-stat -0.137
Winner 0.614 W – L -0.028Loser -0.3673 t-stat (-1.134)
W – L -0.011t-stat (-0.478)W – L -0.028t-stat (-1.031)W – L -0.049t-stat (-1.158)
Winner (W) 0.8494 W – L -0.037Loser (L)) -0.4527 t-stat (-1.008)
W – L -0.022t-stat (-0.491)W – L -0.03t-stat (-0.619)W – L -0.041t-stat (-0.595)
Winner (W) 1.0354 W – L -0.046Loser (L) -0.5231 t-stat (-1.201)
W – L -0.035t-stat (-0.106)W – L -0.04t-stat (-0.965)W – L -0.13t-stat (-1.468)
12 12 x 3 14
12 x 6 14
12 x 9 14
12 x 12 13
9 9 x 3 19
9 x 6 19
9 x 9 18
9 x 12 18
55
6 6 x 3 29
6 x 6 28
6 x 9 28
6 x 12 27
Rank Period Test Period
3 3 x 3 58
3 x 6 57
3 x 9 56
3 x 12
Notes:The winner (W), Loser (L), and momentum (W-L) portfolios are constructed based on the past r month stock returns. The strategy divides all stocks into two groups, i.e. winners and losers, depending on whether the past r month cumulative returns of individual stocks are greater than the past r month returns of the market. For each r x h strategy and portfolio, the table reports average h month holding period returns (return) over the sample period and t statistics. The t-statistics for W-L indicate whether the returns from momentum strategy of buying past winner and selling past loser are significantly different from zero. The sample period is January 1988 to October 2002. An asterisk * indicates that the t-value is significant at 5% level.
Table 2. Profitability of contrarian and momentum strategies
Ranking Period
Testing PortfolioPeriod
Observ.
1 1 WinnerLoserLoser-Winnert-statistic
-0.0103 0.0036 0.0139(2.350)*
177
2 2 WinnerLoserWinner-Losert-statistic
0.0038-0.0172 0.0210 (2.081)*
88
* Significant at 5% level
Jurusan Manajemen Fakultas Ekonomi Universitas Andalas
23
Jurnal Bisnis&ManajemenJurnal Business & Manajemen Vol. 1, No.1, 2005
CONCLUSIONThe success of momentum and contrarian investment strategies above is a
direct test of the weak form efficient market hypothesis. It could give a serious challenge to efficient market hypothesis if we assume that transaction costs do not influence the arbitrage portfolios. These strategies may imply that the markets are not efficient as future price are predictable. The weak form efficiency reveals that an investor cannot use past security price information to consistently earn a portfolio return in excess of returns that is in proper proportion with the portfolio risk. The evidence of this study shows that past winners will perform better in the next period, while past losers will perform worse in the future period for the momentum strategy, but for the momentum strategy vice versa.
The debate on the source of the profit and the interpretation of momentum and contrarian are still ongoing. One of theories that explain momentum and contrarian effect is behavioral or non-risk based. Another theory is advanced by market efficient supporter who argue that risk is the main source of momentum profits. The others possible explanations for contrarian strategy are size effect, market-microstructure, etc. In order to investigate what factors drive and the magnitude of momentum and contrarian, further research can look into these two possibilities i.e. non-risk based such as size, book-to market and turnover and risk based, etc.
REFERENCESAhmad, Zamri and Simon Hussain (2001), ‘KLSE Long Run Overreaction and the
Chinese New Year Effect’, Journal of Business Finance and Accounting, Vol.28, No. 1&2, 63-105.
Arifin, Noraini Mohd and David M. Power (1996), ‘Some Evidence on Short-run Market Overreaction for The Kuala Lumpur Stock Exchange’, Capital Market Review, Vol. 4 No. 1, 21-32.
Ball, R., and Kothari, S.P (1989), ‘Non-Stationary Expected Returns: Implication for test markets efficiency and serial correlation in return’, Journal of Financial Economics, 25, 25-74.
Barberis, Nicholas, A.Shleifer, and Robert W. Vishny (1998), ‘A Model of Investor Sentiment’, journal of Economics, vol. 49, 307-343.
Bowmen, R.G. and Iverson D. (1998), ‘Short-run overreaction in the New Zealand Stock Market’, Pasific-Basin Finance Journal, Vol. 6, Issue 5, 475-91.
Chan, K.C. (1988), ‘On the Contrarian Investment Strategy’, Journal of Business, Vol. 61, 147-63.
Chan, Kalok., Alaudeen Hameed, and Wilson Tong (2000), ‘Profitability of Momentum Strategies in the International Equity Markets, Journal of Financial and Quantitative Analysis 35, 153-172.
Chan, Louis K.C., Narashiman Jegadeesh, and Josef Lakonishok (1996), ‘Momentum Startegies’, Journal of Finance 51, 1681-1713.
Chan, Louis K.C., Narashiman Jegadeesh, and Josef Lakonishok (1999), ‘The Profitability of Momentum Strategies’, Financial Analyst Journal, Vol. 55, No. 6 (November/December) 80-90.
Chopra, N., J. Lakonishok and J. Ritter (1992), ‘Measuring Abnormal Performance: Do Stocks Overreact?’, Journal of Financial Economics, Vol. 31, 235-268.
Chordia, T., and L. Shivakumar,(2002), ‘Momentum, Business Cycle, and Time-Varying Expected Returns, Journal of Finance, Vol.57, Issue 2, 985.
Clare, A. and S. Thomas (1995), ‘The Overreaction Hypothesis and the UK Stock Market’, Journal of Business Finance and Accounting, Vol. 22, no.7, 961-73
Conrad, J. and G. Kaul (1993), ‘Long-term Overreaction or Bias in Computed Returns’, Journal of Finance, Vol. 48, 39-63.
Conrad, J. and Gultekin, M.N. and G. Kaul (1997), ’Profitability of Short-term Contrarian Strategies: Implications for Market Efficiency’, Journal of Business & Economic Statistic’, July, Vol. 15, No.3, 379-386.
Cooper, Michael., and Roberto C. Gutierez Jr, and, Allaudeen Hameed (2004), ‘Market States and Momentum’, Journal of Finance, vol.59, 1345.
Jurusan Manajemen Fakultas Ekonomi Universitas Andalas
24

Jurnal Bisnis&ManajemenJurnal Business & Manajemen Vol. 1, No.1, 2005
Daniel, Kent., and Shereidan Titman (2001), ‘Market Reaction to tangible and Intangible Information’, Paper on internet, http://www.kent.kellog.nwu.edu/papers/dt4.pdf.
DeBondt and R.H. Thaler (1985), ‘Does the Stock Market Overreact ?’Journal of Finance, vol. 40, 793-808.--------------------------------- (1987), ‘Further Evidence of Investor overreaction and Stock
Market Seasonality’, Journal of Finance, Vol. 42, 557-81.Dissainake, G. (1997), ‘Do Stock Market Investors Overreact?’, Journal of Busisness
Finance and Accounting, Vol. 24, No. 1, 29-49.Fama, E.F., and Kenneth R.French (1988), ‘Permanent and Temporary Components
of Stock Prices’, Journal of Political Economy, 96, 246-273.________________________ (1996), ‘ Multifactor Explanations of Asset Pricing
Anomalies’, Journal of Finance, 51, 55-84Gaunt, Clive (2000), ‘Overreaction in the Australian Equity Market: 1974-1997’,
Pasific-Basin Finance Journal, vol.8, 375-398.Glaser, Markus., Martin Weber (2001), ‘Momentum and Turnover: Evidence from the
German Stock Market’, Working paper, Universitat MannheimHameed, Allaudeen, and Serena Ting (2000), ‘Trading Volume and Short-Horizon
Contrarian Profits: Evidence From the Malaysian Market’, Pasific-Basin Finance Kournal ,vol.8, 67-84
Hameed, Alaudeen, and Kusnadi Yuanto (1999), ‘Momentum Strategies: Evidence from the Pacific Basin Stock, National University of Singapore, working paper.
Harvey, Campbell. (1995), ‘ Predictable Risk and Return in Emerging Market’, Review of Financial Studies, 773-816.
Hong, Harisson, and Jeremy C. Stein (1999), ‘A unified Theory of Underreaction, Momentum Trading and Overreaction in Assets Market’, Journal of Finance, Vol.54, 2143-2184.
Howe, J.S, (1986), ‘Evidence on Stock Market Overreaction’, Financial Analyst Journal, July-August , 74-77.
Jegadeesh, and Sheridan Titman (1993), ‘Returns to Buying Winners and Selling Losers: Implication for Stock Market Efficiency’, Journal of Finance, Vol. 48, 65-91.
Kahneman, D. and A. Tversky (1973), ‘On the Psychology of Prediction’, Psychological Review, vol. 80, 237-51.
Kwok-Wah Fung, Alexander (1999), ‘Overreaction in the Hongkong Stock Market’, Global Finance Journal 10 : 2, 223-230.
Lakonishok, Josef., Andrei Shleifer, and R.W. Vishny (1994), ‘Contrarian Investment, Extrapolation, and Risk’, journal of Finance, 49, 1541-1578.
Lewellen, Jonathan (2002), ‘Momentum and Autocorrelation in Stock Returns’, Review of Financial Studies, 15, 533-563.
Liu, Weimen, Norman Strong , and Xinzhong Xu (1999), ‘ The Profitability of Momentum Investing’, Journal of Business Finance and Accounting, Vol. 26, No. 9&10, 1043-1091.
Lo Andrew and MacKinlay, (1990), ‘When are Contrarian Profits Due to Stock Market Overreaction’, Review of Financial Studies 3, 175-205.
Moskowitz, T.J. and Mark Grinblatt (1999), ‘Do Industries Explain Momentum?’, Journal of Finance, Vol. 54, No. 4,. 1249-1290.48.
Mun, Johnatan C., Geraldo M. Vasconcellos. And Richard Kish (2000), ‘ The contrarian / Overreaction Hypothesis an analysis of the US and Canadian Stock Market’, Global Finance Journal, Vol. 11,. 1-2, 53-72.
O’Neal, Edward S. (2000), ‘Industry Momentum and Sector Mutual Funds’, Financial Analysts Journal, July/August, 37-49.
Pan, Ming-Shiun., & L. Paul Hsueh. (2001). International Momentum Effect: A Reappraisal of Emperical Evidence. Shippensburg University, Working Paper.
Rosita, P., McLeavey D., Rhee, W.,Ghon, S., (1995), ‘Short-term Abnormal Returns of the Contrarian Strategy in the Japanese Stock Market’, Journal of Business Finance and Accounting 22 (7), 1035-1048.
Rouwenhorst G., (1998), ‘International Momentum Strategies’, Journal of Finance 53, 267-284.
Jurusan Manajemen Fakultas Ekonomi Universitas Andalas
25

Jurnal Bisnis&ManajemenJurnal Business & Manajemen Vol. 1, No.1, 2005
--------------------, (1999), ‘Local return Factors and Turnover in emerging Stock market’, Journal of Finance 55, 1439-1464.
Schiereck, Dirk, Werner De Bondt, and Martin Weber (1999), ‘Contrarian and Momentum Strategies in Germany’, Financial Analyst Journal, Vol. 54, No. 4, August, 104-116.
Schnusenbarg, Oliver, and Jeff Madura (2001), ‘Do U.S. Stock Market Indexes Over-Or Underract?’, The Journal of Financial Research, Vol. XXIV, No.2, 179-204.
Zarowin, P (1989), ‘Short-run Market Overreaction: Size and Seasonalitiy Effects’, The Journal of Portfolio Management’, Spring, 26-29.
Jurusan Manajemen Fakultas Ekonomi Universitas Andalas
26

Jurnal Bisnis&ManajemenJurnal Business & Manajemen Vol. 1, No.1, 2005
Globalization: Agreement and Disagreement
Ma’ruf1
ABSTRACT
Article by Mitchell (2002) “American Corporations: the New Sovereigns”, demonstrates that American multinational corporations in particular and globalization in general are widening inequality between the poor and the rich within a country and in different countries in general. However, in the long run, globalization will enhance people’s living standard although it may hurt some people in the short term. The article will argues that globalization creates more employment opportunities even if it may cause temporarily unemployment because of relocation of production to low cost places. It is also against on the opinion that MNCs are seeking profits at any price of environment and working condition. In contrast, it was also found that modern corporations aim at protecting environment, developing human resources and improving social responsibility as parts of their sustainability approach. It is also agreeable that U.S culture has influenced the world business and society although each country still keeps its identity. Finally, this article will show that governments, NGOs, multinational institutions and consumers still shape the market and influence the strategies of MNCs although MNCs are getting more powerful.
Keywords: Globalization, MNC, inequality
Introduction Multinational companies (MNC) or enterprises (MNE) and globalization, in the
sense of increased economic interdependence among nations, have affected every area of the world economy, society and people. The process is presenting both opportunities and threats to the society (Eden & Lenway, 2001). Of the process, American corporations are the most powerful entities expanding its influences to every corner of the world. They become “new sovereigns” even overtaking the role of governments in many cases. They are the prime movers and the embodiment of globalization and its principal agent (Eden et al. 2001).
In the article “American Corporations: the New Sovereigns”, Lewrence E. Mitchell (2002) presents several opinions on the affects of these companies and globalization on the world in general and the American society in particulars. This paper, thus, will critique the agreement and disagreement of the authors to some certain points of the article. First of all, the work discuss the opinion that globalization improves people’s living standard while enlarges the gap between the rich and the poor. It next proceeds to talk about the unemployment and pollution effects caused by the profit-oriented philosophy of the MNCs. The work then argues the view that the world is being ‘Americanized’ culturally, economically and even politically with the expansion of the American corporations. Finally, the paper will discuss the role of MNEs compared with the governments, multinational institutions, Non-governmental organizations (NGO) and consumers.Globalization and Inequality
The article firstly criticizes that American corporations increase inequality in human living. In other words, globalization enlarges the gap between the rich and the poor within a country, in different countries and through out the world. This negative effect has been examined and proved by several researches and empirical
1 Lecture at Management Department, Faculty of Economics Andalas University
Jurusan Manajemen Fakultas Ekonomi Universitas Andalas
27
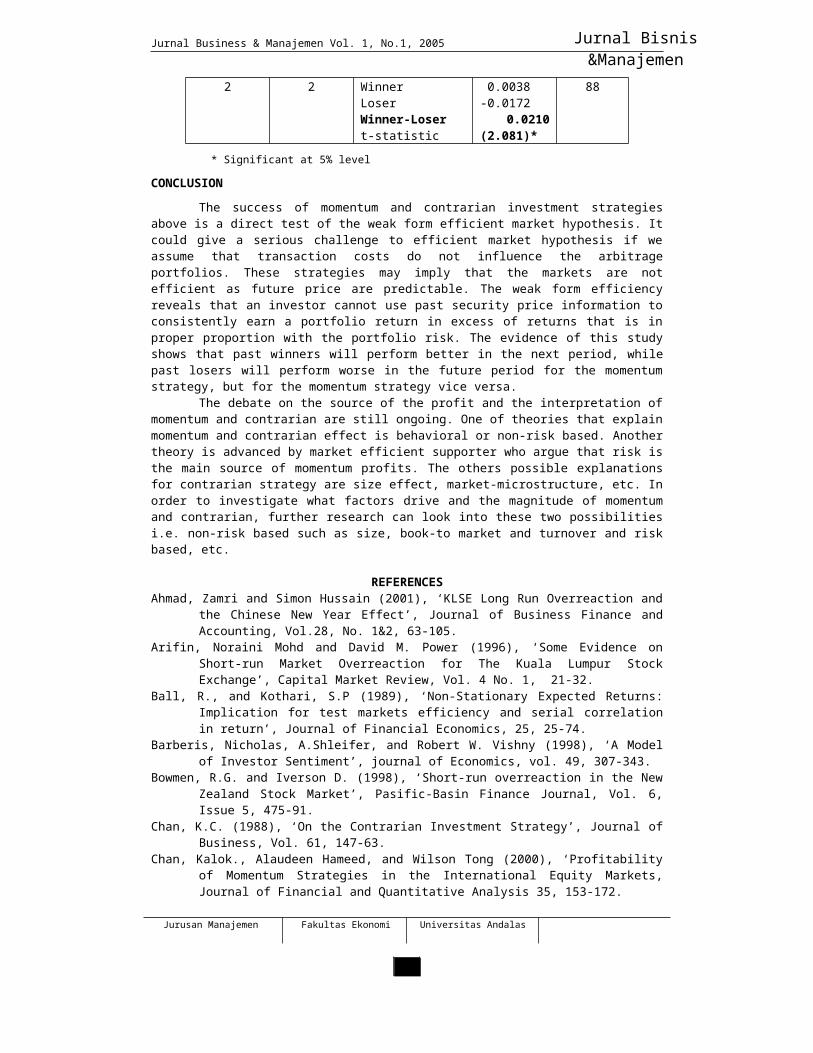
Jurnal Bisnis&ManajemenJurnal Business & Manajemen Vol. 1, No.1, 2005
evidences, of which many doubt that globalization is a force of oppression, exploitation and injustice (Crook, 2001).
Inequality within a countryWithin a country such as the United States, the richest country worldwide,
globalization has broadened the differences in living standard between the poor and the rich. Inequality has been regarded as the ‘social shame’ when the U.S becomes ‘the most unequal of modern nations” in the world (Bello, 1999). According to Cordoba (2004), two distinctive features of the U.S. wealth distribution are its large concentration and its large dispersion. According to the 1992 Survey of Consumer Finance, the wealthiest 1% of the population owns over 30% of the nation’s wealth, while the bottom 50% owns less than 5%. The American accounts for a majority of the world richest people, as surveyed by the Forbes magazine (forbes.com, 2005). However, some 20 million Americans were said to be experiencing hunger; 25 million of them were receiving federal food stamps. The child poverty rate, which has risen from 18 percent in 1980 to 22 percent in 1991, was the highest among the industrialized countries. Among children in minority groups, the poverty rate was even higher, at almost 50 percent (Bello, 1999). Within the U.S, the top 20 per cent of the population had the largest share of total income, while the bottom 60 per cent had the lowest share of total income ever recorded. Indeed, within the top 20 per cent, the gains of the Reagan-Bush period were concentrated in the top 1 per cent, whose income grew by 63 per cent between 1980 and 1989, capturing over 53 per cent of the total income growth among all families. Obviously, skeptics have their reasons when saying that these companies make some people who are already rich even richer by keeping the poor in poverty (Crook, 2001)
The disparity of living standard of the Americans originates largely from the inequality of wages. According to Valletta (1997), rising inequality in wages has been a key feature of the U.S. labor market since the late 1970s. Put simply, rising wage inequality implies that gaps between high-wage and low-wage workers have widened. Perhaps the most striking feature of this trend is its uniformity. Wage gaps between individuals at any fixed points on the wage distribution- for example, those at the high end versus those in the middle, or those in the middle versus those near the bottom- all have widened. Much of this is due to rising returns to measurable skills; for example, the wage gap between high school and college-educated workers has increased substantially. However, wage dispersion has increased even within groups of workers with identical measurable skills. Mazur (2000) observes that U.S. wages variation has hit levels not witnessed since the Gilded Age of the 1890s, with the average CEO now earning is 416 times more than the average earning of workers. Fewer workers have adequate health insurance and pensions. People find themselves working longer hours, with less job security, and running harder to stand still (Mazur, 2000). In addition, the gap also increases when millions of workers are losing out in a global economy that disrupts traditional economies and weakens the ability of their governments to assist them. They are left to fend for themselves within failed states against destitution, famine, and plagues. They are forced to migrate, offer their labors at wages below subsistence, sacrifice their children, and cash in their natural environments and often their personal health- all in a desperate struggle to survive (Mazur, 2000). Inequality between countries
Not only causing inequality within a country, multinational corporations has also widen the gap between the rich and the poor in different countries throughout the world. The world is becoming a more unequal place, with a growing gap between rich and poor households. Globalization is leaving some parts of the world behind, unconnected through the Internet, untouched by foreign investment while other parts are rocked by international capital flows that move instantly in and out of countries (Eden et al., 2001). Mazur (2000) contends that the benefits of the global
Jurusan Manajemen Fakultas Ekonomi Universitas Andalas
28
Jurnal Bisnis&ManajemenJurnal Business & Manajemen Vol. 1, No.1, 2005
economy are reaped disproportionately by the handful of countries and companies that set rules and shape markets.
The most obvious evidence of the unfairness is the unequal distribution of wealth. World inequality between households has increased, according to the latest studies by WB. The income of the richest 1 percent (50m people) is the same as the income of the poorest 60 percent (2.7bn people). All the gains in world income in the middle of the last decade went to the richest 20 percent, while the income of those in the bottom 50 percent actually declined. Mazur (2000) observes that the assets of more than 200 richest people are greater than the combined income of the more than 2 billion people at the other end of the economic ladder. According to the World Bank, in 1999, there were 1.2 billion people living on less than USD1 per day; 2 billion people living in countries where poverty levels are rising; nearly 50 percent of the world’s population are living on less than USD2 per day while 10 percent of the world’s population receive 70 percent of total income. Regarding GDP per capita, the figures between the developed countries and underdeveloped countries are totally diverse. In 2003, GDP per capita of Luxembourg was USD55,100 while the figure of Somali was USD500. The data of World Bank also shows that global poverty is concentrated in South Asia, where half of the world's poor live. Another quarter live in sub-Saharan Africa, while one quarter live in East Asia, mainly China. However, poverty has declined dramatically in East Asia, particularly in China, where an open economy has boosted living standards, especially in the coastal cities. But in the past decade poverty has been rising in Africa, in South Asia, and most dramatically in Eastern Europe, where the transition from communism has caused poverty rates to sky-rocket).
The main reason leading to the variation of living standard is the wage inequality across the world, which began to increase from around 1974 - the start of the age of globalization (Greenwood, 1999). According to Juhn, Murphy & Pierce (1993), the percentage gap between the average wages earned by the upper quartile and by the lower quartile has widened to 75 percent by 1988 compared with 53 percent in 1970. Even between workers, there is an international situation of widely disparate wage rates in which the average monthly income varies sharply between US worker and Asian and African countries worker (Bello, 1999). The differences seem to be larger even though labor mobility is getting more flexible in the global market .
The major consequence of the inequality is the anti-globalization movement. Williamson (1996) identifies that the inequality trends, which are produced by globalization, are at least partly responsible for the interwar retreat from globalization, first in the rich industrial trading partners. In addition, Eden & Lenway (2001) assert that it is not surprised by the backlash from those who feel disenfranchised by the process or who blame their suffering on globalization. These people see that globalization is in parallel with poverty, inequality and instability. Globalization generally increases living standard
Although globalization amplifies inequity, it have increased the living standard of not only American but also people worldwide by increasing travel, communication, and health, nutrition, and production capabilities, as argued by the article. Obviously, Mitchell has reasons since MNEs have augmented the world GDP, people income; brought a wider range of cheap, high quality products; and better entertainment facility. Although some ‘non-globalized’ countries are still left behind with poorer economies, globalization is generally make a better standard of living and providing enormous opportunities (Wolf, 2002)
Globalization facilitates the production of a wide range of goods at lower prices and better quality, which can satisfy almost all of the basic demands of people (Legrain, 2002). The advance of technology and increase of competitiveness are the drivers encouraging American corporations to enhance productivity, lower price and diversify products. These corporations play an essential role in upgrading industry resources and capabilities (Eden et al. 2001). They might also try to reduce costs by shifting production to lower-cost labor markets (Fischer & Kren, 2003). Living in such a global market, consumers thus have more choices of suppliers;
Jurusan Manajemen Fakultas Ekonomi Universitas Andalas
29
Jurnal Bisnis&ManajemenJurnal Business & Manajemen Vol. 1, No.1, 2005
workers are more flexible at seeking alternative opportunities (Norberg, 2004). For example, American consumers will be offered a variety of choices when seeking a car: GM, Ford, Toyota, BMW and so on with competitive prices and different promotions. The suppliers always try to improve their services to meet the need of customers better. Therefore, neo-liberalism advocates for globalization argue that integration is good for people in material terms (Crook, 2001).
Globalization has also increased the world GDP and people income. The increase can be seen most apparently when comparing the figures of those countries in East Asia (Mazur, 2000). According to the CIA data, GDP per capita of Singapore increased 14.96 times, from $1,658 in 1960 to $24,808 in 1999. Similarly, Taiwan has gained successfully 10.11 times of GDP per capita growth from $1,256 in 1960 to $12,700 in 1999. The increase of national GDP and per capita GDP gives governments more to spend on welfare, education and other public services (Norberg, 2004).
However, it is not a right picture when the negative effects brought by the American corporations to people material life are not mentioned. The pessimistic school realizes the downturns in GDP and the decreased income per capita in some parts of the world. The GDP growth between countries seems to be imbalanced since they are differently affected by the globalization, especially trade and investment. According to a research by Mazur (2000), only 33 countries managed to sustain 3 percent annual GDP growth on a per capita basis between 1980 and 1996; 59 countries has declined per capita GDP. Eighty countries have lower per capita incomes today than they did a decade or more ago. However, those left behind are often the non-globalised countries with low level of market openness. This infers that globalization mostly comes along with prosperity.
In general, globalization in its long term makes the poor and the rich people, poor or rich countries better off (Norberg, 2004). The globalization process, in the short term, may reduce income of certain people in some countries, but generally increases the world output and people income. For instance, when American corporations shifted factories to other countries such as Mexico after founding the North American Free-Trade Agreement (NAFTA), local workers might suffer job insecurity and wage fall. However they benefit from lower prices of goods imported from the low wage countries like Mexico. Crook (2001) argues that in developing countries, the increase in demand for poor-country labor ought to push up wages even for workers who are not employed in the new trade-related jobs. So capitalism is not mainly concerned with shifting income from workers to investors, as the skeptics maintain. Rather, in the aggregate, it makes many workers and consumers better off as well. Altogether, given freer trade, both rich-country and poor-country living standards rise. Therefore, looking beyond the catchy slogans, many of the rich have indeed grown richer, and most of the poor are also getting better. Absolute poverty has diminished, and where it was greatest 20 yeas ago, in Asia- hundreds of millions of people have achieved a secure existence, even affluence, previously undreamed of (Norberg, 2004).MNCs relocation and layoffs: still increase employment
Another issue criticized by Mitchell is the unemployment effect caused by the greater ease in relocating production and layoff policies implemented by MNCs. The author seems to have reasons when stating that the low-cost production relocations by MNCs may shift employment opportunities from workers in developed countries to those in developing countries. In addition, layoffs are a fast way to cut costs and raise stock price by these companies. The processes, in fact, do not have much affects on skilled workers while might temporarily cause unemployment to unskilled workers. However, the long-term evaluation proves that all workers will benefits from these operations.
The relocation of production, which happens when firms decided to set up a new production in a particular country (Ekholm & Braconierard. 1999), temporarily reduces the job security and opportunities but would increase the opportunities in the future at the home market. For instance, when NAFTA was signed, some 600,000
Jurusan Manajemen Fakultas Ekonomi Universitas Andalas
30

Jurnal Bisnis&ManajemenJurnal Business & Manajemen Vol. 1, No.1, 2005
jobs that would otherwise have been located the US have been created by affiliates of US corporations operating in Northern Mexico, attracted by wages that are between one-tenth and one-fourteenth as high as US wages (Bello, 1999). However, several studies find that the effect of relocation on the home country is still ambiguous while gains by the host are obvious; there is no convincing evidence that outward FDI and relocation activities have actually damaged the local labor market. They argue that relocations have positive impacts on country of origin in terms of employment (Hill, 2005). In many cases, employment complementarities exist instead of substitution. For examples, in the study of the employment effect of U.S investment to Latin American on U.S labor market in the period from 1982 to 1994, Falzoni & Bruno (2000) acknowledge that even though in the short term, local labors may be substituted, the complementary relationship will emerge and employment opportunity will be better in the long term. Braconie & Ekholms (2001) reinforce this statement with the finding that although relocation activities might take place in the phase of set up, there is no evidence of this happening in the existing production units. In other words, the home labor market is only short-term affected by resources seeking activities while host countries fully benefits from these movements.
Not only does relocation shift employment away, in some cases it also creates more employment opportunities for home market (Hill, 2005). For examples, when Toyota Company set up manufacturing facilities in the U.S, its production rose sharply. Many of its components and parts were imported from Japan and partly from other countries. In addition, many Japanese skilled workers were employed by Toyota in the U.S. factory. This means that Toyota has generated jobs not only for U.S. but also for Japanese workers by establishing new factories in the U.S.
Concerning layoff, there are more supports that layoffs are not a good way of reducing costs and raising stock, as realized by many MNEs. The cost of advertisement, recruitment and training for new workers may be higher while labor cost alone is not the decisive factor. In addition, layoffs may negatively affect the corporate image and the relationship with community- the main stakeholders. Moreover, multinational corporations tend to pay more attention to the social responsibility by building the relationship with local communities in their sustainability approach (Dunphy, Griffiths & Benn, 2003). Therefore, suspending employment is not of their policy in the new environment.MNCs and sustainable development
Mitchell argues that maximizing stockholder wealth is the single purpose of American corporations. Coupled with the profit maximization goal is the limited liability and faceless, soulless managers who never concern with environment, work safety and social responsibility. This statement seems to be right many years ago, but not truly reflects the business philosophy of modern corporations because multinational companies are now under increasing pressure to adopt ‘corporate social responsibility’ programs as part of sustainability movement (Legrain, 2002).
Environmental protection is becoming a major concern of governments, institutions and many companies in the world looking at the future development. The reason is, as Griffiths (2004) argues, “never before history of the world has the viability of much of the life of the planet been under threat from humanity; never before have so many of the world's people experienced such material wealth and so many others lived in abject poverty”. Several companies realize that they can reduce pollution and increase profits simultaneously (Senge & Carstedt, 2001; Lovins, Lovins & Hawken, 1999, Hart, 1997). For examples, MNCs such as BP, Shell, Toyota, General Motor and General Electrics consider waste elimination a part of sustainable business. In particular, BP's goal to reduce greenhouse-gas emissions by 10% by 2010 was achieved in 2002. The company's long-term product strategy is to shift to natural gas and then to renewables for its energy products. Automaker Ford through R&D projects has been developing a number of technologies to make its vehicles more fuel-efficient and thus reduce greenhouse gas emissions, through greater efficiencies in current engines and through innovation to design fuel cell,
Jurusan Manajemen Fakultas Ekonomi Universitas Andalas
31

Jurnal Bisnis&ManajemenJurnal Business & Manajemen Vol. 1, No.1, 2005
hydrogen internal combustion, hybrid, and battery-powered electric vehicles (Logsdon, 2004).
MNCs can also create abroad range of positive externalities. In order to meet the high requirements of the international competition, MNCs have carried out their intensive research activities to introduce and diffuse the state-of-the-art technology. New technology is likely to be more efficient and more environment friendly (Esty & Gentry 1998). Adoption of new technology tends to lead to a decline in environment pollution in two ways. First, it ought to reduce input of materials per unit of out put. Second, it may lower wastes, therefore reduces pollution emissions per unit (Tisdell, 2000). The study of China’s manufacturing by Chai (2002) indicates that almost all of Chinese manufacturing sectors have experienced a decrease in pollution intensity after China improved the level of openness and obtained more FDI. The largest contributor to this decline is turned to be the adoption of new technology introduced by foreign investors. Moreover, studies suggested that MNCs tend to shift their labor-intensive and technology-intensive operations to the developing countries. The labor-intensive industries, such as light assembly industry and garments industry, are usually less polluting. Put simply, FDI tend to make the environment cleaner and greener besides increasing living standard. Specifically, as Antweiler, Brian & Taylor (2001) argue, if trade raises GDP per person by 1 percent, then pollution concentration falls by about 1 percent.
Social responsibility, which relates to contributions by MNCs to community and human development, also requires the companies to improve working conditions and living standards of their workers. Business people increasingly recognize that their prosperity is directly linked to the prosperity of the whole community including customers, employees, suppliers and local people (Zadek, 1998). Therefore, MNCs have to seek prosperity for all community by involving in mutual relationship. For example, Interface, Inc – a leader in carpet and floor covering manufacturer in the U.S.- has actively engaged in society by contribution to several local projects, charity and family activities. In 2003, the company contributed over USD400,000 to charitable organizations (www.interfacesustainability.com). Other examples involving social involving social activities are Toyota, Telstra and IBM. In words commenting the social effects of MNCs, Agénor (2004) states that at low levels, globalization appears to hurt the poor, but beyond a certain threshold, it seems to reduce poverty or enhance wealth for all people. Thus, globalization may hurt the poor not because it went too far, but rather because it did not go far enough.
The result comes out that MNCs are getting more concerned with environment and working conditions to achieve their sustainable development. ‘Profit myopia’ appears to be the old story when these companies strived to do whatever for short-term profit. The idea by Mitchell, therefore, seems to be not relevant in the new business environment.Globalization and Westernization or Americanization: the same animal
According to the article, the American corporations have been toward ever greater world dominance, not only in the products and services sold but also in its exportation of American culture. The statement is proved to be acceptable as the world today is largely influenced by Western styles, from stockholder-take-all capitalist practices to Mac Donald’s fast foods and Coke drinks. The influences appear to be prevalent in both business culture and social culture.- Business Culture
As for the business culture, task-orientation, innovation, law compliance and maximizing stockholder wealth have become the business philosophy of modern corporations worldwide. Managers, who are well paid by the company, must strive hard to increase company’s profits and to achieve the objectives set by the board if he does not want to be punished for poor performance. The American influences in business can be found in many countries. For examples, the French view globalization as synonymous with Americanization, the cultural imperialism that has
Jurusan Manajemen Fakultas Ekonomi Universitas Andalas
32

Jurnal Bisnis&ManajemenJurnal Business & Manajemen Vol. 1, No.1, 2005
filled France with bad food and bad films. Economically, globalization is seen to impose an Anglo-Saxon neo-liberal logic that demands business deregulation and privatization, financial market liberalization, and the retreat of the state (Schmidt, 2005). Kuehn (2005) argues that the world is in trouble of perception of American brands abroad. The line is increasingly blurred between "globalization" and "Americanization." For some, globalization is an American-led phenomenon, and U.S.-based multinationals are widely seen as its symbols and promoters. From a company’s perspective, Yoshi Inaba, a senior of Toyota Company, is quoted by saying that "Americanization is going on in every facet of our business" (Taylor, 2003). To reinforce the statement, Moore & Rugman (2003) state that much has been written about globalization over the last decade, in which it has been assumed that globalization and Americanization are one and the same.- Social Culture
In terms of social culture, the Western living style has been widely spread around the world from MTV music to Hollywood movies which all have been diffused by globalization. The spread of American food chains and consumer products worldwide is accompanied by the expansion of multinational corporations such as Mc Donald’s, KFC and Coca Cola. In recent years, American movies, music, and TV shows have consistently gained more and more audience worldwide. ‘Cola-colonization’ and ‘Americanization’ are the common terms used to evidence the American cultural influences. To express the ‘American phenomenon’, Friedman (1999) states that:
Today, globalization often wears Mickey Mouse ears, eats Big Macs, drinks Coke or Pepsi and it does its computing on an IBM PC, using Windows 98. In most societies most people cannot distinguish anymore among American power, American exports, American cultural assaults, American cultural exports, and plain vanilla globalization. They are now all wrapped into one.
Levitt (1983) evidences the impact of Westernization with several examples. In 1979 Iranian uprisings, young men were in fashionable French-cut trousers and silky body shirts thirsting with raised modern weapons for the blood name of Islamic fundamentalism. During Biafra’s fratricidal war against the Ibos, daily televised reports showed soldiers carrying bloodstained swords and listening to transistor radios while drinking Coca-Cola. The examples bring to a close that American styles are becoming the world fashions.
It is apparently accepted that there are still much differences between nations but they will be disappeared or become the world’s products. The cultural domination is limited by the fact that each country also keeps its own identity, which has been developed through history (Ball & McCulloch, 1996). The diversity in historic, cultural, economic, and strategic outlooks remains a counterbalance to U.S. dominance even the world becomes increasingly globalized (Schmidt, 2005). However, these differences would either die gradually or prosper and expand into mainstream global preferences (Levitt, 1983). The role of main players
The world is also profoundly influenced by the MNCs who are becoming very influential with their wealth. American corporations seem to control and take over the role of governments, as the article contends. However, governments, multinational institutions, NGOs and consumers are still playing decisive roles in world economy.
MNCs are becoming powerful with increasing wealth and assets. There are about 65,000 MNCs worldwide with 850,000 affiliates employing 54 million people. About 30 percent of world trade is conducted within MNCs and about 80 percent involves at least one MNC. Top 100 MNCs account for more than 50 percent of employment and sales of the total (WB). American institutional assets constituted an aggregate 66.8 percent of the total in five major foreign economies, including those of France and Germany (Mitchell, 2002). This means that MNCs can intensely influence how governments and institutions go and how people live. Puplampu &
Jurusan Manajemen Fakultas Ekonomi Universitas Andalas
33

Jurnal Bisnis&ManajemenJurnal Business & Manajemen Vol. 1, No.1, 2005
Tettey (2000); Devan & Fosu (2003) contend that globalization is related with weakening role of the state and the increasingly powerful position of corporation and non-state institutions across borders. However, it does not mean that MNCs have become the new sovereigns who can dominate all decisions. They are still largely influences by governments, NGOs and consumers.
Powerful governments are always needed to support function of market and prevent drawbacks of globalization. Devan et al. (2003) suggest that governments are needed to conduct some critical roles such as preventing unstable international capital flow, providing incentives to attract FDI, and generally minimizing the drawbacks of globalization. In globalization, governments are forced to retreat from business intervention but they can choose to reimpose restrictions on trade, business and investment; continue to control commerce in their jurisdictions with invisible hand; and retain the right to set their policies domestically although agreed to be bound by multilateral rules in order to trade freely internationally. They are more than capable, either individually or collectively, of achieving social aims through legislation (Legrain, 2002).
The non-state actors such as NGOs can monitor government policies and MNCs activities to ensure that they serve the interests of the public. These non-profit, voluntary and citizen-oriented institutions, are conducting basic functions such as performing a variety of services and humanitarian activities, seeking to bring the concerns of citizens to the attention of governments and serving as advocates of people-centered policies (Puplampu & Tettey, 2000). NGOs build extensive network within communities and empower closeness to their target population as their principal strengths to be able to involve and reflect grassroots' interests. Therefore, they play a significant role in setting the strategies of MNCs. For examples, Shell was hit with a double whammy in 1995. Greenpeace – an NGO- attacked it for trying to dispose of the Brent Spar oilrig at sea, as well as for failing to appose the Nigerian government’s execution of a human-right activist. Shell reacted by rewriting its business principles, putting in place a new reporting system to make sure they were implemented, and engaging more with NGOs (Legrain, 2002). The case illustrates that such a powerful MNC like Shell cannot disregard the voice of NGOs in their business policies.
Supranational and multinational organizations such as ILO, OECD, WB and UN are also the main players in world business. Interest about globalization has inspired these organizations to elaborate some recommendations to unify criteria and to set out some minimum standards in order to guide the performances of multinational enterprises that operate in developing countries (Vanston, 2001). They promote integral development and critical role of multinational enterprises in sustainable development. This recommendation was declared in form of Dimension of the Sustainable Human Development as can be seen in appendix 6. Obviously, MNCs are profoundly affected not only by governments but also by these ’super governments’.
In addition, consumers as ever have deep influences to the world business and market as well as MNCs policies. They influence MNCs by their perception to green products, ‘social citizens’ and other aspects of the world. The increasing internationalization and MNCs have resulted in numerous initiatives at the international level that address consumer protection, commercial issues, sustainable development, and sustainable consumption (Overby, 2002). Consumers might fight against foreign producers and domestic exporters seeking to diminish the ability of nations to impose their own safety and health standards (Mayer, 1998). Reacted to such movements in a competitive environment, MNCs have no other choices but redirect their strategies to meet the demands and requirements of customers.Conclusion
In summary, the globalization and expansion of MNCs as well as American corporations overwhelmingly affects the world society as argued by many researchers, economists and businessmen. The paper has critiqued the article by Mitchell (2002) and came to several conclusions, of which some are agreeable with the article, some differ from Mitchell’s opinions. Specifically, the paper demonstrates
Jurusan Manajemen Fakultas Ekonomi Universitas Andalas
34

Jurnal Bisnis&ManajemenJurnal Business & Manajemen Vol. 1, No.1, 2005
that globalization has enlarged the breach between the poor and the rich in each country, in different countries and through out the world. Inequality is the major consequence caused by MNCs. It is found that in the short term, globalization may make some people poorer, but in the long run, it will improve all people’s living. The work also argues that globalization and expansion of multinational companies produce more employment for workers worldwide although it may temporarily cause unemployment as the result of relocation of production to low cost places. It is also against the article that MNCs are seeking profits at any price of environment and working condition. In contrast, the work exhibits that modern corporations strive to protect environment, develop human resources and improve community condition in their sustainability approach. It is agreeable with the article that U.S culture has influenced the world business and society, from living styles to profit-oriented business culture. Finally, the work shows that governments, NGOs, multinational institutions and consumers still shape the market and the strategies of MNCs although MNCs are getting more powerful politically, socially and economically.
References
Agénor, P . R . 2004, ‘Does Globalization Hurt the Poor?’ International Economics and Economic Policy , vol.1, issue. 1, pp. 21-51.Anonymous. 2003, ‘MNEs, Globalization and Digital Economy: Legal and Economic Aspects’,
Managerial Law, vol.45, no.. 1/2, pp. 5.Antweiler, W., Copeland, B., and Taylor, M. S. 2001, ‘Is Free Trade Good For Environment?,
American Economic Review, vol. 91, no.4, pp. 877-908Ball, Don and McCulloch, Wendell. 1996, International Business, Irwin McGraw-Hill, New York.Bello, W. 1999, Dark Victory: the United States and Global Poverty, Transnational Institute, London.Blomstroem, M., Kokko, A.& Globerman, S. 2000, ‘The Determinants of Host Country Spillovers from Foreign Direct Investment ’, CEPR Discussion Paper No. 2350.Boni, J F.L.A. 2002, ‘The Impact of the Multinational in the Development: An ethical challenge’, Journal of Business Ethics , vol.39, no. 1/2, pp. 169-178.Braconier, H., & Ekholm, K. 2001, ‘Foreign Direct Investment in Eastern and Central Europe: The
Case of Swedish Multinationals’, CEPR Discussion Paper No. 3052.Ceglowski, J. 1998, ‘Has Globalization Created a Borderless World?’, Business Review – Federal
Reserve Bank of Philadelphia, March / April, pp. 17-27.Centre for Economic and Policy Research. 2005, ‘Per Capita GDP Growth 1960-2000,
[online] accessed on April 4, 2005, Available at: http://www.cepr.net/IMF/Central Intelligence Agency. 2005, ‘The World Factbook-Rank Order – GDP – per capita’ [online],
accessed on April 1, 2005, available at: http://www.cia.gov/cia/publications/factbook/rankorder/2004rank.html
Chai, J.C.H. 2002, ‘Trade and Environment: Evidence from China’s Manufacturing Sector’,
Sustainable Development, vol.10, pp. 25-35.Cordobat, J.C. 2004, ‘U.S. Inequality: Debt-Constraints or Incomplete Markets?’, Rice University,
U.S. at http://server1.tepper.cmu.edu/seminars/docs/usi.pdf accessed on May12, 2005Crook, C. 2001, 'Survey: Globalization', The Economist, vol. 360, no. 8241.Data & Statistics, 2005. World Bank [online] accessed on March 29, 2005,
available at : http://www.worldbank.org/dataDevan, D & Fosu, A. 2003, ‘Globalization: An Overview’, Journal of African Economies,
Feb 1, no. 12, pp. 1.
Jurusan Manajemen Fakultas Ekonomi Universitas Andalas
35

Jurnal Bisnis&ManajemenJurnal Business & Manajemen Vol. 1, No.1, 2005
Dollar, D & Kraay, A. 2001, 'Trade, Growth, and Poverty', Finance & Development, vol. 38,
no. 3, pp. 16-9.Dunphy, D & Griffiths, A & Benn, S. 2003, Organisational Change for Corporate Sustainability,
Routledge, London.Eden, L & Lenway, S. 2001, 'Introduction to the Symposium Multinationals: The Janus Face of
Globalization', Journal of International Business Studies, vol. 32, no. 3, pp. 383-400.Ekholm, K. & Braconier, H., 1999, Swedish Multinationals and Competition from High- Wage and Low-Wage Locations , CEPR Discussion Paper No. 2323.Esty, D. & B. Gentry. 1998, Foreign Direct Investment and the Environment. Organization for
Economic Cooperation and Development.Falzoni, A. M., Bruno, G. 2000, Multinational Corporations, Wages and Employment: Do
Adjustment Costs Matter?, CEPR Discussion Paper No. 2471.Fischer, B & Kren, L. 2003, 'Surviving globalization: Selling value versus cost', Machine Design,
vol. 75, no. 21, pp. 144.Friedman, T. L. 1999, The Lexus and the olive tree, Farrar, Straus and Giroux, LLC, New YorkGreenwood, J. 1999, 'The Third Revolution: Technology, Productivity, and Income Inequality',
Economic Review, vol. 35, no. 2, pp. 2-13.Griffiths, A. 2004, 'Corporate Sustainability and Innovation', Innovation:
Management, Policy & Practice, vol. 6, no. 2http://www.innovation-enterprise.com/6.2/6.2.iv.php accessed on
05May2005Hart, S.L. 1997. ‘Beyond Greening: Strategies for a Sustainable World’, Harvard Business
Review, vol. 75, no.1, pp. 66-76.Hill, C. W. L. 2005, ‘International Business − Competing in the Global Market Place’, McGraw-
Hill/Irwin, Boston.Holton, R. 2000, Globalization's Cultural Consequences, The Annals of the American Academy,
July, pp.140-151.Hoos, J. 2000, Globalization, Multinational Corporation and Economics, Hungary: BudapestInternational Monetary Fund
http://www.imf.org accessed in May 2005.Interface Sustainability
www.interfacesustianbility.com accessed on May14, 2005Juhn, C., Murphy, K.M.& Pierce, B. 1993, 'Wage Inequality and the Rise in Returns to Skill', Journal
of Political Economy, vol. 101, no. 3, pp. 410-42.Kuehn, K. 2005, ‘Managing Anti-Americanism’, Traffic World,
vol.269, issue. 2, pp. 9.Legrain, P. 2002, Open World: the Truth About Globalization, Abacus, London.Levitt, T. 1983, ‘The Globalization of markets’, Harvard Business Review,
vol.61, no.. 3, pp. 92-102.Lovins, A., Lovins, H. and Hawken, P. 1999, 'A road map for natural capitalism', Harvard
BusinessReview, vol. 77, no. 3, pp. 145-158.Logson, J.M. 2004, 'Global Business Citizenship: Application to Environmental Issues',
Business and Society Review, vol. 109, no. 1, pp. 67.
Jurusan Manajemen Fakultas Ekonomi Universitas Andalas
36

Jurnal Bisnis&ManajemenJurnal Business & Manajemen Vol. 1, No.1, 2005
Mayer, Robert N Trading. 1998,’ Up: Consumer and Environmental Regulation in a Global
Economy’, The Journal of Consumer Affairs, Vol.32, no. 1, pp. 176-181.Mazur, F. 2000, 'Labor’s New Internationalism', Foreign Affairs, vol. 79, no. 1, pp. 79-93.Menotti, Victor, 1999, Forest Destruction and Globalization, The Ecologist, Vol.29, no.3, pp.180.Mitchell, L.E. 2003, ‘American Corporations: the New Sovereigns’, The Chronicle of Higher Education , January 18, pp. 18-19.Moore, K. & Rugman, A.2003, ‘Does Globalization Wear Mickey Mouse Ears?’, Across the Boards, Vol.40, no.1, pp. 11-121.Norberg, J. 2004, 'Three Cheers for Global Capitalism', American Enterprise, vol. 15, no. 4,
pp. 20-27. The World's Richest People, Forbes,[online] accessed on April 2, 2005,
available at: http://www.forbes.com/lists/2003/02/26/billionaireland.htmlOverby, Brooke. 2002, ‘Contract, in the age of sustainable consumption’, Journal of Corporation Law,
Vol.27, Iss. 4; pg. 603-631Puplampu, K.P. & Tettey, W.J. 2000, ‘State-NGO Relations in an Era of Globalization: The
Implications for Agricultural Development in Africa’, Review of African Political Economy, vol.27, issue. 84, pp. 251.
Rugman, A.M. & Verbeke, A. 2004, 'A Perspective on regional and global strategies of multinational
enterprises', Journal of International Business Studies, vol. 35, no. 1, pp. 3-18. Schmidt, V. 2005, ‘A Rival to the American Idol’, Foreign Policy, May/Jun2005, No. 148, pp. 89-91.Senge, P. & Carstedt, G. 2001, 'Innovating our way to the next industrial revolution',
Sloan Management Review, vol. 42, no. 2, pp. 24-38.Taylor, A. 2003, ‘The Americanization of Toyota’, Fortune (Europe), vol.148, no.12.Tisdell, C. A. 2000, Free Trade, Globalization, the Environment and Sustainability: Major
Issues and the Position of WTO, Economics, Ecology and the Environment, Working Paper No.39, Department of Economics, The University of Queensland, Brisbane.
Valletta, R. (1997), ‘Rising Wage Inequality in the U.S.’, Federal Reserve Bank of San Francisco. http://www.frbsf.org/econrsrch/wklyltr/el97-25.html accessed May15, 2005
Vanston, N. 2001,’ The Acceptable Face of Globalization’, The OECD Observer, Sep 2001, Iss.228, pg.9.
Wolf, M. 2002, ‘Is globalization in danger?’, The World Economy, vol.26, no. 4, pp. 393-411.World Bank, http://www.worldbank.org/ accessed in May 2005.World inequality http://www.globalpolicy.org/socecon/inequal/2002/0618bbc.htm
accessed May15, 2005.Zadek, Simon. 1998, ‘Balancing Performance, Ethics, and Accountability’, Journal of
Business Ethics, vol.17, no. 13, pp. 14-21.
Jurusan Manajemen Fakultas Ekonomi Universitas Andalas
37

Jurnal Bisnis&ManajemenJurnal Business & Manajemen Vol. 1, No.1, 2005
The Effective Web Site for E-Commerce Activities in SME Environment
Vera Pujani1
ABSTRACT
The existing internet technology at the beginning of the twenty-first century dramatically changed the trend of information system (IS) applications in business to become internet worked e-business and e-commerce systems. The enormous growth of the internet technology has the profound impact on business activities which is able to generate many potential benefits for customers/users, organizations/firms and society, even though e-commerce systems have various limitations. These benefits are more enjoyed by large companies in developed countries which have more experiences, stronger foundations and greater resources than in developing countries.
Emerging e-commerce activities drive an expansion of the World Wide Web (WWW) being a revolutionary way to perform commerce, deliver services, educational programs, compete, and provide information and online transactions. The web sites can be used as both an information-seeking and an e-commerce also. In spite of the dot-com activities having failed during 2000-2001, web site activities are still booming since many organizations reach potential customers through their homepages. Numerous web site classifications offer varied options to organizations based on their characteristics.
The literature survey pointed out the uses of the commercial web for small & medium enterprise (SME) environments showing different situations with larger firms, because of the unique SME’s situations, resources, strategic, and others. Based on SME characteristics meeting web site classifications and the web quality, numerous prior studies recommended various ways to develop effective companies’ web sites. This paper presents that uncomplicated adoption level, simply design, more focus to provide information quality and excellent services are as a priority for SME web contexts. Besides that, product/service types provided, target markets and the role of government and academics also are very essential considerations to SME web site success. The majority of the SME websites are developed as a promotion and marketing tools.
This paper presents some preliminary studies in relation to the web effectiveness within SME circumstances, which is a part of research in progress for a doctoral thesis. Finally, the results will build main fundamentals to develop conceptual frameworks of further study in Indonesian SMEs and developing countries.
Keywords: E-commerce, developing country, web sites, and SMEs
Introduction
This paper considers how small and medium business enterprises (SMEs) make use of their web sites to conduct e-commerce activities. The SMEs can be categorized as a business establishment with a workforce of up to 100 employees in Indonesia (Indonesian Bureau Statistic Centre). This paper offered the conceptual frameworks
1 Lecture at Andalas University-Indonesia and Doctoral Student at Graduate College of Management-Southern Cross University Australia
Jurusan Manajemen Fakultas Ekonomi Universitas Andalas
38

Jurnal Bisnis&ManajemenJurnal Business & Manajemen Vol. 1, No.1, 2005
which facilitated and assisted the web sites effectiveness from some previous studies. It presents SME characteristics meeting with proper commercial web sites especially in developing country environments.
Indonesia is chosen to represent the complexity of e-commerce activities, in particular web site implementations by SMEs in developing countries. Meanwhile, SMEs are the majority of organizational businesses in Indonesia. They were perceived as a rescue valve in the recovery process of the national economy during the past-economic crisis because SMEs were not greatly influenced by that crisis due to the fact that they play mostly in domestic or local markets (Berry et al. 2002). Indonesian SMEs contributed 54.5 % contributions to national GNP, from small business 39.7% and medium enterprises 14.8% in 2000. In addition, the growth of Indonesian SMEs has been faster than the national growth: 3.8 % in 2001, 4.1 % in 2002 and 4.6 % in 2003 (Indonesia Cooperative Department 2004). It can be expected as a useful study for Indonesian SMEs.
In Indonesia, the use of e-commerce is still less developed. Even though during 1996-1999, some ICT indicators have increased such as the number of personal computer, internet host and online users is 17.85%, 24.11% and 42.52% respectively (Orbeta 2002).Various constraints occur in Indonesian circumstances including under sophisticated IT (Information Technology) infrastructures and financial supports (bank involvement or other financial institutions). In addition, one of the weaknesses of e-commerce usage in developing countries is the lack of knowledgeable users. The fear of using technology or information technology is caused by a low education level and the lack of English capability of e-commerce users. However, e-commerce could anticipate a crucial issue for Indonesian SMEs such geographical and marketing problems (Raharjo 1999). Meanwhile, the use of web site in Indonesia tends to search the good/service information and observe the prices (Wicaksana & Wiryana 1999). The majority of the SME websites are developed as a promotion and marketing tools in tourism, manufacturing, distributions and trade sectors, especially selling handicrafts and furniture (The Asia Foundation, 2002).
The paper begins with a review of e-commerce and web sites and followed by a study literature regarding to effective SME web sites.E-commerce overviewsTo define e-commerce, the literature describes as the employment of the telecommunication network to conduct transactions, business functions, sharing information, maintaining relationships before, during and after purchase with customers, among organizations and any third parties in order to achieve the organizational objective (Bandyo-padhyay 2002; Costa, 2001; O’Brien, 2002; Zwass 1998).
Many companies are realizing that the utilization of new technologies is a crucial requirement to create innovative ways to do business is more global and acquire competitive advantages (Teo & Pian 2004; Negash, Ryan & Igbaria 2003). In particular, the growth of information technologies (IT) usages in terms of electronic commerce (e-commerce) has mushroomed. E-commerce usage is having profound impact on the practical business not only for domestic markets but also for the global market (Seyal & Rahman 2003).
On the one hand, the use of e-commerce has brought benefits to organizations, as technologies are able to assist organizations to gain their objectives in increasing revenue streams, improving market exposure, decreasing operating costs, cutting times of product life cycles, improving supplier management, extending global reach, increasing customer loyalty, and increasing value chains (Raharjo 1999; Teo & Choo 2001; Sellito, Wenn & Burgess 2003). On the other hand, it can also have a negative effect in terms of social impacts, such as social isolation, loss of
Jurusan Manajemen Fakultas Ekonomi Universitas Andalas
39

Jurnal Bisnis&ManajemenJurnal Business & Manajemen Vol. 1, No.1, 2005
individuality or privacy concern, influence on local, social and political value and economic impacts, such as tax, trade and regulatory policies, and employment and labor policy (Sharma & Gupta, 2003).
However, the number of internet users increased dramatically from ten thousand in the 1990s (Wolcott et.al 2001) to in 2002, an estimated more than 320 million internet users around the world (Orbeta 2000). In addition, the world e-commerce revenue is predicted in 2004 to increase to around 8.6 % (US$6.7 trillion). In particular, for the ASEAN countries (estimation for 2005) this will be US$11 billion for Singapore, Thailand and Indonesia, US$ 10 billion for Malaysia and US$7 billion for the Philippines (Orbeta 2000). Therefore, e-commerce has been main concerns for business organizations around the world both developed and developing countries.
E-commerce Characteristics The framework views the e-commerce under transactional activities (Orbeta, 2002), organization types (Turban & King, 2003), and four basic dimensions (Molla & Licker, 2001). The following paragraphs explain these e-commerce characteristics in detail.
Orbeta (2002) classified e-commerce based on the patterns of transactional activities between groups of sellers and buyers including (1) business as sellers B2B, B2C, B2G, (2) customers as sellers: C2B, C2C, C2G, (3) government as sellers: G2B, G2C, G2G. In addition, e-commerce organizations can be positioned depending on the degree of digitization (Turban & King 2003, p. 4) as follows:
1. Pure physical organizations (brick-and-mortar) are organizations that conduct business off-line (old-economy organizations).
2. Click-and-mortar organizations are organizations that use e-commerce but do their business in the physical world.
3. Pure online virtual organizations are organizations that sell their products or service only online.
Further, Molla and Licker (2001) classified e-commerce based on four basic dimensions including (1) group (supplier, producer, intermediary, consumer, and government), (2) value added business functions (Communication, Production, Advertising, Distribution, Selling, Buying and others), (3) application solutions (e-mail, WWW, Customer Relationship Management (CRM), Supplier Relationship Management, and others), and (4) network archetype (Internet, Intranet, Extranet, and others). In the other words, every group makes use of e-commerce to do varied business activities using different applications and network archetypes.
In summary, these classifications are able to give an initial picture for SMEs to conduct business in e-commerce which fits with their characteristics especially with organization conditions, for instance existence knowledge workers, financial and technology supports, and among many others. Web Site OverviewsEmerging e-commerce activities drive an expansion of the World Wide Web (WWW) being a revolutionary way to perform commerce, deliver services, educational programs, compete, and provide information and online transactions. There are some reasons for web surfing involving searching special information, random web-surfing, participation in contests and raffles (lottery), and word-of-mouth from other web enthusiasts (Dholakia & Rego, 1998).
Web site is defined as the interface that represents a user’s presence on the internet and furnished with text, graphics, animation and hyperlinks it enables access to various facilities offered to the user (Bandyo-padhyay 2002; O’Brien 2002; D’Angelo & Little 1998), as a “Web information system (WIS)” (Holck 2003), and as a collection of files or pages accessed through a Web address (http://www.getnetwise.org ).
Jurusan Manajemen Fakultas Ekonomi Universitas Andalas
40

Jurnal Bisnis&ManajemenJurnal Business & Manajemen Vol. 1, No.1, 2005
Classifying Web SitesThere are some different classifications of web site applications from previous studies. Each classification of web sites look at different aspects based on commercial sites (Hsieh & Lin 1998), facilitation of web sites (Sandy & Burgess 2003), adoption level of web sites (Teo and Pian 2004), and the technical sophistication, function, quantitative attributes (Yeung & Lu 2004), in detail as the following paragraphs show.
Similarly, Hsieh and Lin (1998) devised five types of commercial web site classification including:
1. Commerce sites or online storefronts refer to the web’s version of stores offering direct sales via an electronic catalog which represents a combination of direct marketing and in-store shopping.
2. Corporate information sites refer to the form of single page electronic flyers with no hyperlinks which provide detailed information about the firm and/or its products.
3. Content sites refer to an information broker which provides the form of searchable database.
4. Promotion or incentive sites refer to a unique form of advertising to attract consumers to the site and to pull the user to the commercial site behind it.
5. Search agent sites refer to search engines to identify and connect with other web sites through keyword search of a database.
Yeung and Lu (2004) classified commercial web sites based on functional classes which are cited from two prior studies (Hoffman, Novak, & Chatterjee and Capple & Myerscough) and then to characterize the web sites based on quantitative attributes as in table 1.
TABLE 1. Functional Classification of commercial web sites
Functional classes Web site properlyHoffman, Novak, and Chatterjee
Cappel and Myerscough
Online Storefront
Direct sales, virtual companies Number of products for ordering ≥ 1 and number of sellers = 1
Mall Number of products for ordering > 1 and number of sellers > 1
Internet presence
Indirect sales, marketplace awareness
Flat Page count = 1 Image
Information Customer support
ContentFee-Based Subscription-based electronic
information service (EIS)
Sponsored Advertising
Searchable database
Advertising
Incentive site
Search agent Number of external links approaches ∞Broadcast electronic information service (EIS)
Number of video clips is high and/or number of audio clips is high
Jurusan Manajemen Fakultas Ekonomi Universitas Andalas
41
Jurnal Bisnis&ManajemenJurnal Business & Manajemen Vol. 1, No.1, 2005
Source: Yeung and Lu, 2004Based on facilitation of web sites, Sandy & Burgess (2003) classified web sites within four levels include;
1. Electronic Brochure (EB); The web site contains information about the business and FAQ/ product usage directions
2. EB + Order: besides EB, the web site also has ordering capability.3. EB + Order + Payment: The web site has EB, order and payment facilities.4. Interactive Publishing: the web site represents as a fully interactive site
which includes direct goods download, personalization or gathering personal data, and frequent purchaser incentives.
Teo and Pian (2004) divided web sites into the five web adoption level according to the different business objectives including:
Level 0 : There is no web site , only an e-mail accountLevel 1 : Web presence while the implementation is still in processLevel 2: Prospecting which provides product information, news, events,
interactive content, personalized content, e-mail support, etc.Level 3: Business integration which has cross-functional links between
customers and suppliers.Level 4 : Business transformation which has the highest level of web
adoption.
Accordingly these classifications offered various opportunities to establish and develop the web sites with their characteristics especially meeting with organization conditions.
Web Success Indicator
The framework measures web site effectiveness in terms of “Use”. The literature identified numerous terms including (1) use that is “everything a visit to web site, to navigation within the site, to information retrieval, to execution of a transaction” (DeLone & McLean 2003, p.25), (2) web traffic is one of the most essential performance indicators of e-commerce success (Heijden 2003); Dholakia and Rego (2004) termed (3) daily hit-rate, Spiliopoulou et al. (2003) used the term (4) Session (visit) is “the group of activities performed by a user from the moment she/he enters the site to the moment she/he leaves it” (p.174) as the criterion of web page effectiveness. However this paper used the term “USE’, because it is simpler and easier to understand and these have the same meaning.
In addition, the literature points out that web site effectiveness dependent on the quality of web site designs which included system, information and service qualities as follows:
(1) The system quality refers to how good the system is in terms of its operational characteristics (Jennex et al.1998) or the information processing system itself (Delone & McLean 1992). The systems quality involved navigation, interactivity, accessibility, ease of use, entertainment, and presentation (Liu & Arnett 2000; Negash, Ryan & Igbaria 2002; Palmer 2002).
(2) The information quality refers to how good the system is in terms of its output (Jennex et al.1998) or information system output (Delone & McLean 1992). The information quality included informativeness, relevancy, accuracy, fitting with user needs, easy to understand and secure (D’Angelo and Little 1998; DeLone & McLean 2003; Katerattanakul & Siau 1999).
(3) The service quality refers to how good the service supplied by information service providers is to both internal organizations and external vendors (Dyke, Kappelman, Prybutok 1997). In detail, these factors are explained below in which are suitable with SME web sites. The service quality included availability, tangibles, reliability, responsiveness, empathy, and assurance
Jurusan Manajemen Fakultas Ekonomi Universitas Andalas
42

Jurnal Bisnis&ManajemenJurnal Business & Manajemen Vol. 1, No.1, 2005
(Cox & Dale 2001; Tsikriktsis 2002; Zeithaml, Parasuraman& Malhotra 2002).
Given explanations will give a crucial consideration for building the framework of web site success especially in SME circumstances. The next paragraphs present e-commerce and web site uses in SME and developing country contexts.E-commerce activities in Developing Countries The majority of e-commerce models are proposed by western country researchers in a developed country environment, therefore, it needs different features for Asian firms in developing countries’ circumstances (Lertwongsatien & Wongpinunwatana, 2003). To apply an e-commerce model from a developed country to a developing country it is necessary to find a more appropriate model which fits with their situation. The framework points out the web usage for SME environments have different situations with larger firms, because of the unique SME’s situations, resources, strategic, and others. There are a few studies in the following paragraphs to recommend the web effectiveness in SME’s contexts especially in developing countries likes Indonesia. The following paragraphs presented e-commerce and web sites in SME environments.
E-commerce and SMEsThe enormous growth of the internet technology has a profound impact on business activities across organizations especially in large companies which enjoy the benefits of experience, stronger foundations and greater resources (Bandyo-padyay 2002, p.261). On the contrary, the impact of the internet technology on small and medium enterprises (SMEs) is still a recent phenomenon (Seyal & Rahman 2003). Heart and Pliskin (2002) argued that enterprise size influences the ability of enterprise to use technology productively and competitively, since in the e-commerce context, size and location become irrelevant to perform any business process (Stansfield & Grant 2003). However, SMEs still face many obstacles on the way to full participation in e-commerce dealings (Costa 2001, p.50).
To identify the success of e-commerce business in SME’s environment depends on how it is managed, the education required, management practices and marketing to facilitate the integration of e-commerce into business planning rather than e-commerce technology itself (Pease & Rowe 2004). Therefore, SME’s e-commerce needs encouragement and assistance to adopt productively.
To anticipate three main limitations of e-commerce usages: skilled people, infrastructures and capital in SME contexts, Heart and Pliskin (2002) offered to use IS e-Rental via the internet of Application Service Providers (ASPs) as an appealing solution to complex and costly IT acquisition and implementation, that can benefit both ASP and SMEs. For an ASP, it can get percentages of purchases and for SMEs, it can reduce the expenditure for infrastructure, training, maintenances, and does not need stand-by 24 hours in business activities. Therefore, e-rental systems should be considered an opportunity for SMEs to enjoy the sophisticated internet technology.
Being more specific, Pimchangthong et all, (2003) conducted an Internet survey website, to identify five key issues of information systems (IS) in Indonesia; (1) IS human resources, (2) Data resources, (3) IS effective measurement (4) Telecommunication system & network, and (5) IS architecture. It illustrated that the role of human resources is the most important in IS usage in Indonesia, followed by system and technology itself. Further, the roles of informal networks of the culture context also influenced WWW users in Indonesian banking (Achjari & Quaddus 2002) in spite of Korpela (1996) arguing to involve cultural aspects in IS success factors in developing countries. Korpela identified the political economic effects in the IS use in developing countries rather than cultural contexts. Web Sites and SMEs
Jurusan Manajemen Fakultas Ekonomi Universitas Andalas
43

Jurnal Bisnis&ManajemenJurnal Business & Manajemen Vol. 1, No.1, 2005
Based on web site classifications in earlier paragraphs, Sandi and Burgess (2003) suggested that SMEs do not start with a complex web site, but web sites should be started from the basic “brochureware” site (electronic brochure) as informational web sites (Raymond, 2001), such as level 0 and 1 of Teo and Pian’s classification (2004). The SMEs should at least have e-mail account to establish connectivity with customers and business partners (level 0) using search engines or intermediary web sites. Also as a web presence (level 1), it provides simple information and brochures which tends to be non-strategic in nature in an independent domain name.
In addition, product/service types, target markets and the role of government and academics also are very important for web site effectiveness. Based on the type of products/services, consumers are likely ordering and paying for intangible and durable goods through internet and it is more suitable for the purchases that are infrequent, rather than frequent purchases (ex. Milk, petrol) because consumers are likely to purchase regularly as needed-time is vital and consumers buy the goods without conducting a major search for alternatives through the internet (Sandi and Burgess 2003). Further, selling products to local markets is first priority for SME web sites, such as Sellito, Wenn, and Burgess‘s study (2003) which reviews the web sites of Small Australian wineries. Hence it was followed by selling products to intrastate, interstate and overseas markets. The government supports are also needed to solve SME’s problems in using e-commerce systems. The government and academics can set up various initiatives such as e-commerce training workshops, access to e-commerce advisors, tax incentives to increase training budgets and programmers to give high quality advice (Stansfield & Grant 2003; Wagner, Fillis & Johansson 2003), also communicate the benefits and usefulness of e-commerce to managers/owners to encourage and support e-commerce adoption (Grandon & Pearson 2004). These views can be used to consider in establishing and developing web sites by SMEs in general. However, these should meet with firm characteristics and conditions. The next paragraphs present some ideas in particular web site designs.The quality of web sites in SME environmentMost studies employed the quality as a success measure in assessing e-commerce and commercial web site implementations. To define the meaning and influenced factors of the web site quality, the next paragraphs present the quality in three different categories, including system, information and service (DeLone & McLean, 2003).
System Quality for SME web sites in developing countries should be easy to use, navigates, and understands (D’Angelo and Little 1998; Kim & Stoel 2004; Palmer 2002). Accessibility is an important issue, which relates to speed and time as the number one complaint of web users especially in developing countries. Nevertheless, it depends on web technology including hardware and software (Gehrke & Turban 1999). Since limitations of the technology and funds, the presentation of information in the visual hypermedia (e.g. color, sound, graphic, three-dimensions) and the entertainment in SME web sites should be properly considered, however it should be able to convey messages to users and they are still enjoy visiting the web sites (Negash, Ryan & Igbaria 2002; Zhang, Keeling & Pavur 1999). On other words, web systems and designs should be considered such related to the weaknesses of SME conditions
Information quality is denoted as web contents which should be personalized, complete, relevant, easy to understand, secure, concisely and consistently represented (DeLone & McLean 2003; Katerattanakul & Siau’s (1999) and displays correct English (Asia Foundation 2002). Web sites also should be as the informativeness, relevant timely, up-to-date, and from an accurate source, and also fitting with user’s information needs that is able to accomplish their jobs (Kim & Stoel 2004). Service quality delivery through web sites is more important than low price and web presence as a crucial strategy to success, for instance product is delivered on time,
Jurusan Manajemen Fakultas Ekonomi Universitas Andalas
44

Jurnal Bisnis&ManajemenJurnal Business & Manajemen Vol. 1, No.1, 2005
e-mail is answered and availability of desired information can be accessed accurate delivery, accurate product representation (Zeithaml, Parasuraman & Malhotra 2002; Cox & Dale 2001), or quick responsiveness and follow-up service (Liu & Arnett 2000). Since privacy and security are vital criteria in online service (Addison 2003), public web sites have begun to post privacy policies or statements regarding online collection, use, and dissemination of personal information (Liu & Arnett 2002) to give an assurance for web users.
Briefly, the web site effectiveness is related to the quality and simplicity of design, the type of images displayed and the quality of English used to describe products and services. Web sites should be registered in search engines to easier to found by potential users. Beside that, SMEs web sites also require the supported from outsiders such as government, and industry-academia linkages.ConclusionThis paper presented some preliminary studies in relation to the web effectiveness within SME circumstances. The effective web sites of SME environments are generally denoted as visited by users in web sites. Based on the literature, the web quality is believed to have a prominent role in facilitating web site effectiveness. It is made up of three proxy variables: system quality, information quality, and service quality reflecting the circumstances by which SMEs are able to attract potential web users and surf longer in web sites. This paper also presented generally overviews of e-commerce and web sites to view a simple picture of SME and developing country circumstances. These views would be used as fundamental considerations to establish and develop own web sites with supports from the outsider such as the government, and industry-academia linkages. Finally, the finding will be built main fundamentals to develop conceptual frameworks of further study in Indonesia SMEs and developing countries.
Jurusan Manajemen Fakultas Ekonomi Universitas Andalas
45

Jurnal Bisnis&ManajemenJurnal Business & Manajemen Vol. 1, No.1, 2005
REFERENCES
Achjari, D., & Quaddus, M., 2002, Roles of Formal/Informal Network and Perceived Compatibility in the Diffusion of WWW: The case of Indonesia banks, Proceedings of the 36th Hawaii International Conference on System Science, IEEE Computer Society Press, Maui.
Addison, T., 2003, E-Commerce project development risk: evidence from a Delphi survey, Information & Management, 23(1), p. 25-40.
Bandyo-padhyay, N., 2002, E-commerce: Context, Concepts and Consequences, McGraw-Hill, New York.
Berry, A., Rodriguez, E., & Sandee, H. 2002, ‘Firm and group dynamics in the small and medium enterprise sector in Indonesia’, Small Business Economics, 18, 1-3.
Costa, E. d. 2001, Global e-commerce strategies for small businesses, MIT Press, Cambridge, Mass.Cox, J., & Dale, B., 2001, Research and concepts service quality and e-commerce: an
exploratory analysis, Managing Service Quality, 11(2), 121-131.D’Angelo, J. & Little, S., 1998, Successful web pages: what are they and do they
exist?, Information Technology and Libraries, 17(2), 71-81.DeLone & McLean, E R., 1992, ‘Information systems success: the quest for the
dependent variable’, Information Systems Research, 3(1), 60-95._________ ,& _________, 2003, ‘The DeLone and McLean model of information systems
success: A ten-year update’, Journal of management Information Systems,19(4), 9-30.
Dholakia & Rego, 1998, ‘What makes commercial web page popular? An empirical investigation of webpage effectiveness, European Journal of Marketing, 32(7/8), 724-730.
Dyke, T., Kappelman, L., Prybutok, V., 1997, ‘Measuring information systems service quality: Concerns on the use of the SERVQUAL questionnaire’, MIS Quarterly21(2), 195-208.
Gehrke, D., & Turban, E., 1999, Determinants of successful website design: relative importance and recommendations for effectiveness, proceeding of the 32nd
Hawaii International Conference on Systems Science.Grandon, E., & Pearson, M., 2004, ‘E-commerce adoption: perceptions of
managers/owners of small and medium sized firms in Chile’, Communication of the Association for Information Systems, 13, 81-102.
Heart, T & Pliskin, N., 2002, ‘Business-to-business eCommerce of information systems: Two cases of ASP-to-SME eRental’, Information and operational Research / INFOR, 40(1); 23-34.
Heijden, H., & Verhagen, T., 2004, Online store image: conceptual foundation and empirical measurement, Information & Management, 41, 609-617.
Holck, J., 2003, ‘4 Perspectives on Web Information Systems’, Proceeding of the 36th
Hawaii International Conference on System Science, [Online], Available: http://web.cbs.dk/staff/holck/, Accessed 30 June 2004.
Hsieh, Ct., & Lin, B., 1998, Internet commerce for small businesses, Industrial Management + Data Systems, 98(3), 113-121.
ID DOMREG , 2005, [Online] Available: www.idnic.net.id/, Accessed 14 Februari 2005.
Indonesia Cooperative Department. 2004, ‘Indikator makro ekonomi usaha kecil dan menengah tahun 2003’, [Online], Available: http://www.depkop.go.id/ berita_resmi/index.htm, [Accessed 4 April 2004].
Jennex, M., et al., 1998, An organizational memory information systems success model: an extension of DeLone and McLean’s I/S success model, Proceeding Hawaii International Conference on Information Systems, Hawai.
Katerattanakul & Siau, 1999, Measuring Inf. Quality of web site: development of an instrument, Proceeding of the 20th International Conference on Information Systems, [Online], Available; http://potal.acm.org, Accessed; 16 June 2004.
Jurusan Manajemen Fakultas Ekonomi Universitas Andalas
46

Jurnal Bisnis&ManajemenJurnal Business & Manajemen Vol. 1, No.1, 2005
Kim, S., & Stoel, L., 2004, Dimensional hierarchy of retail website quality, Information & Management, 41, 619-633.
Korpela, M., 1996, ‘Traditional culture or political economy? On the root causes of organizational obstacles of IT in developing countries, Information Technology for Development. Amsterdam ,l.7(1), 29-42.
Lertwongsatien, C., & Wongpinunwatana, N., 2003, E-commerce adoption in Thailand: an empirical study of small and medium enterprises (SMEs), Journal of Global Information Technology Management, 6(3), 67-83.
Liu, C, & Arnett, K P. 2000, ‘Exploring the factors associated with Web site success in the context of electronic commerce’, Information & Management, 38, 23-33.
Molla, A., & Licker, P.S. 2001, ‘E-commerce systems success: an attempt to extend and respecify the Delone and MacLean model IS success’, Journal of Electronic Commerce Research, 2(4), 131-141.
Negash, S., Ryan, T., & Igbaria, M., 2003, Quality and effectiveness in web-based customer support systems, Information & Management, 40, 757-768.
O’Brien, J., 2002, ‘Management information systems: managing information technology in the business enterprise, McGraw-Hill, USA.
Orbeta, Aniceto, C., 2002, ‘E-commerce in Southeast Asia: A review of developments, challenges, and issues’, in Information Technology in Asia, by Yue, Siow, Chia & Lim, Jerome, Jamus, Institute of Southeast Asian Studies, Singapore, p. 111-146.
Palmer, J.W. 2002, Web site usability, design and performance metrics, Information Systems Research, 13(2), 151-167.
Pease, W., & Rowe, M., 2004, E-commerce and small and medium enterprises (SMEs) in regional community, [Online], Accessed 19 May 2004, Available: http://www.usq.edu.au/users/pease/publications/E-commerce%20and%20SMEs.pdf.
Raharjo 1999 Raharjo, B. 1999,’ Implementing ecommerce in Indonesia’, [Online], Available: http://budi.insan.co.id/articles/1999-02.pdf, [Accessed 2 April 2004].
Sandy, G., & Burgess, S., 2003, A decision chart for small business web site content, Logistics Information Systems, 16(1,), 36-47.
Sellito, C., Wenn, A., & Burgess, S., 2003, A review of the web sites of small Australian wineries: motivations, goals and success, Information Technology and Management, 4(4), 215-232.
Seyal, Afzal,H. & Rahman, Mohd, N., A, 2003, A preliminary investigation of e-commerce adoption in small & medium enterprises in Brunei, Journal of Global Information Technology Management, 6(2), 6-26.
Sharma, S., & Gupta, J., 2003, Socio-Economic influences of e-commerce adoption, Journal of Global Information Technology management, 6(3), 3-21.
Spiliopoulou et al. 2003, A framework for the evaluation of session reconstruction heuristics in web-usage analysis, INFORMS Journal on Computing, 15(2), 171-190.
Stansfield, M., & Grant, K., 2003, An investigation into issues influencing the use of the internet and electronic commerce among small-medium sized enterprises, Journal of Electronic Commerce Research, 4(1), 15-33.
Teo, T., & Choo, W., 2000, Assessing the impact of using the internet for competitive intelligence, Information & Management, 39, 67-83.
______, Pian, 2004, A model for web adoption, Information & Management; 41, p. 457-468.
The Asia Foundation, 2002, [Online], Available: www.asiafoundation.org/pdf/SMEsurvey, Accessed 14 December 2005.
Tsikriktsis, N, 2002, Does culture influence web site quality expectations?, Journal of Service Research, 5(2), 101-112.
Turban, E., & King, D., 2003, Introduction to E-commerce, Pearson Education, USA.Utomo, H., & Dodgson, M., 2001, Contributing factors to the diffusion of IT within
small and medium-sized firms in Indonesia, Journal of Global Information Technology Management, 4(2), p.22-37.
Jurusan Manajemen Fakultas Ekonomi Universitas Andalas
47

Jurnal Bisnis&ManajemenJurnal Business & Manajemen Vol. 1, No.1, 2005
Wagner, B., Fillis, I., & Johansson, U., 2003, E-business and e-supply strategy in small and medium sized business (SMEs), Supply Chain Management: An International Journal, 8(4), 343-354.
Wicaksana I Wayan, & Wiryana I Made, 1999, Web Sebagai Media marketing Media (translated), [Online], available: http://wiryana.pandu.org/artikel/Web-Market/, Accessed: 23 August 2004.
Wolcott et.al, 2001, A frame work for assessing global diffusion of the internet, Journal of the Association for Information Systems, 2(6), 1-50.
Yeung, W., & Lu, M., 2004, Functional characteristics of commercial web sites: a longitudinal study in Hong Kong, Information & Management, 41, 483-495.
Zhang, Keeling, & Pavur, 1999, Information quality of commercial web site home page: an explorative analysis, Proceeding of the 20th International Conference on Information systems, [Online], Available: http://portal.acm.org, Accessed 17 June 2004.
Zeithaml, V.A., Parasraman, A., & Malhotra, A., Service quality delivery through web sites: a critical review of extant knowledge, Journal of the Academy of Marketing Science, 30(4), 362-375.
Zwass 1998, Foundation of Information Systems, International Edition, McGraw-Hill, America.
Jurusan Manajemen Fakultas Ekonomi Universitas Andalas
48

Jurnal Bisnis&ManajemenJurnal Business & Manajemen Vol. 1, No.1, 2005
MANAGING CULTURAL DIVERSITY AND ITS APPLICATIONIN THE BUSINESS GLOBAL CONTEXT
Harif Amali Rivai
Abstract
The world’s dramatic shifts require more than traditional approaches to managing business in the global context. One of mayor issue in managing organization in global scale is cultural diversity. Global strategies and approaches to managing diverse workers have become a new requirement for managers. It will affect the roles of managers in making business decisions. To address these issues, the current paper attempts to discuss: (1) background to globalize organization, (2) the challenges of managers in a global market and (3) East-West comparison of management roles and structures especially in decision making toward on the cultural diversity issues. The discussion also highlights (4) the roles and structures in decision making (i.e. comparison between Japan and The United States), (4) cultural diversity and hybridity, and (6) enrichment strategies for (cross cultural) change management.
Keyword: Cultural diversity, global business
IntroductionImpacts of changing external environment have demanded managers to be
sensitive in terms of managing their businesses. Development of science and technology brings about the significant effect on the business environment. Flow of the information among of countries, regions, companies or individuals will run almost borderless, so that anyone, and whenever possible to access sources of information. Businesses operation takes place in the world as a ‘global village’ which means no borders between different countries. Resources are easy to move from one country to other countries. Each company needs managers to understand what will be the effect of this situation.
Globalization is defined as interdependency of transportation, distribution, communication, and economic networks across international borders (Gibson, Ivancevich & Donnelly 2000). Globalization creates some challenges and opportunities for the company to run their business operations. One of the challenges that must be faced especially by the global corporations or MNCs – Multinational Companies – is cultural diversity. Global strategies and approaches to managing diverse workers have become a new requirement for managers. In global companies, cultural diversity in the companies is likely to improve the company’s performance if the manager can manage it well. On the contrary, if it is not managed well, conflicts among employees may occur and it will affect company’s performance. Therefore, the availability of highly qualified managers extremely determines sustainability of MNCs in global markets.
In addition, in the age of globalization, all companies do not only compete with local companies, but also international companies. This reflects that the companies do not operate in the stable environment, yet they operate in the dynamics competition. Today, the circumstances of the environment are more turbulent or unpredictable. These circumstances force the companies to look for managers who have ability in management of change. This paper accounts for: (1) background to globalize organization, (2) the challenges of managers in a global market, (3) East-West comparison of management roles and structures especially in
Jurusan Manajemen Fakultas Ekonomi Universitas Andalas
49
Jurnal Bisnis&ManajemenJurnal Business & Manajemen Vol. 1, No.1, 2005
decision making toward on the cultural diversity issues. The discussion will be focused on management roles and structures in Japan and The United States, (4) cultural diversity and hybridity, and (5) enrichment strategies for (cross cultural) change management.
Background to Globalising OrganisationsEach company usually starts from small company and then it develops to
become larger company. At the first time, it only serves a limited number of consumers. As the company growing, it does not only serve local market, but then it can serve regional, national, and international markets.
To reach the opportunity to enter foreign markets will be challenging for many business people in many countries. Some of them fail to reach these opportunities. Yet, there are also some business people who have struggled for many years and have been success in developing their business in foreign markets. These people try to develop their businesses not only in a limited number of countries, but they also try to enter a global market in many different countries.
To enter global markets, there are three aspects that need to be considered. First, the company’s product quality has been considered high. In other word, the products have been proved in satisfying their own national market. The only creative and innovative companies can produce these highly quality products which finally can satisfy their consumers. One of key success factors of global corporations is offering universal standardized product for a homogeneous world market. Second, the government support will also become an important factor for the company’s success to enter a global market. For example, the Australian government introduced deregulation in 1998 to help Australian business to enter global markets (James, 1999). Third, without understanding people where the business will be developed, it will not warranty that the company will survive in its new market. James (1998) points out that if a company wants to enter global market, it needs to recognize what people believe about value and also what the rule is in which the societies follow in their lives.
Table 1. The Developing of Business OrientationPhase I
DomesticPhase II International Phase III Multinational Phase IV Global
Jurusan Manajemen Fakultas Ekonomi Universitas Andalas
50

Jurnal Bisnis&ManajemenJurnal Business & Manajemen Vol. 1, No.1, 2005
Primary orientation
Competitive strategy
Importance of world business
Product/service
Technology
R&D/Sales
Profit margin
Competitors
Market
Production location
Exports
Structure
Cultural sensitivity
Product/service
Domestic
Marginal
New, unique
Proprietary
High
High
None
Small, domestic
Domestic
None
Functional divisions
CentralizedMarginally important
Market
Multidomestic
Important
More standardized
Shared
Decreasing
Decreasing
Few
Large, multidomestic
Domestic and primary market
Growing, high potential
Functional with international division
Decentralized
Very important
Price
Multinational
Extremely important
Completely standardized (commodity)
Widely shared
Very low
Very low
Many
Large, multinational
Multinational, least cost
Large, saturated
Multinational line of business
Centralized
Somewhat important
Strategy
Global
Dominant
Mass-customized
Instantly and extensively sharedVery high
High, yet immediately decreasingSignificant (few or many)Largest, global
Global, least cost
Import and exports
Global alliances
Coordinated, centralizedCritically important
Source: Adapted from Gibson, Ivancevich & Donnelly (2000), p. 55There will be many places in the world that many companies can develop
their businesses. The more these companies have the opportunities to develop their businesses in a global market, the more they have to learn about people in different countries with different cultures. The ability to diagnose customer needs, manage effective global alliances is crucial to succeeding in the global market. The evolution of business from being primarily domestic-base and oriented and to more globally oriented will require new thinking and new managerial skill, such as cross-cultural management, global strategic, team-building skills, organization skills, communication skills, transfer of knowledge skill. The developing stages of business orientation from domestic to global can be seen in table 1.
Challenges for Managers in a Global MarketThe development of communications technologies allows information to flow
via the internet in ways unimaginable in previous generations. The world economy has become much more integrated than in the past, and management’s system has struggled to keep pace with the unsteady pace of change. This phenomenon allows for increased number of challenges global manager. In a global market, multinational managers will face some challenges that include cultural diversity, government, competitor, and non-government organizations (NGOs).Cultural Diversity Challenges. Why the company needs to manage the cultural diversity? Diversity of the culture in multinational company when is managed well, it will bring out the company competitive advantage. On contrary, diversity in the multicultural company may increase interpersonal conflict, so that the company
Jurusan Manajemen Fakultas Ekonomi Universitas Andalas
51

Jurnal Bisnis&ManajemenJurnal Business & Manajemen Vol. 1, No.1, 2005
performance will decline. This is caused the managers are not able to manage those cultural diversity. To operate in a global market the managers have to pay attention to some following factors:
Understanding culture where the company will operate – host country. The managers must recognize host country culture in order to satisfy customer need whether they are internal customers– employees – or external customers – buyers.
Balancing between global thinking and sensitivity toward the individual’s own national or local context (act locally, think globally). In this way the company will be success operating in the new country due to the managers apply acceptable means by local community.
Using human resources from local country. The managers must recruit employees who come from company operation located. Furthermore, the company must develop and have to train those people who have met the company requirements.Government. Some of challenges that are faced by multinational managers:
Supporting from host country government to foster the business includes political and economical stability of countries where the company will operate.
The managers must consider balancing of interest between the business and government. For example, minimum labor wages and taxes.
Sometime the managers need to manipulate government regulations in order to find precise area to operate.Competitor Challenge. The multinational manager in a global market will meet with threat over lost of ownership because the strong competitor will take over other companies. It can be conducted in different ways such as merger, acquisition, hostile take over, or friendly take over. Therefore, the managers must identify each competitor that is operating in the host country and also the competitor which will come into the market. The managers may apply SWOT (strength, weakness, opportunity, and threat) analysis to facilitate better decision making dealing with global market.Market Challenge. The managers are up against challenge to changing of consumer behavior in the global market. The manager should consider some important points:
Clear market focus according to its target market.Developing local supplier, in other word, making consensus – strategic
alliance - with local supplier take into account cost of production and develop the business community.
Economics of scale will influence selling price and company market share.NGOs. The role of NGOs in the developing countered usually as a social control. However, sometime they perfume a unethical action to the company because they have other interest that will come up a damage. The managers are demanded able to identify this possibility.
Managers Roles and Structures in Decision Making:Comparison between Japan and the US.
According to Smircich and Kilmann, cited by Bertol et.al (2001), “culture is a system of shares values, assumption, beliefs, and norms uniting organisation members”. Different countries may have their own different cultures. Each culture will affect people how to behave. The effect is that it affects the way in which people doing business (Trompenaars, 1998). Japan and the US are two countries which many business scholars recognize them to have every different culture. Japan has its own collective culture, while the US is more individualistic culture (Howe, 1987). These East and West different cultures reflect the ways they solve business problems. Even though they have different ways, but many of them are very success in developing their businesses.
Jurusan Manajemen Fakultas Ekonomi Universitas Andalas
52

Jurnal Bisnis&ManajemenJurnal Business & Manajemen Vol. 1, No.1, 2005
One important aspect in management that determines the success of business is how to make good decisions. Because of cultural differences, Japan and the US have their own approach in making business decisions. Managers of these two countries have to have a deep understanding about these unique different cultures. These differences bring about different roles and structures in which manager’s approach to make good decisions. These roles and structures particularly related to how managers interact with their subordinates in the decision making process. The involvement of subordinates in decision making in Japan is obvious, while this involvement is less in the US. Because of these different subordinates involvement, Japan has a more complex structure in decision making while the US seems to be simple.
There are three roles in which managers in Japan and in the US are different in their approaches to their subordinates in the decision making process. These roles relate to information collection roles, interpersonal roles, and communication roles. Because of its collective culture, managers in Japan usually collect information from their staff. Input from staff is considered as important information to produce high quality or effective decisions. It reflects manager’s trust to their subordinates, and reflects subordinates sense of belonging to their companies. In contrast, managers in the US usually do not involve many of their staff in collecting information. Decisions are also made with less subordinates involvement. Most of them make decisions by themselves. Because of their highly qualified managers, due to tough competition to be managers, many of them can produce good decisions and bring their companies to reach their objectives.
Closely related to Japanese manager’s approach in collecting information, the closeness of managers to their subordinates is obvious. Manager’s interpersonal role is reflected by this closeness. Subordinates will consider their managers more as part of their "family" rather than “just company relationship”. On the other hand, American managers are more individualistic. Relationship between managers and subordinates seems to be very “company’s relationship”. As long as these two parties responsible for their job, in other words if they pay much attention to improve their performance, less interpersonal role will not hamper managers to make effective decisions.
Different cultures also result in different communication roles between these two countries. It can be seen that in Japan there are two ways of communication among managers and their staff. Therefore, in the decision making process, managers will have roles in which they build communication to their staff and also to bridge communication among staff. In the US, because communication is usually one way, the US managers will have a less role in bridging communication among their staff. Related to previous roles, as long as the US companies have highly qualified managers, they also can produce many good decisions.
Due to cultural differences, both countries have different approaches in the decision making process. Even though these differences exist, up to now it is not possible to conclude that there is one best approach in making effective decisions. It is more important to understand each of these, and to use this understanding as knowledge in practicing business within these two countries.
Cultural Diversity and Hybridity Globalisation may have a specific meaning that is borderless among
different countries for people to work wherever they want to go. Establishing companies in other countries will bring opportunities not only to people from where the company comes from to work, but also to local people where the company will be located, and other people from around the world. Therefore, each company may have employees with different ethics, nationalities, or religions.
Companies with cultural diversity may be better than companies with single culture. People with different culture will have their own ways to do the best in their
Jurusan Manajemen Fakultas Ekonomi Universitas Andalas
53
Jurnal Bisnis&ManajemenJurnal Business & Manajemen Vol. 1, No.1, 2005
work. Since management can recognize these ways, and carefully managing them, they may bring a positive impact in improving the companies’ performance. It is not important to establish business in abroad if the companies bring their all workers from their countries. It is also not possible to employ most of them, but only a few of local employees. If this happens, jealousy among local people will occur, and this will be dangerous for the live of companies in the future. Newmont NNT, a mining company in Indonesia, has received several protests from local people in order to employ them rather than to employ other people from other regions, even less employing foreign people. Some companies have been very successful in developing their business in overseas, and in fact they employ more local people rather than non-local. James (1999) suggests that companies should recruit local employees as much as possible in order to maintain their business in foreign countries.
Many companies may face difficulties when the number of qualified local people is limited. Rather than employing other people which highly risky, it is better for the companies to develop local people skills and knowledge. This development should be the basic aspect for further development that is to create highly creative and innovative local employees (and also other employees). The only companies that have creative and innovative employees will survive in the rapid change of environment (Kingsley, 1999; Malhotra, 1998; DeLacy, 1999). In order to improve employee’s creativity and innovation, the company’s leaders need to motivate their employees. Employees need to have a clear understanding related to promotion, performance appraisal, rewards system, and training and development. Each employee should be treated fairly in all of these aspects.
Enrichment Strategies for Cross Cultural Management Cross cultural management involves the study of the behavior of individuals
in organization around the world. Basically the study is concerned with organizational behavior within countries and cultures; compares organizational behavior across countries and cultures; and attempts to understand and improve the interaction and behavior of co-workers, clients, suppliers, and alliance partners from different countries and cultures.
Companies operate in global market should be leaded by ‘global manager’ who views markets, production, service, and opportunities globally and who seeks higher performance for the firm on a global basis. A high performance organization will be affected by the nature of creativity and innovation in managing the organization. The creativity and innovation will depend on two elements: appropriateness management system and human factor. Appropriateness management system means the company’s policies towards training and development, performance appraisal, rewards system, and promotion are understood and highly accepted by their employees. Employee’s happiness in doing their job will also contribute to improve their creativity and innovation. Employee’s happiness may be resulted from the appropriateness of management system, but the source of happiness is also come from the respect that other people give towards their culture of origin.
Many business people have thought about these two elements. They have tried to improve the system and also to create employee’s happiness. Better policies have been set up related to training and development, performance appraisals, promotion, and rewards system. Yet, from these four components, the practices of rewards system still need to be developed. Rewards system is not merely giving employees with appropriate rewards, but it is also important for the companies to educate their employees to optimize the utilization of their rewards. The result of this is that employees will remember and enjoy their rewards for longer time. The more they enjoy their rewards, the longer the time they feel happy in the companies.
Jurusan Manajemen Fakultas Ekonomi Universitas Andalas
54
Jurnal Bisnis&ManajemenJurnal Business & Manajemen Vol. 1, No.1, 2005
Employees’ happiness can also be created through more sophisticated approach towards employees’ culture of origin. Employees may feel very angry and insulted when other people do not respect their cultures. On the other hand, they will be very happy if other people pay much attention and respect to their cultures. So, business people need to try as best as possible to promote and strengthen various cultures in their companies.
Promoting and strengthening employees cultures means that: first, companies should provide environment in which each employees proud about their own cultures; second, the companies should look for unique culture which can be brought into developing organisational culture; third, the companies can give employees opportunities to demonstrate other aspects of their culture in both formal or informal activities; and fourth, the companies should create environment in which people in the companies will respect each other. Learning other unique cultures may give enjoyment for many people in the companies, such as: learning some of their words of origin, or learning their specific foods, arts, even sports. All of these activities will bring happiness to employees who will contribute to improve employees’ creativity and innovation.
ConclusionThe practice of management for global companies always deals with cultural
diversity. Different culture means that there is also a difference in doing business. Managers for global companies should think about these cultural differences. Adaptation to the host countries culture may need to be made. Each culture has their unique culture. Even though they have different ways in doing business, but they are success in developing their business. Japan with its collective culture and the US with its individualistic culture are good examples for this explanation.
Companies operate in overseas need to employ as much as local people. Employees training and development need to be conducted to meet company’s knowledge and skill requirements. Further development should be focused on improving employee’s creativity and innovation, because these aspects will help the companies to adapt to the rapid change of environment. In addition to improving employee’s knowledge and skill, it is also important for the companies to create appropriate management system and employee happiness in order to improve employee’s creativity and innovation. More sophisticated approaches to rewards system need to be created to increase employees proud about their rewards. It is also important for the companies to promote and strengthen employee’s culture of origin. All of these approaches will contribute to improving employee’s creativity and innovation that will lead to improving company’s performance.
REFERENCES
Bertol, K.M., Martin,D.C., Tein, M., & Matthews, G. 2001. Management: A Pacific Rim Focus, 3rd
ed, Sydney:McGraw-Hill.De Lacy, A. 1999. Understanding The Knowledge Worker, HR Monthly, February, pp. 20-22.Gibson, J. L., Ivancevich, J.M., & Donnelly, J. H. 2000. Organizations : Behavior, Structure,
Processes, 10th ed, New York: Irwin McGraw-HillHowe, B. 1987. Portfolio, Case Studies for Business English, Longmann, Essex-England.James, D. 1999. Globalization, Business Review Weekly, September 24, pp.69-75.Kingsley, H. 1999. A New Paradigm for CEO’s, HR Monthly, July, pp.28-29.Malhotra, Y. 1998. Knowledge Management for the New World of Business,
http://www.brint/kom/km/whatis/htn.Trompenaars, F. 1998. “One best way” of managing, Riding the Waves of Culture:
Understanding Cultural Diversity in Global Business, 2nd edn, New York:McGraw-Hill.
Jurusan Manajemen Fakultas Ekonomi Universitas Andalas
55

Jurnal Bisnis&ManajemenJurnal Business & Manajemen Vol. 1, No.1, 2005
ANALISIS KEPUASAN PASIEN RAWAT JALAN PADA PUSAT KESEHATAN MASYARAKAT
(Suatu Survey pada Puskesmas Kampung Dalam di Kabupaten Padang Pariaman)
Ratni Prima Lita
ABSTRAK
Penelitian ini dilatarbelakangi oleh pentingnya kualitas jasa bagi konsumen pada Pusat Kesehatan Masyarakat (PUSKESMAS). Penelitian ini dilakukan pada Puskesmas Kampung Dalam di Kabupaten Padang Pariaman dengan mengambil 100 responden sebagai sampel. Penelitian ini bertujuan untuk mengetahui 1) tingkat kepuasan pasien rawat jalan dan mutu pelayanan di Puskesmas, 2) tingkat kepentingan pasien rawat jalan terhadap masing-masing dimensi yang dijadikan sebagai ukuran dalam pelaksanaan pepelayanan di Puskesmas. Ada beberapa aspek dimensi kualitas yaitu; tangibles, empathy, reliability, responsveness dan assurance.
Hasil penelitian ini memperlihatkan: 1) Tingkat kepuasan konsumen berkisar pada 73,99% sampai 81,56% yaitu berada pada kriteria memuaskan sampai sangat memuaskan. Tingkat kepuasan paling tinggi yaitu pada aspek tangibles, kemampuan dan keahlian yang dimiliki Dokter dalam melayani konsumen dan yang paling rendah yaitu pada aspek tangibles, tingkat kenyaman Puskesmas. Kualitas jasa merupakan gap antara jasa yang diterima (kinerja) dengan jasa yang diharapkan (harapan). Gap antara jasa yang diterima (kinerja) dengan jasa yang diharapkan (harapan) tidak terlalu besar, tetapi gap antara jasa yang diterima (kinerja) dengan jasa yang diharapkan (harapan) konsumen dapat dijadikan ukuran terhadap proses pepelayanan kesehatan di Puskesmas Kampung Dalam Kabupaten Padang Pariaman. Gap yang paling tinggi yaitu pada aspek tangibles, tingkat kenyamanan Puskesmas (-1,09), dimana konsumen merasakan kondisi di Puskesmas kurang nyaman seperti ruang tunggu yang tidak memadai. Gap yang paling rendah yaitu pada aspek tangibles, peraturan-peraturan yang diterapkan oleh pihak Puskesmas, dan 2) Tingkat kepentingan konsumen terhadap masing-masing aspek berkisar pada skor 416-440 yaitu sangat penting. Gap antara jasa yang diterima (kinerja) dengan jasa yang diharapkan (harapan) tidak terlalu besar, dan gap antara jasa yang diterima (kinerja) dengan jasa yang diharapkan (harapan) konsumen dapat dijadikan ukuran terhadap proses pepelayanan kesehatan pada Puskesmas Kampung Dalam di Kabupaten Padang Pariaman. Gap yang paling tinggi yaitu pada aspek tangibles, tingkat kenyamanan Puskesmas (-1,09), dimana konsumen merasakan kondisi di Puskesmas kurang nyaman seperti ruang tunggu yang tidak memadai. Gap yang paling rendah yaitu pada aspek tangibles, peraturan-peraturan yang diterapkan oleh pihak Puskesmas.
Keyword: kepuasan, kualitas jasa
PENDAHULUAN
Jurusan Manajemen Fakultas Ekonomi Universitas Andalas
56
Jurnal Bisnis&ManajemenJurnal Business & Manajemen Vol. 1, No.1, 2005
I.1. Latar Belakang PenelitianPembangunan di bidang kesehatan yang semakin komplek perlu
ditingkatkan dengan memantapkan dan mengembangkan Sistim Kesehatan Nasional berdasarkan pada landasan idiil Pancasila dan landasan konstitusional UUD 1945.
Kesehatan merupakan salah satu unsur kesejahteraan umum yang harus diwujudkan sesuai dengan cita-cita bangsa Indonesia. Dalam upaya mewujudkan derajat kesehatan yang optimal bagi seluruh lapisan masyarakat baik yang ada di kota maupun yang ada di desa, maka dibangunlah suatu pusat kesehatan masyarakat atau yang lebih dikenal dengan sebutan “PUSKESMAS“. Puskesmas merupakan suatu kesatuan organisasi kesehatan yang berperan sebagai pusat pengembangan kesehatan masyarakat dan juga membina peran serta masyarakat disamping memberikan pepelayanan kesehatan secara menyeluruh dan terpadu kepada masyarakat didalam wilayah kerjanya.
Puskesmas Kampung Dalam adalah salah satu Puskesmas di Kabupaten Padang Pariaman yang menyediakan pepelayanan rawat inap dan rawat jalan. Jumlah Pasien rawat inap dan rawat jalan periode 1998-2002 terlihat pada Tabel 1 berikut ini:
Tabel 1.1Jumlah Pasien Rawat Inap dan Rawat Jalan pada Puskesmas Kampung Dalam Kabupaten Padang Pariaman Tahun1997-2001 (dalam Orang)
Tahun Pasien Rawat Inap
Pasien Rawat jalan
Jumlah
1997 104 11.365 11.4691998 - 22.648 22.6481999 32 27.578 27.6102000 38 22.750 22.7882001 14 15.193 16.168
Jumlah 100.683Sumber: Puskesmas Kampung Dalam (2001)
Dari Tabel 1.1 dapat dilihat jumlah pasien rawat jalan jauh lebih banyak dari jumlah pasien rawat inap, hal ini disebabkan terbatasnya fasilitas pepelayanan rawat inap, sehingga pasien banyak yang dirujuk ke Rumah Sakit Umum Pariaman. Jumlah pasien rawat jalan dari tahun ke tahun berfluktuasi dan mengalami penurunan yang cukup tajam pada tahun 2001.
Puskesmas Kampung Dalam, sebagai salah satu sarana pepelayanan kesehatan kepada masyarakat diharapkan dapat memberikan pepelayanan yang baik. Kualitas pepelayanan harus mendapat perhatian yang cukup dari pihak Puskesmas. Harus disadari bahwa sebagai pemberi jasa pihak Puskesmas harus bisa memberikan jasa yang sesuai dengan harapan konsumen.
Proses pepelayanan di Puskesmas merupakan interaksi antara pemberi jasa (tenaga medis, paramedis dan non-medis) dan penerima jasa (pasien/konsumen). Sebelum mendapatkan pepelayanan penerima jasa mempunyai harapan-harapan yang ingin dia peroleh setelah menerima pepelayanan. Harapan konsumen timbul karena saat memutuskan memilih Puskesmas tertentu mereka mempunyai kebutuhan pribadi yang ingin dipenuhi dengan memilih Puskesmas tersebut. Harapan tersebut juga timbul karena mereka telah mendapatkan berbagai informasi dari konsumen lain serta pengalamannya dalam memilih Puskesmas sebelumnya.
Agar dapat memberikan kepuasan pelanggan (pasien), tenaga medis, paramedis dan non-medis sebagai pengantar jasa (service provider) harus
Jurusan Manajemen Fakultas Ekonomi Universitas Andalas
57

Jurnal Bisnis&ManajemenJurnal Business & Manajemen Vol. 1, No.1, 2005
mempunyai kinerja (performance) yang dapat memenuhi harapan dari penerima jasa (customer expectation). Apabila penerima jasa merasa puas, berarti kualitas jasa yang disampaikan sesuai dengan harapan penerima jasa. Berangkat dari pemikiran-pemikiran diatas penulis tertarik mengangkat permasalahan untuk diteliti yaitu: ANALISIS KEPUASAN PASIEN RAWAT JALAN PADA PUSAT KESEHATAN MASYARAKAT (Suatu Survey pada Puskesmas Kampung Dalam di Kabupaten Padang Pariaman).
1.2. Perumusan MasalahBerdasarkan uraian di latar belakang pada butir 1.1. penulis merumuskan
masalah penelitian sebagai berikut:a. Bagaimana tingkat kepuasan dan mutu terhadap pelaksanaan proses
pepelayanan di Puskesmas?b. Bagaimana tingkat kepentingan konsumen (customer importance rating)
terhadap masing-masing dimensi yang dijadikan sebagai ukuran dalam pelaksanaan pepelayanan di Puskesmas?
1.3. Tujuan PenelitianAdapun tujuan penelitian ini adalah:
a. Untuk mengetahui tingkat kepuasan dan mutu pelayanan pada Puskesmas Kampung Dalam di Kabupaten Padang Pariaman.
b. Untuk mengetahui tingkat kepentingan konsumen (customer importance rating) terhadap masing-masing dimensi yang dijadikan sebagai ukuran dalam pelaksanaan pepelayanan pada Puskesmas Kampung Dalam di Kabupaten Padang Pariaman.
1.4. Manfaat Penelitian Dari hasil penelitian diharapkan:
a Dapat memberikan manfaat dalam hal pengembangan ilmu manajemen, khususnya manajemen pemasaran, melalui pendekatan dan metode-metode yang digunakan, terutama tentang kepuasan pelanggan.
b Dapat memberikan manfaat atau sebagai bahan masukan bagi Puskesmas dan Dinas Kesehatan Kota dalam melaksanakan kegiatan pepelayanan kesehatan masyarakat di masa yang akan datang.
KAJIAN PUSTAKA
2.1. Pengertian Kualitas JasaGuna mencapai harapan konsumen, perusahaan harus dapat memberikan
jasa yang berkualitas, yaitu dengan memberikan jasa yang berkualitas yang melebihi harapan konsumen. Kualitas jasa merupakan suatu yang abstrak, ia melibatkan dua pihak yaitu pemberi jasa dan konsumen. Bagi pemberi jasa yang disampaikan sedangkan bagi penerima jasa dikaitkan dengan kegunaan dan kepuasan dari hasil jasa untuk dirinya.Kotler ( 2000), menyatakan bahwa “ Quality is the totally of feature and characteristic of a product or service that bear on its ability to safisty stated implied needs”Sedangkan Zeithaml and Bitner (2000)menyatakan bahwa “Service quality is the delivers of excellent or superior service, relative to customer satifaction”.
Kedua pendapat ahli di atas menjelaskan bahwa kualitas pada umumnya dikaitkan dengan suatu derajat keberhasilan atau suatu yang excellent. Sedangkan kualitas pepelayanan merupakan kesempurnaan pepelayanan yang diberikan kepada nasabah melampaui tingkat hasil kepuasan rata-rata nasabah.
Dari definisi kualitas pepelayanan yang telah diuraikan tersebut, ada lima dimensi kualitas pepelayanan, dimana kelima dimensi kualitas pepelayanan ini
Jurusan Manajemen Fakultas Ekonomi Universitas Andalas
58

Jurnal Bisnis&ManajemenJurnal Business & Manajemen Vol. 1, No.1, 2005
merupakan rangkuman dari sepuluh dimensi kualitas pepelayanan sehingga dapat dirangkum menjadi 5 dimensi penentu kualitas jasa Lovelock ( 2000) yaitu :
1) Tangibles ( Appearance of physical elements )2) Reliability ( dependable, accurate, performance )3) Responsiveness ( promptness and helpfulness )4) Assurance ( competence, courtesy, credibility, and security )5) Empathy ( easy access, good communications, and customer
understanding ).Zeithaml, Parasuraman dan Berry (1990) juga meringkas sepuluh dimensi
kualitas pelayann menjadi 5 dimensi penentu kualitas jasa yaitu :1) Tangibles ( tampilan fisik ) meliputi fasilitas fisik, perlengkapan, pegawai,
sarana komunikasi.2) Reliability ( kehandalan ) yaitu kemampuan memberikan pepelayanan
yang dijanjikan dengan segera, akurat dan memuaskan.3) Responsiveness ( daya tanggap ) yakni keinginan para staf untuk
membantu para nasabah dalam memberikan pepelayanan dan dengan cepat dapat menanggapi seluruh keinginan nasabah.
4) Assurance ( jaminan ) meliputi pengetahuan, kemampuan, kesopanan dan sifat dapat dipercaya yang dimiliki oleh para staf, bebas dari bahaya risiko atau keragu-raguan.
5) Empathy ( empati ) meliputi kemudahan dalam melakukan hubungan komunikasi yang baik, perhatian pribadi dan memahami kebutuhan pelanggan.
Mengukur kualitas jasa adalah tantangan yang sangat sulit bagi perusahaan. Karena kepuasan pelanggan ditentukan oleh banyak faktor yang sulit dideteksi. (intangibles). Disamping itu, servqual tidak pernah mencapai 100% karena harapan pelanggan terhadap jasa selalu mengalami peningkatan. Harapan pelanggan ini dipengaruhi oleh komunikasi lisan yang terjadi dan kebutuhan personal yang selalu meningkat sepanjang waktu, dan adanya pengalaman masa lalu konsumen dalam mengkonsumsi suatu jasa.
Hubungan dimensi servqual dan kepuasan pelanggan terhadap jasa yang diterima, oleh Parasuraman et al dalam Fitzsimmons (1994) digambarkan dalam diagram berikut ini:
Jurusan Manajemen Fakultas Ekonomi Universitas Andalas
Word ofMouth
PersonalNeeds
PastExperience
Dimensions of Service Quality
TangiblesEmpathyReliabilityResponsivenessAssurance
ExpectedService
PerceivedService
Perceived Service Quality
ESPS (Quality Surprise)ES=PS (Satisfactory Quality)ESPS (Unacceptable Quality)
59
Jurnal Bisnis&ManajemenJurnal Business & Manajemen Vol. 1, No.1, 2005
Gambar 1.Perceived Service Quality
Berdasarkan dimensi pada serqual, maka dapat dilakukan pengukuran kualitas jasa dengan rumus (Sucherly, 1998) sebagai berikut:
Dimana: Perceived Service = Jasa yang dirasakan berdasarkan persepsi pelanggan (penerima jasa).
Expected Service = Jasa yang diharapkan pelanggan (penerima jasa).
2.3. Kepuasan PelangganKepuasan pelanggan diukur untuk melihat apakah jasa yang ditawarkan
perusahaan berkualitas atau tidak. Apabila jasa yang ditawarkan berkualitas, pelanggan akan merasa puas. Kepuasan pelanggan merupakan fungsi dari perceived service dan expected service (Sucherly, 1998):S = f(P,E)Dimana: P = Perceived Service
E = Expected ServiceKepuasan pelanggan dapat dirumuskan sebagai berikut (Sucherly, 1998):
Dimana: CS = Customer Satisfaction (Kepuasan Pelanggan)P = Perceived PerformanceE = Expectation
Gap antara jasa yang diterima (perceived service) dengan jasa yang diharapkan (expected service) adalah sebuah ukuran kualitas jasa. Kepuasan yang diterima pelanggan bisa positif atau negatif. Mengukur gap antara jasa yang diterima dengan jasa yang diharapkan adalah proses umpan balik terhadap pelanggan yang rutin dipraktekkan oleh perusahaan jasa.
Dalam mengukur kepuasan pelanggan, diasumsikan bahwa kepentingan pelanggan terhadap setiap dimensi servqual adalah sama. Namun pada umumnya kepentingan pelanggan terhadap setiap dimensi kualitas jasa tidak sama. Hal ini menyebabkan sebaiknya perusahaan memperhatikan kepentingan pelanggan (customer important) terhadap setiap dimensi kualitas jasa. Oleh sebab itu perlu dilakukan pengukuran berdasarkan performance important, yang dapat digambarkan pada diagram berikut ini:
Gambar 2. 2. Performance Important
Jurusan Manajemen Fakultas Ekonomi Universitas Andalas
I Tidak II Efisien Optimum
ServicePerformance
Tidak III Efektif Efektif IV
Servqual = Perceived Service (PS)- Expected Service (ES)
60
Jurnal Bisnis&ManajemenJurnal Business & Manajemen Vol. 1, No.1, 2005
Apabila telah diperoleh performance important, kemudian digambarkan dalam sebuah diagram performance important rating. Diagram ini dibagi ke dalam empat kuadran untuk melihat tingkat kepentingan pelanggan (pemakai jasa). Dimensi kualitas jasa yang keluar dari batas daerah optimum perlu dilakukan perbaikan agar kepuasan pemakai jasa dapat dipenuhi oleh perusahaan.
Jurusan Manajemen Fakultas Ekonomi Universitas Andalas
61

Jurnal Bisnis&ManajemenJurnal Business & Manajemen Vol. 1, No.1, 2005
METODE PENELITIAN
3.1. Ruang Lingkup PenelitianPenelitian ini dilakukan di Kabupaten Padang Pariaman pada Puskesmas
Kampung Dalam. Objek penelitian menyangkut hal-hal yang berhubungan dengan kualitas pepelayanan yang dirasakan oleh konsumen dan kaitannya dengan tingkat kepentingan dan kepuasan konsumen terhadap proses pepelayanan tersebut. Disain penelitian yang digunakan adalah metode survai, dimana data diambil dari sebagian populasi yang dijadikan responden untuk dimintai pendapatnya tentang masalah tertentu.
Aspek-aspek yang akan dinilai dalam masing-masing dimensi adalah:a. Tangibles, yang meliputi penilaian konsumen terhadap:
Kondisi, penampilan, dan kesiapan tenaga medis dan non medis dalam melayani konsumen.
Fasilitas dan peralatan yang digunakan dalam proses pepelayanan Kemampuan dan keahlian yang dimiliki Dokter dalam melayani konsumen. Kemampuan dan keterampilan perawat dalam melayani konsumen Kemampuan dan keterampilan tenaga administrasi dalam melayani
konsumen Kemampuan dan keterampilan tenaga apotik dalam melayani konsumen Kedisiplinan Dokter dalam memeriksa pasien Tingkat kenyamanan Puskesmas Peraturan-peraturan yang diterapkan oleh pihak Puskesmas
b. Empathy, yang meliputi penilaian konsumen terhadap: Perhatian dan kepedulian tenaga medis dan non-medis terhadap pasien Cara Dokter dalam melakukan pendekatan dengan pasien Cara perawat dalam melakukan pendekatan dengan pasien Usaha Dokter untuk bisa mengerti kebutuhan pasien Usaha perawat untuk bisa mengerti kebutuhan pasien
c. Reliability, yang meliputi penilaian konsumen terhadap: Kesesuaian antara pepelayanan yang diberikan dengan kebutuhan pasien Kejelasan tentang berbagai pengobatan yang diberikan dalam pepelayanan
d. Responsivennes, yang meliputi penilaian konsumen terhadap: Kesediaan Dokter untuk memberikan bantuan kepada pasien Kesediaan perawat untuk memberikan bantuan kepada pasien Kemampuan Dokter untuk memberikan bantuan terhadap masalah yang
dihadapi pasien Keahlian Dokter memberikan motivasi dan semangat untuk sehat kepada
pasien e. Assurance, yang meliputi penilaian konsumen terhadap:
Kemudahan untuk menemui Dokter di luar jam kontrol Kemudahan untuk menemui perawat di luar jam kontrol Perlakuan yang sama terhadap semua pasien
3.2. Metode Penarikan SampelPopulasi dalam penelitian ini adalah pasien rawat jalan dan rawat inap pada
Puskesmas Kampung Dalam di Padang Pariaman. Teknik sampel yang diambil adalah Purposive sampling dan proporsional random sampling. Teknik Purposive sampling dipakai karena sampel yang akan diambil berdasarkan kriteria-kriteria sebagai berikut:
Pasien berdomisili di Kampung Dalam. Pasien yang diambil adalah pasien rawat jalan periode Januari-Februari
2002.
Jurusan Manajemen Fakultas Ekonomi Universitas Andalas
62

Jurnal Bisnis&ManajemenJurnal Business & Manajemen Vol. 1, No.1, 2005
Teknik proporsional random sampling dipakai karena jumlah pasien pada periode waktu berbeda sehingga sampel yang diambil besarnya sesuai dengan besarnya jumlah pasien per periode. Penentuan ukuran sampel dari suatu populasi digunakan berdasarkan formula Slovin yang dikutip Husein Umar (1997) sebagai berikut:
Dimana: n = Ukuran SampelN = Ukuran Populasie = Persen Kelonggaran Ketidaktelitian karena kesalahan pengambilan
sampelDalam penelitian ini: N = 2521
e = 10%Jadi jumlah sampel yang diambil dalam penelitian ini:
2521n =
1+(2521.0,12 ) = 96 responden
Dalam penelitian ini diambil sampel sebanyak 100 dengan perincian sebagai berikut:
Tabel 3.1. Perhitungan jumlah sampel
Periode Populasi (N) Persentase Sampel (n)Januari 2002 1231 49 49Februari 2002 1290 51 51
Jumlah 100
3.3. Teknik Pengumpulan Data Data yang digunakan dalam penelitian ini terdiri atas 2 jenis:
a. Data primer, yaitu data yang diperoleh dari responden dengan cara menyebarkan kuesioner yang telah disiapkan.
b. Data sekunder, yaitu data yang diperoleh dari pihak kedua dalam hal ini berupa data-data dari Puskesmas dan instansi yang terkait di Padang Pariaman.
3.4. Metode AnalisisPada penelitian ini disebarkan kuesioner untuk mengetahui pendapat
responden. Pernyataan yang diberikan dalam kuesioner diukur dengan mengunakan skala likert dari 1-5 yang diberi skor positif. Kuesioner yang disebarkan memakai skala pengukuran ordinal. Tanggapan yang diminta dari responden dibagi ke dalam tiga bagian yang terdiri atas : (1)penilaian responden untuk setiap aspek, (2)peringkat kepentingan responden untuk setiap aspek, dan (3)harapan responden terhadap masing-masing aspek. Tanggapan yang diminta untuk masing-masing bagian diberi skor dengan cara sebagai berikut :
a. Penilaian responden untuk masing-masing aspek5 = Baik sekali4 = Baik3 = Cukup sekali2 = kurang baik
Jurusan Manajemen Fakultas Ekonomi Universitas Andalas
63

Jurnal Bisnis&ManajemenJurnal Business & Manajemen Vol. 1, No.1, 2005
1 = Sangat kurang/Jelekb. Peringkat kepentingan responden untuk masing-masing aspek :
5 = Sangat baik 4 = Penting3 = Cukup penting 2 = Kurang penting1 = Tidak penting
c. Harapan responden terhadap masing-masing aspek :5 = Baik sekali4 = Baik3 = Cukup baik2 = Kurang baik1 = Sangat kurang/jelek
Setelah diperoleh skor untuk masing-masing aspek yang dinilai, tingkat kepuasan responden akan dicari dengan menggunakan rumus :
Dimana: CS = Customer Satisfaction (Kepuasan Pelanggan) P = Perceived Performance
E = ExpectationSedangkan kualitas pepelayanan dicari dengan rumus:
Dimana:Perceived Service = Jasa yang dirasakan berdasarkan persepsi pelanggan (penerima
jasa).Expected Service = Jasa yang diharapkan pelanggan (penerima jasa)
HASIL PENELITIAN DAN PEMBAHASAN
4.1. Profil RespondenDari 100 kuisioner yang diolah, diketahui karakteristik responden seperti
tabel 4.1. berikut ini:
Tabel 4.1.Karakteristik Responden
Sumber: Data Primer (diolah)
Dari Tabel 4.1 sebagian besar responden adalah wanita, bekerja sebagai Pegawai Negeri Sipil, berumur 21-30 tahun dan tamat SLTA.
4.2. Tingkat Kepuasan dan Mutu Pelayanan pada Puskesmas Kampung Dalam di Kabupaten Padang Pariaman
Jurusan Manajemen Fakultas Ekonomi Universitas Andalas
Servqual =( Perceived Service - Expected Service)
64

Jurnal Bisnis&ManajemenJurnal Business & Manajemen Vol. 1, No.1, 2005
Perhitungan tingkat kepuasan dan kualitas pepelayanan kesehatan kepada masyarakat pada Puskesmas Kampung Dalam di Kabupaten Padang Pariaman dapat dilihat pada Tabel 4.2. Kriteria penilaian konsumen terhadap tingkat kepuasan dan kualitas pepelayanan kesehatan kepada masyarakat ini dinilai berdasarkan skor yang diperoleh dari hasil pengolahan data kuisioner. Data kuisioner yang diolah berjumlah 100, maka skor tertinggi diberikan untuk masing-masing aspek adalah 500, sedangkan skor terendah yang diberikan untuk setiap aspek adalah 100. Kriteria penilaian terhadap masing-masing aspek akan berkisar antara 100-500 dengan perincian sebagai berikut:
100-180 181-60 261-40 341-420 421-500Tidak
MemuaskanKurang
MemuaskanCukup
MemuaskanMemuaskan Memuaskan Sangat Memuaskan
Tabel 4.2.Hasil Perhitungan Tingkat Kepuasan dan Penilaian Konsumen terhadap Kualitas Pepelayanan Kesehatan Kepada Masyarakat
Jurusan Manajemen Fakultas Ekonomi Universitas Andalas
65

Jurnal Bisnis&ManajemenJurnal Business & Manajemen Vol. 1, No.1, 2005
Sumber: Data Primer (diolah)
Dari hasil pengolahan data dapat diketahui bahwa harapan konsumen yang paling tinggi mencapai skor 429, yaitu pada aspek kedisiplinan Dokter dalam memeriksa pasien. Hal ini patut menjadi perhatian karena kedipsilan Dokter merupakan aspek yang paling penting dalam proses pepelayanan pada Puskesmas. Dari pengolahan data juga dapat disimpilkan bahwa konsumen mempunyai harapan tinggi sampai sangat tinggi terhadap semua aspek.
Penilaian konsumen terhadap kinerja jasa atau kenyataan yang didapati konsumen dalam pepelayanan kesehatan di Puskesmas rata-rata berada pada kriteria yang cukup memuaskan, hanya satu aspek yang dinilai oleh konsumen berada pada kritria memuaskan yaitu aspek kemampuan dan keahlian yang dimiliki Dokter dalam melayani konsumen.
Jurusan Manajemen Fakultas Ekonomi Universitas Andalas
66

Jurnal Bisnis&ManajemenJurnal Business & Manajemen Vol. 1, No.1, 2005
Tingkat kepuasan konsumen diasumsikan berada pada kriteria sangat puas apabila skornya 100%. Oleh karena itu, kriteria terhadap tingkat kepuasan konsumen dikelompokan dalam persentase sebagai berikut:0-20%-------------21-40%-------------41-60%------------61-80%-------------81-100%Tidak Kurang Cukup Memuaskan SangatMemuaskan Memuaskan Memuaskan Memuaskan
Dari Tabel 4.2 juga dapat dilihat bahwa tingkat kepuasan konsumen berkisar pada 73,99% sampai 81,56% yaitu berada pada kriteria memuaskan sampai sangat memuaskan. Tingkat kepuasan paling tinggi yaitu pada aspek tangibles, kemampuan dan keahlian yang dimiliki Dokter dalam melayani konsumen dan yang paling rendah yaitu pada aspek tangibles, tingkat kenyaman Puskesmas.
Kualitas jasa merupakan gap antara jasa yang diterima (kinerja) dengan jasa yang diharapkan (harapan). Gap ini secara rinci dapat dilihat pada tabel 4.2 di atas. Dari tabel tersebut terlihat gap antara jasa yang diterima (kinerja) dengan jasa yang diharapkan (harapan) tidak terlalu besar, tetapi gap antara jasa yang diterima (kinerja) dengan jasa yang diharapkan (harapan) konsumen dapat dijadikan ukuran terhadap proses pepelayanan kesehatan di Puskesmas Kampung Dalam Kabupaten Padang Pariaman. Gap yang paling tinggi yaitu pada aspek tangibles, tingkat kenyamanan Puskesmas (-1,09), dimana konsumen merasakan kondisi di Puskesmas kurang nyaman seperti ruang tunggu yang tidak memadai. Gap yang paling rendah yaitu pada aspek tangibles, peraturan-peraturan yang diterapkan oleh pihak Puskesmas.
4.3. Tingkat Kepentingan Pasien Rawat Jalan terhadap Masing-masing Dimensi yang Dijadikan sebagai Ukuran dalam Pelaksanaan Pepelayanan pada Puskesmas Kampung Dalam di Kapupaten Padang Pariaman
Hasil perhitungan terhadap tingkat kepentingan konsumen (customer importing rating), yang menunjukkan pentingnya suatu aspek bagi konsumen dalam prosen pelayang kesehatan pad Puskesmas kampung Dalam terlihat pada tabel 4.3 berikut ini:
Jurusan Manajemen Fakultas Ekonomi Universitas Andalas
67

Jurnal Bisnis&ManajemenJurnal Business & Manajemen Vol. 1, No.1, 2005
Tabel 4.3. Hasil Perhitungan Tingkat Kepentingan Konsumenterhadap Kualitas Pepelayanan Kesehatan Kepada Masyarakat
Sumber: Data Primer (diolah)Tingkat kepentingan konsumen terhadap masing-masing aspek berkisar
pada skor 416-440 yaitu sangat penting. Konsumen menganggap aspek yang dinilai sangat penting dalam proses pepelayanan kesehatan. Tingkat kepentingan konsumen terhadap masing-masing aspek (23 aspek) dapt dilihat pada kuadran Customer Importing Rating yang terlihat pada Gambar 4.1 berikut ini:
Jurusan Manajemen Fakultas Ekonomi Universitas Andalas
68

Jurnal Bisnis&ManajemenJurnal Business & Manajemen Vol. 1, No.1, 2005
Gambar 4.1.Customer Importing Rating
Kuadran ini bertujuan untuk mengetahui tindakan apa yang bisa diambil sehingga tingkat kepentingan konsumen terpenuhi oleh pihak Puskesmas Kampung Dalam dan menggambarkan apakah titik-titik yang diplot sudah menggambarkan kinerja jasa yang optimum.
V. KESIMPULAN DAN SARAN5.1. Kesimpulan
Berdasarkan hasil penelitian dapat disimpulkan sebagai berikut:1. Penilaian konsumen terhadap kinerja jasa atau kenyataan yang didapati
konsumen dalam pepelayanan kesehatan di Puskesmas rata-rata berada pada kriteria yang cukup memuaskan, hanya satu aspek yang dinilai oleh konsumen berada pada kriteria memuaskan yaitu aspek kemampuan dan keahlian yang dimiliki Dokter dalam melayani konsumen.
2. Tingkat kepuasan konsumen berkisar pada 73,99% sampai 81,56% yaitu berada pada kriteria memuaskan sampai sangat memuaskan. Tingkat kepuasan paling tinggi yaitu pada aspek tangibles, kemampuan dan keahlian yang dimiliki Dokter dalam melayani konsumen dan yang paling rendah yaitu pada aspek tangibles, tingkat kenyaman Puskesmas.
3. Gap antara jasa yang diterima (kinerja) dengan jasa yang diharapkan (harapan) tidak terlalu besar, tetapi gap antara jasa yang diterima (kinerja) dengan jasa yang diharapkan (harapan) konsumen dapat dijadikan ukuran terhadap proses pepelayanan kesehatan di Puskesmas Kampung Dalam Kabupaten Padang Pariaman. Gap yang paling tinggi yaitu pada aspek tangibles, tingkat kenyamanan Puskesmas (-1,09), dimana konsumen merasakan kondisi di Puskesmas kurang nyaman seperti ruang tunggu yang tidak memadai. Gap yang paling rendah yaitu pada aspek tangibles, peraturan-peraturan yang diterapkan oleh pihak Puskesmas.
4. Tingkat kepentingan konsumen terhadap masing-masing aspek berkisar pada skor 416-440 yaitu sangat penting. Konsumen menganggap aspek yang dinilai sangat penting dalam proses pepelayanan kesehatan.
Jurusan Manajemen Fakultas Ekonomi Universitas Andalas
69

Jurnal Bisnis&ManajemenJurnal Business & Manajemen Vol. 1, No.1, 2005
5.2. SaranAgar kualitas pelayanan memberikan kepuasan yang lebih tinggi kepada
pasien rawat jalan, maka pihak Puskesmas diharapkan mempertimbangkan hal-hal sebagai berikut:a Perlunya ketanggapan, perhatian dan keramahan dari semua tenaga medis,
paramedis dan non medis yang terlibat langsung dalam pelayanan pasien, agar pasien merasa lebih puas di masa yang akan datang.
b Lebih memperhatikan kinerja dan tingkat kepentingan terutama dari aspek tangibles seperti tingkat kenyaman Puskesmas, sehingga pelayanan yang diberikan bisa memnuhi harapan pasien.
DAFTAR PUSTAKA
Departemen Kesehatan Republik Indonesia. (1997) Profil Kesehatan Indonesia. Departemen Kesehatan, Jakarta.
Emory, C.William. (2000) Business Research Methods. Richard D. Irwin,Inc., Homewood Illinois.
Fitzmmons, James. A and Mona. J. Fitzmmons. (1994), Service Management for Competitive Advantage. International Edition, McGraw-Hill.Inc, Singapore.
Hill, Nigel (1996). Handbook of Customer Satisfaction Measurement. Gower Publishing Limmitted, Englang
Kantor Wilayah Kesehatan Dati I Sumatera Barat. (1997) Profil Kesehatan Propinsi Sumatera Barat. Departemen Kesehatan, Jakarta.
Kotler, Philip. (2000) Marketing Management. The Millenium Edition, Prentice-Hall Inc. Upper sadle River, New Jersey.
Kurtz, David. L. (1998) Services Marketing. John Wiley & Sons, Inc., New York.Lovelock, Christopher.(2000) Service Marketing. Second Edition. Prentice-Hall
International. Inc, Upper sadle River, New Jersey.Naresh K, Malhotra. (1996) Marketing Research, An Applied Orientation. Second
Edition Prentice-Hall,Inc,A Simon & Scuster Compony Upper Saddle River, New Jersey.
Nazir, Mohamad. (1988) Metode Penelitian. Ghalia Indonesia, Jakarta.Oliver, Richard.L. (1997) Satisfaction a Behavioral Perspective On The Consumer.
The McGraw-Hill Companies. Inc, Singapore.Pawitra, Teddy. (1992) Sistem Pemasaran Jasa. Liberty, Yokyakarta.Rangkuti, Freddy. (1997) Riset Pemasaran. Gramedia Pustaka Utama, Jakarta.Sekaran, Umar. (2000) Research Methods for Business: A Skill Building Approach.
John Wiley & Sons,Inc, Singapore.Subhas, Sharma. (1996) Aplied Multivariate Techniques. John Wiley and Sons, USA.Sucherly.(1998) Manajemen Pemasaran Jasa. Pelatihan: Capability Development
Program Skill Development Project-Jawa Barat. Fakultas Ekonomi, Universitas Padjadjaran, Bandung.
Tjiptono, Fandy. (1996) Manajemen Jasa, Liberty, Yokyakarta.Umar,Huseien. (1997). Metodologi Penelitian Aplikasi dalam Pemasaran, PT.
Gramedia Pustaka Utama, Jakarta.
Jurusan Manajemen Fakultas Ekonomi Universitas Andalas
70
Jurnal Bisnis&ManajemenJurnal Business & Manajemen Vol. 1, No.1, 2005
Orientasi dan Pendekatan Pendidikan Kewirausahaan di Perguruan Tinggi
Hafiz Rahman1
AbstrakUsaha untuk menemukan dan menerapkan metode yang efektif dalam pendidikan kewirausahaan perguruan tinggi telah lama dilakukan oleh para ahli dan peneliti dalam bidan kewirausahaan. Tidak hanya di Indonesia tetapi juga para ahli kewirausahaan diseluruh dunia. Namun demikian satu hal yang harus disadari adalah adanya 2 orientasi penting dalam sebuah pendidikan kewirausahaan yaitu orientasi pendidikan kewirausahaan ´tentang kewirausahaan/educating about entrepreneurship` serta orientasi pendidikan kewirausahaan ´untuk berwirausaha/educating for entrepreneurship`. Pemahaman terhadap hal ini harus dilakukan sesuai dengan tujuan akhir yang hendak dicapai oleh pendidikan kewirausahaan karena masing-masing orientasi pendidikan kewirausahaan ini memiliki implikasi lanjutan yakni dalam hal pendekatan pendidikan kewirausahaan (metode pengajaran, materi dan bahan ajar). Paper ini ditujukan untuk memperluas wawasan bagi para pengajar kewriausahaan mengenai pendekatan dalam melakukan pendidikan kewirausahaan di perguruan tinggi di Indonesia sesuai dengan orientasi dan tujuan pendidikan kewirausahaan sebagaimana yang telah ditetapkan oleh Direktorat Jenderal Pendidikan Tinggi-Departemen Pendidikan Nasional Indonesia.
Kata Kunci: Pendidikan kewirausahaan, perguruan tinggi, orientasi pendidikan tentang kewirausahaan, orientasi, pendidikan untuk kewirausahaan, pendekatan pendidikan dan kuliah kewirausahaan
PendahuluanMenurut sejarahnya, kuliah atau pendidikan kewirausahaan pertama kali
ditawarkan oleh Harvard Business School pada tahun 1947 dan kemudian Peter Drucker juga mengajarkan pendidikan kewirausahaan ini di New York University pada tahun 1953 (Brockhaus, 2001, hal. 14). Sejak dari itu, kuliah dan metode pengajaran dalam pendidikan kewirausahaan berkembang dengan pesat di hampir seluruh sekolah-sekolah bisnis di Amerika Serikat dan Eropa. Dengan perkembangan yang makin pesat ini, orientasi pendidikan kewirausahaan juga mulai beragam, walaupun secara umum terdapat dua orientasi utama. Yang pertama yaitu program pendidikan kewirausahaan yang menitikberatkan perhatian pada penyiapan mahasiswa untuk dapat mendirikan sebuah usaha baru-New Venture Creation/Business Start Up atau dalam arti kata pendidikan kewirausahaan yang mengarah pada pendidikan tentang kewirausahaan/educating about entrepreneurship sedangkan yang kedua yaitu program pendidikan kewirausahaan yang lebih fokus pengembangan soft skills mahasiswa tentang begaimana profil seorang wirausaha yang berhasil, yang terdiri dari atribut-atribut seorang wirausahawan serta perilaku dalam berwirausaha, yang tentunya lebih mengarah pada pendidikan kewirausahaan untuk berwirausaha/educating for entrepreneurship (Kirby, 2004). 1 SE (Universitas Andalas), MSBS (Universitaet Leipzig)
Jurusan Manajemen Fakultas Ekonomi Universitas Andalas
71

Jurnal Bisnis&ManajemenJurnal Business & Manajemen Vol. 1, No.1, 2005
Kedua hal ini jelas merupakan sebuah acuan utama dalam menyusun dan menetapkan pendekatan yang akan dilakukan oleh perguruan tinggi dalam pendidikan kewirausahaan, materi-materi apa saja yang akan ditawarkan dalam pendidikan kewirausahaan serta metode pengajaran bagaimana yang akan dilakukan dalam menyampaikan materi pendidikan kewirausahaan tersebut pada mahasiswa.
ika perguruan tinggi kita memiliki orientasi bahwa tujuan akhir pendidikan kewirausahaan adalah pendidikan tentang kewirausahaan, maka solusi pendekatan pendidikan (pengajaran, materi dan metode penyampaian) kewirausahaan akan lebih mudah untuk dilakukan. Solusi pendekatan pendidikan kewirausahaan ini akan lebih berorientasi pada upaya penciptaan usaha/bisnis baru sebagaimana halnya yang dilakukan sekolah bisnis di Amerika dan apa yang terdapat dalam buku best seller kewirausahaan karya Bygrave, 1994 Portable MBA in Entrepreneurship, yang lebih menitikberatkan pendidikan kewirausahaan pada materi-materi serta pendekatan teoritis kewirausahaan, berbagai tools of business dan manajemen untuk menyiapkan pendirian sebuah usaha baru dan diakhiri dengan penyiapan sebuah Business Plan yang selanjutnya akan dikompetisikan dan Business Plan Competition.
Namun jika tujuan akhir sebuah pendidikan kewirausahaan adalah bagaimana mendidik mahasiswa untuk berwirausaha, maka pendidikan kewirausahaan dengan sendirinya akan lebih mengarah pada identifikasi, penciptaan atau peningkatan atribut-atribut wirausahawan yang hendaknya dimiliki seorang calon wirausahawan, dalam hal ini mahasiswa. Dengan kondisi seperti ini, perlu dikembangkan suatu pendekatan pendidikan kewirausahaan yang mampu untuk menggali dan mengeksplorasi atribut-atribut seorang wirausahawan ini. Adapun atribut-atribut wirausahawan ini antara lain adalah kemampuan dalam menghadapi resiko (Caird, 1991, Cromie and O´Donoghue, 1992, Koh, 1996, Busenitz, 1999), butuh akan pencapaian hasil tertentu-Need for Achievement (N-Ach) (Mc Clelland, 1961), Locus of Control (Rotter, 1966), keinginan untuk bekerja secara otonom (Caird, 1991, Cromie and O´Donoghue, 1992), adanya tingkah laku negatif yang membawa keuntungan secara finansial (Kets de Vries, 1977), kreatif dan opportunis (Timmons, 1989, Whitting, 1988) serta adanya intuisi (Carland, 1982).
Dengan adanya dua orientasi dasar pendidikan kewirausahaan yang amat berbeda ini, maka dengan sendirinya juga akan terdapat perbedaan mendasar dalam pendidikan kewirausahaan yang akan diberikan pada mahasiswa. Namun demikian, semuanya tentu harus disesuaikan dengan tujuan akhir pendidikan kewirausahaan yang telah ditetapkan oleh Dirjen Pendidikan Tinggi. Jika tujuan ini telah dipahami, diyakini akan didapat sebuah konsep pendekatan pendidikan kewirausahaan yang lebih baik dan efektif. Pertanyaan dan tantangan besar yang dihadapi saat ini adalah untuk menentukan orientasi dan pendekatan pendidikan kewirausahaan mana yang akan dapat mencapai tujuan pendidikan kewirausahaan yang diharapkan oleh Dirjen Pendidikan Tinggi. Tujuan Umum Pendidikan ewirausahaan
Sebagaimana halnya yang telah ditetapkan Dirjen Pendidikan Tinggi Departemen Pendidikan Nasional, tujuan umum pendidikan dan kegiatan kuliah kewirausahaan di perguruan tinggi diarahkan pada hal sebagai berikut:
1. Meningkatkan pemahaman manajemen dan penjiwaan kewirausahaan dikalangan mahasiswa agar mampu menjadi wirausahawan yang berwawasan jauh kedepan dan luas, berbasis ilmu pengetahuan yang telah diperoleh.
Jurusan Manajemen Fakultas Ekonomi Universitas Andalas
72

Jurnal Bisnis&ManajemenJurnal Business & Manajemen Vol. 1, No.1, 2005
2. Meningkatkan pemahaman manajemen (organisasi, produksi, keuangan dan pemasaran), memperkenalkan cara melakukan akses informasi dan pasar serta teknologi, cara pembentukan jaringan kemitraan usaha, strategi dan etika bisnis serta pembuatan rencana bisnis yang diperlukan oleh para mahasiswa agar lebih siap dalam pengelolaan usaha yang sedang dan akan dilaksanakan.
Tujuan umum pendidikan kewirausahaan tersebut, nantinya akan berusaha dicapai dengan Program Pengembangan Budaya Kewirausahaan dikalangan mahasiswa perguruan tinggi melalui wahana-wahana sebagai berikut:
1. Kuliah Kewirausahaan2. Magang Kuliah Kewirausahaan3. Kuliah Kerja Usaha (KKU)4. Karya Allternatif Mahasiswa (KAM)5. Konsultasi Bisnis dan Penempatan Kerja (KBPK)6. Inkubator Wirausaha Baru (INWUB)
Dari tujuan umum pendidikan kewirausahaan sebagaimana halnya yang telah ditetapkan Dirjen Pendidikan Tinggi tersebut, dengan sendirinya terlihat bahwa Dirjen Pendidikan Tinggi berupaya agar terjadi keseimbangan dalam orientasi pendidikan kewirausahaan, dalam artian orientasi pendidikan kewirausahaan yang diinginkan adalah orientasi educating for entrepreneurship dan educating about entreprneuership yang diupayakan pencapaiannya melalui berbagai program pengembangan budaya kewirausahaan. Namun disayangkan, belum ada suatu standar yang disepakati bersama mengenai pendekatan pendidikan kewirausahaan mana yang akan digunakan untuk mencapai tujuan serta orientasi pendidikan kewirausahaan tersebut.
Kuliah Kewirausahaan di Jurusan Manajemen Fak. Ekonomi Univ. AndalasKuliah Kewirausahaan (KWU) ditawarkan oleh Jurusan Manajemen Fakultas Ekonomi Universitas Andalas pada semester V dengan bobot 3 SKS sebagai salah satu bagian dari Kuliah Wajib Fakultas. Dari lima bahasan/materi utama yang disampaikan pada kuliah kewirausahaan, maka 3 materi lebih mengarah pada orientasi pendidikan kewirausahaan yang educating for entrepreneurship (Test Kewirausahaan, Nilai-nilai dan Padangan Hidup Wirausahawan serta Pemahaman Dunia Wirausaha melalu Konsep Bisnis dan Manajemen). Sedangkan dua materi lainnya lebih mengarah pada orientasi pendidikan kewirausahaan yang educating about entrepreneurship (Pengenalan Kewirausahaan serta Penyusunan Proposal Bisnis). Metode pengajaran dilakukan melalui sistem sistem perkuliahan konvensional, diskusi, latihan, simulasi serta studi kasus.
Dari informasi yang disampaikan diatas, sudah terlihat secara jelas mengenai orientasi kuliah kewirausahaan di Jurusan Manajemen Fakultas Ekonomi Universitas Andalas. Selain itu juga terlihat bahwa pendekatan perkuliahan kewirausahaan yang dilakukan umumnya dan sebagian besar masih dilakukan dengan pola teaching.
Orientasi dan Pendekatan Pendidikan Kewirausahaan
Saat ini masih terjadi debat pada ahli pendidikan kewirausahaan diseluruh dunia mengenai pendekatan yang efektif untuk sebuah pendidikan kewirausahaan di perguruan tinggi. Sebagian ahli menyatakan bahwa pendekatan pendidikan kewirausahaan yang efektif dan dapat dilakukan adalah melalui pendekatan teaching dengan berbagai metode penyampaiannya sedangkan sebagian lagi berpendapat bahwa pendekatan learning dengan berbagai metode
Jurusan Manajemen Fakultas Ekonomi Universitas Andalas
73

Jurnal Bisnis&ManajemenJurnal Business & Manajemen Vol. 1, No.1, 2005
penyampaiannya merupakan yang paling efektif dan paling memungkinkan untuk membentuk seorang wirausahawan dari kalangan mahasiswa. Pendekatan teaching umumnya dilakukan diperguruan-perguruan tinggi yang berorientasi pendidikan kewirausahaan-nya educating about entrepreneurship sedangkan pendekatan learning dilakukan oleh perguruan tinggi yang berorientasi pendidikan kewirausahaan educating for entrepreneurship.
Pada pendekatan teaching (pengajaran dengan metode perkuliahan konvensional-mahasiswa diajarkan tentang kewirausahaan) materi yang diberikan umumnya adalah merupakan materi-materi yang berhubungan dengan konsep-konsep kewirausahaan, penyusunan proposal bisnis serta bagaimana cara mendirikan usaha baru. Dari berbagai argumentasi dinyatakan bahwa ukuran sebuah pendidikan kewirausahaan nantinya adalah sampai seberapa banyak kemampuan mahasiswa untuk dapat mendirikan usaha baru setelah mereka menyelesaikan perkuliahannya atau setelah selesai menyelesaikan pendidikan kewirausahaan. Dalam artian bahwa pendekatan teaching berupaya agar mahasiswa pada akhirnya akan mampu untuk mendirikan/membuka sebuah usaha baru nantinya. Dengan demikian, kebanyakan pendekatan teaching lebih menitikberatkan perhatian dan materi perkuliahannya pada penyusunan proposal usaha/bisnis baru melalui pemberian materi tools of business dan management secara mendetail sehingga metode pengajaran kewirausahaan pun banyak dilakukan melalui metode perkuliahan konvensional, melalui komputer dan internet, pengenalan literatur dan succes story seorang wirausahawan yang telah berhasil. Hal ini amat kentara terjadi di perguruan tinggi-perguruan tinggi di Amerika Serikat sebagian perguruan tinggi di Eropa yang lebih mementingkan jumlah pendirian usaha/bisnis baru milik mahasiswa setelah menyelesaikan perkuliahan ketimbang menyiapkan kemampuan mental, psikis dan kemampuan personal mahasiswa untuk mampu menjadi seorang wirausahawan handal (Solomon, 1989)
Disisi lain, para ahli yang memandang pendekatan learning adalah pendekatan yang paling efektif dalam sebuah pendidikan kewirausahaan menyatakan bahwa efektifitas sebuah pendidikan kewirausahaan tidaklah mutlak diukur dari jumlah usaha baru yang mampu didirikan mahasiswa setelah ia menyelesaikan perkuliahan. Namun lebih pada kesiapan pribadi, mental, psikis dan kesiapan mahasiswa dalam mengadopsi atribut-atribut untuk menjadi seorang wirausahawan yang sukses (Kirby dan Mullen, 1990), (Gibb, 2004), (Nieuwenhuizen dan Groenwald, 2004) dan (Rae, 2000). Pendekatan learning ini dilakukan dengan argumentasi bahwa belum tentu seorang pengusaha memiliki jiwa wirausaha sehingga dengan demikian akan lebih efektif jika terlebih dahulu dibentuk jiwa wirausaha. Selain itu, argumentasi lainnya yang dikemukakan para ahli yang menyetujui pandangan ini terletak pada pendapat bahwa umumnya, mahasiswa disekolah-sekolah bisnis ataupun di fakultas ekonomi telah mengetahui mengenai konsep persiapan dalam pendirian bisnis/usaha baru melalui berbagai mata kuliah yang sebelumnya telah mereka ambil (pemasaran, keuangan, sumber daya manusia, produksi, manajemen dll). Sehingga proses pengajaran dalam mempersiapkan penyusunan proposal usaha sebenarnya hanya merupakan pengulangan serta perangkuman berbagai mata kuliah yang telah diambil sebelumnya. Dan proses ini tentunya menjadi tidak efektif karena mahasiswa umumnya telah dibekali dengan dasar ilmu dan pengetahuan yang kuat.
Dalam pendekatan learning, mahasiswa lebih banyak dituntut untuk berperan dan berpartispasi aktif dalam berkonsultasi dengan pengajarnya menyangkut kesiapan diri dan jiwanya untuk jadi seorang wirausahawan serta selalu termotivasi oleh pertanyaan mengapa dan bagaimana terhadap sesuatu. Pengajar pun dituntut untuk mampu bertindak sebagai teman ataupun mentor yang akan mampu bertindak sebagai tempat bertanya bagi para mahasiswa. Metode pengajaran pun juga berkembang. Selain perkuliahan konvensional, dilakukan juga
Jurusan Manajemen Fakultas Ekonomi Universitas Andalas
74

Jurnal Bisnis&ManajemenJurnal Business & Manajemen Vol. 1, No.1, 2005
metode pengajaran learning by doing, business clinics, mentorship, sharing experience dengan wirausahawan yang telah berhasil dsb.
Namun disayangkan, pada umumnya pendekatan learning dalam pendidikan kewirausahaan ini amat sulit untuk dilakukan mengingat sistem pendidikan dihampir seluruh negara didunia (juga di Indonesia) telah membuat mahasiswa terbiasa dengan pendekatan teaching dihampir seluruh mata perkuliahan. Kalaupun ada upaya untuk membiasakan mahasiswa dengan pendekatan learning, upaya ini masih belum membawa perubahan yang signifikan terhadap efektifitas pengajaran dalam pendidikan kewirausahaan. Padahal sebagaimana dikemukakan (Olsen dan Bossennan, 1984, hal. 53) seseorang akan memperoleh kemajuan dalam perilaku entrepreneurialnya jika ia memiliki kombinasi dari 3 atribut pokok seorang wirausahawan sebagai berikut:
1. Orientasi terhadap peran sebagai wirausahawan – yang menitikberatkan pada efektivitas
2. Kemampuan untuk berpikir secara intuitif dan rasional3. Motivasi yang menjadi alasan-alasan untuk suatu melakukan tindakan Ketiga hal tersebut diatas tentunya sulit dilakukan dan tidak akan efektif jika
dilakukan dengan pendekatan teaching. Sulitnya melakukan pendekatan learning dalam pendidikan kewirausahaan ini
tentunya membuat upaya kearah ini juga sulit untuk dilakukan. Sistem pendidikan yang telah membiasakan mahasiswa dan staf pengajar perguruan tinggi untuk melakukan pendekatan teaching tentunya amat sulit untuk dapat diubah dan disesuaikan dengan kebutuhan pendidikan kewirausahaan dalam jangka waktu cepat. Perlu dilakukan perubahan-perubahan mendasar dalam pola dan sistem pendidikan tinggi sehingga diperlukan pula waktu dan adaptasi panjang agar mahasiswa dan staf pengajar terbiasa dengan pola pendidikan dengan pendekatan learning, yang sebenarnya amat dituntut dalam pendidikan kewirausahaan. Inilah kritik dan pesimisme terbesar dari para ahli pendidikan kewirausahaan yang tetap berpendapat bahwa pendekatan teaching masih merupakan yang efektif dalam sebuah pendidikan kewirausahaan, walaupun sebenarnya hakikat utama dalam pendidikan kewirausahaan adalah bagaimana mempersiapkan seorang calon wirausahawan sukses yang memiliki bekal cukup dalam hal personality seorang wirausahawan, atribut wirausaha serta kesiapan mental untuk jadi seorang wirausahawan dibandingkan dengan hanya mempersiapkan pendirian sebuah bisnis/usaha baru melalui penyiapan perangkat/tools of business and management.
PenutupMencari orientasi dan pendekatan pendidikan kewirausahaan yang efektif
bagi mahasiswa merupakan hal yang tidak mudah untuk dilakukan. Berbagai upaya dilakukan agar orientasi dan pendekatan pendidikan kewirausahaan dapat efektif bagi mahasiswa. Namun secara umum, kebanyakan pendidikan kewirausahaan di perguruan tinggi memiliki orientasi educating about entrepreneurship yang lebih memfokuskan diri pada upaya untuk memperkenalkan tentang kewirausahaan ketimbang berorientasi educating for entrepreneurship yang berupaya untuk melakukan pendidikan tentang bagaimana berwirausaha. Orientasi pendidikan kewirausahaan yang lebih banyak pada educating about entrepreneurship ini dengan sendirinya telah mengakibatkan pendekatan kewirausahaan lebih cenderung kearah pendekatan teaching, yang sangat umum dan banyak dilakukan diperguruan tinggi didunia (termasuk perguruan tinggi Indonesia) ketimbang pendekatan learning, yang sebenarnya jauh lebih relevan dan lebih dibutuhkan dalam pendidikan kewirausahaan namun amat sulit dilakukan mengingat pola dan sistem pendidikan yang lebih condong dan lebih banyak kearah pendekatan
Jurusan Manajemen Fakultas Ekonomi Universitas Andalas
75

Jurnal Bisnis&ManajemenJurnal Business & Manajemen Vol. 1, No.1, 2005
teaching dihampir semua mata kuliah. Hal ini tentunya merupakan tantangan besar bagi pengajar dan peneliti pendidikan kewirausahaan untuk merubah paradigma, bagaimana agar orientasi dan pendekatan pendidikan kewirausahaan lebih diarahkan pada hakikat pendidikan kewirausahaan yang lebih pada orientasi educating for entrepreneurship dengan pendekatan pendidikan learning.
Jika dihubungkan dengan kondisi pendidikan kewirausahaan di Indonesia yang dapat dikatakan relatif baru, hal ini tentunya perlu dijadikan pertimbangan dasar dan utama dalam menentukan arah dan kebijakan pendidikan kewirausahaan nantinya, yang amat berhubungan dengan bagaimana proses pengajaran yang efektif agar hasil yang diharapkan juga dapat dicapai dengan sempurna. Pertanyaannya, apakah kita (dunia perguruan tinggi Indonesia) telah memiliki satu kesamaan visi tentang bagaimana sebaiknya orientasi dan pendekatan pendidikan kewirausahaan diperguruan tinggi Indonesia yang sebaiknya dilakukan?
Daftar Bacaan
Brockhaus, R.H. (2001), `Foreword` in Brockhaus, R.H., Hills, G.E., Klandt, H. Dan Welsch, H.P. (Eds.), Entrepreneurial Education : A Global View, Ashgate Publishing, Aldershot.
Bygraave, W.D. (1994), The Portable MBA in Entrepreneurship, John Wiley, Chichester
Busenitz, L.W. (1999), Entrepreneurial Risk and Strategic Decision Making : It´s a Matter of Perspective, Journal of Applied Behavioural Science, Vol. 35, No. 3, hal. 325-340
Caird, S. (1991), The Interprising Tendency of Ocupational Groups, International Small Business Journal, Vol.9, No. 4, hal. 75-81
Carland, J.W. (1982), Entrepreneurship in Small Business Settings : An Explanatory Study, Disertasi Doktoral, University of Georgia, Athens, GA.
Cromie, S. dan O’Donoghue, J. (1992), Assessing Entrepreneurial Inclinations, International Small Business Journal, Vol. 10, No. 2, hal. 66-73
Gibb, A.A. (2004), Creating Conducive Environments for Learning and Entrepreneurship, proceeding IntEnt 2004, Naples, Italia
Kets de Vries, M.F.R. (1977), The Entrepreneurial Personality : A Person at the Crossroads, Journal of Management Studies, Februari, hal. 34-57
Kirby, D.A. (2004), Entrepreneurship Education : Can Business Schools Meet the Challenge?, Emerald Insight, Vol. 46, No. 8/9, hal. 510-519
Kirby, D.A. dan Mullen, D. (1990), Developing Enterprising Undergraduates, Journal of European Industrial Training, Vol. 14, No. 2, hal 27-32
Koh, H.C. (1996), Testing Hypotheses of Entrepreneurial Characteristics, Journal of Managerial Psychology, Vol. 11, hal. 12-25
McClelland, D.C. (1961), The Achieving Society, Van Nostrand, Princeton, New Jersey
Nieuwenhuizen, C. dan Groenwald, D. (2004), Entrepreneurship Training and Education Needs as Determined by the Brain Preference Profiles of Successful Entrepreneurs, proceeding IntEnt 2004, Naples, Italia
Olsen, P. dan Bussennan, D. (1984), Attributes of the Entrepreneurial Type, Business Horizons, May-June, hal 53-56
Rae, M.D. (2000), Teaching Entrepreneurship in Asia : Impact of Pedagogical Innovation, Entrepreneurship, Innovation and Change, Vol,6, No. 3, hal 193-227
Rotter, J.B. (1966), Generalised Expectancies Internal versus External Control of Reinforcement, Psychological Monographs, Vo. 609, No.81, hal. 1.
Solomon, G. (1989), Youth : Tomorrow´s Entrepreneurs, ICSB Bulletin, Vol. XXVI, No. 5, hal 1-2
Jurusan Manajemen Fakultas Ekonomi Universitas Andalas
76

Jurnal Bisnis&ManajemenJurnal Business & Manajemen Vol. 1, No.1, 2005
Timmons, J.A. (1989), The Entrepreneurial Mind, Brian House Publishing, Andover, Masschusets
Whitting, B.G. (1988), Creativity and Entrepreneurhsip : How do they Relate?, Journal of Creative Behaviour, Vol. 22, No. 3, hal. 178-183
Jurusan Manajemen Fakultas Ekonomi Universitas Andalas
77