análise dos efeitos da interação solo-estrutura em edifícios de … · fundações...
TRANSCRIPT

© 2018 IBRACON
Volume 11, Number 5 (October 2018) p. 1076 – 1109 • ISSN 1983-4195http://dx.doi.org/10.1590/S1983-41952018000500010
Analysis of the effects of soil-structure interaction in reinforced concrete wall buildings on shallow foundation
Análise dos efeitos da interação solo-estrutura em edifícios de paredes de concreto sobre fundações superficiais
a University of São Paulo, São Carlos School of Engineering, Department of Geotechnical Engineering, São Carlos, SP, Brazil;b University of São Paulo, São Carlos School of Engineering, Department of Structural Engineering, São Carlos, SP, Brazil.
Received: 12 Jul 2017 • Accepted: 05 Feb 2018 • Available Online:
This is an open-access article distributed under the terms of the Creative Commons Attribution License
M. G. C. SANTOS a
M. R. S. CORRÊA b
Abstract
Resumo
This paper presents a study of the effects caused by soil-structure interaction in reinforced concrete wall building on shallow foundation. It was verified the influence of displacements of supports on the redistribution of internal forces in the structural walls and in the redistribution of loads on the foundation. The superstructure was represented by shell finite elements and the soil-structure interaction was evaluated by iterative methods that consider the stiffness of the building, the soil heterogeneity and the group effect of foundation elements. An alternative model that considers the soil-structure interaction is adopted and the concrete walls are simulated by bar elements. The results indicate that the soil-structure interaction produces significant changes of the stress flow, with larger influences on the lower walls, as well as a tendency of settlements standardization and load migration to supports with smaller settlements.
Keywords: reinforced concrete wall building, structural analysis, shallow foundation, soil-structure interaction.
Este artigo apresenta um estudo dos efeitos causados pela interação solo-estrutura em um edifício de paredes de concreto moldadas no local sobre fundações superficiais. Foi verificada a influência do deslocamento dos apoios na redistribuição dos esforços das paredes estruturais e dos carrega-mentos das fundações. A superestrutura foi discretizada em elementos finitos de casca e a interação solo-estrutura foi avaliada através de métodos iterativos, que consideram a rigidez da edificação, a heterogeneidade do solo e o efeito de grupo das fundações. Um modelo alternativo, em que a interação solo-estrutura é considerada de maneira simplificada e as paredes de concreto são discretizadas por elementos de barra, foi proposto e avaliado. Os resultados indicam que a interação solo-estrutura produz uma significativa modificação no fluxo de tensões, com maior influência nas paredes inferiores, bem como uma tendência de uniformização dos recalques e migração de carga para os apoios de menor recalque.
Palavras-chave: edifícios de paredes de concreto, análise estrutural, fundação superficial, interação solo-estrutura.
1. Introduction
A Concrete wall is a rationalized construction system that offers the advantages of high-scale production, in which the structure and the sealing are formed by a single system. In a concrete wall system, the window frames and electrical, sanitary and hydrau-lic installations can be incorporated. All the walls and slabs of the same cycle are concreted in a single step. Due to the high degree of industrialization, a concrete wall system is presented as a viable alternative. This constructive system is recommended for buildings that need to be executed quickly and that have a short delivery deadline and/or high repetition rate.Behavior and structural analysis of reinforced concrete wall build-ings has been topic of research in Brazil (Nunes [1] and Bra-gum [2]). The Brazilian National Standards Organization (NBR 16055:2012 [3]) regulates the quality, enforcement procedure and structural analysis of reinforced concrete wall buildings. Traditionally, in the behavior analysis of reinforced concrete wall buildings, fixed supports are considered. However, the settlement of the foundation causes the internal force redistribution in the structural elements. In short, the reinforced concrete wall system behavior is governed by superstructure, infrastructure and soil in-teraction. This mechanism is called soil-structure interaction (SSI) and has been the topic of many studies (Meyerhof [4], Chamecki [5], Goshy [6] and Gusmão [7]). Testoni [8 and 9] and Santos [10] discussed SSI in reinforced concrete wall buildings.Despite recent research and the design code, advances are still needed in knowledge regarding the reinforced concrete wall building behavior and their analysis models. In this paper,
the procedures and results of an SSI analysis of a reinforced concrete wall building with 10 floors and a shallow foundation are presented.
2. Numerical modeling of superstructure
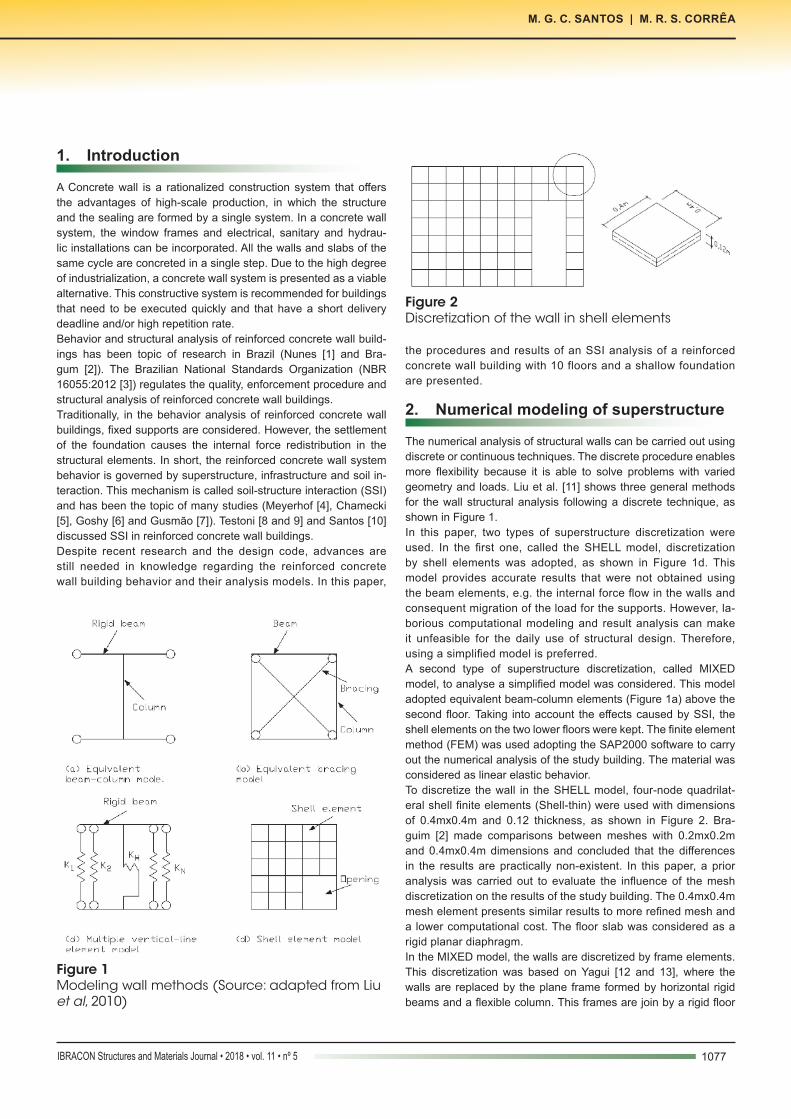
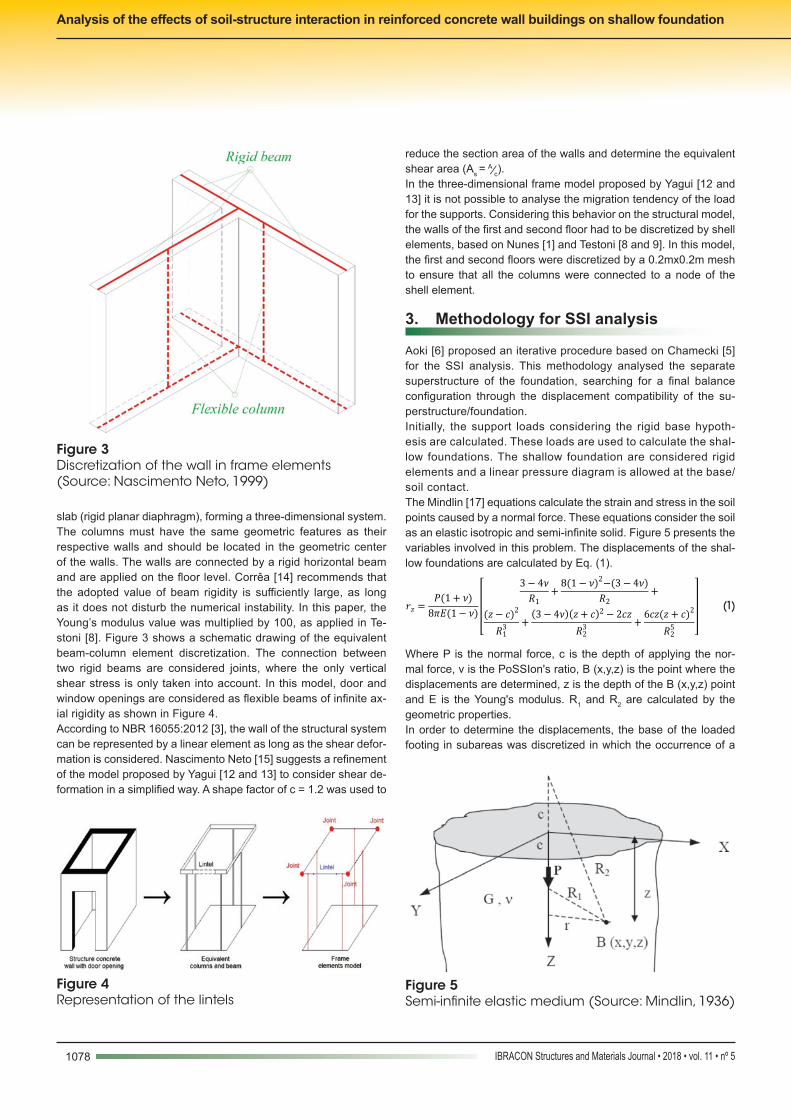
The numerical analysis of structural walls can be carried out using discrete or continuous techniques. The discrete procedure enables more flexibility because it is able to solve problems with varied geometry and loads. Liu et al. [11] shows three general methods for the wall structural analysis following a discrete technique, as shown in Figure 1.In this paper, two types of superstructure discretization were used. In the first one, called the SHELL model, discretization by shell elements was adopted, as shown in Figure 1d. This model provides accurate results that were not obtained using the beam elements, e.g. the internal force flow in the walls and consequent migration of the load for the supports. However, la-borious computational modeling and result analysis can make it unfeasible for the daily use of structural design. Therefore, using a simplified model is preferred. A second type of superstructure discretization, called MIXED model, to analyse a simplified model was considered. This model adopted equivalent beam-column elements (Figure 1a) above the second floor. Taking into account the effects caused by SSI, the shell elements on the two lower floors were kept. The finite element method (FEM) was used adopting the SAP2000 software to carry out the numerical analysis of the study building. The material was considered as linear elastic behavior.To discretize the wall in the SHELL model, four-node quadrilat-eral shell finite elements (Shell-thin) were used with dimensions of 0.4mx0.4m and 0.12 thickness, as shown in Figure 2. Bra-guim [2] made comparisons between meshes with 0.2mx0.2m and 0.4mx0.4m dimensions and concluded that the differences in the results are practically non-existent. In this paper, a prior analysis was carried out to evaluate the influence of the mesh discretization on the results of the study building. The 0.4mx0.4m mesh element presents similar results to more refined mesh and a lower computational cost. The floor slab was considered as a rigid planar diaphragm. In the MIXED model, the walls are discretized by frame elements. This discretization was based on Yagui [12 and 13], where the walls are replaced by the plane frame formed by horizontal rigid beams and a flexible column. This frames are join by a rigid floor
1077IBRACON Structures and Materials Journal • 2018 • vol. 11 • nº 5
M. G. C. SANTOS | M. R. S. CORRÊA
Figure 1Modeling wall methods (Source: adapted from Liu et al, 2010)
Figure 2Discretization of the wall in shell elements
1078 IBRACON Structures and Materials Journal • 2018 • vol. 11 • nº 5
Analysis of the effects of soil-structure interaction in reinforced concrete wall buildings on shallow foundation
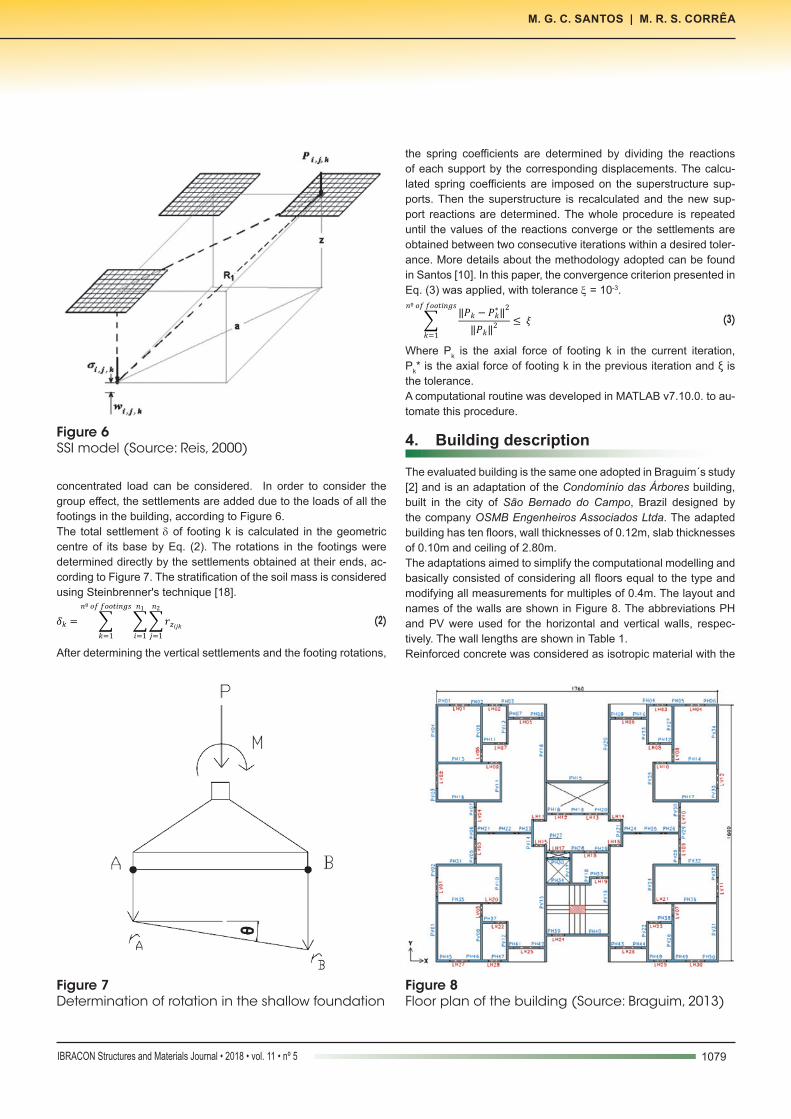
slab (rigid planar diaphragm), forming a three-dimensional system.The columns must have the same geometric features as their respective walls and should be located in the geometric center of the walls. The walls are connected by a rigid horizontal beam and are applied on the floor level. Corrêa [14] recommends that the adopted value of beam rigidity is sufficiently large, as long as it does not disturb the numerical instability. In this paper, the Young’s modulus value was multiplied by 100, as applied in Te-stoni [8]. Figure 3 shows a schematic drawing of the equivalent beam-column element discretization. The connection between two rigid beams are considered joints, where the only vertical shear stress is only taken into account. In this model, door and window openings are considered as flexible beams of infinite ax-ial rigidity as shown in Figure 4.According to NBR 16055:2012 [3], the wall of the structural system can be represented by a linear element as long as the shear defor-mation is considered. Nascimento Neto [15] suggests a refinement of the model proposed by Yagui [12 and 13] to consider shear de-formation in a simplified way. A shape factor of c = 1.2 was used to
reduce the section area of the walls and determine the equivalent shear area (As = A⁄c).In the three-dimensional frame model proposed by Yagui [12 and 13] it is not possible to analyse the migration tendency of the load for the supports. Considering this behavior on the structural model, the walls of the first and second floor had to be discretized by shell elements, based on Nunes [1] and Testoni [8 and 9]. In this model, the first and second floors were discretized by a 0.2mx0.2m mesh to ensure that all the columns were connected to a node of the shell element.
3. Methodology for SSI analysis
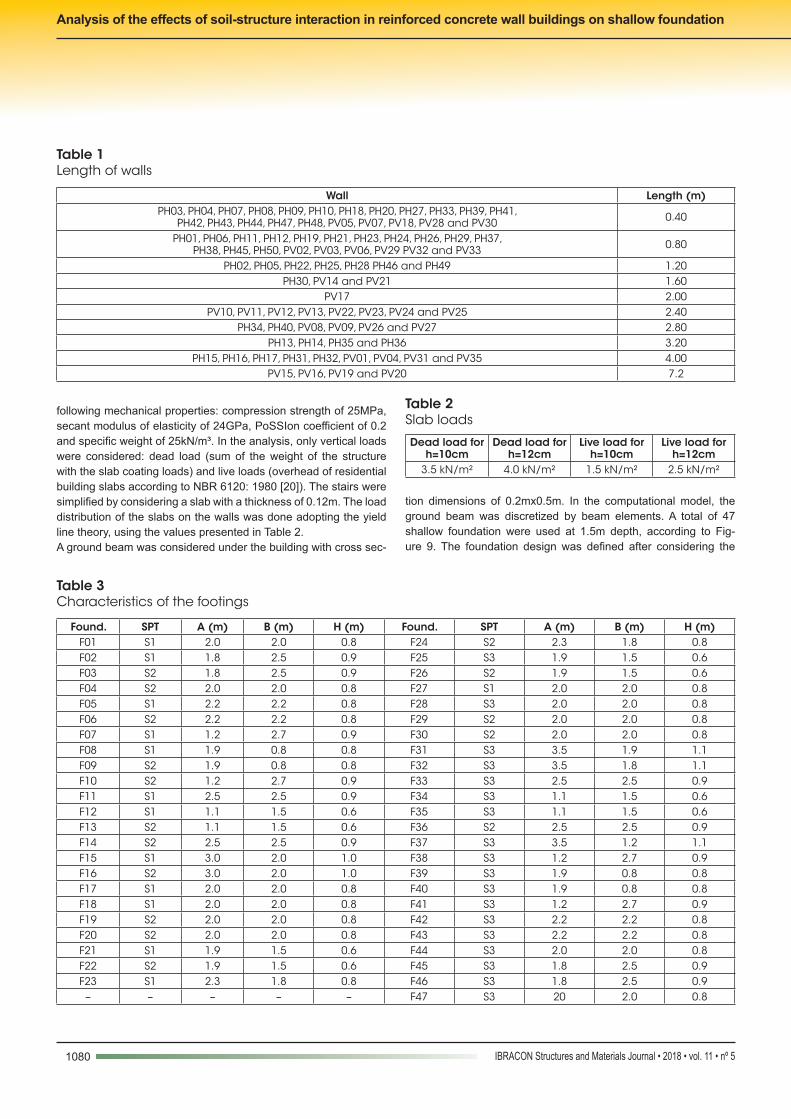
Aoki [6] proposed an iterative procedure based on Chamecki [5] for the SSI analysis. This methodology analysed the separate superstructure of the foundation, searching for a final balance configuration through the displacement compatibility of the su-perstructure/foundation.Initially, the support loads considering the rigid base hypoth-esis are calculated. These loads are used to calculate the shal-low foundations. The shallow foundation are considered rigid elements and a linear pressure diagram is allowed at the base/soil contact. The Mindlin [17] equations calculate the strain and stress in the soil points caused by a normal force. These equations consider the soil as an elastic isotropic and semi-infinite solid. Figure 5 presents the variables involved in this problem. The displacements of the shal-low foundations are calculated by Eq. (1).
(1)
Where P is the normal force, c is the depth of applying the nor-mal force, ν is the PoSSIon's ratio, B (x,y,z) is the point where the displacements are determined, z is the depth of the B (x,y,z) point and E is the Young's modulus. R1 and R2 are calculated by the geometric properties.In order to determine the displacements, the base of the loaded footing in subareas was discretized in which the occurrence of a
Figure 3Discretization of the wall in frame elements (Source: Nascimento Neto, 1999)
Figure 4Representation of the lintels
Figure 5Semi-infinite elastic medium (Source: Mindlin, 1936)
1079IBRACON Structures and Materials Journal • 2018 • vol. 11 • nº 5
M. G. C. SANTOS | M. R. S. CORRÊA
concentrated load can be considered. In order to consider the group effect, the settlements are added due to the loads of all the footings in the building, according to Figure 6.The total settlement δ of footing k is calculated in the geometric centre of its base by Eq. (2). The rotations in the footings were determined directly by the settlements obtained at their ends, ac-cording to Figure 7. The stratification of the soil mass is considered using Steinbrenner's technique [18].
(2)
After determining the vertical settlements and the footing rotations,
the spring coefficients are determined by dividing the reactions of each support by the corresponding displacements. The calcu-lated spring coefficients are imposed on the superstructure sup-ports. Then the superstructure is recalculated and the new sup-port reactions are determined. The whole procedure is repeated until the values of the reactions converge or the settlements are obtained between two consecutive iterations within a desired toler-ance. More details about the methodology adopted can be found in Santos [10]. In this paper, the convergence criterion presented in Eq. (3) was applied, with tolerance ξ = 10-3.
(3)
Where Pk is the axial force of footing k in the current iteration, Pk* is the axial force of footing k in the previous iteration and ξ is the tolerance.A computational routine was developed in MATLAB v7.10.0. to au-tomate this procedure.
4. Building description
The evaluated building is the same one adopted in Braguim´s study [2] and is an adaptation of the Condomínio das Árbores building, built in the city of São Bernado do Campo, Brazil designed by the company OSMB Engenheiros Associados Ltda. The adapted building has ten floors, wall thicknesses of 0.12m, slab thicknesses of 0.10m and ceiling of 2.80m.The adaptations aimed to simplify the computational modelling and basically consisted of considering all floors equal to the type and modifying all measurements for multiples of 0.4m. The layout and names of the walls are shown in Figure 8. The abbreviations PH and PV were used for the horizontal and vertical walls, respec-tively. The wall lengths are shown in Table 1.Reinforced concrete was considered as isotropic material with the
Figure 6SSI model (Source: Reis, 2000)
Figure 7Determination of rotation in the shallow foundation
Figure 8Floor plan of the building (Source: Braguim, 2013)
1080 IBRACON Structures and Materials Journal • 2018 • vol. 11 • nº 5
Analysis of the effects of soil-structure interaction in reinforced concrete wall buildings on shallow foundation
following mechanical properties: compression strength of 25MPa, secant modulus of elasticity of 24GPa, PoSSIon coefficient of 0.2 and specific weight of 25kN/m³. In the analysis, only vertical loads were considered: dead load (sum of the weight of the structure with the slab coating loads) and live loads (overhead of residential building slabs according to NBR 6120: 1980 [20]). The stairs were simplified by considering a slab with a thickness of 0.12m. The load distribution of the slabs on the walls was done adopting the yield line theory, using the values presented in Table 2.A ground beam was considered under the building with cross sec-
tion dimensions of 0.2mx0.5m. In the computational model, the ground beam was discretized by beam elements. A total of 47 shallow foundation were used at 1.5m depth, according to Fig-ure 9. The foundation design was defined after considering the
Table 1Length of walls
Wall Length (m)PH03, PH04, PH07, PH08, PH09, PH10, PH18, PH20, PH27, PH33, PH39, PH41,
PH42, PH43, PH44, PH47, PH48, PV05, PV07, PV18, PV28 and PV30 0.40
PH01, PH06, PH11, PH12, PH19, PH21, PH23, PH24, PH26, PH29, PH37, PH38, PH45, PH50, PV02, PV03, PV06, PV29 PV32 and PV33 0.80
PH02, PH05, PH22, PH25, PH28 PH46 and PH49 1.20PH30, PV14 and PV21 1.60
PV17 2.00PV10, PV11, PV12, PV13, PV22, PV23, PV24 and PV25 2.40
PH34, PH40, PV08, PV09, PV26 and PV27 2.80PH13, PH14, PH35 and PH36 3.20
PH15, PH16, PH17, PH31, PH32, PV01, PV04, PV31 and PV35 4.00PV15, PV16, PV19 and PV20 7.2
Table 2Slab loads
Dead load for h=10cm
Dead load for h=12cm
Live load for h=10cm
Live load for h=12cm
3.5 kN/m² 4.0 kN/m² 1.5 kN/m² 2.5 kN/m²
Table 3Characteristics of the footings
Found. SPT A (m) B (m) H (m) Found. SPT A (m) B (m) H (m)F01 S1 2.0 2.0 0.8 F24 S2 2.3 1.8 0.8F02 S1 1.8 2.5 0.9 F25 S3 1.9 1.5 0.6F03 S2 1.8 2.5 0.9 F26 S2 1.9 1.5 0.6F04 S2 2.0 2.0 0.8 F27 S1 2.0 2.0 0.8F05 S1 2.2 2.2 0.8 F28 S3 2.0 2.0 0.8F06 S2 2.2 2.2 0.8 F29 S2 2.0 2.0 0.8F07 S1 1.2 2.7 0.9 F30 S2 2.0 2.0 0.8F08 S1 1.9 0.8 0.8 F31 S3 3.5 1.9 1.1F09 S2 1.9 0.8 0.8 F32 S3 3.5 1.8 1.1F10 S2 1.2 2.7 0.9 F33 S3 2.5 2.5 0.9F11 S1 2.5 2.5 0.9 F34 S3 1.1 1.5 0.6F12 S1 1.1 1.5 0.6 F35 S3 1.1 1.5 0.6F13 S2 1.1 1.5 0.6 F36 S2 2.5 2.5 0.9F14 S2 2.5 2.5 0.9 F37 S3 3.5 1.2 1.1F15 S1 3.0 2.0 1.0 F38 S3 1.2 2.7 0.9F16 S2 3.0 2.0 1.0 F39 S3 1.9 0.8 0.8F17 S1 2.0 2.0 0.8 F40 S3 1.9 0.8 0.8F18 S1 2.0 2.0 0.8 F41 S3 1.2 2.7 0.9F19 S2 2.0 2.0 0.8 F42 S3 2.2 2.2 0.8F20 S2 2.0 2.0 0.8 F43 S3 2.2 2.2 0.8F21 S1 1.9 1.5 0.6 F44 S3 2.0 2.0 0.8F22 S2 1.9 1.5 0.6 F45 S3 1.8 2.5 0.9F23 S1 2.3 1.8 0.8 F46 S3 1.8 2.5 0.9– – – – – F47 S3 20 2.0 0.8
1081IBRACON Structures and Materials Journal • 2018 • vol. 11 • nº 5
M. G. C. SANTOS | M. R. S. CORRÊA
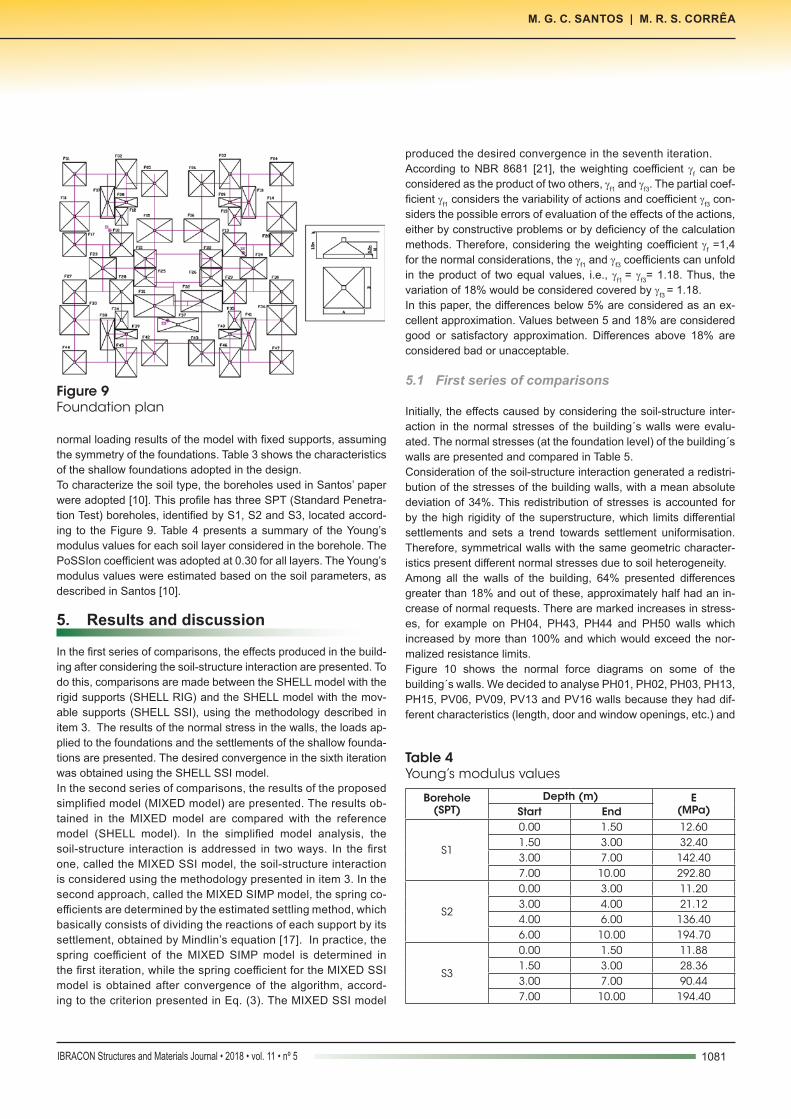
normal loading results of the model with fixed supports, assuming the symmetry of the foundations. Table 3 shows the characteristics of the shallow foundations adopted in the design.To characterize the soil type, the boreholes used in Santos’ paper were adopted [10]. This profile has three SPT (Standard Penetra-tion Test) boreholes, identified by S1, S2 and S3, located accord-ing to the Figure 9. Table 4 presents a summary of the Young’s modulus values for each soil layer considered in the borehole. The PoSSIon coefficient was adopted at 0.30 for all layers. The Young’s modulus values were estimated based on the soil parameters, as described in Santos [10].
5. Results and discussion
In the first series of comparisons, the effects produced in the build-ing after considering the soil-structure interaction are presented. To do this, comparisons are made between the SHELL model with the rigid supports (SHELL RIG) and the SHELL model with the mov-able supports (SHELL SSI), using the methodology described in item 3. The results of the normal stress in the walls, the loads ap-plied to the foundations and the settlements of the shallow founda-tions are presented. The desired convergence in the sixth iteration was obtained using the SHELL SSI model.In the second series of comparisons, the results of the proposed simplified model (MIXED model) are presented. The results ob-tained in the MIXED model are compared with the reference model (SHELL model). In the simplified model analysis, the soil-structure interaction is addressed in two ways. In the first one, called the MIXED SSI model, the soil-structure interaction is considered using the methodology presented in item 3. In the second approach, called the MIXED SIMP model, the spring co-efficients are determined by the estimated settling method, which basically consists of dividing the reactions of each support by its settlement, obtained by Mindlin’s equation [17]. In practice, the spring coefficient of the MIXED SIMP model is determined in the first iteration, while the spring coefficient for the MIXED SSI model is obtained after convergence of the algorithm, accord-ing to the criterion presented in Eq. (3). The MIXED SSI model
produced the desired convergence in the seventh iteration.According to NBR 8681 [21], the weighting coefficient γf can be considered as the product of two others, γf1 and γf3. The partial coef-ficient γf1 considers the variability of actions and coefficient γf3 con-siders the possible errors of evaluation of the effects of the actions, either by constructive problems or by deficiency of the calculation methods. Therefore, considering the weighting coefficient γf =1,4 for the normal considerations, the γf1 and γf3 coefficients can unfold in the product of two equal values, i.e., γf1 = γf3= 1.18. Thus, the variation of 18% would be considered covered by γf3 = 1.18.In this paper, the differences below 5% are considered as an ex-cellent approximation. Values between 5 and 18% are considered good or satisfactory approximation. Differences above 18% are considered bad or unacceptable.
5.1 First series of comparisons
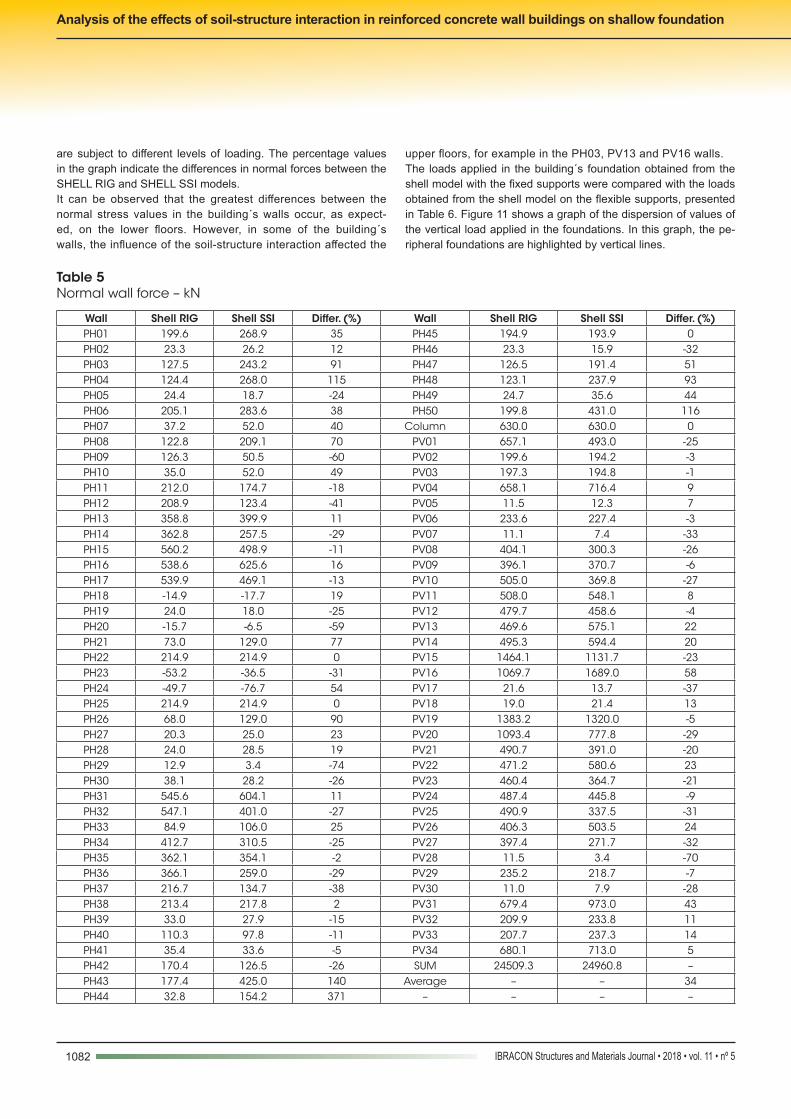
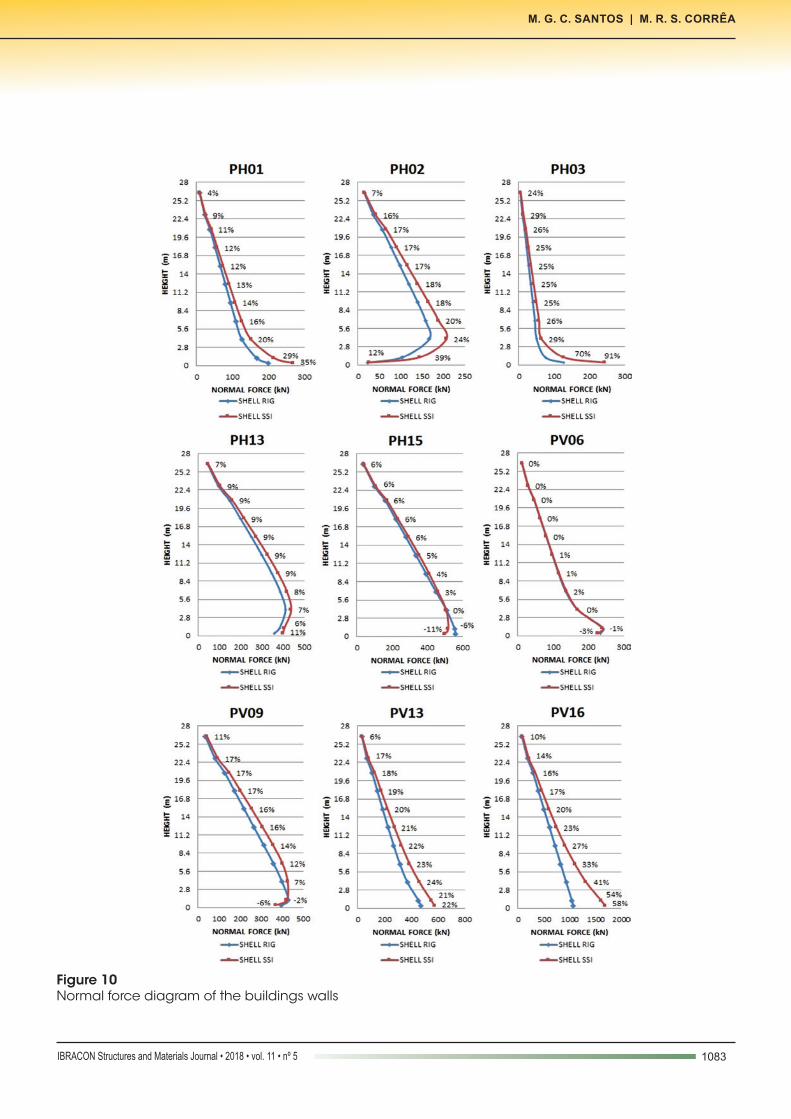
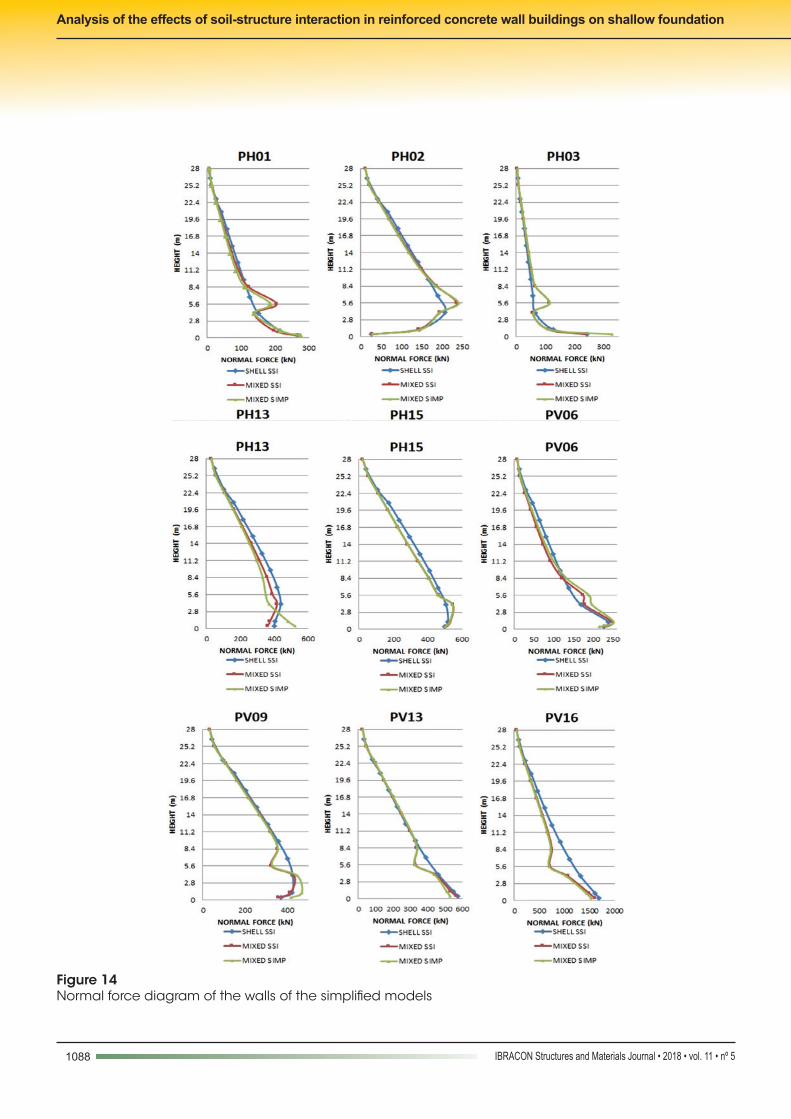
Initially, the effects caused by considering the soil-structure inter-action in the normal stresses of the building´s walls were evalu-ated. The normal stresses (at the foundation level) of the building´s walls are presented and compared in Table 5.Consideration of the soil-structure interaction generated a redistri-bution of the stresses of the building walls, with a mean absolute deviation of 34%. This redistribution of stresses is accounted for by the high rigidity of the superstructure, which limits differential settlements and sets a trend towards settlement uniformisation. Therefore, symmetrical walls with the same geometric character-istics present different normal stresses due to soil heterogeneity.Among all the walls of the building, 64% presented differences greater than 18% and out of these, approximately half had an in-crease of normal requests. There are marked increases in stress-es, for example on PH04, PH43, PH44 and PH50 walls which increased by more than 100% and which would exceed the nor-malized resistance limits.Figure 10 shows the normal force diagrams on some of the building´s walls. We decided to analyse PH01, PH02, PH03, PH13, PH15, PV06, PV09, PV13 and PV16 walls because they had dif-ferent characteristics (length, door and window openings, etc.) and
Figure 9Foundation plan
Table 4Young’s modulus values
Borehole (SPT)
Depth (m) E(MPa)Start End
S1
0.00 1.50 12.601.50 3.00 32.403.00 7.00 142.407.00 10.00 292.80
S2
0.00 3.00 11.203.00 4.00 21.124.00 6.00 136.406.00 10.00 194.70
S3
0.00 1.50 11.881.50 3.00 28.363.00 7.00 90.447.00 10.00 194.40
1082 IBRACON Structures and Materials Journal • 2018 • vol. 11 • nº 5
Analysis of the effects of soil-structure interaction in reinforced concrete wall buildings on shallow foundation
are subject to different levels of loading. The percentage values in the graph indicate the differences in normal forces between the SHELL RIG and SHELL SSI models.It can be observed that the greatest differences between the normal stress values in the building´s walls occur, as expect-ed, on the lower floors. However, in some of the building´s walls, the influence of the soil-structure interaction affected the
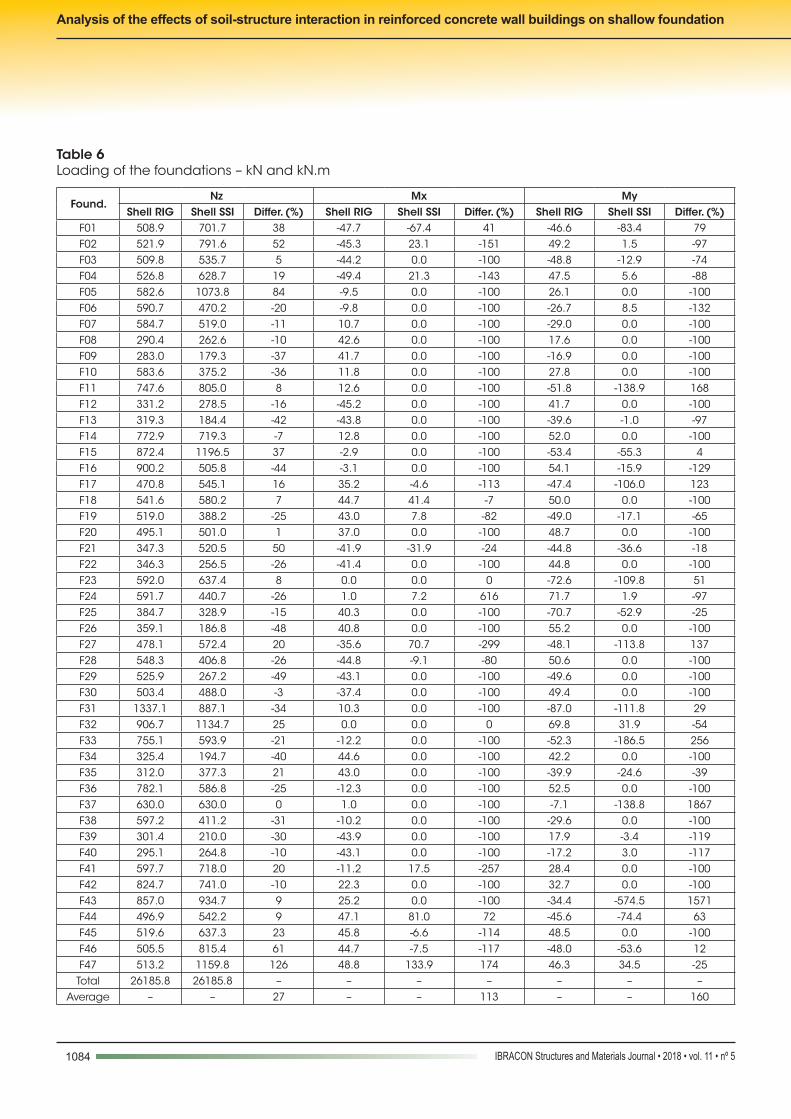
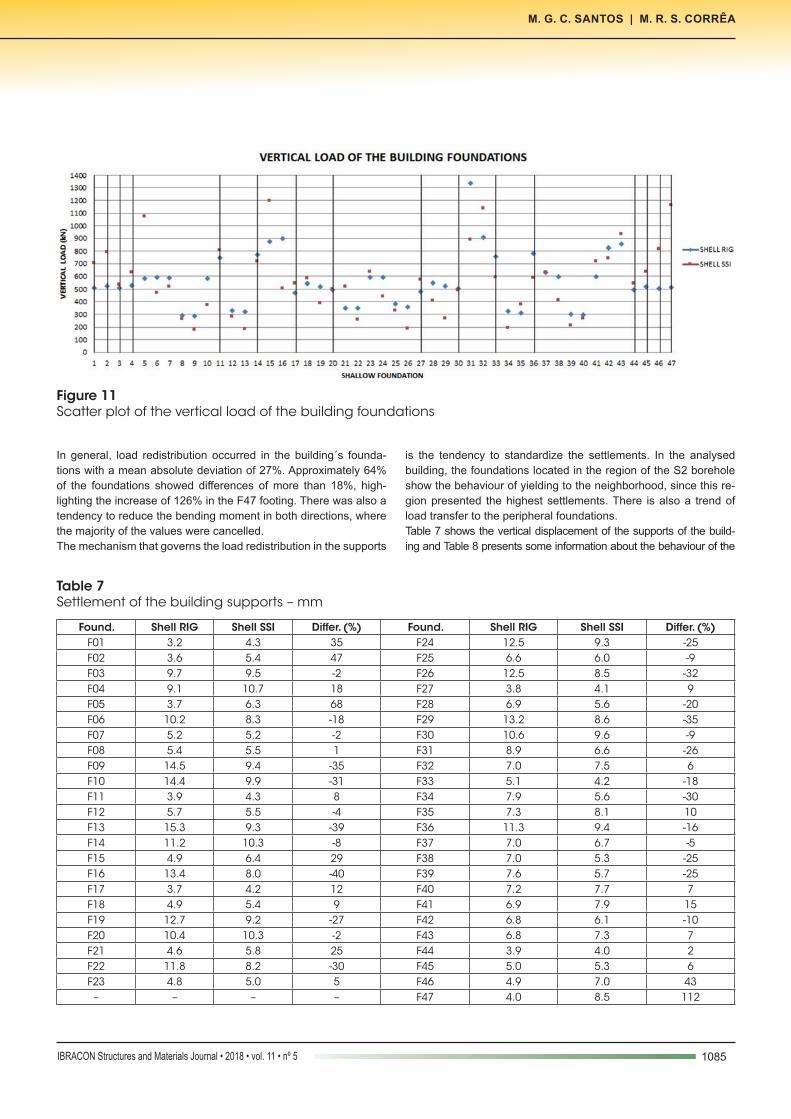
upper floors, for example in the PH03, PV13 and PV16 walls.The loads applied in the building´s foundation obtained from the shell model with the fixed supports were compared with the loads obtained from the shell model on the flexible supports, presented in Table 6. Figure 11 shows a graph of the dispersion of values of the vertical load applied in the foundations. In this graph, the pe-ripheral foundations are highlighted by vertical lines.
Table 5Normal wall force – kN
Wall Shell RIG Shell SSI Differ. (%) Wall Shell RIG Shell SSI Differ. (%)PH01 199.6 268.9 35 PH45 194.9 193.9 0PH02 23.3 26.2 12 PH46 23.3 15.9 -32PH03 127.5 243.2 91 PH47 126.5 191.4 51PH04 124.4 268.0 115 PH48 123.1 237.9 93PH05 24.4 18.7 -24 PH49 24.7 35.6 44PH06 205.1 283.6 38 PH50 199.8 431.0 116PH07 37.2 52.0 40 Column 630.0 630.0 0PH08 122.8 209.1 70 PV01 657.1 493.0 -25PH09 126.3 50.5 -60 PV02 199.6 194.2 -3PH10 35.0 52.0 49 PV03 197.3 194.8 -1PH11 212.0 174.7 -18 PV04 658.1 716.4 9PH12 208.9 123.4 -41 PV05 11.5 12.3 7PH13 358.8 399.9 11 PV06 233.6 227.4 -3PH14 362.8 257.5 -29 PV07 11.1 7.4 -33PH15 560.2 498.9 -11 PV08 404.1 300.3 -26PH16 538.6 625.6 16 PV09 396.1 370.7 -6PH17 539.9 469.1 -13 PV10 505.0 369.8 -27PH18 -14.9 -17.7 19 PV11 508.0 548.1 8PH19 24.0 18.0 -25 PV12 479.7 458.6 -4PH20 -15.7 -6.5 -59 PV13 469.6 575.1 22PH21 73.0 129.0 77 PV14 495.3 594.4 20PH22 214.9 214.9 0 PV15 1464.1 1131.7 -23PH23 -53.2 -36.5 -31 PV16 1069.7 1689.0 58PH24 -49.7 -76.7 54 PV17 21.6 13.7 -37PH25 214.9 214.9 0 PV18 19.0 21.4 13PH26 68.0 129.0 90 PV19 1383.2 1320.0 -5PH27 20.3 25.0 23 PV20 1093.4 777.8 -29PH28 24.0 28.5 19 PV21 490.7 391.0 -20PH29 12.9 3.4 -74 PV22 471.2 580.6 23PH30 38.1 28.2 -26 PV23 460.4 364.7 -21PH31 545.6 604.1 11 PV24 487.4 445.8 -9PH32 547.1 401.0 -27 PV25 490.9 337.5 -31PH33 84.9 106.0 25 PV26 406.3 503.5 24PH34 412.7 310.5 -25 PV27 397.4 271.7 -32PH35 362.1 354.1 -2 PV28 11.5 3.4 -70PH36 366.1 259.0 -29 PV29 235.2 218.7 -7PH37 216.7 134.7 -38 PV30 11.0 7.9 -28PH38 213.4 217.8 2 PV31 679.4 973.0 43PH39 33.0 27.9 -15 PV32 209.9 233.8 11PH40 110.3 97.8 -11 PV33 207.7 237.3 14PH41 35.4 33.6 -5 PV34 680.1 713.0 5PH42 170.4 126.5 -26 SUM 24509.3 24960.8 –PH43 177.4 425.0 140 Average – – 34PH44 32.8 154.2 371 – – – –
1083IBRACON Structures and Materials Journal • 2018 • vol. 11 • nº 5
M. G. C. SANTOS | M. R. S. CORRÊA
Figure 10Normal force diagram of the buildings walls
1084 IBRACON Structures and Materials Journal • 2018 • vol. 11 • nº 5
Analysis of the effects of soil-structure interaction in reinforced concrete wall buildings on shallow foundation
Table 6Loading of the foundations – kN and kN.m
Found.Nz Mx My
Shell RIG Shell SSI Differ. (%) Shell RIG Shell SSI Differ. (%) Shell RIG Shell SSI Differ. (%)F01 508.9 701.7 38 -47.7 -67.4 41 -46.6 -83.4 79F02 521.9 791.6 52 -45.3 23.1 -151 49.2 1.5 -97F03 509.8 535.7 5 -44.2 0.0 -100 -48.8 -12.9 -74F04 526.8 628.7 19 -49.4 21.3 -143 47.5 5.6 -88F05 582.6 1073.8 84 -9.5 0.0 -100 26.1 0.0 -100F06 590.7 470.2 -20 -9.8 0.0 -100 -26.7 8.5 -132F07 584.7 519.0 -11 10.7 0.0 -100 -29.0 0.0 -100F08 290.4 262.6 -10 42.6 0.0 -100 17.6 0.0 -100F09 283.0 179.3 -37 41.7 0.0 -100 -16.9 0.0 -100F10 583.6 375.2 -36 11.8 0.0 -100 27.8 0.0 -100F11 747.6 805.0 8 12.6 0.0 -100 -51.8 -138.9 168F12 331.2 278.5 -16 -45.2 0.0 -100 41.7 0.0 -100F13 319.3 184.4 -42 -43.8 0.0 -100 -39.6 -1.0 -97F14 772.9 719.3 -7 12.8 0.0 -100 52.0 0.0 -100F15 872.4 1196.5 37 -2.9 0.0 -100 -53.4 -55.3 4F16 900.2 505.8 -44 -3.1 0.0 -100 54.1 -15.9 -129F17 470.8 545.1 16 35.2 -4.6 -113 -47.4 -106.0 123F18 541.6 580.2 7 44.7 41.4 -7 50.0 0.0 -100F19 519.0 388.2 -25 43.0 7.8 -82 -49.0 -17.1 -65F20 495.1 501.0 1 37.0 0.0 -100 48.7 0.0 -100F21 347.3 520.5 50 -41.9 -31.9 -24 -44.8 -36.6 -18F22 346.3 256.5 -26 -41.4 0.0 -100 44.8 0.0 -100F23 592.0 637.4 8 0.0 0.0 0 -72.6 -109.8 51F24 591.7 440.7 -26 1.0 7.2 616 71.7 1.9 -97F25 384.7 328.9 -15 40.3 0.0 -100 -70.7 -52.9 -25F26 359.1 186.8 -48 40.8 0.0 -100 55.2 0.0 -100F27 478.1 572.4 20 -35.6 70.7 -299 -48.1 -113.8 137F28 548.3 406.8 -26 -44.8 -9.1 -80 50.6 0.0 -100F29 525.9 267.2 -49 -43.1 0.0 -100 -49.6 0.0 -100F30 503.4 488.0 -3 -37.4 0.0 -100 49.4 0.0 -100F31 1337.1 887.1 -34 10.3 0.0 -100 -87.0 -111.8 29F32 906.7 1134.7 25 0.0 0.0 0 69.8 31.9 -54F33 755.1 593.9 -21 -12.2 0.0 -100 -52.3 -186.5 256F34 325.4 194.7 -40 44.6 0.0 -100 42.2 0.0 -100F35 312.0 377.3 21 43.0 0.0 -100 -39.9 -24.6 -39F36 782.1 586.8 -25 -12.3 0.0 -100 52.5 0.0 -100F37 630.0 630.0 0 1.0 0.0 -100 -7.1 -138.8 1867F38 597.2 411.2 -31 -10.2 0.0 -100 -29.6 0.0 -100F39 301.4 210.0 -30 -43.9 0.0 -100 17.9 -3.4 -119F40 295.1 264.8 -10 -43.1 0.0 -100 -17.2 3.0 -117F41 597.7 718.0 20 -11.2 17.5 -257 28.4 0.0 -100F42 824.7 741.0 -10 22.3 0.0 -100 32.7 0.0 -100F43 857.0 934.7 9 25.2 0.0 -100 -34.4 -574.5 1571F44 496.9 542.2 9 47.1 81.0 72 -45.6 -74.4 63F45 519.6 637.3 23 45.8 -6.6 -114 48.5 0.0 -100F46 505.5 815.4 61 44.7 -7.5 -117 -48.0 -53.6 12F47 513.2 1159.8 126 48.8 133.9 174 46.3 34.5 -25Total 26185.8 26185.8 – – – – – – –
Average – – 27 – – 113 – – 160
1085IBRACON Structures and Materials Journal • 2018 • vol. 11 • nº 5
M. G. C. SANTOS | M. R. S. CORRÊA
In general, load redistribution occurred in the building´s founda-tions with a mean absolute deviation of 27%. Approximately 64% of the foundations showed differences of more than 18%, high-lighting the increase of 126% in the F47 footing. There was also a tendency to reduce the bending moment in both directions, where the majority of the values were cancelled.The mechanism that governs the load redistribution in the supports
is the tendency to standardize the settlements. In the analysed building, the foundations located in the region of the S2 borehole show the behaviour of yielding to the neighborhood, since this re-gion presented the highest settlements. There is also a trend of load transfer to the peripheral foundations.Table 7 shows the vertical displacement of the supports of the build-ing and Table 8 presents some information about the behaviour of the
Figure 11Scatter plot of the vertical load of the building foundations
Table 7Settlement of the building supports – mm
Found. Shell RIG Shell SSI Differ. (%) Found. Shell RIG Shell SSI Differ. (%)F01 3.2 4.3 35 F24 12.5 9.3 -25F02 3.6 5.4 47 F25 6.6 6.0 -9F03 9.7 9.5 -2 F26 12.5 8.5 -32F04 9.1 10.7 18 F27 3.8 4.1 9F05 3.7 6.3 68 F28 6.9 5.6 -20F06 10.2 8.3 -18 F29 13.2 8.6 -35F07 5.2 5.2 -2 F30 10.6 9.6 -9F08 5.4 5.5 1 F31 8.9 6.6 -26F09 14.5 9.4 -35 F32 7.0 7.5 6F10 14.4 9.9 -31 F33 5.1 4.2 -18F11 3.9 4.3 8 F34 7.9 5.6 -30F12 5.7 5.5 -4 F35 7.3 8.1 10F13 15.3 9.3 -39 F36 11.3 9.4 -16F14 11.2 10.3 -8 F37 7.0 6.7 -5F15 4.9 6.4 29 F38 7.0 5.3 -25F16 13.4 8.0 -40 F39 7.6 5.7 -25F17 3.7 4.2 12 F40 7.2 7.7 7F18 4.9 5.4 9 F41 6.9 7.9 15F19 12.7 9.2 -27 F42 6.8 6.1 -10F20 10.4 10.3 -2 F43 6.8 7.3 7F21 4.6 5.8 25 F44 3.9 4.0 2F22 11.8 8.2 -30 F45 5.0 5.3 6F23 4.8 5.0 5 F46 4.9 7.0 43– – – – F47 4.0 8.5 112
1086 IBRACON Structures and Materials Journal • 2018 • vol. 11 • nº 5
Analysis of the effects of soil-structure interaction in reinforced concrete wall buildings on shallow foundation
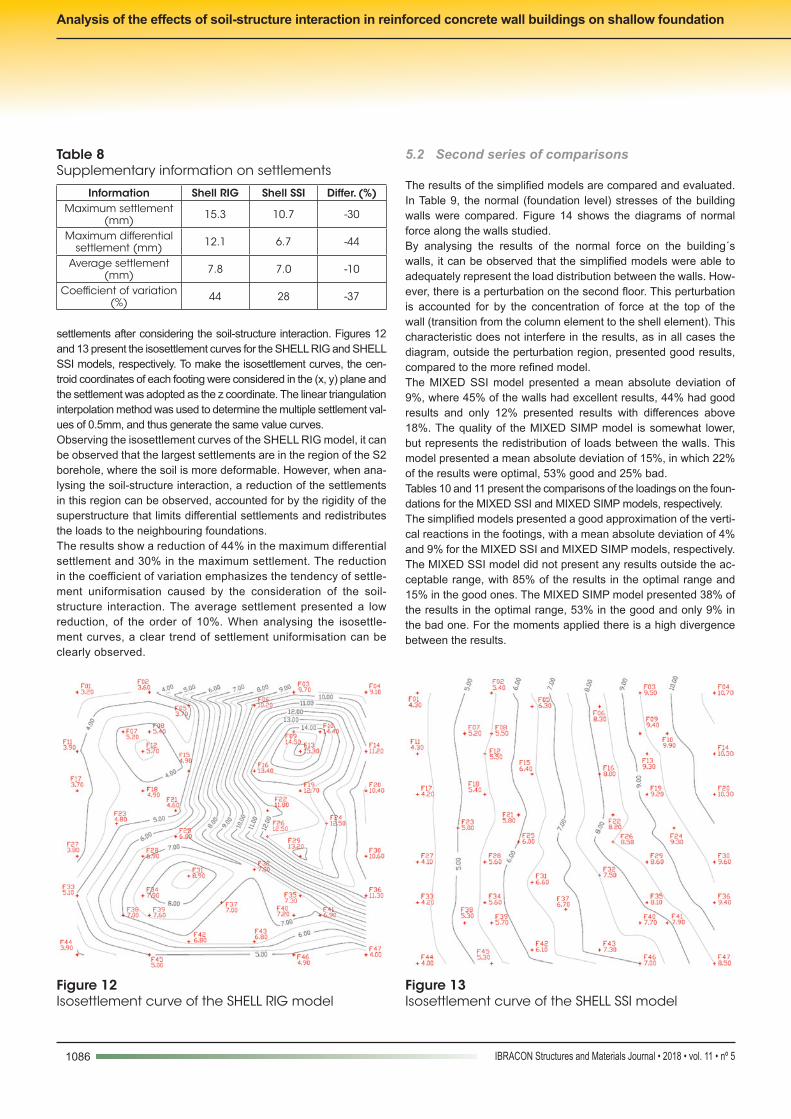
settlements after considering the soil-structure interaction. Figures 12 and 13 present the isosettlement curves for the SHELL RIG and SHELL SSI models, respectively. To make the isosettlement curves, the cen-troid coordinates of each footing were considered in the (x, y) plane and the settlement was adopted as the z coordinate. The linear triangulation interpolation method was used to determine the multiple settlement val-ues of 0.5mm, and thus generate the same value curves.Observing the isosettlement curves of the SHELL RIG model, it can be observed that the largest settlements are in the region of the S2 borehole, where the soil is more deformable. However, when ana-lysing the soil-structure interaction, a reduction of the settlements in this region can be observed, accounted for by the rigidity of the superstructure that limits differential settlements and redistributes the loads to the neighbouring foundations.The results show a reduction of 44% in the maximum differential settlement and 30% in the maximum settlement. The reduction in the coefficient of variation emphasizes the tendency of settle-ment uniformisation caused by the consideration of the soil-structure interaction. The average settlement presented a low reduction, of the order of 10%. When analysing the isosettle-ment curves, a clear trend of settlement uniformisation can be clearly observed.
5.2 Second series of comparisons
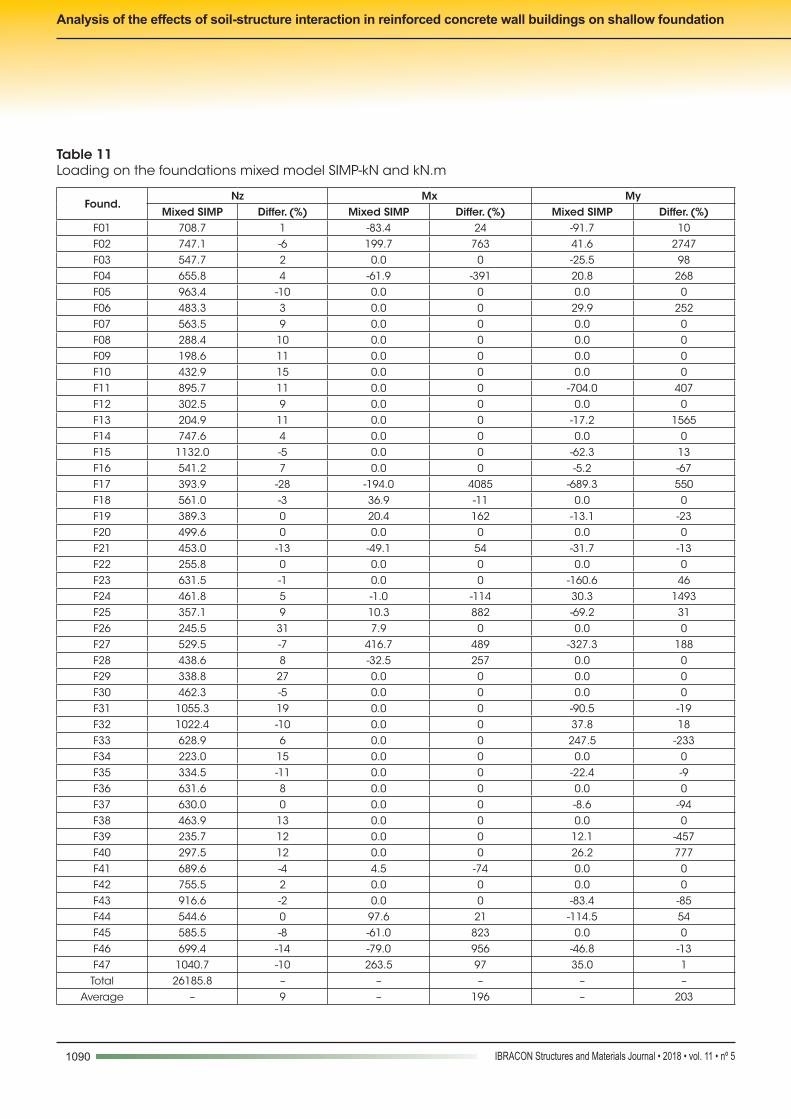
The results of the simplified models are compared and evaluated. In Table 9, the normal (foundation level) stresses of the building walls were compared. Figure 14 shows the diagrams of normal force along the walls studied.By analysing the results of the normal force on the building´s walls, it can be observed that the simplified models were able to adequately represent the load distribution between the walls. How-ever, there is a perturbation on the second floor. This perturbation is accounted for by the concentration of force at the top of the wall (transition from the column element to the shell element). This characteristic does not interfere in the results, as in all cases the diagram, outside the perturbation region, presented good results, compared to the more refined model.The MIXED SSI model presented a mean absolute deviation of 9%, where 45% of the walls had excellent results, 44% had good results and only 12% presented results with differences above 18%. The quality of the MIXED SIMP model is somewhat lower, but represents the redistribution of loads between the walls. This model presented a mean absolute deviation of 15%, in which 22% of the results were optimal, 53% good and 25% bad.Tables 10 and 11 present the comparisons of the loadings on the foun-dations for the MIXED SSI and MIXED SIMP models, respectively.The simplified models presented a good approximation of the verti-cal reactions in the footings, with a mean absolute deviation of 4% and 9% for the MIXED SSI and MIXED SIMP models, respectively. The MIXED SSI model did not present any results outside the ac-ceptable range, with 85% of the results in the optimal range and 15% in the good ones. The MIXED SIMP model presented 38% of the results in the optimal range, 53% in the good and only 9% in the bad one. For the moments applied there is a high divergence between the results.
Table 8Supplementary information on settlements
Information Shell RIG Shell SSI Differ. (%)Maximum settlement
(mm) 15.3 10.7 -30
Maximum differential settlement (mm) 12.1 6.7 -44
Average settlement (mm) 7.8 7.0 -10
Coefficient of variation (%) 44 28 -37
Figure 12Isosettlement curve of the SHELL RIG model
Figure 13Isosettlement curve of the SHELL SSI model
1087IBRACON Structures and Materials Journal • 2018 • vol. 11 • nº 5
M. G. C. SANTOS | M. R. S. CORRÊA
Table 9Normal wall strength in the simplified models – kN
Wall Shell RIG Shell SSI Differ. (%) Wall Shell RIG Shell SSI Differ. (%) Shell SSI Differ. (%)PH01 265.5 -1 276.1 3 PH45 222.0 14 194.4 0PH02 28.0 7 27.3 4 PH46 17.3 9 17.8 12PH03 240.3 -1 329.0 35 PH47 211.7 11 218.2 14PH04 260.4 -3 180.7 -33 PH48 230.1 -3 254.0 7PH05 20.0 7 19.4 4 PH49 37.0 4 32.3 -9PH06 282.0 -1 257.2 -9 PH50 445.2 3 304.2 -29PH07 60.0 15 46.8 -10 Column 630.0 0 630.0 0PH08 197.4 -6 185.9 -11 PV01 542.5 10 650.0 32PH09 45.7 -9 54.5 8 PV02 223.7 15 159.0 -18PH10 63.0 21 71.5 37 PV03 199.5 2 160.0 -18PH11 171.9 -2 166.4 -5 PV04 703.1 -2 249.6 -65PH12 132.4 7 138.2 12 PV05 14.8 20 16.1 31PH13 362.8 -9 523.0 31 PV06 234.8 3 216.7 -5PH14 251.4 -2 258.1 0 PV07 6.0 -19 5.0 -33PH15 509.7 2 501.9 1 PV08 315.2 5 353.3 18PH16 584.8 -7 810.0 29 PV09 357.0 -4 418.6 13PH17 477.9 2 500.2 7 PV10 378.7 2 410.2 11PH18 -26.0 47 -23.0 30 PV11 538.6 -2 537.4 -2PH19 26.0 44 27.6 53 PV12 473.3 3 414.1 -10PH20 -9.0 39 -7.0 8 PV13 565.8 -2 530.0 -8PH21 135.4 5 149.7 16 PV14 569.9 -4 535.8 -10PH22 214.9 0 214.9 0 PV15 1237.7 9 1327.7 17PH23 -30.0 -18 -29.0 -21 PV16 1601.4 -5 1531.3 -9PH24 -73.6 -4 -68.9 -10 PV17 13.5 -1 14.7 8PH25 214.9 0 214.9 0 PV18 21.0 -2 17.2 -20PH26 111.0 -14 120.0 -7 PV19 1510.0 14 1440.5 9PH27 28.4 14 27.8 11 PV20 732.2 -6 823.1 6PH28 32.4 14 25.8 -10 PV21 449.8 15 470.8 20PH29 4.0 19 5.0 48 PV22 560.0 -4 568.6 -2PH30 31.1 10 32.8 16 PV23 368.5 1 358.6 -2PH31 550.5 -9 887.0 47 PV24 468.9 5 449.6 1PH32 386.6 -4 438.8 9 PV25 368.3 9 356.5 6PH33 108.0 2 91.4 -14 PV26 483.4 -4 473.7 -6PH34 339.4 9 347.9 12 PV27 291.3 7 317.0 17PH35 303.6 -14 236.0 -33 PV28 3.0 -13 3.0 -13PH36 233.8 -10 273.3 6 PV29 250.0 14 224.0 2PH37 145.0 8 145.2 8 PV30 8.4 6 9.4 19PH38 204.8 -6 198.4 -9 PV31 912.0 -6 1001.7 3PH39 28.4 2 27.1 -3 PV32 245.1 5 213.1 -9PH40 90.6 -7 81.4 -17 PV33 256.2 8 207.8 -12PH41 43.4 29 27.7 -17 PV34 804.0 13 786.7 10PH42 123.1 -3 124.7 -1 SUM 25059.1 – 25179.1 –PH43 285.0 -33 289.6 -32 Average – 9 – 15PH44 103.0 -33 72.0 -53 – – – – –
Table 12 shows the estimated settlements for the building founda-tions. Table 13 presents some additional information.The MIXED SSI model presented excellent results, with a differ-ence of 1% in the mean settlement and a difference of 5% for the maximum settlement and maximum differential settlement. In this model, none of the absolute settlements exceeded the 18% differ-ence limit. The MIXED SIMP model presented a mean difference
of 2%, 3% for the maximum and the 15% for the maximum differ-ential. In this model only three foundations presented differences higher than the limit of 18%.
6. Conclusions
Consideration of the soil-structure interaction caused a general
1088 IBRACON Structures and Materials Journal • 2018 • vol. 11 • nº 5
Analysis of the effects of soil-structure interaction in reinforced concrete wall buildings on shallow foundation
Figure 14Normal force diagram of the walls of the simplified models

1089IBRACON Structures and Materials Journal • 2018 • vol. 11 • nº 5
M. G. C. SANTOS | M. R. S. CORRÊA
Table 10Loading on the foundations of the mixed model SSI – kN and kN.m
Found.Nz Mx My
Mixed SSI Differ. (%) Mixed SSI Differ. (%) Mixed SSI Differ. (%)F01 682.2 -3 -68.6 2 -84.1 1F02 768.3 -3 -24.6 -206 2.9 98F03 570.8 7 0.0 0 -16.0 24F04 657.2 5 -1.4 -106 -71.0 -1359F05 1032.6 -4 0.0 0 0.0 0F06 468.1 0 0.0 0 -9.6 -213F07 502.1 -3 0.0 0 0.0 0F08 248.5 -5 0.0 0 0.0 0F09 190.0 6 0.0 0 0.0 0F10 399.1 6 0.0 0 0.0 0F11 771.7 -4 0.0 0 -110.8 -20F12 273.3 -2 0.0 0 0.0 0F13 191.2 4 0.0 0 0.0 -100F14 750.6 4 0.0 0 0.0 0F15 1164.9 -3 0.0 0 -61.3 11F16 499.3 -1 0.0 0 8.7 -154F17 525.1 -4 10.5 -327 -86.8 -18F18 561.8 -3 42.0 1 0.0 0F19 410.9 6 16.9 118 -10.9 -37F20 524.2 5 0.0 0 0.0 0F21 515.9 -1 -38.8 22 -30.4 -17F22 272.9 6 0.0 0 0.0 0F23 645.4 1 0.0 0 -115.1 5F24 454.8 3 16.5 130 -19.1 -1104F25 325.2 -1 0.0 -100 -72.9 38F26 196.0 5 0.0 0 0.0 0F27 595.2 4 -39.8 -156 -96.7 -15F28 418.1 3 -11.9 31 0.0 0F29 253.5 -5 0.0 0 0.0 0F30 490.6 1 0.0 0 0.0 0F31 929.9 5 0.0 0 -119.1 7F32 1175.0 4 0.0 0 47.0 47F33 610.0 3 0.0 0 -98.6 -47F34 195.9 1 0.0 0 0.0 0F35 367.4 -3 0.0 0 10.5 -143F36 581.7 -1 0.0 0 0.0 0F37 630.0 0 0.0 0 -136.7 -1F38 428.6 4 0.0 0 0.0 0F39 219.5 5 0.0 0 1.2 -136F40 240.6 -9 0.0 0 2.1 -31F41 691.9 -4 3.1 -82 0.0 0F42 771.4 4 0.0 0 0.0 0F43 904.7 -3 0.0 0 -30.0 -95F44 548.7 1 49.7 -39 -83.2 12F45 659.2 3 9.7 -246 0.0 0F46 733.2 -10 8.1 -208 -25.1 -53F47 1138.8 -2 112.2 -16 99.9 189Total 26185.8 – – – – –
Average – 4 – 38 – 85
1090 IBRACON Structures and Materials Journal • 2018 • vol. 11 • nº 5
Analysis of the effects of soil-structure interaction in reinforced concrete wall buildings on shallow foundation
Table 11Loading on the foundations mixed model SIMP-kN and kN.m
Found.Nz Mx My
Mixed SIMP Differ. (%) Mixed SIMP Differ. (%) Mixed SIMP Differ. (%)F01 708.7 1 -83.4 24 -91.7 10F02 747.1 -6 199.7 763 41.6 2747F03 547.7 2 0.0 0 -25.5 98F04 655.8 4 -61.9 -391 20.8 268F05 963.4 -10 0.0 0 0.0 0F06 483.3 3 0.0 0 29.9 252F07 563.5 9 0.0 0 0.0 0F08 288.4 10 0.0 0 0.0 0F09 198.6 11 0.0 0 0.0 0F10 432.9 15 0.0 0 0.0 0F11 895.7 11 0.0 0 -704.0 407F12 302.5 9 0.0 0 0.0 0F13 204.9 11 0.0 0 -17.2 1565F14 747.6 4 0.0 0 0.0 0F15 1132.0 -5 0.0 0 -62.3 13F16 541.2 7 0.0 0 -5.2 -67F17 393.9 -28 -194.0 4085 -689.3 550F18 561.0 -3 36.9 -11 0.0 0F19 389.3 0 20.4 162 -13.1 -23F20 499.6 0 0.0 0 0.0 0F21 453.0 -13 -49.1 54 -31.7 -13F22 255.8 0 0.0 0 0.0 0F23 631.5 -1 0.0 0 -160.6 46F24 461.8 5 -1.0 -114 30.3 1493F25 357.1 9 10.3 882 -69.2 31F26 245.5 31 7.9 0 0.0 0F27 529.5 -7 416.7 489 -327.3 188F28 438.6 8 -32.5 257 0.0 0F29 338.8 27 0.0 0 0.0 0F30 462.3 -5 0.0 0 0.0 0F31 1055.3 19 0.0 0 -90.5 -19F32 1022.4 -10 0.0 0 37.8 18F33 628.9 6 0.0 0 247.5 -233F34 223.0 15 0.0 0 0.0 0F35 334.5 -11 0.0 0 -22.4 -9F36 631.6 8 0.0 0 0.0 0F37 630.0 0 0.0 0 -8.6 -94F38 463.9 13 0.0 0 0.0 0F39 235.7 12 0.0 0 12.1 -457F40 297.5 12 0.0 0 26.2 777F41 689.6 -4 4.5 -74 0.0 0F42 755.5 2 0.0 0 0.0 0F43 916.6 -2 0.0 0 -83.4 -85F44 544.6 0 97.6 21 -114.5 54F45 585.5 -8 -61.0 823 0.0 0F46 699.4 -14 -79.0 956 -46.8 -13F47 1040.7 -10 263.5 97 35.0 1Total 26185.8 – – – – –
Average – 9 – 196 – 203

1091IBRACON Structures and Materials Journal • 2018 • vol. 11 • nº 5
M. G. C. SANTOS | M. R. S. CORRÊA
Table 12Settlement for simplified models – mm
Found. Mixed SSI Differ. (%) Mixed SIMP Differ. (%) Found. Mixed SSI Differ. (%) Mixed SIMP Differ. (%)F01 4.2 -2 3.4 -21 F24 9.5 2 9.6 3F02 5.1 -4 5.1 -5 F25 5.9 -1 6.1 2F03 10.2 7 9.9 4 F26 8.7 2 9.5 12F04 11.2 4 11.1 3 F27 4.3 5 3.6 -11F05 6.0 -4 5.8 -9 F28 5.6 1 5.7 3F06 8.3 0 8.5 2 F29 8.7 1 9.8 14F07 5.0 -3 5.4 5 F30 9.9 4 9.4 -2F08 5.3 -3 5.9 7 F31 6.7 1 7.4 11F09 10.0 6 10.5 12 F32 7.6 2 7.2 -4F10 10.5 7 11.1 12 F33 4.3 3 4.7 11F11 4.2 -2 5.7 33 F34 5.6 0 6.2 11F12 5.3 -3 5.8 5 F35 8.2 2 7.7 -5F13 9.8 6 10.4 12 F36 9.4 -1 9.7 3F14 10.9 6 10.8 5 F37 6.4 -4 6.8 2F15 6.2 -3 6.0 -5 F38 5.3 1 5.8 10F16 7.9 -1 8.5 6 F39 5.8 2 6.3 10F17 4.1 -2 3.4 -19 F40 7.8 1 7.7 0F18 5.2 -3 5.1 -6 F41 8.2 3 7.8 -1F19 9.3 1 9.2 0 F42 6.0 -2 6.3 3F20 10.6 4 10.1 -1 F43 7.0 -4 7.3 0F21 5.7 -2 5.3 -8 F44 4.2 4 4.1 4F22 8.5 3 8.5 4 F45 5.4 2 5.2 -3F23 5.0 0 4.2 -17 F46 7.5 7 6.3 -10– – – – – F47 8.2 -4 7.5 -12
Table 13Supplementary information on simplified model settlements
Information Mixed SSI
Differ. (%)
Mixed SIMP
Differ. (%)
Maximum settlement (mm) 11.2 4 11.1 3Maximum differential
settlement (mm) 7.1 5 7.7 15
Average settlement (mm) 7.1 1 7.2 2Coefficient of variation (%) 30 7 31 9
trend towards the standardization of settlements. The maximum differential settlement and the maximum absolute settlement showed a marked reduction. The mean settlement, however, was not very influenced.The soil-structure interaction provided a redistribution of the loads in the foundations and a significant reduction of the applied moments. As a general rule, there was a load transfer from foundations with higher settlements to the neighbouring foundations of lower settlements.There were important changes in the normal stresses of the walls. The greatest influence of the soil-structure interaction occurred on the first floors, where there were differences greater than 18%, ad-opted as an acceptable limit in this work.The simplified models adequately represented the stress flow on the walls and the load distribution on the foundations. The MIXED SSI model presented the best results.
7. Acknowledgments
The authors gratefully acknowledge CNPq (National Council for Sci-entific and Technological Development ) for the financial support.
8. References
[1] NUNES, V. Q. G. Análise estruturais de edifícios de paredes de concreto armado, São Paulo, 2011, DSSIertação (Mes-trado) - Escola de Engenhari de São Carlos, Universidade de São Paulo (in Portuguese).
[2] BRAGUIM, T. C. Utilização de modelos de cálculo para pro-jetos de edifícios de paredes de concreto armado moldadas no local, São Paulo, 2013, DSSIertação (Mestrado) - Escola Politécnica, Universidade de São Paulo (in Portuguese).
[3] ASSOCIAÇÃO BRASILEIRA DE NORMAS TÉCNI-CAS. Paredes de concreto moldadas no local para con-strução de edificações. - NBR 16055, Rio de Janeiro, 2012 (in Portuguese).
[4] MEYERHOF, G. G. Some recent foundation research and its application to design. Structural Engineering, v.31, n.2, 1953; p.151-167.
[5] CHAMECKI, S. Structural rigidity in calculating settlements. Journal of Soil Mechanics and Foundation Division, v.82, n.SM-1, 1956; p.1-19.
[6] GOSHY, A. D. Soil-foundation-structure interaction. Journal of Structural the Division, v.104, 1978; p.749-761.
1092 IBRACON Structures and Materials Journal • 2018 • vol. 11 • nº 5
Analysis of the effects of soil-structure interaction in reinforced concrete wall buildings on shallow foundation
[7] GUSMÃO, A. D. Aspectos relevantes da interação solo-es-trutura em edificações. Solos e Rochas, v.17, 1994; p.47-55 (in Portuguese).
[8] TESTONI, E. Análise estrutural de edifícios de paredes de concreto por meio de pórtico tridimensional sobre apoios elásticos, São Paulo, 2013, DSSIertação (Mestrado) – Es-cola de Engenharia de São Carlos, Universidade de São Paulo (in Portuguese).
[9] TESTONE, E. Análise de interação solo-estrutura em edifícios de paredes de concreto moldadas no local. Revista Funda-ções e Obras Geotécnica, v.6, 2016; p.36-46 (in Portuguese).
[10] SANTOS, M. G C. Análise estrutural dos efeitos dos deslo-camentos dos apoios de edifícios de paredes de concreto moldadas no local, São Paulo, 2016, DSSIertação (Mestra-do) – Escola de Engenharia de São Carlos, Universidade de São Paulo (in Portuguese).
[11] LIU, Y. P. et al. Second-order Analysis and design of wall-framed structures allowing for imperfections. Advances in Structural Engineering, v.13, n.3, 2010; p.513-524.
[12] YAGUI, T. Estruturas constituídas de paredes delgadas com diafragmas transversais, São Paulo, 1971, Tese (Doutora-do) – Escola de Engenharia de São Carlos, Universidade de São Paulo (in Portuguese).
[13] YAGUI, T. Análise de estruturas de edifícios construídas de núcleos de concreto armado e pilares ou pendurais de aço (carregamento crítico de instabilidade), São Paulo, 1978, Tese (livre-docência), Universidade de Campinas (in Portuguese).
[14] CORRÊA, M. R. S. Aperfeiçoamento de modelos usual-mente empregados no projeto de sistemas estruturais de edifícios, São Paulo, 1991, Tese (Doutorado) – Escola de Engenharia de São Carlos, Universidade de São Paulo (in Portuguese).
[15] NASCIMENTO NETO, J. A. Investigação das solicitações de cisalhamento em edifícios de alvenaria estrutural sub-metidos a ações horizontais, São Paulo, 1999, DSSIertação (Mestrado) – Escola de Engenharia de São Carlos, Univer-sidade de São Paulo (in Portuguese).
[16] AOKI, N. Aspectos geotécnicos da interação estrutura-maciço de solos. In: XXVIII Jornadas Sul-Americanas de Engenharia Estrutural, São Carlos, 1997, Anais, São Carlos, 1997 (in Portuguese).
[17] MINDLIN, R. D. Force at a point in the interior of a semi-infinite solid. Physics, v.7, 1936; p.195-202.
[18] STEINBRENNER, W. Tafeln zur setzungsberechnung. Die Strasse, v.1, 1934; p.121.
[19] REIS, J. H. C. Interação solo-estrutura de grupo de edifí-cios com fundações superficiais em argila mole, São Paulo, 2000, DSSIertação (Mestrado) – Escola de Engenharia de São Carlos, Universidade de São Paulo (in Portuguese).
[20] ASSOCIAÇÃO BRASILEIRA DE NORMAS TÉCNICAS. Cargas para o cálculo de edificações. - NBR 6120, Rio de Janeiro, 1980 (in Portuguese).
[21] ASSOCIAÇÃO BRASILEIRA DE NORMAS TÉCNICAS. Ações e segurança nas estruturas - procedimento. - NBR 8681, Rio de Janeiro, 2003 (in Portuguese).