analiz_espctros
TRANSCRIPT

8/21/2019 analiz_espctros
http://slidepdf.com/reader/full/analizespctros 1/536
Printed in USA March 2000
Notice
Hewlett-Packard to Agilent Technologies Transition
This document a tion support s a product tha t previously shipped under th e Hewlett -
Pa ckar d company bran d na me. The bran d na me ha s now been cha nged to Agilent
Technolog ies . The two product s a re funct iona l ly ident ica l , only our name has changed . The
document still includes references to Hew lett-Pa cka rd products, some of w hich ha ve been
tr a nsit ioned to Agilent Technologies.

8/21/2019 analiz_espctros
http://slidepdf.com/reader/full/analizespctros 2/536
8566B
SPECTRUM ANALYZER100 Hz - 2.5 GHz/2 - 22 GHz
SERIAL NUMBERS
This manual applies directly to Model 8566B RFSections with serial numbers prefixed 2410A and IF-
Display Sections with serial numbers prefixed 2403A.
HEWLETT
PACKARD
OPERATING AND PROGRAMMING MANUAL
0 Copyright HEWLETT-PACKARD COMPANY 1984
1212 VALLEY HOUSE DRIVE, ROHNERT PARK, CALIFORNIA.94928. U.S.A.
MANUAL PART NO. 08566-90040
Microfiche Part No. 08566-90044 Printed: March 1984

8/21/2019 analiz_espctros
http://slidepdf.com/reader/full/analizespctros 3/536
CERTIFICATION
Hewlett-Packard Company certifies that thb product met its published specifications at the time of shipment from the factory. Hewlett-Packard further certifies that its calibration measurements aretraceable to the United States National Bureau of Standards, to the extent allowed by the Bureau’scalibration facility, and to the calibration facilities of other International Standards Organizationmembers.
WARRANTY
This Hewlett-Packard instrument product is warranted against defects in material and workmanshipfor a period of one year from date of shipment. During the warranty period, Hewlett-PackardCompany will, at its option, either repair or replace products which prove to be defective.
For warranty service or repair, this product must be returned to a service facility designated by HP
Buyer shah prepay shipping charges to HP and HP shall pay shipping charges to return the productto Buyer. However, Buyer shall pay all shipping charges, duties, and taxes for products returned toHP from another country.
HP warrants that its software and firmware designated by HP for use with an instrument will executeits programming instructions when properly installed on that instrument. HP does not warrant thatthe operation of the instrument, or software, or firmware will be uninterrupted or error free.
LIMITATION OF WARRANTY
The foregoing warranty shall not apply to defects resulting from improper or inadequatemaintenance by Buyer, Buyer-supplied software or interfacing, unauthorized modification or misuse,
operation outside of the environmental specifications for the product, or improper site preparationor maintenance.
NO OTHER WARRANTY IS EXPRESSED OR IMPLIED. HP SPECIFICALLY DISCLAIMSTHE IMPLIED WARRANTIES OF MERCHANTABILITY AND FITNESS FOR APARTICULAR PURPOSE.
EXCL U REMEDIES
THE REMEDIES PROVIDED HEREIN ARE BUYER’S SOLE AND EXCLUSIVE REMEDIES.HP SHALL NOT BE LIABLE FOR ANY DIRECT, INDIRECT, SPECIAL, INCIDENTAL, OR CONSEQUENTIAL DAMAGES, WHETHER BASED ON CONTRACT, TORT, OR ANYOTHER LEGAL THEORY
ASSISTANCE
Product maintenance agreements and other customer assistance agreements are available for Hewlett-Packard products.
For any assistance, contact your nearest Hewlett-Packard Sales and Service Office. Addresses are provided at the back of this manual.

8/21/2019 analiz_espctros
http://slidepdf.com/reader/full/analizespctros 4/536

8/21/2019 analiz_espctros
http://slidepdf.com/reader/full/analizespctros 5/536
GENERAL INFORMATION GENERAL DESCRIPTION
GENERAL INFORMATION
The HP 8566B is a high-performance spectrum analyzer which operates from 100 Hz to 2.5 GHz in the low
frequency band and 2 - 22 GHz in the preselected microwave band. It uses a synthesized LO to provide accurate
frequency tuning and an internal micro-computer to automate controls and provide useful operating features.
HP 8566B SPECTRUM ANALYZER
The HP 8566B consists of an 85662A Display Section and an 85660B RF Section. Connect the two sections
along with the inter-connection cables as shown in the illustration below.
Connect interconnection cables as shown:
Line Module
Line Module.
I \Interconnect Cable Interconnect Cable
85662-60093) (85662-60094)
REAR PANEL CONNECTIONS
85662A
Display Section
85660B
RF Section
HP-IB
Connector
Manual Operation 1

8/21/2019 analiz_espctros
http://slidepdf.com/reader/full/analizespctros 6/536
INITIAL POWER ON GENERAL INFORMATION
CAUTION
Before connecting the line power cords, make sure the appropriate line voltage and
line fuse have been selected for both the RF and Display sections of the analyzer. For
complete information on line voltage and fuse selection, refer to the HP 8566B Opera-tor’s Handbook. For information on line power cords for a specific country, contact the
nearest Hewlett-Packard office.
INITIAL POWER ON
After making the AC power line connections, the STANDBY lights of both the RF and Display section should be
on. As long as the instrument is operating (LINE ON) or in STANDBY, the accuracy specifications of the internal
frequency standard will be met. After a cold start, such as on-receipt of instrument, the analyzer requires 24 hours
to stabilize prior to meeting specified performance.
LINE ON AND STANDBY INSTR CHECK LED
Upon LINE ON, the instrument will perform an automatic internal instrument check. If one or both of the red
instrument check lights (INST CHECK I and II) remain on after this brief check routine, refer to the chart below to
localize the problem.
LED On Problem
I Digital Storage failure in 85662A
II Interface Failure
Solution
Check bus interconnect cable (85662-60094)
Check bus interconnect cable (85662-60094)
and check if Al2 board is connected tightly
Controller (A15)Check if Al5 is connected tightly in 85660Band that contacts are clean.
Calibration
In order to meet specified frequency and amplitude accuracy, the analyzer’s calibration must be checked periodi-
cally to ensure the highest performance.
2 Manual Operation

8/21/2019 analiz_espctros
http://slidepdf.com/reader/full/analizespctros 7/536
GENERAL INFORMATION RF INPUT
RF INPUT
FREQZEROc0
Connect cable from CAL OUTPUT signal to RF input to perform initial calibration.
CAUTION
Excessive signal input power will damage the input attenuator and the input mixer. The
spectrum analyzer total RF power must not exceed + 30 dBm (1 watt).
DC Precaution: The HP 8566B cannot accept DC voltages in 0 dB ATTEN. With 10
dB or greater input attenuation, a maximum of k7V DC can be accepted without
damage. A blocking capacitor is recommended at the input when DC is present with an
RF signal.
Manual Calibration Procedure
1. After instrument has stabilized, press m
2. Press @ 8; this recalls the following stored control settings from the analyzer’s internal memory:
Center Frequency = 100 MHz
Frequency Span = 2 MHz
Reference Level = - 7 dBm
Res BW = 1 MHz
Scale = 1 dB/Div
Marker = Normal
3. Adjust AMPTD CAL for a marker amplitude of - 10 dBm. *
4. Press [1Ic1LLl 9; this recalls the following:
Center Frequency = 100 MHz
Frequency Span = 0 Hz
Reference Level = - 7 dBm
Res BW = 30 Hz
Scale = 1 dB/Div
Sweep Time = 10 Sec.
l If connection cable has significant loss, it must be accounted for separately.
Manual Operation 3

8/21/2019 analiz_espctros
http://slidepdf.com/reader/full/analizespctros 8/536
CRT DISPLAY GENERAL INFORMATION
5. Maximize amplitude response with FREQ ZERO adjustment.
Error Correction Routine
A 30 second internal error correction routine minimizes uncertainties due to control changes in the analyzer. To
start the routine, press (,,,,, W (%?I.
A “CORR’D” readout will appear on the left edge of the CRT upon completion of this routine. If the message
“Adjust AMPTD CAL” appears in the display, repeat the manual calibration before running the error correction
routine again.
CRT DISPLAY
The analyzer’s CRT display presents the signal response trace and all pertinent measurement data. The active
function area names the function under DATA control and shows the function values as they are changed. All the
information necessary to scale and reference the graticule is provided.
MARKER
Reference User display frequencylevel annotation amplitude
Active
function
readout’
bun 17.wa ass 4 CIHX
- PF’: B W LHX
/ L/YBW 1 0 0 HZ
Center Resolution Video Sweep timespan
frequency bandwidth bandwidth
,TRACE A
/TRACE B
Internally generated
graticule
PLOTTER OUTPUT
The trace data, graticule, and annotation on the analyzer’s screen can be directly output via HP-IB to a Hewlett-
Packard plotter (such as the HP 7245A/B, 7240A, 7470A, or 9872C) by pressing the LOWER LEFT key on the
front pane1 of the analyzer.
4 Manual Operation

8/21/2019 analiz_espctros
http://slidepdf.com/reader/full/analizespctros 9/536
GENERAL INFORMATION FRONT PANEL OVERVI
FRONT PANEL OVERVIEW
Control Groups
1 CRT DISPLAY:
2 TRACE:
3 REFERENCE LINE:
4 SCALE:
5 KEY FUNCTION:
6 SWEEP and TRIGGER:
7 RFINPUT:8 DATA/FUNCTION:
9 CAL OUTPUT:
10 MARKER:
11 COUPLED FUNCTION:
12 INSTRUMENT STATE:
13 LINE ON &STANDBY:
14 REORDER/PLOTTER
FUNCTIONS:
IEW
Signal response and analyzer settings
Control of signal response display
Measurement and display aids
Selects logarithmic or linear amplitude scale
Access to special functions
Selects trace update trigger
100 Hz to 22 GHz ( + 30 dBm max. power)Fundamental analyzer control
Calibration signal
Movable bright dot markers for direct frequency and amplitude readout
Maintenance of absolute amplitude and frequency calibration by automati-
cally selecting certain analyzer control settings
Local (1~1) select key, SAVE and RECALL keys and FULL SPAN keys
Powers instrument and performs instrument check
Controls output to recorder or HP-IB controlled plotter
Manual Operation 5

8/21/2019 analiz_espctros
http://slidepdf.com/reader/full/analizespctros 10/536
REAR PANEL OUTPUTS GENERAL INFORMATION
REAR PANEL OUTPUTS
Sweep and Tune Output
Frequency Reference
10 MHz Output
21.4 MHz IF Output
IF Input/Output
Video Input/Output
Recorder Outputs
External Trigger
Display Outputs
HP-IB
Connector
Display Outputs
Display outputs allow all the CRT information to be displayed on an auxiliary CRT display such as the HP 1310A
Large Screen Display.
Display Outputs output
<75 nsec rise times. 1V full deflection.
<30 nsec rise time. Intensity: - 1V blank, 0 to1V intensity modulation.
BLANK TTL level >2.4V for blanking. Compatible withmost oscilloscopes.
Recorder Outputs
The recorder outputs allow the x-y plot of trace data with x-y plotters using positive penlift coils or TTL penlift
input. The front panel keys enable outputs for the calibration of x-y plotter reference points:
6 Manual Operation

8/21/2019 analiz_espctros
http://slidepdf.com/reader/full/analizespctros 11/536
GENERAL INFORMATION REAR PANEL OUTPUTS
Recorder
outputs
RECORDER
LOWER UPPER
LEFT RIGHT
RECORDER Outputs
when keys or HP-IB
commands are enabled
Lower UpperLeft Right
SWEEP0
A voltage proportional to the horizontal sweep of OV 1ovthe CRT trace that ranges from OV for the left left rightedge and to + 1OV for the right edge.
VIDEO o v + 1v0
Detected video output (before A-D conversion) proportional to vertical deflection of the CRT lower uppertrace. Output increases 100 mV/div from 0 to1V
PENLIFT A blanking output, 15V occurs during CRT + 15v + 15vretrace; otherwise output is low at OV (pendown).
21.4 MHz IF Output
21.4 MHz IF Output output
21.4 MHz
IF OUTPUT
A 5052, 21.4 MHz output related to the RF inputto the analyzer.In log scales, the IF output is logarithmicallyrelated to the RF input signal; in linear, the out- put is linearly related.
The output is nominally - 20 dBm for a signal atthe reference level.The analyzer’s resolution bandwidth setting con-trols the bandwidth. The input attenuator and IFstep gain positions control the amplitude.
Sweep Plus Tune Output
Sweep Plus Tune Output Output
SWEEP + TUNE - l.OV per GHz of tune frequency, 110 kQ load.
OUT Accuracy: - lV/GHz + 2% -t 10mV
10 MHz Output
10 MHz Output output
10 MHzOUT > - 5 dBm. 50R output impedance
Manual Operation 7

8/21/2019 analiz_espctros
http://slidepdf.com/reader/full/analizespctros 12/536
REAR PANEL OUTPUTS GENERAL INFORMATION
Frequency Reference Input/Output
To lock the spectrum analyzer to an external frequency reference, set the FREQ REFERENCE switch to EXT.
Analyzer performance will be degraded unless frequency reference phase noise and spurious signals are < - 140
dBc single sideband (1 Hz) referred to 10 MHz at a 100 Hz to 10 kHz offset. To lock another spectrum analyzer to
the spectrum analyzer internal frequency reference, set the FREQ REFERENCE switch to INT
Frequency Reference
Input/OutputInput/Output
EXT INT
External Frequency Reference Requirements:
Frequency: 5 MHz & 50 Hzor 10 MHz ? 100 Hz
Power: 0 to 10 dBmInput Impedance: 5Of2 nominal
Internal Frequency Reference Characteristics.
Frequency: 10 MHzPower: 0 dBm
O u t p u t impedance: 5OQ
HP-IB Input Output Connector
The Hewlett-Packard Interface Bus allows remote operation of the analyzer as well as input and output of mea-
surement data. See Section II of this manual.
IF and Video Connectors
The IF and Video connectors allow the 85650A Quasi-Peak Adapter to be used with the analyzer for EM1
measurements
NOTE
When the Quasi-Peak Adapter is disconnected from the analyzer, make sure the IF INP
connector connects to the IF OUT connector with one short BNC cable, and VIDEO
INP connector connects to the VIDEO OUT connector with the other short BNC cable.
Failure to connect the BNC cables will result in a loss of signal.
8 Manual Operation

8/21/2019 analiz_espctros
http://slidepdf.com/reader/full/analizespctros 13/536
GENERAL INFORMATION REAR PANEL OUTPUTS
IF and Video Connectors Input
21.4 MHz input. Input is nominally - 11 dBm
0 IF INP (with spectrum analyzer input attenuator set to10 dB) .5OQ input impedance.
VIDEO INP 0 - 2V 139Q input impedance.
IF and Video Connectors
IF OUT
21.4 MHz output. Output is nominally - 11dBm (with spectrum analyzer input .attenuatorset to 10 dB) .5OQ output impedance.
VIDEO OUT 0 - 2V Output impedance < 10 kQ.
External Sweep Trigger Input
The External Sweep Trigger input allows the analyzer’s internal sweep source to be triggered by an external
voltage.
External Sweep Trigger
InputInput
EXT TRIGGERMust be >2.4V (1OV max) . 1 kQ nominal input
impedance.
Manual Operation 9

8/21/2019 analiz_espctros
http://slidepdf.com/reader/full/analizespctros 14/536
GETTING STARTED FRONT PANEL CONCEPT
Chapter 1
GETTING STARTED
GENERAL DESCRIPTION
This chapter is intended to provide you with a quick overview of the use and capability of the HP 8566B Spectrum
Analyzer. The chapters following provide the details on each aspect of operation.
FRONT PANEL CONCEPT
The basic controls on the HP 8566B front panel consist of FUNCTION keys and DATA control keys. Functions are
activated by pressing the appropriate key; its value is then changed via the DATA control knob, step keys or
numeric keyboard. The activated FUNCTION will appear on the CRT as well as its current value.
FUNCTION/DATA
Controls
ACTIVE FUNCTION
and DATA VALUE
The front panel controls are grouped by function. The majority of measurements can be made with only the
FUNCTION/DATA group illustrated. The major FUNCTION controls are CENTER FREQUENCY FRE-
QUENCY SPAN (or START/STOP FREQ), and REFERENCE LEVEL. The value of the activated FUNCTION
can be changed continuously with the knob, incrementally with STEP KEYS or exactly with the numeric key-
board.
Knob
StepKeys
NumericKeyboard
MAKING A MEASUREMENT
Two FULL SPAN keys allow you to select a wide
Manual Operation 1 1

8/21/2019 analiz_espctros
http://slidepdf.com/reader/full/analizespctros 15/536
MAKING A MEASUREMENT GE-l-l-ING STARTED
0- 2.5 GHz or 2 -22 GHz’ frequency span. Both
keys preset all the analyzer functions to automatically
maintain a calibrated display during the course of the
measurement.
Example
Connect the CAL OUTPUT signal to RF INPUT
Press l%J
This presets the analyzer to a full 0- 2.5 GHz span
with 0 dBm Reference level and automatically couples
al1 secondary receiver functions.
e c 0. 0 d n . Tl l h 10 de
: 3 I
- - _ .
- . - - - - - .
t i - -
and use the knob
or the numeric keyboard to t
quency to 100 MHz. Note that the activated FUNC-
TION (CENTER FREQUENCY) appears on the CRT
graticule field.
Press (91 and use the knob
bl
, step keys @
or numeric keyboard to reduce the frequency
6 to 100 kHz.
REQUEN Y
‘The I’;:] key is also activated with LINE ON.
12 Manual Operation

8/21/2019 analiz_espctros
http://slidepdf.com/reader/full/analizespctros 16/536
GETTING STARTED DIRECT FREQUENCY AND AMPLITUDE READOUT
and use the knob 0, step keys c) or numeric keyboard to position the peak of the
signal on the top graticule line.
.-. -. .-LEVEL
I1 I1 pbN 1.. .“ISW’ ae l =zxrEu a...e.. m*Pf5 ml .“I wn 3 L”,
The frequency and amplitude of the signal are read out from the graticule border. All secondary analyzer functions
(resolution bandwidth, video bandwidth, sweep time, and attenuation) were automatically adjusted to maintain a
fully calibrated display. The coupled functions can also be uncoupled to allow manual operation.
For instance, to manually control the resolution bandwidth, press (::‘1 and change bandwidth with any combina-
tion of DATA control. The above also applies to I’:“:“) , @ , [,,,.) , or [‘::::‘1
DIRECT FREQUENCY AND AMPLITUDE READOUT
Markers can be used to quickly identify signal frequency and
measure signal separation or amplitude differences.
Activate a marker 02 the display with NORMAL.
Tune marker with 0 . The frequency and ampli-
tude of the signal are read out with the marker.
To measure the harmonic(s) of the signal, press A and
tune the second marker to the signal’s harmonic. The
frequency separation and amplitude difference areread out.
amplitudes -delta (A) markers are available to

8/21/2019 analiz_espctros
http://slidepdf.com/reader/full/analizespctros 17/536
SAVE/RECALL GETTING STARTED
SAVE/RECALL
The HP 8566B instrument control settings can be saved in an internal memory and later recalled to make a
measurement. [/ [I(c1111 m to0 provide access to the six internal storage registers.
SHIFT KEYS
In addition to the front panel functions listed on the keys, another set of functions can be assigned to the same keys
by pressing the blueB key prior to activating a front panel key. These will be covered in more detail in Chapter
11.
AUTOMATIC MEASUREMENTS
The HP 8566B is fully programmable via the Hewlett-Packard Interface Bus (HP-IB) -HP’s implementation of
IEEE STD 488-1975. Internationally, HP-IB is in concert with the IEC main interface document.
A computing controller/calculator can be used with the HP 8566B to configure an automatic measurement
system. Just as the analyzer’s front panel is keyed manually to control functions and change values, simple
program codes are transmitted via the HP-IB with a controller to make measurements automatically These pro-
gram codes are listed in the Remote Operation section of the instrument pull-cards.
Detailed information on remote operation is found in Section II of this manual.
14 Manual Operation

8/21/2019 analiz_espctros
http://slidepdf.com/reader/full/analizespctros 18/536
DATA
CHAPTER 2
DATA
DATA CONTROLS
GENERAL DESCRIPTIONDATA controls are used to change function values for functions such as center frequency, start frequency, resolu-
tion bandwidth, or marker position.
DATA CONTROLS
The DATA controls are clustered about the FUNCTION keys which “call up” or activate the most frequently used
spectrum analyzer control functions: center frequency, frequency span (or start/stop frequency), and referencelevel. The other functions that accept DATA control are shown below:
FRONT PANEL FUNCTIONS USING DATA CONTROLS
To the left of the FUNCTION Keys are the Data knob 0 and the DATA STEP keys @ @ , which are used
to make incremental changes to the activated function. To the right of the FUNCTION keys is the DATA number/
units keyboard which allows changes to an exact value.
Manual Operation 15

8/21/2019 analiz_espctros
http://slidepdf.com/reader/full/analizespctros 19/536
DATA ENTRY READOUT DATA
The DATA controls will change the activated function in a manner prescribed by that function. For example, center
frequency can be changed continuously with the DATA knob 0 , or in steps proportional to the frequency span
with the DATA STEP keys @ a , or set exactly with the DATA number/units keyboard. Resolution band-
width, which can be set only to discrete values, can still be changed with any of the DATA controls. The DATA
knob 0 and DATA STEP keys 13 61 increment the setting from one bandwidth to the next. An entry
from the number/units keyboard which may not coincide with an allowable bandwidth will select the nearest
bandwidth.
DATA ENTRY READOUT
DATA entries are read from the CRT display as they are changed.
PREVENTING DATA ENTRY
A function can be deactivated by pressing m . The active function readout is blanked and the ENABLED light
goes out, indicating no DATA entry can be made. Pressing a function key re-enables the DATA controls.
DATA KNOB
The DATA knob 0 11a ows the continuous change of center frequency, frequency span (or start/stop frequen-
cies), reference level, marker positions, display line, and threshold. It can also change the function values which
are only incremented.
Clockwise rotation of the DATA knob will increase the function value. For continuous changes, the knob’s sensitiv-
ity is determined by the measurement range and the speed at which the knob is turned. For example, when the
center frequency is activated, 0 increases the value of the center frequency one horizontal division of span per
one quarter turn.
DATA STEP KEYS
The DATA STEP keys allow rapid increase @ or decrease r) of the active function value. The step size is
dependent either upon the analyzer’s measurements range, on a preset amount, or, for those parameters with
fixed values, the next value in a sequence. Examples: Activate center frequency and 0 will increase the center
frequency value by an amount equal to one division of the frequency span (one tenth of the frequency span). If
the center frequency step size m has hen preset, El will increase the center frequency by that preset
amount. If frequency span were activated, 10) would change the span to the next lower value in predetermined
sequence. Activate resolution bandwidth and [& ~ will select the next widest bandwidth. Each press results in a--I
single step,
16 Manual Operation

8/21/2019 analiz_espctros
http://slidepdf.com/reader/full/analizespctros 20/536
DATA DATA NUMBER/UNITS KEYBOARD
DATA NUMBER/UNITS KEYBOARD
The DATA number/units keyboard (or DATA keyboard) allows exact value entries to center frequency, frequency
span (or start/stop frequency), reference level, log scale, marker positions, display line, threshold, and the COUP-
LED FUNCTIONS.
An activated parameter is changed by entering the number (with the CRT display providing a readout) then
selecting the appropriate units key. The value is not changed (entered) until the units key is pressed.
The number portion of the entry may include a decimal, l0 . If not, the decimal is understood at the end of the
number. Corrections to number entries are made with :::,:0
, which erases the last digit for each press.
Example: With center frequency activated,
(TJ-Jp-JJQ[Z][Z]~@
will set the center frequency to 1.250 GHz.
If the units key were pressed without a number entry, 1 is entered (except in zero frequency span).
Negative DATA Entry
Negative entries from the number units keyboard can be made for power and frequency but not time and voltage.
““I
Negative power entries can be made using -Z . The “ - dBm” key will enter - dBm, - dBmV or - dBpV For example, in reference level, with the dBmV units, an entry of will enter - 50 dBmV
Negative frequency entries can be made using m-m
as a prefix to the frequency entry For example, to enter a negative start frequency, press
p-J(TJ(TJ@~0; (g-m
This enters the frequency value as - 100 MHz.
Not all functions will accept negative entries (the sign will be ignored).
MULTIPLE DATA CHANGES
A function, once activated, may be changed as often as necessary without reactivating that function (see Chapter
3, FUNCTION). Any of the DATA controls can be used in any order. l
It is not always necessary to make a DATA entry. For example, start and stop frequency may be activated simply toallow readout of the left and right display reference frequencies as start/stop frequencies.
l Exceptions are the SHIFT KEY FUNCTIONS which use only DATA number/units keyboard. See Chapter 11.
Manual Operation 17

8/21/2019 analiz_espctros
http://slidepdf.com/reader/full/analizespctros 21/536
FUNCTION GENERAL DESCRIPTION
CHAPTER 3
FUNCTION
GENERAL DESCRIPTION
This chapter describes the use of the major function block- CENTER FREQUENCY FREQUENCY SPAN (or
START/STOP FREQUENCY), and REFERENCE LEVEL.
NCTI ON
A FUNCTION is enabled by pressing the desired FUNCTION key Once enabled, the function, along with its
current data value, is displayed in the active graticule area of the CRT as well as outside the graticule border. To
change the value of the active function, use either the DATA knob, step keys, numeric keyboard, or a combinationof all three. The HOLD key above the DATA knob can be used to retain the present instrument state and prevent
any inadvertent entry of DATA. HOLD clears the active function area of the CRT as well as de-activates any
function.
Active
Function
Frequency
Span
Manual Operation 19

8/21/2019 analiz_espctros
http://slidepdf.com/reader/full/analizespctros 22/536
CENTER FREQUENCY FUNCTION
CENTER FREQUENCY
The center frequency can be tuned continuously from 0 to 22 GHz using any combination of DATA controls.
Additional band overlap enables the center frequency to tune up to 24 GHz and below to - 1 GHz.
The center frequency can be set with 1 Hz resolution. Readout resolution is 1% of the frequency span, hence the
highest readout resolution is obtained with narrow frequency spans. Data entered, however, is always accurate to1 Hz even though the center frequency readout may display less resolution.
During band crossings (from 0 - 2.5 GH z low band to 2 - 22 GH z microwave band) or at band edges (below 0 Hz
or above 22 GHz), the frequency span may change to enable the desired center frequency to be set. (See
Appendix for detailed information.)
DATA Entry with CENTER FREQUENCY
Changes the center frequency by about one half the total frequency span
each full turn.
[-iEz] @@
Changes the center frequency by one tenth of the frequency span, i.e., byone division. COUPLED FUNCTION [‘::::‘I can be used to change this stepsize.
(EC)
. . . . I
Allows direct center frequency entry. The analyzer will accept a center fre-quency entry with 1 Hz resolution. Even though the readout may show afewer number of digits (due to wide frequency span), as the span is nar-rowed the full entry will be read out. Abbreviated readouts are not rounded.
Example
Once a signal response is placed at the center of the display, the frequency of the signal can be read out from
CENTER FREQUENCY The input signal is a 9 GHz synthesized source.
Press 1’6::) for a full span display. Tune signal to center of display with (-ZZ)~.
b
I.
. . L .-I.*
20 Manual Operation

8/21/2019 analiz_espctros
http://slidepdf.com/reader/full/analizespctros 23/536
FUNCTION FREQUENCY SPAN
Reducing the frequency span will increase the center
frequency readout resolution.
Press [Fj @ @
then (x]
FREQUENCY SPAN
The frequency span changes the total display frequency range symmetrically about the center frequency. Note that
the frequency span readout refers to the total display frequency range; to determine frequency span per division,
divide by 10.
As the frequency span is changed, resolution bandwidth and video bandwidth automatically change to provide a
predetermined level of resolution and noise averaging, respectively. Sweep time also changes automatically to
maintain a calibrated display.
The analyzer can be adjusted to span a maximum of 2.5 GHz in the low band and 22 GHz (2 to 24 GH z range) in
the microwave band. A minimum span of 100 Hz is allowed in both bands as well as 0 Hz (zero span) which
enables the analyzer to function as a fixed-tune receiver. In zero span, the analyzer can display modulation
waveforms in the time domain.
DATA Entry with FREQUENCY SPAN
Changes the frequency span continuously.
Changes the frequency span to the next value in a 1, 2,5, 10 sequence.I
Enters an exact value up to three digits, depending on span. Additionaldigits will be deleted without rounding.
Manual Operation 21

8/21/2019 analiz_espctros
http://slidepdf.com/reader/full/analizespctros 24/536
FREQUENCY SPAN FUNCTION
Example
Use FREQUENCY SPAN to zoom in on signals.
Connect CAL OUTPUTThis selects a convenient
2.5 GHz.
to RF INPUT press [06::1full span display from 0 to
Tune center frequency to 100 MHz with: [?%%-I
100 MHz.
Reduce span with: [F]@@or~
The desired span can also be selected with the
numeric keyboard. Note that narrow frequency spans provide increased center frequency resolution.
In the microwave band, pressing m
enables a 20 GH z full span.
22 Manual Operation

8/21/2019 analiz_espctros
http://slidepdf.com/reader/full/analizespctros 25/536
FUNCTION FREQUENCY SPAN
Example
Operating the spectrum analyzer in zero span. The modulation waveform of an AM signal can be displayed in the
time domain.
In the frequency domain, we can accurately deter-mine the modulation frequency and level.
I I I I I I I I.1 I” I
To demodulate the AM, increase the resolution band-
width to include both sidebands with the IF passband.
L-E-@@
Position the signal at the reference level and select a
linear voltage display
(G&ii)gFJ
fi SCALE.
Manual Operation 23

8/21/2019 analiz_espctros
http://slidepdf.com/reader/full/analizespctros 26/536
START/STOP FREQUENCY FUNCTION
To select zero span, press [F) m a
Video trigger can be used to trigger on the waveform.The sweep time control can be adjusted to change the
horizontal scale.
I h i i i
START/STOP FREQUENCY
Another way to adjust the frequency range is by using START/STOP FREQUENCY instead of CENTER FRE-
QUENCY and FREQUENCY SPAN. Activating START FREQ or STOP FREQ causes both to read out in place of
CENTER FREQUENCY and SPAN on the CRT START FREQ sets the left graticule frequency and STOP FREQ
sets the right graticule frequency; both are mutually exclusive with CENTER FREQUENCY and FREQUENCY
SPAN.
The INSTRUMENT STATE keys, w and m , select a start/stop frequency from 0 to 2.5 GHz and 2 to 22
GHz, respectively. Additional over-range allows start frequency setting of - 1 GHz and stop frequency of 24 GHz.
The maximum start/stop frequency span allowable is 22 GHz; the minimum span is 100 Hz and zero span
(START FREQ = STOP FREQ) .
Start/Stop frequency readout resolution is 1% of the span (span = stop frequency - start frequency). Both startor stop frequencies can be entered with 1 Hz resolution.
DATA Entry with START/STOP Frequency
Changes the start or stop frequency. The amount of change per turn is aconstant percentage of the frequency span.
or Changes the frequency by one tenth of the total frequency span.
Exact start or stop frequencies can be entered. The number of digits read outdepends upon the frequency span.
24 Manual Operation

8/21/2019 analiz_espctros
http://slidepdf.com/reader/full/analizespctros 27/536
FUNCTION REFERENCE LEVEL
Example
Set start/stop frequency to monitor FM broadcast band
Press ?iiEiJ . Note that horizontal scaling is
unchanged, although the START/STOP frequency
readouts are replaced by center frequency and span
(108 - 88 = 20 MHz).
t i i i i ii i i i IfYT
. . . .
YI. mu= I” WI,F5 mu a. “a vs 3. ”. 2... “
I i i i t
REFERENCE LEVEL
The REFERENCE LEVEL function changes the absolute amplitude level of the top graticule line. The vertical
scale (amplitude units per division) is selected from the SCALE control group. To measure signal level, the peak of
the signal’s response is positioned on the top graticule line and its amplitude is read out from REF LEVEL.
The reference level can be adjusted from - 89.9 dBm to + 30 dBm ( - 139.9 dBm to + 60 dBm with extended
range) with 0.1 dB resolution. The input attenuator is automatically coupled with the reference level to prevent
gain compression; signals which are above the gain compression point will be displayed above the reference level
line. Different mixer input levels as well as amplitude units can be selected (see (L*lrl FUNCTIONS Chapter 11).
Manual Operation 25

8/21/2019 analiz_espctros
http://slidepdf.com/reader/full/analizespctros 28/536
REFERENCE LEVEL FUNCTION
DATA Entry with REFERENCE LEVEL
In logarithmic scale, the changes are in 0.1 dB steps: in linear scale, thechanges are made to the least significant digit.
pi?-)J@ In logarithmic scale, changes the reference level in steps according to dB/
division scale. In linear scale, changes the reference level in 1 dB steps.
Allows entry of exact reference levels. Digits entered beyond the displayednumber of digits are deleted.
Example
Measure amplitude of calibration signal.
Press @
(-E] 100 MHz
To measure signal amplitude, press [ “%?)nd
position signal peak to top graticule line. Read ampli-
tude from REF LEVEL.
; i i
i \
26 Manual Operation

8/21/2019 analiz_espctros
http://slidepdf.com/reader/full/analizespctros 29/536

8/21/2019 analiz_espctros
http://slidepdf.com/reader/full/analizespctros 30/536
CRT DISPLAY
CHAPTER 4
CRT DISPLAY
ADJUSTMENT OF THE DISPLAY
GENERAL DESCRIPTION
This chapter describes the CRT display adjustments, readouts, and graphics.
ADJUSTMENT OF THE DISPLKY
The adjustments for intensity, focus, and alignment simultaneously affect all the lines and characters on the display.
CRT Display and AdjustmentslNTENSlTY
Controls intensity for all the CRT writing.
FOCUS A screwdriver adjustment which focuses all the CRT writing. Focusing any one element on the CRT
0 focuses all the writing.
nLlGN
0 A screwdriver adjustment which tilts all the displayed CRT information.
DISPLAY SECTION LINE POWER
STANDBY The light indicates power condition of the Spectrum Analyzer Display section as dictated by the LINE0 power switch on the 85660B RF section.
CRT DISPLAY OVERVIEW
The cathode ray tube of the Spectrum Analyzer Display section displays:
0 active function name and value
0 graticule
l traces of the signal response
0 values that calibrate the frequency, time, and amplitude axes
l values for the spectrum analyzer receiver parameters -that is, COUPLED FUNCTIONS.
0 operator originated labels and graphics
Manual Operation 29

8/21/2019 analiz_espctros
http://slidepdf.com/reader/full/analizespctros 31/536

8/21/2019 analiz_espctros
http://slidepdf.com/reader/full/analizespctros 32/536
CRT DISPLAY CRT DISPLAY OVERVIEW
Gralicule
The display graticule is an internally generated 10 division by 10 division rectangle for referencing frequency, time,
and amplitude measurements. Double markings at the left, right, and bottom designate the center axes.
The graticuleThe graticuleaspect ratioaspect ratioylx = 1:1.3lx = 1:1.3
Center line -bCenter line -b
4Center lineCenter line
The graticule may be blanked from the display with KEY FUNCTION [unl m and restored with n.
For CRT photography, the graticule may be intensified independent of the annotation and trace by pressing the
following sequence:
For more intensity, repeat the last two number entries, 1163 Hz and 2115 Hz. I’;:1 returns the graticule.to
normal.
Traces
Three separate traces, A, B, and C, can be written onto the display. Each trace consists of 1000 separate straight-
line elements drawn between 1001 fixed points across the CRT X and Y axis coordinates designate the particular
points between which the elements are drawn. Terms used to describe trace composition are defined as follows:
Point A “point” in the context of this manual is a fixed location on the CRT display. There are
1,001 points along the X (horizontal) axis of the CRT graticule, numbered from 0 on the far left
graticule line to 1000 on the far right graticule line. Similarly, there are 1,001 points along the Y
(vertical) axis of the CRT graticule, numbered from 0 on the bottom graticule line to 1000 on the top
graticule line. An additional 22 points of overrange available above the top graticule line provide the
Y axis with a total of 1,023 points.
Manual Operation 3 1

8/21/2019 analiz_espctros
http://slidepdf.com/reader/full/analizespctros 33/536
CRT DISPLAY OVERVIEW CRT DISPLAY
Display Unit One display unit is the distance between two points (see above) along an X or Y
axis. The distance along the X axis between the far left graticule line and the far right graticule line is
1000 display units. The Y axis length between the bottom graticule line and the top graticule line is
also 1000 display units. Although the Y axis can be extended another 22 display units above the top
graticule line, the extended area is not calibrated.
X, Y coordinates to a particular point on the display are given in display units relative to X, Y
coordinates 0,O at the junction of the far left and bottom graticule lines.
Element An element is a distinct portion of the trace drawn on the CRT It comprises a point and
the visible straight line drawn to it from the preceding point. An element drawn parallel with a vertical
or horizontal graticule line is one diplay unit long. An element drawn at an angle to the graticule lines
is longer, its actual length depending on the angle.
Vector A vector is identical with an element, except that it can be either visible or blanked.
Point of x, y coordinates
Point of
t
x, y coordinates
su 1000.1000Overrange = 22 point
A cr
I.rxma. R_
Point of f
x, y coordinates
0.0
Graticule center
x, y coordinates
500,500
TRACE DISPLAY TERMS
Point of
x, y coordinates
1000,0
NOTE
When the analyzer is operated manually (i.e., with its front-panel controls), the displaysize remains constant and the above definitions are fully applicable. When it is operated
remotely with a controller, however, three additional larger display sizes are available
through the display-size programming commands. For these larger-than-normal dis-
play sizes the lower left reference coordinates and the upper right trace limit expand
beyond the CRT’s outer graticule lines. For further information on remotely-controlled
(i.e., programmed) display sizes, refer to commands Dl, D2, and D3 under Program-
ming Commands in Section II of this manual.
32 Manual Operation

8/21/2019 analiz_espctros
http://slidepdf.com/reader/full/analizespctros 34/536
CRT DISPLAY CRT DISPLAY OVERVIEW
Locations of Permanent Readouts
The vertical and horizontal graticule axes are scaled by these readouts:
(iF -5.4 k
1s 4”
;4Verticalscale
Center frequency Frequency span(or start freq.)
\(or stop freq.)/
CeNrm 4aa.e - PIN I . . . beI*no3 I 1,. h”l vml 30 LHX PQ 3e I)..=
The COUPLED FUNCTIONS that describe the swept receiver characteristics of the spectrum analyzer are:
TT N ,a
I
I,,
RF attenuation
RerolLtionbandwidth
V e0bandwidth
Full\scale
svnep time
To blank all the character readouts, press KEY FUNCTION o. To restore, pressm p.
Manual Operation 33

8/21/2019 analiz_espctros
http://slidepdf.com/reader/full/analizespctros 35/536
CRT DISPLAY OVERVIEW CRT DISPLAY
Other Readouts
Title (see KEY FUNCTION)Marker amplitude and
frequency s_ee MARKER)
\
Detection AEc....b<...,23.REF .?3.8 dam
Mode \
,‘,’ de I
Ampli tudeof fset SAMYE
(see s”l” KEY \ =’
FUNCTION) de
Display line .-2L; ~*a-
Amplitude and/or frequency scalesuncalibrated
Threshold
level
Frequency offset(see 5~:; KEY FUNCTION)-
A number of other special function readouts can be activated. These are covered in Chapter 11.
34 Manual Operation

8/21/2019 analiz_espctros
http://slidepdf.com/reader/full/analizespctros 36/536
TRACE
CHAPTER 5
TRACE
TRACE IDENTIFICATION
GENERAL DESCRIPTION
This chapter describes the use of the TRACE functions for writing, storing, and manipulating trace data.
Trace A
G- -
‘P TRACE
TRACE Controls
TRACE IDENTIFICATION
‘Trace B
Trace C
Traces are differentiated by intensity. Trace A is bright, trace B and trace C are dim.i and m allow positive
identification.
Manual Operation 35

8/21/2019 analiz_espctros
http://slidepdf.com/reader/full/analizespctros 37/536
TRACE MODES TRACE
TRACE MODES
Four mutually exclusive functions or modes for trace A and trace B determine the manner in which the traces are
displayed. Indicator lights by the keys show the current modes.
WRITE Modes (sweeping):
m Displays the input signal response in trace selected.
m Displays and holds the maximum responses of the input signal in trace selected.
STORE Modes (not sweeping):
[.,,. Stores the current trace and displays it on the CRT display.
[,,,., Stores the current trace and blanks it from the CRT display.
Trace Memory
An understanding of the TRACE modes requires a description of the trace memory and trace data transfer within
the analyzer.
Display traces are not written onto the CRT directly from the spectrum analyzer’s IF section. Instead, the analog
signal response is converted to digital information and stored in one trace memory which can then be transferred
to the CRT display. The way in which the information is displayed depends upon the TRACE mode selected.
RF
Input
Memories ’
Analyzer
Video Response
b/
RF/IFAnalog
Sectionsto
Digital
Data Updated at
SweeptimeRate
Data Displayed at I
I Refresh I
I Rate I
TRACE MODES DETERMINE HOW DATA IS ENTERED INTO
AND DISPLAYED FROM TRACE MEMORIES
The analyzer’s response is transferred into the trace memory at the sweep rate of the analyzer; that is, its sweep
time. The trace memory is written onto the CRT display at a refresh rate of about 50 Hz, rapid enough to prevent
flickering of the trace on the CRT Trace intensities remain constant as analyzer sweep times are changed.
36 Manual Operation

8/21/2019 analiz_espctros
http://slidepdf.com/reader/full/analizespctros 38/536
TRACE TRACE MODES
NOTE
It is important to understand the difference between sweep and refresh.
Sweep refers to the spectrum analyzer sweeping from a start frequency to a
stop frequency and storing measured amplitude data into a tracememory.
Refresh refers to the transfer of display memory data to the CRT display.
WRITE Modes
For the write modes, the analyzer signal response is written into trace memory during the sweep and the memory
contents are displayed on the CRT
m A ( B )
a A(B)
Sets all the values in the trace memory A(B) to zero when first activated (bottom line graticule) , then
displays the signal response.
Latest signal response is written into the trace A(B) memory only at the horizontal positions where
the response is greater than the stored response.
When both m A and m B modes are selected, the analyzer writes into (sweeps) A and B
alternately.
STORE Modes
In the STORE modes, no updating of the trace memory is made. The current memory data is saved.
(,,,, A(B) The trace A(B) data are displayed on the CRT (that is, the refresh is enabled).(,,1.. A(B) The trace A(B) data are not displayed on the CRT (that is, the refresh is disabled).
Example
With TRACE modes, signals can be observed as the analyzer sweeps, can be stored for comparison, erased, or
monitored for frequency drift.
Center and zoom in on a 20 MHz signal:
Press(Eiq p-J (-i-J @
[F- @ (g pJ
Since [‘s::l has set m A and (,,,.,1 B, only A is
displayed.
Manual Operation 37

8/21/2019 analiz_espctros
http://slidepdf.com/reader/full/analizespctros 39/536
TRACE TRACE MODES
This response can be stored:
Press (,,,. A.
Write the same signal with B and change its position
relative to trace A:
Press m B.
[iii%-> a
Blank trace A;
Press @ A.
This trace can be recalled with m A as long as
m A or [21 A is not used first.
*
1 l
LA \
II\ : \
t i i i : iii i ‘I i i I
NOTE
The l on the top right corner of the CRT indicates that the CRT readouts may not correspond to the trace(s). In this case, the readouts
apply only to TRACE B and not TRACE A.
38 Manual Operation

8/21/2019 analiz_espctros
http://slidepdf.com/reader/full/analizespctros 40/536
TRACE TRACE EXCHANGE
To display the drift of a signal, pressa &
(Simulate frequency drift with (ZEC).1
Trace B sweeping Trace A
hpliF .e ATlD4 10 Y /
1e .”
!
TRACE EXCHANGE
m exchanges trace A and B, changing their relative intensities and storage memory locations and enables A
and B [,.. . For example, in the trace display above, the modes and display appear.
Press @
41. .
Trace B
Clear WriteTrace A
Max Hold
Manual Operation 39

8/21/2019 analiz_espctros
http://slidepdf.com/reader/full/analizespctros 41/536
TRACE C MODES TRACE
TRACE C MODES
A third trace, C, can be used to store a signal response. Trace C is not swept from the analyzer IF section as are
traces A and B, but is input using a trace B into C function (B + C) or a B and C exchange function (B z C).
Access to the trace C modes is through KEY FUNCTION @ The modes are:
View C:
Blank C:
B-C:
B*C:
mj Displays trace C.
(,,., k Blanks trace C from CRT display.
(,,,,, 1 Writes trace B into trace C. Trace A and B modes are not changed. If trace C is not
displayed, it remains undisplayed.
m i Exchanges traces B and C. If trace B is displayed before the exchange, trace C is
now displayed. If trace B is not displayed before the exchange, trace C is not displayed.
TRACE ARITHMETIC
TRACE arithmetic allows one trace to be modified by another trace or a display line position.
A-B B Trace B amplitude (measured in divisions from the bottom graticule) is subtracted from
trace A and the result written into trace A from sweep to sweep. Trace B is placed or
kept in a STORE mode.
A-B Turns [.-,-,I off.
m Subtracts the amplitude of the display line from trace B and writes the result into trace
B. Trace B is placed or kept in B Details on display line are in Chapter 7, REFER-
ENCE LINE.
Example
Trace arithmetic with the display line can be used to correct for the frequency response characteristics (flatness) of a
swept measurement system typified by this setup:
where the device under test is to be characterized for insertion loss over a specific frequency range.
The analyzer and source are set to the proper ampli-
tude level and frequency span with the source output
connected directly to the analyzer input.
m B, sweep source then
(,,. B.
t: i i i I
l
40 Manual Operation

8/21/2019 analiz_espctros
http://slidepdf.com/reader/full/analizespctros 42/536
TRACE TRACE ARITHMETIC
The display line is activated and set below the source/
analyzer response.
DL[tlgll a.
The difference between the display line (in display
units) and the source/analyzer response is stored in
trace B with I’;:’
Negative values of the [‘;:II line are stored even
though not displayed.
Now the device under test is connected between
source and analyzer and its response is corrected for
source flatness uncertainty by usingBA@.
”“““sr- ..Y - 7 Y
rn wo w 2e. . -me.
Manual Operation 41

8/21/2019 analiz_espctros
http://slidepdf.com/reader/full/analizespctros 43/536
TRACE PRIORITY TRACE
TRACE PRIORITY
Functions which act upon a trace always act upon the highest priority trace. Priority is defined by the trace modes
as follows:
Highest priority
a
Lowest priority
EB
view C[,,..,]A
[.,,.,)B
blank C
Marker functions, for example, use trace priority to decide which trace to mark. See Chapter 6.
42 Manual Operation

8/21/2019 analiz_espctros
http://slidepdf.com/reader/full/analizespctros 44/536
MARKER
Chapter 6
MARKER
GENERAL DESCRIPTION
GENERAL DESCRIPTION
This chapter describes the use of the MARKER and DATA controls for making many measurements faster and
with greater accuracy. Markers can be displayed only on TRACE A and TRACE B.
Two types of functions make up the MARKER group; MARKER MODES, which enable or disable markers and
their related functions; and MARKER ENTRY functions, which allow the scaling of the display frequency and
amplitude using marker information.
Markers are bright spots which lie directly on the display trace. The horizontal position of an activated marker is
controlled by the DATA controls. The marker can be positioned at a specific frequency with the DATA number/
units keyboard.
Readout of marker amplitude and frequency appears in the upper right of the display outside the graticule. When
a MARKER MODE is active, its amplitude and frequency readout also appears in the active function area of the
MARKER CONTROLS
Manual Operation 43

8/21/2019 analiz_espctros
http://slidepdf.com/reader/full/analizespctros 45/536
MARKER OVERVIEW
MARKER OVERVIEW
MARKER
l Direct readout of the amplitude and frequency of a point along the trace.
l Direct readout of amplitude and frequency differences between points on the trace.
l Expansion of a span about a specific frequency.
l Placing a single marker at the highest response.
l Automatic peaking of preselector.
l Direct noise level readout.
l Analysis of stored traces.
l Amplitude and frequency display scaling.
FUNCTION
EEI
EOOM
@
El(,,,lM
MARKER with [,,,.
ENTRY I”c”l-1
p &jm
MARKER ON BUT NOT ACTIVE
An activated marker mode can be deactivated by activating another function, such as display line, or by DATAI*OLD) . This does not erase the marker itself nor the upper right display readout. If the marker mode is reactivated,
DATA control and active function readout will continue from its last position.
If a marker mode is deactivated by a function (other than MARKER ENTRY) where a value change of the new
function results in a resealing of the amplitude or frequency axes, the marker will not stay on the trace. Reactivating
the marker will start it at the display center.
MARKER OFF
disables any marker mode, and blanks the marker readout from the CRT display. DATA controls aredisabled if the marker was active.
MARKER IN VIEW
MARKER m and a may be used on traces A or B in the view mode. This allows detailed analysis of
responses which are nonperiodic or unstable.
The markers will be placed on a viewed trace according to the priority defined in Chapter 5, TRACE PRIORITY
SINGLE MARKER - NORMAL
@ activates a single marker at the center of the display on the trace of highest priority. Trace priority is defined in
Chapter 5. The marker will not activate on the TRACE modes m A, [--I B, view C or blank C.
Measurement and Readout Range
Marker frequency has one digit more resolution than center frequency, and marker amplitude has one digit more
resolution than reference level.
44 Manual Operation

8/21/2019 analiz_espctros
http://slidepdf.com/reader/full/analizespctros 46/536
MARKER
DATA Entry
SINGLE MARKER-NORMAL
Moves the marker continuously along the trace at about 5 horizontal divi-sions each full turn. The marker moves in display unit increments.
Moves the marker along the trace one tenth of the total width per step. 0
moves marker to the right.
Places the marker at the frequency entered. An out-of-range entry results in placement of the marker at a graticule edge.
Example
Reading frequencies and amplitudes of signals is greatly simplified using MARKER (--I .
For a given display, activate the single marker with
B then tune the marker with 0 to position it at
the signal peak.
The frequency and amplitude is read out in two dis-
play areas.
To read the left-hand signal’s parameters, move the
marker to the signal peak with 0 .
The signal’s amplitude and frequency is read out
directly.
Manual Operation 45
8/21/2019 analiz_espctros
http://slidepdf.com/reader/full/analizespctros 47/536
DIFFERENTIAL MARKERS-A MARKER
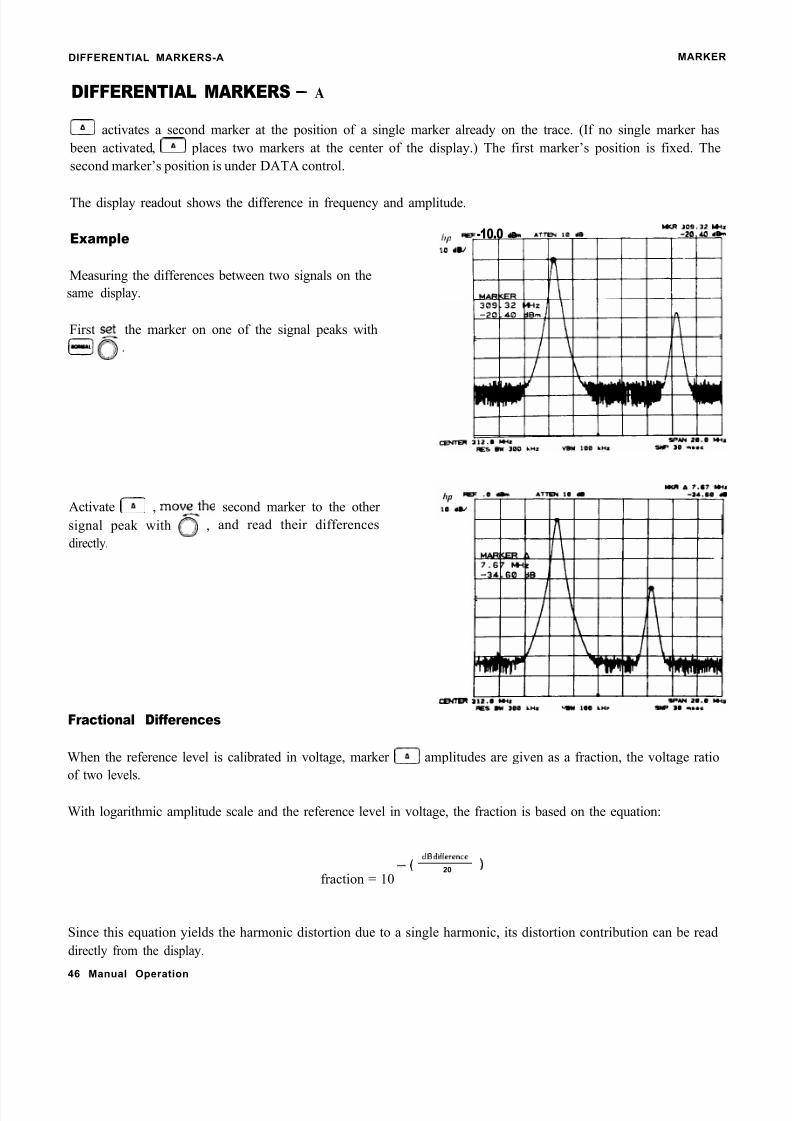
DIFFERENTIAL MARKERS - A
a activates a second marker at the position of a single marker already on the trace. (If no single marker has
been activated, m places two markers at the center of the display.) The first marker’s position is fixed. The
second marker’s position is under DATA control.
The display readout shows the difference in frequency and amplitude.
y R 309.32 wz
Example ‘f/J -10.0 -2o.* .h10 d”
Measuring the differences between two signals on the
same display.
First ss the marker on one of the signal peaks with
(-IIo.
Activate m , movAthe second marker to the other
signal peak with 0 , and read their differences
directly.
Fractional Differences
When the reference level is calibrated in voltage, marker m amplitudes are given as a fraction, the voltage ratio
of two levels.
With logarithmic amplitude scale and the reference level in voltage, the fraction is based on the equation:
dB ddlerence
- 20 )
fraction = 10
Since this equation yields the harmonic distortion due to a single harmonic, its distortion contribution can be read
directly from the display.
46 Manual Operation

8/21/2019 analiz_espctros
http://slidepdf.com/reader/full/analizespctros 48/536
MARKER
Example
DIFFERENTIAL MARKERS-A
Set up m on the peaks of a fundamental (left) and
its harmonic (right).
With the display referenced and scaled as shown, the
readout “.0100X” designates the fractional harmonic
content. Percent is calculated as 100 x (.OlOO) = 1 .O%.
With a linear amplitude scale and a reference level
calibrated in voltage, the fractional amplitude readout
is the simple linear ratio of the two markers.
Example
To measure % AM modulation from a spectra1 display, calibrate the display with the reference level in voltage and
the amplitude scale in voltage.
Place the single marker on the carrier peak, [--J
0 , and the second marker on one of the side-
band peaks, m 0 The fractional amplitude
readout gives one half the modulation index .283.
%AM = 100x2x .28 = 56%.
L INSRI
t
. .. .
Measurement and Readout Range
The m function formats the amplitude readout according to reference level units and scale.
Reference SCALE
Level Units Logarithmic
SCALE
Linear
dBmdBmVdBpV
Amplitude in dB Amplitude in dB
Voltage
Amplitude ratiodB d,lferencr
- 20 )
10
Ratio of marker amplitudes
AMPLITUDE READOUT FORMAT FOR MARKER a
Manual Operation 47

8/21/2019 analiz_espctros
http://slidepdf.com/reader/full/analizespctros 49/536
DIFFERENTIAL MARKERS-A MARKER
The frequency readout for all MARKERm conditions has up to 4 significant digits, depending upon the portion
of span measured.
The amplitude readout in dB has a resolution of f .Ol dB for linear scale. The resolution for logarithmic scale
depends upon the LOG m value:
LOG SCALE
dB PER DIVRESOLUTION
DATA Entry
The minimum incremental change for m frequency is 0.1% of the frequency span.
E--JO One full turn moves the active marker about one tenth of the horizontalspan.
EI@@ One step moves the marker one tenth of the horizontal span.
Positive entry places marker higher in frequency than the stationary marker,negative entry places marker lower in frequency. Larger entries than allowa- ble will place the marker on the adjacent graticule border,
-
Negative frequencies can be entered using ai m prefix as the minussign. For example, to set a m span of 10 MHz with the second marker
positioned to the left of the first, press
MARKER ZOOM
@ activates a single marker on the trace of highest priority (see TRACE PRIORIn Chapter 5).
In Ilo0.J , the DATA knob and STEP keys change the values of different functions.
0 Positions Marker
48 Manual Operation
Changes FREQUENCY SPAN
and sets CENTER FREQUENCY
equal to MARKER frequency

8/21/2019 analiz_espctros
http://slidepdf.com/reader/full/analizespctros 50/536
MARKER DIFFERENTIAL MARKERS-A
DATA Control Use for [,,,.
The marker can be moved along the trace with the DATA knob 0 , and the frequency span can be changed
about the marker with DATA step @ and @ . Each step also sets center frequency equal to the marker
frequency.
Measurement and Readout Range
The measurement and readout range for marker zoom is the same as marker (UL) .
DATA Entry
Moves the marker continuously along the trace. Rate dependent on speedof rotation. The marker moves in display unit increments.
El @J g)Changes the frequency span to the next value in the sequence and sets thecenter frequency equal to the marker frequency.
@a Places the marker at the frequency entered. An out-of-range entry placesthe marker at a graticule border.
Example
In wide frequency spans, it is often necessary to expand a portion of the frequency span about a specific signal in
order to resolve modulation sidebands or track frequency drift.
Manual Operation 49

8/21/2019 analiz_espctros
http://slidepdf.com/reader/full/analizespctros 51/536
DIFFERENTIAL MARKERS-A
From a full span, select a signal using the marker with
Eli
To center the marker and signal and expand the fre-
quency span in one step, press c)0
Expanding twice more with @ @ shows that the
marker requires recentering on the signal.
I i i I
50 Manual Operation

8/21/2019 analiz_espctros
http://slidepdf.com/reader/full/analizespctros 52/536
MARKER
Recenter w i th 0
Continue using @ (and recentering the marker on
the signal when necessary) until the desired resolution
is achieved.
AUTOMATIC ZOOM
AUTOMATIC ZOOM
The analyzer can automatically zoom in on a signal specified by a marker. The desired frequency span is input
from the DATA number/units keyboard.
To use the automatic zoom function:
entify the signal to be zoomed in on.and enter the desired span with the DATA number/units keyboard.
When the units key is pressed, the zooming process will begin.
Example
A single carrier needs to be examined in a 200 kHz span to see the sidebands. Because the SIGNAL TRACK
function automatically maintains the signal on the center of the CRT you can zoom automatically from a very wide
span to a narrow span to look close-in at the signal.
Manual Operation 51

8/21/2019 analiz_espctros
http://slidepdf.com/reader/full/analizespctros 53/536
PEAK SEARCH MARKER
Place a marker on the carrier with B 0
Press @FJ (,,:,,,I .Enter the span.
F’;;ls m @ B , and auto zoom will be -Aid I A I I i
200 kt-42 /I I I I I
PEAK SEARCH
Peak Search
Peak search places a single marker at the highest trace position of the highest priority trace. The active function is
not changed.
Example
Use PEAR SEARCH to position the marker at the peak
of the signal response.
In a narrow span, the marker may be placed at the
signal peak.
Pressm .
52 Manual Operation

8/21/2019 analiz_espctros
http://slidepdf.com/reader/full/analizespctros 54/536
MARKER MARKER ENTRY
Note that the marker seeks the maximum trace response, no matter what the cause of the response. A larger
signal, or the local oscillator feedthrough, would have attracted the marker.
MARKER to Next Peak
The marker can also find the next highest peaks by
successively pressing [,.,,,I K @
Marker to Minimum
The minimum trace value can be located by pressing
N .
MARKER ENTRY
m , m and marker m into span. Immediately set the corresponding FUNCTION value equal to the
readout of the active marker or markers:
ENTRY RESULT
marker frequency into ( ~& I j
marker m frequency into i spa”IIIou(Iclj or @/;@
marker amplitude into(-1
m immediately records the single or the differential marker frequency in COUPLED FUNCTION I”.‘::‘] for use
w i t h [z) D A T A @ @
Manual Operation 53

8/21/2019 analiz_espctros
http://slidepdf.com/reader/full/analizespctros 55/536
MARKER ENTRY MARKER
A marker entry can be made any time a marker is on the trace. ( @ “r;;? with only one marker displayed takes
0 Hz as the lower frequency.) The active function will not be changed.
Example
One of the fastest, most convenient ways to bring a signal to the center of the display is by using l”r:-)
Activate a single marker and tune it to the desired sis-
nal: (,,,I 0 .
Change the center frequency to the marker frequency.
l”c:-] will also work if start/stop frequencies are read out.
Example
One way to tune to a particular portion of a spectrum being displayed is to use the A + span function.
Activate the single marker and place it at either end of
the desired frequency span with I--] 0 .
I i i i i i i i i i I
5 4 M a n u a l ODeration

8/21/2019 analiz_espctros
http://slidepdf.com/reader/full/analizespctros 56/536
MARKER MARKER ENTRY
Activate the second marker and place it at the other
end of the span with m 0
Set the start and stop frequencies squal to the left and
right marker frequencies with B a
Marker m is activated.
A + span will work the same with start/stop frequency readout. Note that the markers can be placed at either end
of the span.
Example
Here is a technique for viewing a fundamental and its harmonics (or any evenly spaced portions of the spectrum)
with high resolution.
Narrow the span about the fundamental as necessary
withm , centering the carrier.
Set the center frequency step size with m
Now enable center frequency. With each 0 , suc-7
cessive harmonics will be displayed.
Manual Operation 55

8/21/2019 analiz_espctros
http://slidepdf.com/reader/full/analizespctros 57/536
SIGNAL TRACK -AUTOMATIC FREQUENCY CONTROL MARKER
0 0 0-am-.. a?“-“. a ” e
7 e.
S E C O N D HARMONIC THIRD HARMONIC FOURTH HARMONIC
Similar stepping can be accomplished using marker a into step size for intermodulation products or other
evenly spaced signals such as communication channels.
SIGNAL TRACK - AUTOMATIC FREQUENCY CONTROL
The analyzer is capable of automatically maintaining a drifting signal at the center of the display To operate
SIGNAL TRACK:
Press [--1 , and place the marker on the signal to be tracked with
PressB to initiate the tracking. The light above the key indicates tracking. (Press again to turn off .)
As the signal drifts, the center frequency will automatically change to bring the signal, and marker to the center of
the display.
MARKERm , any other MARKER mode or the instrument preset turns the tracking function off.
The upper sideband of a transmitter is to be monitored
as the carrier frequency is tuned.
Locate the sideband with [--y)
4R . . L Al-lVdl@-
I. ad I I I I I
56 Manual Operation

8/21/2019 analiz_espctros
http://slidepdf.com/reader/full/analizespctros 58/536
MARKER
The upper carrier sideband is tracked with m then
zoomed in with [T] Q m (%1.
PRESELECTOR PEAK
As the carrier frequency is changed, the sideband response will tend to remain in the center of the display. The
center frequency and marker frequency reads out the sideband’s frequency.
A combination of (::GKw:l anda allows the “real time” signal frequency drift to be read on the display.
PRESELECTOR PEAK
Preselector peak automatically adjusts the preselector tracking to peak the signal at the active marker. When the
marker is tuned to a signal and m is pressed, an internal routine searches for the peak response of the
preselector and adjusts the tracking accordingly. Using preselector peak prior to measuring a signal yields the most
accurate amplitude reading.
Preselector peak operates with the I--] , (,,,. , or m markers. If the marker is OFF pressing m will initiate a
peak search routine and then peak the response at that marker. A “PEAKING!” message appears on the active
graticule area to indicate operation of the peaking routine. PRESELECTOR PEAK only operates in the 2 - 22
GHz preselected band.
Example
Peak the signal for accurate amplitude measurement.
Tune marker to signal of interest.
Press @ 0 .
Manual Operation 57

8/21/2019 analiz_espctros
http://slidepdf.com/reader/full/analizespctros 59/536
NOISE LEVEL MEASUREMENT MARKER
Press m to peak preselector tracking. Measure
amplitude by reading marker.
The specific preselector correction factor applied in the example above is stored. A [15::) INSTRUMENT PRESET
will not erase the correction factor; however, another PEAKING routine in the same band will store a new
correction factor in that band.
The factory set preselector tracking can be recalled with [,,, = @ The preselector can be manually adjusted
by pressing (,,, / (“:::1 (See Chapter 11.)
How It Works
The internal preselector peaking routine automatically searches and sets the peak response of the YIG filter at the
marker frequency. Each peaking operation only affects the frequency band in which the signal is located (four possible bands). A correction factor, representing the tracking offset, is stored in memory for that particular band
each time the peaking routine is used. Correction factors (one per band) remain in memory unless a new peaking
routine is initiated that may result in a different number. The last m correction factors are saved along with
control settings in the internal storage registers upon execution of a I-11 followed by a number from 1 to 6. Thus,
up to six correction factors could be saved for any of the frequency ranges listed in the chart below:
BAND FREQUENCY RANGE
1 2.0 - 5.8 GH z
2 5.8 - 12.5 GHz3 12.5 - 18.6 GHz
4 18.6 - 22 GH z
NOISE LEVEL MEASUREMENT
When noise level is activated and the marker is placed in the noise, the rms noise level is read out normalized to a
1 Hz noise power bandwidth.
58 Manual Operation

8/21/2019 analiz_espctros
http://slidepdf.com/reader/full/analizespctros 60/536
MARKER NOISE LEVEL MEASUREMENT
Noise level enabled: @ b
Noise level disabled: [,,,,, b
The noise level measurement readout is corrected for the analyzer’s log amplifier response, and the detector
response. The value is also normalized to a 1 Hz bandwidth.
Measurement and Readout Range
Noise level measures noise accurately down to 10 dB above the spectrum analyzer’s noise level. The readout
resolution is in steps of +- 0.1 dB.
DATA Entry
See MARKER @ , [8) , and m.
Example
In a communication system, the baseband noise level as well as signal to noise ratio measurements are required.
Select a frequency in the baseband spectrum clear of
signals with a single marker. Press IUI] 0

8/21/2019 analiz_espctros
http://slidepdf.com/reader/full/analizespctros 61/536
NOISE LEVEL MEASUREMENT MARKER
Read the noise at the marker by pressing OBrl) b
The noise at 64 MHz is - 134 dBm in a 1 Hz bandwidth. This corresponds to - 134 dBm + 36 dB/4 kHz =
- 98 dBm in 4 kHz voice channel bandwidth.
Signal to noise measurements require the measurement of the noise level, as the example above, and the mea-surement of the absolute signal level. *
Measure the power level of the adp signal. To
turn the noise level off, press fxiFJm and read the
power level.
The signal to noise ratio referenced to 4 kHz bandwidth is - 32 dBm - ( - 98 dBm) = 66 dB.
*Normalization to a desired bandwidth uses the equation 10 log,0 (desired BW
1Hz )
60 Manual Operation

8/21/2019 analiz_espctros
http://slidepdf.com/reader/full/analizespctros 62/536
SCALE AND REFERENCE LINE SCALE
Chapter 7
SCALE AND REFERENCE LINE
GENERAL DESCRIPTION
This chapter describes the use of SCALE and REFERENCE LINE control groups for setting the amplitude scale,
and for making amplitude level measurements more conveniently.
REFERENCE L INE E
DISPLAY LINE
: THRESHOLD
SCALE
SCALE keys allow the scaling of the vertical graticule divisions in logarithmic or linear units without changing the
reference level value.
LOG.
m (DATA entry) scales the amplitude to 1 dB, 2 dB, 5 dB, or 10 dB per division.
If m is pressed when the scale is linear, 10 dB per division will be automatically entered. The subsequent
(DATA), if any, will then replace the automatic 10 dB/div.
Press
Manual Operation 61

8/21/2019 analiz_espctros
http://slidepdf.com/reader/full/analizespctros 63/536
SCALE SCALE AND REFERENCE LINE
LIN
0. d’lmme late y scales the amplitude proportional to input voltage. The top graticule remains the reference
level, the bottom graticule becomes zero voltage. Reference level, and all other amplitudes, are read out in
voltage. However, other units may be selected. See AMPLITUDE UNITS SELECTION, Chapter 11.
Ifm is pressed when the scale is linear, 10 dB per division will be automatically entered.
LIN
Press
In LINEAR, a specific voltage per division scale can be set by entering a voltage reference level value. For
example, to set the scale to 3 mV/division, key in 30 mV reference level, (Voltage entries are rounded to the
nearest 0.1 dB, so the 30 mV entry becomes 30.16 mV which equals - 17.4 dBm.)
DATA Entry
m -j
pq @
Changes scale in allowable increments (1, 2, 5, or 10 dB per division).
Enables direct scale selection of allowed values. Other entries are roundedto an adjacent value.
LIN No DATA entry will be accepted with the linear SCALE selection key,0
Example
It is convenient to observe AM sidebands in linear as well as logarithmic scales for analysis of both modulation
percentages and distortion products.
6.2 Manual Operation

8/21/2019 analiz_espctros
http://slidepdf.com/reader/full/analizespctros 64/536
SCALE AND REFERENCE LINE SCALE
Modulated AM signal displayed in the 10 dB/division
scale shows the carrier, its sidebands, and distortion
products.
Linear scaling enables the observation of the sidebands proportional to the carrier.
LINPress (-J
As in the MARKER m example, Chapter 6, a
direct readout of the percent modulation can be
made.
The fractional readout is one -half the modulation
index (only one sideband is measured).
%AM = 2(.25) x 100 = 50%.
Note that the carrier signal need not be placed at the
reference level for an index ratio measurement.
LOG
Change to a logarithmic scale with m and change
the dB/division with @ @ .
The sidebands are 12 dB down from the carrier, veri-
fying the earlier measurement results.
t I I I I III I I I 1
Manual Operation 63

8/21/2019 analiz_espctros
http://slidepdf.com/reader/full/analizespctros 65/536
REFERENCE LINE SCALE AND REFERENCE LINE
Harmonic distortion of the modulating signal can be
measured as in MARKER m , Chapter 6.
The modulation frequency is 18.8 kHz and the distor-
tion caused by the second harmonic is 2.4% (read out
as .024X).
REFERENCE LINE
The reference line functions, DISPLAY LINE (DL) and THRESHOLD (TH), place horizontal reference lines on
the display. Their levels are read out in absolute amplitude units.
DISPLAY LINE uses
l measure signal levels with direct readout.
l establish a standard for go/no-go test comparisons.
0 eliminate or reduce amplitude errors due to system frequency response uncertainty
THRESHOLD provides:
l
a base line clipper whose level is read out.0 a minimum threshold level that can be set.
DISPLAY LINE
DISPLAY LINE [1.1113 (DATA entry) places a horizontal reference line at any level on the graticule. The line’s
amplitude, in reference level units, is read out on the left-hand side of the CRT display.
64 Manual Operation

8/21/2019 analiz_espctros
http://slidepdf.com/reader/full/analizespctros 66/536
SCALE AND REFERENCE LINE DISPLAY LINE
The DISPLAY LINE can be positioned anywhere within the graticule. When activated after LINE power ON or
m , the display line is placed 4.5 divisions down from the reference level.
DISPLAY LINEm erases the line and readout from the CRT display but does not reset the last position. If the
display line is activated again before LINE power ON or [a;l:l , it will return to its last position.
DISPLAY LINE position is always accessible for HP-IB and TRACEm , even if never activated. See Chapter 5,TRACE ARITHMETIC.
The DISPLAY LINE readout has the same number of significant digits as reference level.
DATA Entry
t I
go Moves the line about one division for each full turn. The line moves indisplay unit increments.
m @@ Moves the line one-tenth of the total amplitude scale per step.
@iiJH Positions the line to the exact entry level. Entry may be in mV, FV -I- dBm,+ dBmV, or f dB& depending upon which units are selected.
Example
When the amplitude of a number of signals in the same span require a quick readout, the DISPLAY LINE can be
used.
Activate the DISPLAY LINE with @
With 0 , place the line through the peak of a signal
and read out its absolute amplitude level. a-94.9
d “V
Moving the DISPLAY LINE to each signal reads out its amplitude.
Manual Operation 65

8/21/2019 analiz_espctros
http://slidepdf.com/reader/full/analizespctros 67/536
THRESHOLD SCALE AND REFERENCE LINE
THRESHOLD
THRESHOLD (,.,,. (DATA entry) moves a lower boundary to the trace, similar to a base line clipper on direct-
writing CRT spectrum analyzers. The boundary’s absolute amplitude level, in reference level units, is read out on
The THRESHOLD can be positioned anywhere within the graticule. It operates on TRACE m , m, or
for TRACES A, B, and C simultaneously. When activated after LINE power ON or 1’6::] , the THRESHOLD is
The THRESHOLD level does not influence the trace memory; that is, the threshold level is not a lower boundary
for trace information stored and output from the trace memories through the HP-IB. TH removes the
THRESHOLD boundary and readout from the CRT display but does not reset the position. If threshold is acti-
vated again before LINE power ON or I’d::] , it will resume at its last level.
The THRESHOLD readout has the same number of significant digits as reference level.
DATA Entry
,.,.io Moves the THRESHOLD about one division per rotation. The line moves in
Moves the THRESHOLD one-tenth of the total amplitude scale per step.
I t ll.l l pJ Positions the THRESHOLD to the exact entry level. Entry may be in mV,
k dBm, f dBmY or + dB& depending upon units selected.
66 Manual Operation

8/21/2019 analiz_espctros
http://slidepdf.com/reader/full/analizespctros 68/536
SCALE AND REFERENCE LINE THRESHOLD
Example
The THRESHOLD can be used as a go/no-go test limit.
A series of signals can be tested for a specific
THRESHOLD level by placing the THRESHOLD at
the test level.
Press THRESHOLD (,.,,,I 55.2 dBm. Only those sig-
nals > - 55.2 dBm will be displayed.
Manual Operation 67

8/21/2019 analiz_espctros
http://slidepdf.com/reader/full/analizespctros 69/536
COUPLED FUNCTION GENERAL DESCRIPTION
Chapter 8
COUPLED FUNCTION
GENERAL DESCRIPTION
This chapter describes the COUPLED FUNCTION group and its use in various measurements. The COUPLED
FUNCTIONS control the receiver characteristics of the spectrum analyzer.
The values of the COUPLED FUNCTION are automatically selected by the analyzer to keep absolute amplitude
and frequency calibration as frequency span and reference level are changed. * The functions are all coupled with
LINE power ON, a m or I”;‘:) FULL SPAN key, or when their individual [1u10) is activated.
couples
Function
I C O U PLED F U N C T IO N
i
=Q
riEr
RESBW
E
L
ul o”pl sFunction I
Center FrequencyStep Size
RF Attenuation
Sweeptime, full scale
Video Bandwidth
Resdution Bandwidth
OFF
IMANUALLight
ION
For each COUPLED FUNCTION:
LlAUTO
MA UAL-:&s
I [
Sets the function to the preset value dictated by the analyzer’s current state. The function is
coupled.
Function value will not change with instrument state. DATA entry changes value. The MAN-
UAL light goes on and stays on until the function is placed in m once again.
In most cases, the [-1 coupled functions will change values to maintain amplitude calibration when one or more
of the others are manually set. If the amplitude or frequency becomes uncalibrated, “MEAS UNCAL” appears in
the right-hand side of the graticule.
*Center frequency step size does not affect amplitude or frequency calibration.
Manual Operation 69

8/21/2019 analiz_espctros
http://slidepdf.com/reader/full/analizespctros 70/536
DATA ENTRY FOR COUPLED FUNCTIONS COUPLED FUNCTION
Coupled
FunctionSelects
i::‘1 3 dB resolution bandwidth (IF filter) which largely determines the ability of the analyzer to
resolve signals close together in frequency.
ml3 dB bandwidth of the post detection low pass filter that averages noise appearing on the
trace.
(::::‘I The total time for the analyzer to sweep through the displayed frequency span or display a
detected signal in zero frequency span.
[,1,,1 The setting of the input RF attenuator which controls signal level at the input mixer.
I’::::‘] Selects center frequency change for each DATA @ @ when I=] is activated.
DATA ENTRY FOR COUPLED FUNCTIONS
Discrete values are entered for [:;‘I , [‘:“;“J , [‘I:::‘1 , and (.,,,. . The DATA entry from DATAa and @j ;,&J
selects these values sequentially from the current value. A DATA entry from the keyboard which is not exactly
equal to an allowable value will select an adjacent value. For example, [::‘1QQ@
will select 30 kHz
bandwidth, the next higher IF bandwidth.
RESOLUTION BANDWIDTH
[:;‘I (DATA entry) sets bandwidth selection to MANUAL and changes the analyzer’s IF bandwidth. The band-
widths that can be selected are 10 Hz, 30 Hz, 100 Hz, 300 Hz, 1 kHz, 3 kHz, 10 kHz, 30 kHz, 100 kHz, 300 kHz,
1 MHz, and 3 MHz.
Example
A measurement requiring manual resolution bandwidth selection is the zero span (time domain) observation of
modulation waveforms. An example can be found in Chapter 3, ZERO FREQUENCY SPAN - FIXED TUNED
RECEIVER OPERATION.
70 Manual Operation

8/21/2019 analiz_espctros
http://slidepdf.com/reader/full/analizespctros 71/536
COUPLED FUNCTION VIDEO BANDWIDTH
Another use of manual resolution bandwidth is for better sensitivity over a given frequency span.
The low level intermodulation products of a signal
needs to be measured. With the functions coupled,
the analyzer noise may mask the distortion products.
Reduction of the noise level by 10 dB (increased sensi-
tivity) is achieved by decreasing the bandwidth by afactor of 10.
- -
(THRESHOLD has been activated to clarify the dis-
play. 1
lu4l.Bk
The sweep time automatically slows to maintain absolute amplitude calibration ifm is coupled.
VIDEO BANDWIDTH
[.;“.“) (DATA entry) sets the video bandwidth selection to manual and changes the analyzer’s post detection filter
bandwidth. The bandwidths that can be selected are 1 Hz, 3 Hz, 10 Hz, 30 Hz, 100 Hz, 300 Hz, 1 kHz, 3 kHz, 10
kHz, 30 kHz, 100 kHz, 300 kHz, 1 MHz, and 3 MHz.
hp19 .
Manual Operation 7 1

8/21/2019 analiz_espctros
http://slidepdf.com/reader/full/analizespctros 72/536
VIDEO BANDWIDTH COUPLED FUNCTION
Example
Signal responses near the noise level of the analyzer will be visually masked by the noise. The video filter can be
narrowed to smooth this noise.
A low level signal at this center frequency can just be
discerned from the noise.
Narrowing the video bandwidth clarifies the signal and
allows its amplitude measurement.
P r e s s m @I @I @ l @I
The sweep time will increase to maintain amplitude calibration.
NOTE
The video bandwidth must be set wider or equal to the resolution bandwidth when
measuring pulsed RF or impulse noise levels.
Video Averaging
Narrowing the video filter requires a slower sweep time to keep amplitude calibration, since the narrower filter must
have sufficient time to respond to each signal response. Video averaging is an internal routine which djgjtalfy
averages a number of sweeps, allowing a more instantaneous display of spectra1 changes due to center frequency,
frequency span, or reference level changes. See Chapter 11.
72 Manual Operation

8/21/2019 analiz_espctros
http://slidepdf.com/reader/full/analizespctros 73/536
COUPLED FUNCTION SWEEP TIME
SWEEP TIME
m (DATA entry) sets the sweep time selection to manual and changes the rate at which the analyzer sweeps the
displayed frequency or time span.
The sweep times that can be selected are:
FREQUENCY SPAN(~100 Hz)
SWEEP TIME
20 msec to 1500 set
SEQUENCE
continuously
ZERO FREQUENCYSPAN (0 Hz)
1 psec to 10 msec
20 msec to 1500 set
1,2,5, and 10
continuously
Example
To identify signals quickly in a very narrow frequency span (where the resolution bandwidth would be narrow), the
sweep time can be temporarily reduced (e.g., speed up sweep rate).
A frequency span of 10 kHz will have a selected reso-
lution bandwidth of 100 Hz and a sweep time of 3
seconds.

8/21/2019 analiz_espctros
http://slidepdf.com/reader/full/analizespctros 74/536
INPUT ATTENUATION
To quickly see signals present in the span, press I::::‘1
and 0 several times. When the sweep completes its span, couple sweep time again with m
Note that the MEAS UNCAL message appears auto-
matically as the faster sweep time causes some distor-
tion of the spectral response.
COUPLED FUNCTION
ATID I.
10 al
CEmn- 1 ml* PIN I . . . .“ZR1 By lee H, ve* 3.e H* 51p I ” Wm.0
INPUT ATTENUATION
I11111] (DATA entry) sets the attenuation function to MANUAL and changes the analyzer’s RF input attenuation.
The levels of attenuation that can be selected are 10 dB to 70 dB in 10 dB steps, or 0 dB under special conditions.
Generally, the reference level does not change with attenuator settings.
I aam .Y M. ¶=ud 2” .*,
When the RF input attenuator function is coupled (AUTO), the value selected assures that the level at the input
mixer is less than - 10 dBm (the 1 dB compression point) for on-screen signals. For example, if the reference level
is + 28 dBm, the input attenuator will be set to 40 dB: + 28 dBm - 40 dB = - 12 dBm at the mixer.
The input mixer level can be changed to assure maximum dynamic range. See EFFECTIVE MIXER LEVEL,
Chapter 11.
CAUTION
Greater than + 30 dBm total input power will damage the input attenuator and the
input mixer.
74 Manual Operation

8/21/2019 analiz_espctros
http://slidepdf.com/reader/full/analizespctros 75/536

8/21/2019 analiz_espctros
http://slidepdf.com/reader/full/analizespctros 76/536
CENTER FREQUENCY STEP SIZE
Increase the RF attenuation by 10 dB. Press m 0 (If the reference level changes, it will be necessary to
return it back to its original value.)
hp e -I..8 h1. .”
COUPLED FUNCTION
I 1 I Icwa-rm 1m.114 Y(*
]WIN 1” LHI
I I LCIX YI 1.. “1 op 2.. ..*
Since some of the signal responses decrease as the attenuation increases (by comparing the response in A with the
stored trace in B) , distortion products are caused by an overloaded input mixer. The high level signals causing the
overload conditions must be attenuated to eliminate this condition.
CENTER FREQUENCY STEP SIZE
m (DATA entr ) sets step size to MANUAL, changes and stores the step size entered into a register. While [“::::‘)
is in MANUAL, &E-] 0and 0 change center frequency by the step size value stored in the register. Several
functions can be used to enter step size value to the register. When a CF STEP SIZE is AUTO, the center
frequency steps will be 10% of the frequency span, even though the CF STEP SIZE register contains another
value.Entry Value m State
step size [,,,, , FULL
SPAN or LINE power ON 100 MHzcoupled (AUTO)
I”::::il (DATA entry) DATA entry value uncoupled (MANUAL)
MARKER @ marker frequency readout uncoupled (MANUAL)
The step size can be varied from 0 Hz to greater than 20 GHz with 1 Hz resolution. It is displayed with the same
resolution as center frequency.
76 Manual Operation

8/21/2019 analiz_espctros
http://slidepdf.com/reader/full/analizespctros 77/536

8/21/2019 analiz_espctros
http://slidepdf.com/reader/full/analizespctros 78/536
CENTER FREQUENCY STEP SIZE COUPLED FUNCTION
Set the step size to 50 MHz, (‘::::‘I
reactivate center frequency with [Zg)and step to
225 MHz.
cwnw
f---3
Now each u sets the center frequency to the next 50 MHz span for a span by span surveillance of the
spectrum. (Center frequency = 25 MHz, 75 MHz, 125 MHz, etc.) Center frequency step size can also be defined
by the marker. See the MARKER ENTRY portion of Chapter 6.
hp
78 Manual Operation

8/21/2019 analiz_espctros
http://slidepdf.com/reader/full/analizespctros 79/536
SWEEP AND TRIGGER SWEEP
Chapter 9
SWEEP AND TRIGGER
This chapter describes the use of SWEEP and TRIGGER control functions.
SWEEP controls enable:
m continuous, or repetitive sweeping (sweep time L 20 msec) .
B a single sweep which will repeat only on demand (sweep time I 20 msec) .
TRIGGER controls select the function which will begin a sweep:
B as soon as possible,
[.,, line voltage passes through zero on a positive swing,
m an external signal voltage passes through - 1.5V on a positive swing.
[,,,I the level of a detected RF envelope reaches up to the level on the CRT display determined by the
LEVEL knob.
TRIGGER
i
SWEEP AND TRIGGER CONTROLS
SWEEP
The spectrum analyzer frequency sweep (sweep times 220 msec), once triggered, continues at a uniform rate
from the start frequency to the stop frequency unless new data entries are made to the analyzer from the front
panel or the HP-IB. With faster sweeps, changes to center frequency, for example, appear continuous. With long
sweep times, a change in center frequency noticeably suspends the sweep while the analyzer updates its state and
readout, then the sweep continues from where it was, tracing out the new spectrum.
Manual Operation 79

8/21/2019 analiz_espctros
http://slidepdf.com/reader/full/analizespctros 80/536
TRIGGER SWEEP AND TRIGGER
The SWEEP light indicates that a sweep is in progress. The light is out between sweeps and during data entry. (The
light is out for sweep times 110 msec.)
After a sweep, the next sweep will be initiated only if:
0 continuous sweep mode is selected or a single sweep demand is made,
0 the trigger conditions are met,
l data is not entered continuously from the front panel DATA controls or the HP-IB.
Continuous Sweep
[-1 enables the continuous sweep mode. Provided the trigger and data entry conditions are met, one sweep will
follow another as soon as triggered. Pressing m initiates a new sweep.
Single Sweep
@ enables the single sweep mode. Each time [,,,,,,I is pressed, including when the SWEEP mode is changed
from continuous, one sweep is initiated provided that the trigger and data entry conditions are met. A sweep in
progress will be terminated and restarted upon (,,.,,, .
Zero Frequency Span Sweep
In zero frequency span, sweep times from 1 psec to 10 msec are also available. In these sweep times, the SWEEP
[,,,) , @ are disabled. The video signal response is not digitally stored (trace modes also disabled), but multi-
plexed directly onto the display along with the graticule and readouts. The graticule and readouts are refreshed
following each fast sweep.
To avoid flicker of the display when external or video triggers are less frequent than 25 msec, the analyzer will
trigger internally. If triggers dependent only on external or video trigger are required, press
[,nl) ‘(d’ b]isa es “auto” external trigger feature
or 11.111) ‘[,,,, disables “auto” video trigger feature
NOTE
For zero frequency span sweep times 110 msec and 11*111) x or @ y, the CRT
display graticule and readout depend upon triggering. If no trigger is present, the CRT
display will be blank.
TRIGGER
The analyzer sweep is triggered by one of four modes selected.
l (:2:., allows the next sweep to start as soon as possible after the last sweep.
l iallows the next sweep to start when the line voltage passes through zero, going positive.
l allows the next sweep to start when an external voltage level passes through = 1.5V, going positive.
The external trigger signal level must be between OV and + 5V
80 Manual Operation

8/21/2019 analiz_espctros
http://slidepdf.com/reader/full/analizespctros 81/536
SWEEP AND TRIGGER TRIGGER
EXTERNAL TRIGGER INPUT
l B allows the next sweep to start if the detected RF envelope voltage rises to a level set by the LEVEL
knob. The LEVEL corresponds to detected levels displayed on the CRT between the bottom graticule (full
CCW) and the top graticule (full CW).
An RF envelope will trigger the sweep only if it is capable of being traced on the CRT display-that is, the
resolution bandwidth and video bandwidth are wide enough to pass the modulation waveform of an input signal.
Example
A zero span display of this video waveform will trigger
for all LEVEL knob settings.
If the video signal lowers on the display, the LEVEL
must be set towards the minus side.
t i I I
If the level does not cause a trigger within 25 msec, the sweep will be triggered anyway to ensure a display. Note
that this is true only for sweep times ~10 msec.
Manual Operat ion 81

8/21/2019 analiz_espctros
http://slidepdf.com/reader/full/analizespctros 82/536
INSTRUMENT STATE FULL SPAN INSTRUMENT PRESET (2 - 22 GHz)
Chaper 10
INSTRUMENTSTATE
GENERAL DESCRIPTION
This chapter describes the INSTRUMENT STATE keys. Each key allows access to or activation of a specific set of
functions and their values. Some of the sets are built into the analyzerand some are user defined.
INSTRUMENT STATE
Instrument states that can be selected:
FULL SPAN
@ A full 2-22 GHz span with coupled operation and all the functions set to known states and
values.FULL SPAN
@ A full 0 Hz to 2.5 GHz span with coupled operation and all the functions set to known states and
values.
m(TJ Saves the complete set of current front panel function states and values for later recall. Registers 1
@(TJ
through 6 are available for storage.
Recalls the complete instrument state saved in the register called.
mCalls for front panel control after the analyzer has been placed in a remote state by an HP-IB
controller.
FULL SPAN INSTRUMENT PRESET (2 - 22 GHz)
m provides a convenient starting point for making most measurements. That is, it calls for a full 2 - 22 GHz
span, coupled functions, and a 0 dBm reference level, to name a few. LINE power ON automatically calls for an
instrument preset.
The states that are set include all the functions and values of
l front panel functions, and
l [,.,,11 KEY FUNCTIONS, and
l functions accessible only by the HP-IB.
Manual Operation 83

8/21/2019 analiz_espctros
http://slidepdf.com/reader/full/analizespctros 83/536
FULL SPAN INSTRUMENT PRESET (2 - 22 GHz) INSTRUMENT STATE
Front Panel Preset
m enables all the front panel functions designated by keys with white lettering. It will save a trace response in
TRACE B, but not A or C.
,m , FUNCTIONS ACTIVATED WITH FULL SPAN KEY
To be precise:
FUNCTION:
DATA:COUPLED FUNCTION:
TRACE:
MARKER:
INSTRUMENT STATEI,.,and@:
SCALE:
REFERENCE LINE:
84 Manual Operation
Start Frequency 2 GHz
Stop Frequency 22 GH z
Reference Level 0 dBm
Hold
All set toa which corresponds to the following values:
Resolution Bandwidth 3 MHz
Video Bandwidth 1MHz
Sweep Time 500 msec full scale
Attenuator 10 dB, coupled to maintain < - 10 dBm
at input mixer
Center Frequency Step Size
A
B
100 MHz entered in register
Clear-Write
Blanked, but information in memory
savedA - B off
off
States are saved including the current state. See @ a below.
Logarithmic, 10 dB/division
Display line off
Threshold off
5.5 divisions up
1 .O divisions up

8/21/2019 analiz_espctros
http://slidepdf.com/reader/full/analizespctros 84/536
INSTRUMENT STATE FULL SPAN 0 - 2.5 GHz
SWEEP: Continuous
TRIGGER: Free run
INSTR CHECK:
KEY FUNCTION:
[auto] FUNCTIONS:
An internal instrument check is made. If the check is false, lights will stay on.
Normal
Chapter 11, m KEY FUNCTIONS, discusses the implications of activating
instrument preset during [,.,, FUNCTION use.
If the key is activated (shift light on), m unshifts the key. This is equivalent to
pressing [--I
HP-IB FUNCTIONS: “Dl” Display size-normal
“EM” Erase trace C memory
“03” Output format ASCII absolute
“PD” Pen down
“DA’ Display address set to 3072
Graphic information or control language written into the analyzer memory by HP-
IB functions such as graph (GR) , plot (PA), label (LB), or display write (DW) will be erased unless stored in trace memory B. Instrument preset also rewrites all the
display graticule and character readouts into the appropriate section of the display
memory.
FULL SPAN 0 - 2.5 GHz
The 0 - 2.5 GH z FULL SPAN key selects a start/stop frequency of 0 Hz and 2.5 GHz respectively, a reference
level of 0 dBm, and sets all the COUPLED FUNCTIONS to AUTO. Basically, B is the equivalent of an
instrument preset in the low band. It presets everything that m does except that m will not execute the
instrument check sequence.
SAVING AND RECALLING INSTRUMENT STATES
(DATA keyboard entry) and @ (DATA keyboard entry) save and recall complete sets of user-defined
front panel function v lues. The DATA entry from the keyboard names the register which stores the instrument
state. Six registers, 0 through @ , can be saved and recalled. Only another will erase a saved register.
The registers contain their last states even with a loss of line power (power failure). The registers are maintained
with an internal battery supply for about a 30-day period after line power failure.
@gr;7 is a special recall function which recalls the instrument state prior to the last instrument preset or single
function value change, whichever has most recently occurred. It aids in recovering from inadvertent entries.
Registers 8 and 9 contain preset control settings that are used for calibration purposes. (See Calibration procedure
under GENERAL INFORMATION at the beginning of this section.) Register 0 restores the current state of the
analyzer, which is useful for servicing.
The current instrument state, if the POWER switch is turned to STANDBY (or a short-term loss of ac line power),
can be recovered at POWER ON ifm is activated previous to a power loss.
Manual Operation 85

8/21/2019 analiz_espctros
http://slidepdf.com/reader/full/analizespctros 85/536
SAVING AND RECALLING INSTRUMENT STATES INSTRUMENT STATE
Some [,.., KEY FUNCTION values or states cannot be saved. Neither can information in the display memories,
such as a title or trace.
Example
When a test sequence is used over and over, the instrument states can be set up in the registers prior to testing for
recall during the procedure.
Keying in a specific state: (06::)
(ZE--@p-J@
[~](gYi-J~~
[y)@
LIN SCALE
Then save with [,., Q
Press a
And recall the last state with (llellll [1] Onc e the
state has been recalled, any function can be used for
more detailed measurements.
Note that in this case, the state could also have been
recalled by (.,,.rrl [1] .
Registers 1 - 6 can also be locked to prevent any loss
or change in the contents of the storage registers.
[,.lrl I-11 locks the registers and (,.,,, (..cLLL unlocks the
registers.
86 Manual Operation

8/21/2019 analiz_espctros
http://slidepdf.com/reader/full/analizespctros 86/536
INSTRUMENT STATE
LOCAL OPERATION
LOCAL OPERATION
@ enables front panel control after an HP-IB remote LISTEN or TALK command has been executed. An HP-IB
local lockout will disable @ until an HP-IB return to local command is executed or the LINE power is turned to
STANDBY then ON again.
Indicates instrument has been addressed through HP-
IB.
Indicates instrument is in remote operation.
The addressed light remains on until an HP-IB device clear command or any unlisten command is executed.
Manual Operation 87

8/21/2019 analiz_espctros
http://slidepdf.com/reader/full/analizespctros 87/536
(,,,rr KEY FUNCTIONS GENERAL DESCRIPTION
Chapter 11
KEY FUNCTIONS
GENERAL DESCRIPTION
This chapter describes access and use of the B KEY FUNCTION.
Shift functions supplement a front panel function or provide unique measurement capabilities. The @ functions
are not named on the front panel but are coded by the blue characters beside the keys. For- example, the
frequency offset function is designated by the code V On the front panel the code V is found in the FUNCTION
section : V
The shift functions are activated by pressing (WTII and then the front panel key with the appropriate blue code. Acomplete summary of shift FUNCTIONS is in this chapter under FUNCTION SUMMARY There is an index to all
shift functions at the end of this chapter.
Example
Activate the shift function V (frequency offset) with
press shift light on
press shift light off and offset function activated
The shift light can always be turned off with I--u] , which returns the front panel keys to their designated function.
m does not disable the selected shift function (except for title).
DATA Entry
An active shift function value is read out and identified in the active function area of the display the same as any
other function using DATA entry Once the data has been entered, any other function can be activated. The shift
function will retain its last value until thea key is pressed, or the LINE switch is switched to STANDBY
Manual Operation 89

8/21/2019 analiz_espctros
http://slidepdf.com/reader/full/analizespctros 88/536

8/21/2019 analiz_espctros
http://slidepdf.com/reader/full/analizespctros 89/536
151111 KEY FUNCTIONS (,.,,, -,v,z
DATA entries to shift functions are made only from the number/units keyboard. The ENABLED light remains off
even though data may be entered.
Data is entered (that is, changes the instrument state) only when a units key is pressed. If the entry has no units (an
address, for example), use the . key as the terminator.
NEGATIVE DATA KEYBOARD ENTRY
Entering negative data from the DATA keyboard requires the use of a negative symbol prefix on the number entry.
Negative entry: [,.,,,
For example, to enter a negative 100 MHz offset frequency:
Press [z) to activate frequency offset.
P r e s s (,..I] ( - I 0 m m @ to enter a negative frequency.
Not all values can be entered with a negative prefix. For example, a negative entry to a voltage reference level will
result in entering the positive value.
Negative entries in dB can be made with the - dBm units key or the negative prefix with the + dBm units key. If
both negative prefix and -7;: are used, the value will be entered as positive.
FREQUENCY AND AMPLITUDE OFFSET
The CRT display amplitude and frequency readout can be offset. Entering an offset does not affect the trace.
V
Frequency offset: ,,,,I [=I (DATA keyboard entry)
Amplitude offset: (DATA keyboard entry
Offset entries are added to all the frequency or amplitude readouts on the CRT display, including marker, display
line, threshold, start frequency, and stop frequency.
FUNCTION
To eliminate an offset, activate the offset and enter zero. A FULL SPAN key also sets the offsets to zero.
Offsets are stored with the [,,, functions for recall with @ .
Manual Operation 91

8/21/2019 analiz_espctros
http://slidepdf.com/reader/full/analizespctros 90/536
i”“;? KEY FUNCTIONS
When an offset is entered, its value is displayed on the CRT
j i i i I
I i i
DATA entry from the keyboard can be in Hz, kHz, MHz, or GHz for frequency and dB, - dB, mV and FV for
amplitude. The amplitude offset readout is always in dB. An entry in voltage can be made and will be converted to
dB offset.
The offset range for frequency is - 99.999999990 to + 99.999999999 GHz in 1 Hz steps. The amplitude offset
range is greater than f 100 dB in 0.1 dB steps. Least significant digits will be truncated for frequency and
amplitude offset entries.
Example
An 102.6 MHz up converter with 12.7 dB attenuation is placed between a signal source and the spectrum
analyzer. The offsets can be set so that the CRT display shows the trace referenced to the signal as input to the
converter.
Amplitude offset is entered as a positive value to com-
pensate (offset) the loss of the converter.
Note that the original REF LEVEL of 0 dBm is now
changed to 12.7 dBm also.
92 Manual Operation

8/21/2019 analiz_espctros
http://slidepdf.com/reader/full/analizespctros 91/536
m KEY FUNCTIONS (,.,,, V -, A, B, C, D
Frequency offset is entered as a negative value since
the input frequency to the converter is lower than the
output.
EFFECTIVE MIXER LEVEL
The effective mixer level is equal to the REFERENCE LEVEL minus the INPUT ATTENUATOR setting. It speci-
fies the maximum signal level that will be applied to the input mixer for a signal that is equal to or below the
REFERENCE LEVEL. A FULL SPAN key (0 - 2.5 GHz or 2 - 22 GHz) sets the mixer level to - 10 dBm, which
is 5 dB below the analyzer’s 1 dB compression point. The effective mixer level can be manually set from - 10
dBm * to - 70 dBm in 10 dB steps by pressing , (comma sign) and entering the desired eve1 through the
numeric keyboard. For instance, to set a mixer level at -40 dBm, press: (,,IIl , m d (zl . As the
analyzer’s REFERENCE LEVEL is changed, the coupled input attenuator will automatically change to limit the
maximum signal at the mixer to - 40 dBm for signals I REFERENCE LEVEL.
AMPLITUDE UNITS
The following shift key codes immediately select the corresponding units for all the amplitude readouts: reference
level, marker, display line, and threshold.
When a units change is made, all readouts are converted so as to preserve the absolute power levels of all the
readouts. For example, a 0 dBm threshold level converts to 47.0 dBmV (50 ohm input) when dBmV units are
called.
SHIFT KEY AMPLITUDE
FUNCTION UNITS
i A. . . . . . (or FULLSPAN key) . . . . . . . dBm
@ B . . . . . . . . . . . . . . . . . . . . . . . . . . . . . . . . dBmV
[,,,,, C . . . . . . . . . . . . . . . . . . . . . . . . . . . . dBpVm D . . . . . . . . . . . . . . . . . . . . . . . . . volts
The keys for these functions are located in the COUPLED FUNCTION group.
‘In the Extended Reference Level Range (Shift I, under EXTEND REFERENCE LEVEL RANGE in this chapter), the effective mixer
level can be set to 0 dBm.
Manual Operation 93

8/21/2019 analiz_espctros
http://slidepdf.com/reader/full/analizespctros 92/536

8/21/2019 analiz_espctros
http://slidepdf.com/reader/full/analizespctros 93/536
kd KEY FUNCTIONS kd u, K, N
MARKER SWEEPS
Stop Sweep at Marker, TALK after Marker
To stop the sweep at the marker,
press MARKER I--] and
press 11*0 u
A marker must be activated to enter this sweep function.
Each time a sweep is triggered, it will stop at the marker, even if the marker has been moved. A marker being
moved when the sweep passes may not stop the sweep.
To disable the stop sweep at marker functions
press MARKER m or I’a::] .
In remote operation, the analyzer will not TALK until the trace sweep stops at the marker. TALK is suspended by
keeping the HP-IB Data Valid line not true until the marker is placed.
MARKER TO NEXT PEAK/MARKER TO MINIMUM
Successive peaks can be identified by continuously using[ K. If a trace displays many different signal levels, a
m can be used to find the largest signal. Thenm K can be used successively to find the next largest signal.
Example
Press @ to find largest signal.
@ K to find next largest signal.
I ! ! ! ! ! ! ! ! ! 1
Marker to Minimum
The minimum data value in a trace can be quickly located with B N.
Manual Operation 95

8/21/2019 analiz_espctros
http://slidepdf.com/reader/full/analizespctros 94/536
k2 m, n, o, p, g, h, w m KEY FUNCTIONS
GRATICULE AND ANNOTATION ON/OFF
The graticule and character readouts can be selectively blanked with key functions. This is valuable when alterna-
tive graphics are drawn on the CRT through the HP-IB.
Graticule
Blank: press [,,,, m
On: press B n
Annotation
Blank: press (,.,,, 0
On: press [,.,,, p
CRT BEAM ON/OFF
The CRT beam power supply can be turned off to avoid unnecessary wear of the CRT if the analyzer is operated
unattended. Reduci ng int ensi t y or blanking the traces does not reduce wear on the CRT
Beam off: press [,.,,, g
Beam on: press (,.,,,1 h
CRT beam power off does not affect HP-IB input/output of instrument function values or trace information.
DISPLAY CORRECTION DATA
The correction data generated from the error correction routine can be displayed.
Display correction data: press m w
Do not display correction data: press [)b:;IJ
The readout is detailed in this chapter under ERROR CORRECTION ROUTINE.
II -5, h” . . , ‘S n
CORRECTION DATA DISPLAYED
96 Manual Operation

8/21/2019 analiz_espctros
http://slidepdf.com/reader/full/analizespctros 95/536
KEY FUNCTIONS (,.lrll E, c, a, e, b, d
TITLE
The user can write a message in the top CRT display line. When the title is activated, the front panel blue
characters, number keyboard numbers, decimal, backspace, and space can be typed onto the top line starting at
the left of the display. The full width of the display can be used (total of 58 characters); however, marker readout
may interfere with the last 16 characters of the title.
Activate title:
Enter text:
To end a title:
(,,,, E (shift light on)
abcdefghijklmnopqrstuvwxyz
ABCDEFGHIJKLMNOPQRSTUVWXYZ
/4?L = () ,><
0123456789. [space]
press I--] (shift light off)
A title will remain on the display until the title function is activated again, la;l:] is pressed, or an instrument state is
recalled with @ .
To erase a title without changing the instrument state, end the title function if still active, then press EB.
A + B + A enables the restoration of the original trace A after a a has been activated. A + B + A is executed
with both Trace A and Trace B in [,,,, :
press m c.
When executed, m is turned off and the amplitude in trace B is added to the amplitude in trace A (in display
units) and the result is written into trace A.
Additional A + B * A executions will each add another trace B response to the cumulative trace A
TRACE DETECTION MODES
One of four detection techniques can be selected for displaying trace information.
Mode
normal
sample
Access
FULL SPAN key
o r [,,lrr a
me
Use
l Most measurements
l Noise Level measurements
0 Zero frequency span waveforms for sweep times
2 20 msec
l Video averaging
positive peak
negative peak
,.,,,jb
l Diagnostic aids for servicingmd
Manual Operation 9 7

8/21/2019 analiz_espctros
http://slidepdf.com/reader/full/analizespctros 96/536
(,,,,, a, e, b, d L% KEY FUNCTIONS
V i d e oSignal
Track
A I D C R TCOtlV~rtW Memory
_HoldDisplay
\
During a sweep, only a specified amount of time is available for writing data into each of the 1001 trace memory
addresses. In two of these time periods, the positive and negative peak detectors obtain the maximum and
minimum video signal excursions, respectively, and store these values in h rn t trace memory addresses. This
technique allows a graphic presentation of noise on the CRT display.
Normal Mode
In normal mode, a detection algorithm selectively chooses between the positive and negative peak values to be
displayed. The choice is made dependent upon the type of video signal present.
Data from the positive peak detector (signal maximums) will alway be displayed in the odd-addressed trace
memories (1, 3, . . . 1001). If, within the time period following the storage of a value in an odd-addressed memory, there is no change in video signal level, the positive peak detector value will also be stored in the even address. Inother words, the even-addressed memory will also contain positive peak detection data if the signal during that
time period is monotonic. Negative peak detector data (video signal minimum) will be stored in the even-
addressed trace memory if the signal has a point of inflection during the time period.
Normal mode is selected with instrument preset.
Sample Mode
In the sample mode, the instantaneous signal value of the final analog-to-digital conversion for the time period is placed in memory. (As sweeptime increases, many analog-to-digital conversions occur in each time period, but
only the final, single value can be stored.)
Sample mode is selected automatically for video averaging and noise level.
Positive and Negative Peak Modes
Positive and negative peak modes store signal maximums and minimums, respectively, in all trace memories.
98 Manual Operation

8/21/2019 analiz_espctros
http://slidepdf.com/reader/full/analizespctros 97/536
m KEY FUNCTIONS
Readout
Here, the same signal response is displayed with each trace detection mode.
NORMAL
POSITIVE PEAK
TRACE C
k Yd j, k, I
SAMPLE
NEGATIVE PEAK
A third trace memory is available for the storage and display of trace information. Only the storage modes (view
and blank) can be used.
View C: ,,,1 j
BlankC: ,,, k
These are analogous to the TRACE A and B modes discussed in Chapter 5.
Trace C cannot be written into directly from the analyzer except when video averaging is used.
Trace information from B can be transferred to C. To transfer from TRACE B to TRACE C, use
B-,C: B b
Manual Operation 99

8/21/2019 analiz_espctros
http://slidepdf.com/reader/full/analizespctros 98/536
(,,,,1 i, I, B, j, m KEY FUNCTIONS
The sweep will be suspended, the trace in memory B will be read and written into trace C from left to right in about
20 msec. Trace C is viewed. Sweeping will then resume from where suspended. The trace information in B is not
changed.
To exchange traces B and C
The trace information in B and C is interchanged point for point from left to right in about 20 msec. If trace B is not
displayed, it remains undisplayed. If trace C is not displayed, it remains undisplayed.
To store TRACE A into trace C. the trace A data must first be transferred into trace B:
press m (I*(rl 1 (which also erases last trace C)
or press m (,.,,,1 i (which also saves last trace C in B)
Example
Comparisons of up to three different signal traces can be made simultaneously using traces A, B, and C. In this
example, the modulation level of a signal will be changed for each trace. To start, clear the display with (,,,, A
and [,,,., B.
The signal with the desired level of modulation will be
stored in trace C:
Press m B and allow one sweep.
Press (,,,, 1 which writes the trace from B into C.
Change the modulation level, allow one sweep and
store in B with m B.
To view C, pressm j.
100 Manual Operation

8/21/2019 analiz_espctros
http://slidepdf.com/reader/full/analizespctros 99/536
aKEY FUNCTIONS m A, ‘2, H
Change the modulation level again and press m A,
and store with (,,,. A. The three traces are differenti-
ated by intensity.
.
VIDEO AVERAGING
Video averaging is a trace display routine that averages trace responses from sweep to sweep without requiring a
narrow video bandwidth. (Averaging with the video bandwidth is discussed in Chapter 8, COUPLED FUNCTION
m .) Both video averaging and reducing video bandwidth are primarily used to improve the analyzer’s ability to
measure low-level signals by smoothing the noise response.
To activate video averaging (and sample detection mode),
G
press (z] [??I (DATA keyboard entry)
H
To disable video averaging, press (,, @
CAUTION
Video averaging may result in an uncalibrated amplitude display when
frequency span
Resolution Bandwidth> 1000
Readout in the active function display area is “VID AVG 100”. The number represents the maximum number of
samples (or sweeps) for complete averaging. The DATA entry can be used to change the maximum sample
number in integers from 0 to 1000. A unity sample limit allows direct writing of analyzer response into Trace C (see
Trace C below). A 100 sample limit is selected upon instrument preset. The higher the sample limit, the more
smoothing possible. Averaging with high sample limits can provide more smoothing than the 1 Hz video band-
width.
During video averaging, the current sample being taken is read out at the left of the display.
Manual Operation 101

8/21/2019 analiz_espctros
http://slidepdf.com/reader/full/analizespctros 100/536
@GI”;; KEY FUNCTIONS
The advantage of video averaging over narrowing the video filter is the ability of the user to see changes made to
the amplitude or frequency scaling of the display while smoothing the noise response. For example, when a 100
Hz video bandwidth is used with a 200 kHz frequency span, the sweeptime is 2 sec. Almost a full sweeptime
duration would have to pass before any center frequency change effect on the trace could be seen. If video
averaging is used instead of the narrow video bandwidth, any change to center frequency will be seen immedi-
ately, even though full averaging will take roughly 6 sec. (Any change to control settings such as CENTER
FREQUENCY FREQUENCY SPAN, etc., will cause the video averaging process to be restarted.)
Example
To display very low-level signal responses, very narrow resolution and video bandwidths are required. The accom-
panying increase in sweep time can make measurements cumbersome. Video averaging allows the display of low-
level signals without the long sweep time.“P
RD = -13.1 de* .TTEN 18 dB10 dW
Viewing a low-level signal with a video bandwidth of 1
Hz requires a 150-second sweep.
Disable the narrow video filter by pressing the (wr(ll
key that is above the m key.
Start video averaging by pressing (,.,,, h
Now the low-level signals begin to show quickly.
Changes to the frequency range or amplitude scale
will restart the sampling to show the signals quickly,
without having to wait 150 seconds. In fact, the video
averaging shown took 42 x 300 msec = 12.6 sec.
Video Averaging Algorithm
The averaging of each amplitude point depends upon the number of samples already taken and last average
amplitude.
n-l _Y”=y
1’ Y(n-l) +TYn
102 Manual Operation

8/21/2019 analiz_espctros
http://slidepdf.com/reader/full/analizespctros 101/536
bt KEY FUNCTIONS tY.L k, G, x, y, (, )
where Fn latest average amplitude value in display units
n current sample number
Tn _ 1 last average amplitude in trace memory (TRACE A or B)
yn new amplitude entry from analyzer (Trace C)
The new amplitude value, yn, is weighted more heavily by the last average amplitudeij, _ 1 than the newamplitude entry, yn.
When n equals the limit set (e.g. 100, the preset limit), the last average amplitude is gradually replaced with new
data. Thus, the average will follow a slowly changing signal response, particularly if the sample limit is small.
Trace C
Video averaging requires the use of trace memory C. When video averaging is activated, the input signal response
is written into trace C, the averaging algorithm is applied to these amplitudes and the results written into TRACE A.
Thus, two traces are displayed: the input signal in C and the averaged signal in A.
Trace C may be blanked without affecting the operation of video averaging.
Press (,,rl) k
Trace C may be written into as traces A and B if a video average sample limit of one is selected.
If either trace A or B is in a write trace mode, the analyzer response will also be written into trace C.
EXTERNAL AND VIDEO TRIGGER
The front panel (.,l and m trigger modes automatically keep the display refreshed in zero frequency spans for
sweeptimes less than 20 msec. To eliminate the automatic refresh feature:
X
For external triggering: Press B 1111
For video triggering: Press (,,,, b
LOCKING SAVE REGISTERS
After saving instrument states in one or more of the six registers, 1 through 6, the registers can be secured from
being written over and destroyed. The recall function is not affected.
L o c k : m (m
Unlocked: m &j
When locked, an attempt to [,,, will write “SAVE LOCK” on the CRT and no DATA entry can be made.
Manual Operation 10 3

8/21/2019 analiz_espctros
http://slidepdf.com/reader/full/analizespctros 102/536
l2Ylw,x,yw
ERROR CORRECTION ROUTINE
i KEY FUNCTIONS
A built-in analyzer routine measures and records the amplitude and frequency error factors due to a number of
parameters, then corrects the display for them. The routine takes about 30 seconds to run. When complete,
instrument preset will be called and the correction factors applied.
Connect CAL OUT to RF INPUT
Execute the routine: @J W
Use correction factors: (,., X
Do not use correction factors: (,,,, Y
Display correction factors: B w
If “ADJUST AMP’TD CAL” appears on the CRT manual calibration adjustment is necessary before the routinecan be successfully run. See GENERAL INFORMATION for the manual calibration procedure.
Indicates that the routine has been run and the display
is corrected.
t i I i i
I i i I
I i 1
Correction can be turned on or off using m X and (,.,,, Y after the routine has been successfully completed.
See DISPLAY CORRECTION DATA in this chapter.
For more information on accuracy, see the 8566B Spectrum Analyzer Data Sheet.
104 Manual Operation

8/21/2019 analiz_espctros
http://slidepdf.com/reader/full/analizespctros 103/536
m KEY FUNCTIONS ERROR CORRECTION ROUTINE
The readout of the correction factors is as follows:
Line
1
2
3
45
6
7
8
9
10
11
12
13
14
15
16
17
18
1920
21
22
23
24
25
26
27
28
29
30
31
Parameter
LOG and LIN scale
(Res BW L 100 kHz)
10 dB/
5 dB/
2 dB/LOG SCALE
1 dB/
3 MHz
1 MHz
300 kHz
100 kHz
30 kHz
10 kHz RESOLUTION
3 kHz BANDWIDTH
1 kHz
300 Hz
100 Hz
30 Hz
10 Hz
LOG and LIN scale
(RES BW <lOO kHz)
A20A10
SG 20-2
SG 20-l STEP GAINS
SG 10
LG 20
LG 10
20 dB
30 dB
40 dB INPUT
50 dB ATTENUATOR
60 dB
70 dB
Correction Values Displayed
Amplitude offset error between log and lin-
ear scale. Reference at 1 dB log.
Amplitude errors due to changing log scale.
Reference to - 10 dBm CAL OUTPUT
signal.
Amplitude errors due to switching band-
widths. Reference to 1 MHz resolution
bandwidth.
Frequency offset errors due to center fre-
quency tuning inaccuracies of resolution
bandwidth.
Same as line 1.
Amplitude error due to changing IF step
gain. Reference to - 10 dBm REFER-
ENCE LEVEL.
Amplitude error due to switching attenua-
tor. Reference to 10 dB Attenuator posi-tion.
The total amplitude correction value composed of linear/log scale offsets, bandwidth errors, and attenuator errors
can be output to a computer/controller with KS91. This error can then be corrected with software to yield a more
accurate amplitude measurement.
Correction values are stored in memory for a 30-day period in the event of power-line failure.
Manual Operation 105

8/21/2019 analiz_espctros
http://slidepdf.com/reader/full/analizespctros 104/536
i KEY FUNCTIONS
FASTPRESET/HP-IB
i2d T, U, S,R,t, Q, U, u
A partial instrument preset can be initiated with [,,,, T or B U. These key functions operate essentially the
same as the @ instrument preset in that a specific full span is set, functions automatically coupled, and shift
functions turned off. The difference is that the fast presets do not exercise the instrument’s internal self-test routine,
which controls the two check LEDs and, as a result, can be executed much faster.
Fast preset 2 - 22 GHz: press @ T
Fast preset external mixer: press (1*(rrl U
Under remote operation, an HP-IB operation mode can be set which allows the analyzer to operate faster than
normal. The Fast HP-IB mode is enabled with a [,.,rl S. A m instrument preset will disable the Fast HP-IB
mode, whereas the Fast presets will not disable the Fast HP-IB mode.
Fast HP-IB: press [,.,,, S
BAND LOCK
If desired, the analyzer can be locked on a selected frequency band (local oscillator harmonic number). In normal
operation, pressing the CENTER FREQUENCY key enables the analyzer to be tuned with one of the tuning
controls from 0 to 22 GHz ( - 1 to 24 GHz over-range). Executing a band lock limits the analyzer’s tuning range to
the selected harmonic number.
To execute band lock, B R (Diagnostics On) and the tuning controls can be used to display the harmonic
numbers. [,,,, t locks the frequency range to the desired harmonic number.
Band lock: (-II t
Band unlock: [,.,,, Q or FULL SPAN key
EXTERNAL MIXER
Two shift functions are available to specific usage with an external mixer. Shift U selects an LO tuning range for
external mixer operation. Shift v enables a signal identifier routine which uses the marker to automatically identify
the signal under observation.
Fast preset external mixer: B USignal identifier external mixer: [,.,,11 v
106 Manual Operation

8/21/2019 analiz_espctros
http://slidepdf.com/reader/full/analizespctros 105/536
(,,.r KEY FUNCTIONS T”r;i FUNCTION INDEX
WIFT FUNCTION Index
All the shift functions are listed below. (DATA) indicates the functions that use a number and unit entry.
CODE PAGE
GENERAL
Display Address (DATA)Display Write (DATA) fHP-IB service requestHP-IB address (DATA) ;Fast HP-IB operation SPower on in last state f Mixer input level
FREQUENCY AND AMPLITUDE ’
Amplitude offset ZAmplitude units selection
dBm AdBmV B
dB/.# Cvoltage D
Removes IF Offset for FYTO pretest
Extended reference level Irange (DATA)
Frequency offset (DATA) VSignal identifier external V
mixer Mixer level Negative entry (DATA) -
MARKER
Marker to next peak K Marker to minimum NEnter A + Span 0
Noise Level on M Noise Level off LStop single sweep at marker U
Factory preselector setting =
Manual preselector setting /
DISPLAY
Annotation blanked 0
Annotation onCRT beam off CRT beam on
Graticule blankedGraticule onTitle
P
:
m
;.
*
*
*
*
10 6
8 5
9 3
91
9 3
9 3
9 39 3
APP. H
94
91
1 0 6
9 3
91
9 5
9 5
5 3
5 8
5 8
9 5
9 4
9 4
9 6
TRACE
A + B - ADetection Modes:
normal positive peak negative peak sampleTrace C
blank C
BzCB - Cview CVideo averaging onVideo averaging off
k
9 6
9 6
9 6
9 69 6
9 7
9 7
9 7
9 7
9 7
9 7
9 9
1 009 9
9 9
101
101
TRIGGER. ZERO SPAN. SWEEP <20 msec
1111 without 25 msec trigger m without 25 msec trigger
INSTRUMENT STATE
Save Registers lockedSave Registers unlockedFast preset 2 - 22 GHzFast preset external mixer Band lock Band unlock
ERROR CORRECTION
Execute RoutineUse data (display corrected)Do not use data (display
not corrected)Display correction data
on CRT
X
Y
’T
U
;
WXY
W
1 0 3
103
1 0 3
1 0 3
1 0 6
1 0 6
1 0 6
1 0 6
1 0 4
1 04
1 0 4
1 0 4
DIAGNOSTIC AIDS
To aid in servicing the spectrum analyzer, there are a
number of diagnostic shift functions. These functions
are listed here. Their operation and use are covered in
the HP 8566B Service Manual.
CODE
l See Section II of this manual
Frequency diagnostic onDisable step gainManual DACS controlDisplay correction dataTurns off YTX self-heating
correction
R
:
W
#
Manual Operation 107

8/21/2019 analiz_espctros
http://slidepdf.com/reader/full/analizespctros 106/536
USER DEFINED KEYS ENTERING A COMMAND LIST
Chapter 12
USER DEFINED KEYS
GENERAL DESCRIPTION
This chapter describes the procedure for defining a numeric key(s) to allow the storage and execution of a list of
commands. The procedure for remote storage and execution of command lists is contained in Section II of this
manual.
ENTERING A COMMAND LIST
The title mode must be activated to enter a command list. When the title mode is activated, the front panel blue
characters, numeric keys, decimal, backspace, and space can be entered onto the top line starting at the upper left
corner of the display. The full width of the display can be used (58 characters total).
Activate title: B E (shift light on)
Enter command list: CFlOOMZSP2MZST50MS (up to 58 characters)
T xcenter frequency = 100 MHz
iscan time = 50 msec
frequency span = 2 MHz
To end a command list: @ (shift light off)
KEY DEFINITION
After a command list is entered into the title block, it is stored under a defined numeric key(s).
Press:
Select any numeric key(s) (0 - 999) :
Terminate by pressing:
m (shift light on)
10 (shift light off)11 1
”.I.(
NOTE
The {{c key must be pressed to terminate the key definition procedure. If it is not, the
command list will not be stored under the numeric key(s).
Manual Operation 10 9

8/21/2019 analiz_espctros
http://slidepdf.com/reader/full/analizespctros 107/536
EXECUTING A SOFT KEY USER DEFINED KEYS
EXECUTING A SOFT KEY
After a command list is stored under a numeric key(s), it can be executed
Press:
Enter defined numeric key(s) :
Terminate by pressing:
(,,,, (shift light on)
10 (shift light off)
*r ICm <
NOTE
The z. key must be pressed to terminate this execution procedure. If it is not, the
command list will not be executed.
1 10 Manual Operation

8/21/2019 analiz_espctros
http://slidepdf.com/reader/full/analizespctros 108/536
PLOTTER OUTPUT EXECUTING PLOTTER OUTPUT
Chapter 13
PLOTTER OUTPUT
GENERAL DESCRIPTION
This chapter describes the procedure for executing the PLOTTER OUTPUT function, and provides information
for preventing problems that may arise while attempting to execute it.
EXECUTING PLOTTER OUTPUT
Connect an HP plotter via HP-IB to the spectrum analyzer:
Set the HP-IB address on the plotter to address 5:
16 8 4 2 1
4+1=5
ADDRESS
If the address switch on the plotter cannot be located, refer to the plotter’s operation manual.LOWER
LEFT
Press the lower left recorder keya
0 to execute the PLOTTER OUTPUT function.
The function plots everything that is displayed on the CRT If desired, traces A, B, and C, the annotation and the
graticule can be individually blanked from the CRT using front-panel functions (refer to Chapters 5 and 11).
Manual Operation 1 1 1

8/21/2019 analiz_espctros
http://slidepdf.com/reader/full/analizespctros 109/536
PLOTTER PENS
You can also blank the HP logo from the display. To do this from a computer, execute:
PLO-lTER OUTPUT
OUTPUT 718; “DA 2174; DW 32;32;”
Or, to execute it from the front panel, press:
PLOTTER PENS
Traces A, B, and C, and the annotation and graticule are individually plotted with four different pens, provided
there are four pen locations in the plotter. Pens 1, 2, and 4 plot traces A, B, and C, respectively, and pen 3 plots
the annotation and graticule. For a two-pen plotter, pens 1 and 2 take the place of pens 3 and 4, respectively.
NOTE
There are certain types of equipment that prevent the PLOTTER OUTPUT functionfrom being executed correctly. They are discussed in the next two sections.
CONTROLLER
The analyzer should not be connected via HP-IB to an active controller while attempting to execute the PLOTTER
OUTPUT function from the front panel. This is because the analyzer will abort any attempts to execute the
function from the front panel when an active controller is on the bus.
PLOTTER
The 7245A/B, 7240A, 9872C, and 7550 Graphics Plotters work readily for executing the PLOTTER OUTPUT
function. However, the HP 757OA, 7585, 7470A, and 7475A plotters require special operating instructions. The
HP 7570 and 7585 plotters work only in EMULATE MODE. For more information on EMULATE MODE, refer to
the plotter’s operating manual. On the HP 7470A plotter, set the US/A4 rocker switch to the US position. For the
HP 7475 plotter, the US/MET and A4/A3 rocker switches must be set to the US and A4 positions.
112 Manual Operation

8/21/2019 analiz_espctros
http://slidepdf.com/reader/full/analizespctros 110/536
SectionProgramming
FUNCTIONAL INDEXPROGRAMMtNG COMMANDSPROGRAMMiNG NOTES

8/21/2019 analiz_espctros
http://slidepdf.com/reader/full/analizespctros 111/536
This section describes remote operation of the spectrum analyzer.
The Functional Index contains all the remote commands arranged by functions.
The Programming Command section describes operation of the commands, which are listed in alphabetical order.
The appendixes at the end of this section contain useful information:
Appendix A describes the contents of the spectrum analyzer display memory.
Appendix B contains programming techniques for custom graphics.
Appendix C lists the learn string contents.
Appendix D describes the service request commands and their use.
Appendix E explains how to increase execution speed of analyzer programs.
Appendix F contains a graph of the analyzer tuning curves.
Appendix G describes how the spanwidth is automatically adjusted when the analyzer is tuned near the edge
of its band.
Appendix H explains how to use the first LO output as a tunable microwave source.
Appendix I describes some differences of operation between the HP 8566A and HP 8566B.
Appendix J lists new HP 8566B commands and original HP 8566A commands that function identically.
Programming 1

8/21/2019 analiz_espctros
http://slidepdf.com/reader/full/analizespctros 112/536
REMOTE OPERATION OVERVIEW
The standard HP 8566B Spectrum Analyzer with an HP-IB controller allows:
Remote operation of the analyzer front panel functions, including the shift key functions.
Output of any analyzer function value or trace amplitude. See individual commands, including OL. SeeAppendix C.
Input of special CRT display labels and graphics. See TRGRPH, LB, GR, TEXT, KSE, and DSPLY com-
mands.
Interrupt of controller for service or data transfer. See Appendix D.
Creation of custom soft key functions. See KEYDEE KEYEXC, FUNCDEF, 16 KSC, and REPEAT com-
mands.
Creation of custom command language using flow-of-control commands. See FUNCDEE IF and REPEAT
commands.
Creation of user-defined variables. See VARDEF command.
To set the center frequency to 4.621 GHz and the span to 10 MHz:
OUTPUT 7 18; “IF’; CF 4 .621GZ:
select HP-IB
rr-22::~::::activate center frequency
-
set center frequency value
optional spaces Inserted for clarity’
activate frequency span
set frequency span value
- -S F 10MZ; ”
hppWiF 0.0 ciF 0.0 c ATTW I. aTTW I. a
1. a,. a,
2 P r o g r a m m i n g

8/21/2019 analiz_espctros
http://slidepdf.com/reader/full/analizespctros 113/536

8/21/2019 analiz_espctros
http://slidepdf.com/reader/full/analizespctros 114/536
Input CRT Labels and Graphics
To write “Center Frequency” in the top center of the graticule area:
def ines label terminator ‘. T-m
required delimiter
y positlon
The following ASCII characters are a label
Text
Label terminator Reacttvates center frequency
I I I I LA L1 I,.ENTER 4.621 6 O*I WW 16.6 W
.nE\ m 1.6 LHI VI* 3” *m SW’ 26.6 -..c
HP-IB Controller
Any HP-IB compatible controller can be used to operate the HP 8566B. The overall system measurement speed
and capability depend to a large extent on the computing, storage, and interrupt capabilities of the controller.
The HP Series 200 Desktop Computers, HP Models 16, 26, and 36, are the computing controllers in this manual.
4 P r o g r a m m i n g

8/21/2019 analiz_espctros
http://slidepdf.com/reader/full/analizespctros 115/536
Addressing the Spectrum Analyzer
Communications between instruments via HP-IB require that a unique address be assigned to each instrument.
The analyzer address, preset at the factory to 18, appears on the CRT display when the LINE power is turned
from STANDBY to ON.
L.-------- _________ L ________ ev’ce_c_od_e ---- ---1 Address Readou t
Two formats are available for addressing an HP-IB instrument or device. One command format uses separate
addresses for TALK (“R”) and LISTEN (“2”). The other uses only a bus address (“18”) to designate the recipient of
the command.
In all examples, the preset address of the HP computing controller is HP-IB SELECT CODE “7”
0 : O U T P U T 7 183
1 Tna’yzer comman~~;~~;;;
P r o g r a m m i n g 5

8/21/2019 analiz_espctros
http://slidepdf.com/reader/full/analizespctros 116/536
The read/write address of the HP 8566B can be changed from the front panel or via HP-IB by using the shift
function I?
Pressing [,.,, b. Q a @ sets the address to 18.
To set the address to 8, press (,,,,b (TJ @.
From the controller, the address can be set to 8 via HP-IB:
O U T P U T 7185”ESF’ 8 H Z ; ’
code for XFJ h address 7 t e r m i n a t o r
As long as the analyzer internal battery has power, the analyzer address remains unchanged. (Battery lasts one
year.)
In addition to these features, an internal switch can be set which changes the default address at Power Up.
Call your nearest HP service office for more information.
Remote/Local Operation
If the controller has addressed the analyzer to TALK or LISTEN, the ADRS’D indicator lights. When the analyzer is
addressed with an HP-IB device command, the analyzer will go to remote, and the REM indicator also lights.
ADRS ’D
0 REM
? 0
Remote operation generally prevents front pane1 control of the analyzer except by those functions not programma-
ble: LINE power, calibration and display adjustment, and video trigger level.
Return to front panel, or local control by pressing @ , or executing a local device command from the controller
such as
LOCAL 718.
6 P r o g r a m m i n g

8/21/2019 analiz_espctros
http://slidepdf.com/reader/full/analizespctros 117/536
CAUTION
An HP-IB transmission may be disrupted if the analyzer LINE power is cycled. An
analyzer should be connected to an operating HP-IB only with POWER ON.
Similar HP-IB disruption may result from pressing @ when the HP-IB is active.
Thus, a local lockout is recommended during HP 8566B automatic operation.
After analyzer power-on, wait 5 seconds before addressing it.
Shift Function Codes
Programming a shift function requires a code sequence similar to the manual procedure for activating a shift
function; that is, press (,,,,, , then press the key with the function’s code (the front panel blue character).
For example, to select the video averaging shift function, blue code G, execute
-)1_jTF:“[JT’ 71.H; “t:.:::jG; ”
HP-16 Data Command
cllvates shift
activates wdeo averaglng
About half of the shift key function codes require ASCII lower case letters or symbols. Spaces are not allowed
between the shift command, “KS” and the shift function, in this case “G”.
Programming 7

8/21/2019 analiz_espctros
http://slidepdf.com/reader/full/analizespctros 118/536
Data Entry Via HP-IB
A data entry through the HP-IB must meet the same requirements as a front panel DATA entry. It must have a
number (value) and a message that terminates the entry, signaling the analyzer to assign the function value.
The number code within the quote field must be a string of (ASCII) decimal numbers plus an optional decimal
point. It may be preceded by a minus or plus sign. If the decimal is not included in the entry, the decimal point is
assumed to be at the end of the number. Either fixed or floating point notation may be used to make number
entries. For example, the entries “123E6”, “12.3e6” and “12300000” each enters the same number. Exercise
caution when using the “E” exponent format, since several marker command mnemonics also begin with E.
The number of significant digits accepted and stored by the analyzer is dependent upon which function is active.
For example, an entry of 11 significant digits for center frequency can be stored in the analyzer’s center frequency
register.
If no number is entered, a “1” is assumed.
Terminating the Data Entry
The units code is the most common data entry terminator. It sets the value units and enters the function value.
UNIT CODES
Frequency Code
HZ HZ
kHz KZ
MHz MZ
GHz GZ
Power
dBm
- dBm
dB
Code
DM
- D MDB
Voltage
mV
PV
Code
MV
UV
Time
set
msecpet
Code
SC
MS
US
Other than the units codes, some ASCII codes can be used to terminate a data entry.
ASCII Codes Which Terminate a Numeric Data Entry
Symbol NameDecimal Equivalent
(ASCII)
ck
LF
ETX
commacarriage return
line feed
semi-colonend of text
44
13
10
5 9
3
8 Programming

8/21/2019 analiz_espctros
http://slidepdf.com/reader/full/analizespctros 119/536
These non-unit code terminators originate in the controller’s language.
A terminated entry without a units code defaults to the fundamental units for the function activated. The default
units of power depend upon the amplitude readout units selected.
Default Units
Frequency HZPower dBm, dBmV dBpV or dB
Voltage voltsTime seconds
Front-Panel Data Entry During Remote Control
Data may also be entered from the front panel when the analyzer is in remote control. This is done by following the
analyzer command with the secondary keyword, El? The syntax diagrams show which comands can be followed
by EI? EP pauses program operation until data is entered from the front panel and terminated with one of the units
keys listed in the Units Code table. Program operation then resumes. EP is especially useful when it is part of a
programming routine that is stored in a soft key.
Custom Soft key Functions
The spectrum analyzer has soft keys that can be loaded into up to 16K bytes of memory, with or without a
controller. These soft keys remain in nonvolatile memory for the life of the internal battery, which lasts for one year.
The functions of the soft keys are defined with the KEYDEF command. The original contents of a soft key are
erased when the key is defined a second time with the KEYDEF command, or when the DISPOSE command is
executed.
The soft keys can be executed four ways. To execute a soft key remotely, execute the KEYEXC command, or
define the soft key as part of a user-defined function. Then, whenever the function name is encountered, the soft
key is executed. (See FUNCDEF command.) Soft keys can also be nested inside another soft key. Thus, executing
one key actually can cause the execution of several keys.
To manually execute a soft key from the front panel, pressm , the key number, and then press ’ .
Programming 9

8/21/2019 analiz_espctros
http://slidepdf.com/reader/full/analizespctros 120/536

8/21/2019 analiz_espctros
http://slidepdf.com/reader/full/analizespctros 121/536

8/21/2019 analiz_espctros
http://slidepdf.com/reader/full/analizespctros 122/536
MKTYPE Sets marker type*MT0 Turns off marker signal track
MT1 Turns on marker signal track *Ml Turns off active marker
MM3
Turns on active marker and moves it to center screenTurns on delta marker
M4 Turns on marker zoom
COUPLING CONTROL‘CA*CR* c s*CT* c v*VBO
Couples input attenuationCouples resolution bandwidthCouples step sizeCouples sweep timeCouples video bandwidthSpecifies coupling ratio of video bandwidth and resolution bandwidth
PRESELECTOR CONTROL
FPKA Performs fast preselector peak and returns measured valueof active marker
KSJ Allows manual control of DACKS/# Turns off YTX self-heating correction
KS/ Allows manual peaking of preselector KS= Selects factory preselector settingPP Peaks preselector
EXTERNAL MIXING COMMANDS
CNVLOSS
EXTMXR
FULBANDHNLOCK
HNUNLK
I DSTAT
Selects the reference level offset to amplitude calibrate thedisplay for a mixer with a given conversion loss. Defaultunits are dB.Performs an external mixing preset. Start frequency 18GHz; Stop frequency 26.5 GHz.Sets the start and stop frequencies for full waveguide bands.Locks to the specified harmonic number to prevent multi-harmonic sweeps and to prevent tuning past the 2 to 6.2GHz L.O. tuning range.
Turns off the harmonic lock (see HNLOCK) allowingtuning over the entire analyzer input range.Returns the completion status of the signal identifier.Query response : 1 signal found
0 no signal found-1 signal found but cannot be reached on
locked harmonicKSQ
KSt
KSU
KSv NSTART NSTOPSIGDEL
Turns off the harmonic lock (see HNLOCK) allowingtuning over the entire analyzer input range.Locks to the specified harmonic number to preventmulti-harmonic sweeps and to prevent tuning past the2 GHz to 6.2 GHz L.O. tuning range.Performs an external mixer preset. Start frequency 18GHz; Stop frequency 26.5 GHz.Identifies signals for the external mixing frequency bands.Specifies the start harmonic for signal identification.Specifies the stop harmonic for signal identification.Specifies the maximum amplitude difference allowed
between a signal and its image for the pair to berecognized by the signal identification routine.Default units are dB.
SIGID Identifies signals for external mixing frequency bands.
Programming 13

8/21/2019 analiz_espctros
http://slidepdf.com/reader/full/analizespctros 123/536

8/21/2019 analiz_espctros
http://slidepdf.com/reader/full/analizespctros 124/536

8/21/2019 analiz_espctros
http://slidepdf.com/reader/full/analizespctros 125/536
TRPRST Sets trace operations to preset valuesTRSTAT Returns current trace operationsTWNDOW Formats trace information for fast fourier analysis (FFT)VARIANCE Returns amplitude variance of trace
USER-DEFINED COMMANDS
*DISPOSE
FUNCDEF
KEYDEF
KEYEXC MEM
ONEOSONSWPTRDEFTRMATH
USTATE
*VARDEF
Frees memory previously allocated by userdefined func-tions. Instrument preset disposes ONEOS, ONSWP, andTRMATH functions.Assigns specified program to function labelAssigns function label or command list to softkeynumber (See FUNCDEF)
Executes specified softkey
Returns amount of allocatable memory available for user-defined commandsExecutes specified command(s) at end of sweepExecutes specified command(s) at start of sweepDefines userdefined trace name and lengthExecutes specified trace math or user-operator com-mands at end of sweepConfigures or returns configuration of user-definedstate: ONEOS, ONSWP, TRMATH, VARDEF, FUNC-
DEF, TRDEFDefines variable name and assigns real value to it. Presetreassigns initial value to variable identifier.
PROGRAM FLOW CONTROL
IF
THEN
ELSE
ENDIFREPEAT
UNTIL
Compares two specified operands. If condition is true, exe-cutes commands until next ELSE or ENDIF statements arecountered
No-operation functionDelimits alternate condition of IF commandDelimits end of IF commandDelimits the top of the REPEAT UNTIL looping constructCompares two specified operands. If condition is true, com-mands are executed following this command. If condition is
false operands are executed following the previous REPEATcommand.
MATH FUNCTIONS
ADD Operand I + operand 2 into destination
AVG Operand is averaged into destinationCONCAT Concatenates two operands and sends new trace to destina-
tionCTA Converts operand values from display units to vertical
measurement unitsCTM Converts operand values from vertical measurement
units to display unitsDIV Operand / operand 2 into destinationEXP Operand is divided by specified scaling factor before being
raised as a power of IOLOG LOG of operand is taken and multiplied by specified scaling
factor MIN Minimum between operands is stored in destinationMO V Source is moved to destinationMPY Operand 1 x operand 2 into destinationMXM Maximum between operands is stored in destination
SQR Square root of operand is stored in destinationSUB Operand I - operand 2 into destination
XCH Contents of the two destinations are exchanged
Operations on specific traces (A, B, and C) can be found in the Trace Math sec-tion.
16 Programming

8/21/2019 analiz_espctros
http://slidepdf.com/reader/full/analizespctros 126/536

8/21/2019 analiz_espctros
http://slidepdf.com/reader/full/analizespctros 127/536

8/21/2019 analiz_espctros
http://slidepdf.com/reader/full/analizespctros 128/536
PROGRAMMING COMMANDS
All the commands in this section are immediately executed.
Command syntax is represented pictorially. All characters enclosed by a rounded envelope must be entered
exactly as shown.
Words enclosed by a rectangular box are names of items also used in the command statement. These items are
described in the table below, and are also described in the tables below the syntax diagrams for each command.
Statement elements are connected by lines. Each line can be followed in only one direction, as indicated by the
arrow at the end of the line. Any combination of statement elements that can be generated by following the lines in
the proper direction is syntactically correct. An element is optional if there is a path around it. Optional items
usually have default values. The table or text following the diagram specifies the default value that is used when an
optional item is not included in a statement.
In the diagrams, narrow ovals surround command names. Circles and wide ovals surround secondary keywords,
or special numbers and characters.
Command Statement Elements Enclosed in Rectangular Boxes
A-Block Data Field
Average Count
Average Length
Carriage Return
Character
Command List
Data Bytes
Display Address
END
ETX
Absolute block data field consisting of , A, Length, and Command List.
Integer representing counter value.Default value is current counter value.
Integer representing maximum number of sweeps executed for computing aver-age.
Asserts carriage return. (ASCII code 13.)
Represents text displayed on screen. (ASCII codes 32 through 126.)
Alphanumeric character comprising any spectrum analyzer command. (ASCIIcharacters 0 through 255.)
&bit bytes representing command list.
Integer signifying 1 of 1008 elements (display units) of trace A, B, or C.Trace A comprises addresses PI through 1023.Trace B comprises addresses 1024 through 2047.Trace C comprises addresses 3072 through 4095.
Ends program.
Marks end of text. (ASCII code 3.)
Programming 19
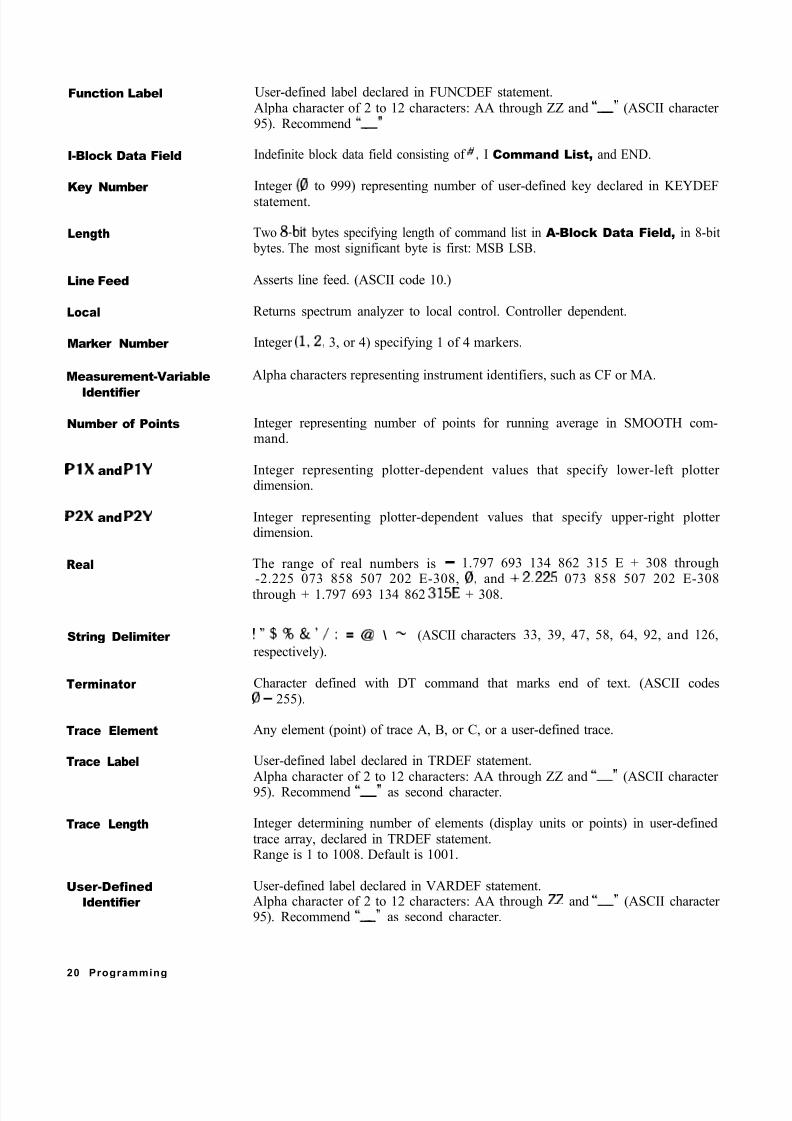
8/21/2019 analiz_espctros
http://slidepdf.com/reader/full/analizespctros 129/536
Function Label
I-Block Data Field
Key Number
Length
Line Feed
Local
Marker Number
Measurement-Variable
Identifier
Number of Points
PlX and PlY
P2X and P2Y
Real
String Delimiter
Terminator
Trace Element
Trace Label
Trace Length
User-Defined
Identifier
User-defined label declared in FUNCDEF statement.Alpha character of 2 to 12 characters: AA through ZZ and “-” (ASCII character 95). Recommend “-”
Indefinite block data field consisting of , I Command List, and END.
Integer (0 to 999) representing number of user-defined key declared in KEYDEFstatement.
Two 8bit bytes specifying length of command list in A-Block Data Field, in 8-bit bytes. The most significant byte is first: MSB LSB.
Asserts line feed. (ASCII code 10.)
Returns spectrum analyzer to local control. Controller dependent.
Integer (1,2, 3, or 4) specifying 1 of 4 markers.
Alpha characters representing instrument identifiers, such as CF or MA.
Integer representing number of points for running average in SMOOTH com-mand.
Integer representing plotter-dependent values that specify lower-left plotter dimension.
Integer representing plotter-dependent values that specify upper-right plotter dimension.
The range of real numbers is - 1.797 693 134 862 315 E + 308 through-2.225 073 858 507 202 E-308, 0, and +2.225 073 858 507 202 E-308
through + 1.797 693 134 862 315E + 308.
“ % &‘/: = @ \ - (ASCII characters 33, 39, 47, 58, 64, 92, and 126,
respectively).
Character defined with DT command that marks end of text. (ASCII codese, - 255).
Any element (point) of trace A, B, or C, or a user-defined trace.
User-defined label declared in TRDEF statement.Alpha character of 2 to 12 characters: AA through ZZ and “-” (ASCII character 95). Recommend “-” as second character.
Integer determining number of elements (display units or points) in user-definedtrace array, declared in TRDEF statement.Range is 1 to 1008. Default is 1001.
User-defined label declared in VARDEF statement.Alpha character of 2 to 12 characters: AA through ZZ and “-” (ASCII character 95). Recommend “-” as second character.
20 Programming

8/21/2019 analiz_espctros
http://slidepdf.com/reader/full/analizespctros 130/536
Variable Identifier User-Defined Identifier declared in VARDEF statement.Alpha character of 2 to 12 characters: AA through ZZ and “-” (ASCII character 95). Recommend “-” as second character.
or
Measurement-Variable Identifier
Alpha characters representing instrument identifiers:AT, FB, KS/, MA, RL, VB, CF KSv, MF, SP DA, KSZ, OA, ST DL, RB, TH,FA, KSP LG
Trace Element
X Position Integer value, in display units, that shifts trace position to right of specified Dis-
play Address. (See TRGRPH .)
Y Position Integer value, in display units, that shifts trace position above specified Display
Address. (See TRGRPH.)Alphanumeric character comprising any spectrum analyzer command.
Programming 2 1

8/21/2019 analiz_espctros
http://slidepdf.com/reader/full/analizespctros 131/536
Secondary Keywords Enclosed in Circles
ALL
AMP
AVGB
DB
DBM
DBMV
DBUV
DELTA
DM
DN
EP
EQ
EXT
FFT
FIXED
FREE
FRQ
GE
GT
GZ
HI
HZ
IST
Kz
LE
LINE
LT
MS
MV
MZ NE
NEG
NH
NL
NR
NRM
OA
OFF
22 Programming
all
amplitude
average detection8-bit byte
decibel (unit)
absolute decibel milliwatt (unit)
decibel millivolt
decibel microvolt
delta
absolute decibel milliwatt (unit)
decreases the parameter one step size
pauses program operation for data entry from front panel
equal
external
fast fourier transform (MKREAD command only)
fixed
free run
frequency
greater than or equal
greater than
gigahertz (unit)
highest
hertz
inverse sweep time
kilohertz (unit)
less than or equal
line, as in power line
less than
millisecond (unit)
millivolts (unit)
megahertz (unit)
not equal to
negative peak detection
next highest
next left
next right
normal Rosenfell detection
output active. Returns the value of the associated parameter.
turn function off

8/21/2019 analiz_espctros
http://slidepdf.com/reader/full/analizespctros 132/536
ON turn function on
PER period
PK-PIT peak-to-peak average detection
PK-AVG peak minus average detection
POS positive peak detection
PSN positionSC seconds (unit)
SMP sample detection
SWT sweep time
TRA trace A
TRB trace B
TRC trace C
UP increases the parameter one step size
u v microvolts (unit)
u s microseconds (unit)
V volts (unit)
VID video
W 2-byte word
? returns a query response containing the value or state of the associated parameter
Programming 23

8/21/2019 analiz_espctros
http://slidepdf.com/reader/full/analizespctros 133/536
ADD
Add
r DESTINATION 7 r OPERAND 1 7 r OPERAND 2 7
Item Description/Default Range Restriction
TRACE LABEL
VARIABLEIDENTIFIER
Alpha character. User-definedlabel declared in TRDEF statement.
Alpha character. User-definedidentifier declared in VARDEF
statement.
AA-ZZ and _2-12 characters required.
AA-ZZ and _2-12 characters required.
or
Alpha character. Measurement-variable identifier, such as
CF or MA.
Trace element, such as TRA
NUMERIC DATAFIELD
Real
The ADD command adds the operands, point by point, and sends the sum to the destination.
operand 1 + operand 2 + destination
The operands and destination may be different lengths. The trace operands (TRA, TRB, TRC, and trace label)
range from 1 to 1008 elements in length. A variable identifier or numeric data field is 1 element long. When
operands differ in length, the last element of the shorter operand is repeated for the addition process. When the
operands are longer than the destination, they are truncated to fit.
2 4 P r o g r a m m i n g

8/21/2019 analiz_espctros
http://slidepdf.com/reader/full/analizespctros 134/536
(Continued) ADD
The following program demonstrates the ADD command.
10 0UTPUT718;“SNGLS;20 OTJTPUT7l8;“VARDEFCOUNT,0:VARDEFSCORE,0;30 OUTPUT 718;“FUNCDEF C-LOP,"""
40 OUTPUT718;“REPEATTS;
50 OUTPUT7l8;“ADDCOUNT,COUNT,1;60 OUTPUT 718; UNTIL COUNT,EQ,3;70 OUTPUT718;“REPEAT;80 OUTPUT718;“C,LOp;90 OUTPTJT718;“ADDSCORE,SCORE,1;100 OUTPUT718;“UNTILSCORE,EQ,4;
The operands and results of trace math are truncated if they are not within certain limits. If operating on traces A,
B, or C, results must be within 1023. If operating on user-defined traces, results must be within 32,767.
P r o g r a m m i n g 25

8/21/2019 analiz_espctros
http://slidepdf.com/reader/full/analizespctros 135/536
A-B-‘A
W
The AMB command subtracts trace B from trace A, point by point, and sends the difference to trace A
A - B - > A
The functions of the command AMB, the command C2, and front panel 11 key are identical.
See Cl and C2. Also refer to Chapter 5 in Section I.
OUTPUT 718;“AMB;”
2 6 Pr o g r a m m i n g

8/21/2019 analiz_espctros
http://slidepdf.com/reader/full/analizespctros 136/536
AMBPL
A-B + display line -+A
The AMBPL command subtracts trace B from trace A, point by point, adds the display line value to the difference,
and sends the result to trace A, as demonstrated in the program below.
A - B + display line + A
10 OUTPUT 718;“IP;SNGLS;TS;A3;”20 OUTPUT 718;“RL -5ODM;TS;B3;”30 OUTPUT 18;“DL -70;”40 OUTPUT 718; “AMBPL;”
50 LOCAL 7186 0 END
P r o g r a m m i n g 2 7

8/21/2019 analiz_espctros
http://slidepdf.com/reader/full/analizespctros 137/536
ANNOT
Annotation
ANNOT
The ANNOT command turns the annotation on or off.
OUTPUT 718;“ANNOT ON;”
When queried (?), ANNOT returns the annotation state: on or off. The state is followed by carriage-return/line-
feed (ASCII codes 13, 10). The end-or-identity state (EOI) is asserted with line feed.
(See KSo and KSp.)
2 8 Pr o g r a m m i n g

8/21/2019 analiz_espctros
http://slidepdf.com/reader/full/analizespctros 138/536
APB
A+B-+A
WC)
The APB command adds trace A and trace B, point by point, and sends the result to trace A. Thus, APB can
restore the original trace after an A-minus-B function (AMB) is executed.
A+B+A
To successfully add all trace elements, place trace A in VIEW or BLANK display mode before executing APB. The
sample program below has both traces in STORE mode.
10 ASSIGN @Sa TO 7182 0 OUTPUT @Sa;“IP;LF;”3 0 OUTPUT @Sa;“CFlOOMZ;SP2MZ;”4 0 OUTPUT @Sa; “A3;”5 0 OUTPUT @Sa;“Bl;CFlOOMZ;”8 0 OUTPUT @Sa;“B3;”7 0 OUTPUT @Sa;“APB;”8 0 END
Line 20: Presets the instrument.
Line 30: Sets trace A to 100 MHz center frequency with 2 MHz frequency span.
Line 40: Views trace A.
Line 50: Selects trace B and sets center frequency to 200 MHz.Line 60: Views trace B .
Line 70: Combines the amplitude of trace B with trace A and displays this combination as trace A.
The functions of the APB and KSc commands are identical.
P r o g r a m m i n g 29

8/21/2019 analiz_espctros
http://slidepdf.com/reader/full/analizespctros 139/536
AT
Attenuation
AT real
The AT command specifies the RF input attenuation from B to 70 dB, in 10 dB steps.
The input attenuator is coupled to the reference level. This coupling keeps the mixer input level at or below a
threshold, when a continuous wave signal is displayed on the spectrum analyzer screen with its peak at the refer-
ence level. Instrument preset (IP) sets the threshold value to - 10 dBm. (See KS, and ML.)
The AT command allows less than the threshold value at the mixer input. Executing CA (couple attenuator) resets
the attenuation value so that a continuous wave signal displayed at the reference level yields - 10 dBm (or thespecified threshold value) at the mixer input.
When the attenuation is changed with the AT command, the reference level does not change. Likewise, when the
reference level is changed with the RL command, the input attenuation changes to maintain a constant signal level
on screen.
The following program lines illustrate proper syntax:
10 OUTPUT718;“AT60;20 OUTPUT718;“ATUP;
Line 10: Sets attenuation to 60 dB.
Line 20: Sets attenuation to 70 dB.
When queried (OA or ?), AT returns the attenuation value as a real number, followed by a carriage-return/line-
feed (ASCII codes 13, 10). The end-or-identify state (EOI) is asserted with line feed.
Refer to Chapter 8 in Section I.
3 0 Pr o g r a m m i n g

8/21/2019 analiz_espctros
http://slidepdf.com/reader/full/analizespctros 140/536
AUNITS
Amplitude Units
AUNIT
The AUNITS command sets the amplitude readouts (reference level, marker, display line, and threshold) to the
specified units. (See KSA, KSB, KSC, and KSD.)
P r o g r a m m i n g 3

8/21/2019 analiz_espctros
http://slidepdf.com/reader/full/analizespctros 141/536
AVG
Average
r DESTINATION 7
AVG
i d e n t i f i e r
,-- OPERAND 7
v a r i a b l e -i d e n t i f i e r
n u m e r i c -c
data field
Item
TRACE LABEL
VARIABLE
IDENTIFIER
Description/Default
Alpha character. User-defined
label declared in TRDEF statement.
Alpha character. User-defined
identifier declared in VARDEF
statement.
Range Restriction
AA-Z2 and_
2-12 characters required.
AA-Z2 and _
2-12 characters required.
Alpha character. Measurement-
variable identifier, such as
CF or MA.
Trace element, such as TRA
NUMERIC DATA
FIELD
AVERAGE COUNT
Real
Selects counter value. Default is
current counter value.
The AVG command averages the operand and the destination according to the following algorithm.
Average = (average count - 1) . (destination/average count)
+ (l / (average count) OPERAND)
3 2 P r o g r a m m i n g

8/21/2019 analiz_espctros
http://slidepdf.com/reader/full/analizespctros 142/536
(Continued) AVG
The average counter may be set to 1 with the CLAVG command.
10 0UTPUT718;“SNGLS;A1;TS;RL;-50;B1;TS;20 ForI=lTOlOO30 OUTFWT718;“AVGTRB,TRA,1ElO4 0 N E x r I
5 0 END
P r o g r a m m i n g 3 3

8/21/2019 analiz_espctros
http://slidepdf.com/reader/full/analizespctros 143/536
AXB
Exchange A and B
(W
The AXB command exchanges trace A and B, point by point.
The functions of the AXB and EX commands are identical. (Refer to Chapter 5 in Section I.)
OUTPUT 718;“AXB;"
Only trace information in display addresses 1 through 1001 and 1025 through 2025 is exchanged.
3 4 P r o g r a m m i n g

8/21/2019 analiz_espctros
http://slidepdf.com/reader/full/analizespctros 144/536
Al
Clear-Write A
The Al command enables the clear-write mode, which continously displays any signals present at the spectrum
analyzer input.
OUTPUT 718; Al;
The Al command initially clears trace A, setting all trace A elements to a zero amplitude level. The sweep trigger
then signals the start of the sweep, and trace A is continuously updated as the sweep progresses.
ANALOQ DISPLAYV I D E O _ TO MEMORY
DETECTOA DIQITAL e A D D R E S S E S ”
CONVERTER ;;;;E/ l - 1 0 0 1 REFRESH D’SPLAY
In addition, subsequent sweeps send new amplitude information to display memory addresses 1 through 1001.
Al also writes instruction word 1040* into address 8. Therefore, any information stored in memory address B is
always lost whenever Al is executed.
If you have used address fJ for a graphics program or label, you may wish to save the contents of address P, beforeeaxecuting Al. For additional information, refer to Appendix A. The functions of the Al command and front panel
@ key are identical. (See CLRW and Bl.)
’ 1040 is a machine instruction word that causes the analyzer to set address 1 through 1023 to zero, and draw trace A.
Programming 35

8/21/2019 analiz_espctros
http://slidepdf.com/reader/full/analizespctros 145/536

8/21/2019 analiz_espctros
http://slidepdf.com/reader/full/analizespctros 146/536
A3
View A
The A3 command displays trace A and stops the sweep. Thus, trace A is not updated.
When A3 is executed, the contents of trace are stored in display memory addresses 1 through 1001. A3 writes
instruction word 1040’ into address PI. Therefore, any information stored in memory address 0 is always lost
whenever A3 is executed.
If you have used address PI for a graphics program or label, you may wish to save its contents before executing
A3.
d
For additional information, refer to Appendix A. The functions of the A3 command and front panel key are
identical. (See B3, VIEW, and TBSTAT)
OUTPUT;“A3;
l 1040 is a machine instruction word that causes the analyzer to set addresses 1 through 1023 to zero, and draws trace A.
Programming 37

8/21/2019 analiz_espctros
http://slidepdf.com/reader/full/analizespctros 147/536
A4
Blank A
The A4 command blanks trace A and stops the sweep; the trace is not updated.
When A4 is executed, the contents of trace A are stored in display memory addresses 1 through 1001. A4 writes
instruction word 1072’ into address 0. Therefore, any information stored in address PI is lost when A4 is executed.
If you have used address f3 for a graphics program or label, you may wish to save its contents before executing
A4.
e
For additional information, refer to Appendix A. The functions of the A4 command and front panel @ key are
identical. (See BLANK, B4, and TRSTAT)
OUTPUT 718;“A4;
l
1072 is a machine instruction word that sets addresses 1 through 1023 to zero, and then skips to the next page of memory.
38 Programming

8/21/2019 analiz_espctros
http://slidepdf.com/reader/full/analizespctros 148/536
BL
B-Display Line +B
@ML)
The BL command subtracts the display line from trace B and sends the difference to trace B.
B - display line ---t B
The functions of the BL and BML commands, and the front panel m key are identical. (Refer to Chapter 7 in
Section I.)
The following program demonstrates the BL command.
10 0UTPUT718;“P;A4;S2;20 OIJ'I??UT718;“DL-85DM;30 OUTPUT718;“Bl;TS;BL;4 0 E N D
P r o g r a m m i n g 3 9

8/21/2019 analiz_espctros
http://slidepdf.com/reader/full/analizespctros 149/536
BLANK
Blank
BLANK
The BLANK command blanks trace A, B, or C and stops the sweep; the trace is not updated.
Trace A and C are discussed below. For detailed information about trace B, see B4 in this section.
. ANALOG
V I D E O _ TODETECTOR DIBITAI. o
C O N V E R T E H WHITE/l STORE
DISPLAYMEMORY
ADDRESSESl - 1 0 0 1
OR1 0 2 5 - 2 0 2 5
30724073
TO- w - c l - - CRT
HEFEkOESH
DISPLAY
When BLANK TRA is executed, the contents of trace A are stored in display memory addresses 1 through 1023.
Address 0 is reserved for the instruction word 1072’. Similarly, when BLANK TRB is executed, trace C contents
are stored in addresses 3073 through 4095. Again, address 3072 is reserved for instruction word 1072’. There-
fore, any information stored in address P, is lost when BLANK TRA is executed. Likewise, the contents of address
3072 are lost when BLANK TRC is executed.
If you have used address il or 3072 for a graphics program or label, you may wish to save their contents before
executing BLANK.
OUTPUT 718; “BLANK TRA;”
For additional information, refer to Appendix A. (See A4, B4, KSk, and TRSTAT)
l 1072 is a machine instruction word that sets addresses 1 through 1023 (BLANK TRA) or 3073 through 4095 (BLANK TRC) to zero,
and then skips to the next page memory.
40 Programming

8/21/2019 analiz_espctros
http://slidepdf.com/reader/full/analizespctros 150/536
BML
B-display line *B
The BML command subtracts the display line from trace B, point by point, and sends the difference to trace B.
BML - display + B
The functions of the BML and BL commands, and the front panel m key are identical. (Refer to Chapter 5 in
Section I.)
The following program demonstrates the BML command.
10 0UTF'UT718;“IP;A4$2;20 OUTF'UT718;“DL-85DM;30 OU'I PTJT718;“B1;TS;BML;4 0 E N D
P r o g r a m m i n g 4 1

8/21/2019 analiz_espctros
http://slidepdf.com/reader/full/analizespctros 151/536
BRD
Bus Read
ANAL YZERINTERNALI / O B U S
/ -ADDRESS T
BA D
I Item Description/Default Range Restriction
INTEGER ASCII decimal number representing analyzer internalI/O bus address.
The BRD command reads a two-byte word at the internal input/output bus of the spectrum analyzer, at the
indicated address. BRD is a service diagnostic function only.
42 Programming

8/21/2019 analiz_espctros
http://slidepdf.com/reader/full/analizespctros 152/536
B-I-C
Transfer B to C
W l)
The BTC command transfers trace B to trace C.
Note that trace C is not a swept, active function. Therefore, transfer trace information to trace C as follows:
1. Select single sweep mode (S2).
2. Select desired analyzer settings.
3. Take one complete sweep (TS) .
4. Transfer data
This procedure ensures that the current settings of the analyzer are reflected in the transferred data.
10 OUTPUT 718;“IP;TS;SNGLS;AB;”20 OUTPUT 718;“Bl;CF BOMZ;TS;B4;”30 OUTPUT 718;“BTC;KSj”31 LOCAL 718
40 END
When transferring trace data from one trace to another, only the trace information from 1001 display memory
addresses is transferred out of the total 1024 available display memory addresses. Information in address 1024
and addresses 2026 through 2047 is not transferred. (Addresses 2026 through 2047 are usually used for custom
graphics.)
The functions of the BTC and KS1 commands are identical.
P r o g r a m m i n g 4 3

8/21/2019 analiz_espctros
http://slidepdf.com/reader/full/analizespctros 153/536
BWR
Bus Write Word
ANAL YZERINTERNALI/O B US
/ -ADDRESS 7 /-MESSAGE 3\
BWR
Item Description/Default Range Restriction
INTEGER ASCII decimal number
representing analyzer internalI/O bus address.
INTEGER ASCII decimal number representing two-byte word.
The BWR command writes a two-byte word to the spectrum analyzer internal input/output bus, at the indicated
address. BWR is a service diagnostic command.
4 4 P r o g r a m m i n g

8/21/2019 analiz_espctros
http://slidepdf.com/reader/full/analizespctros 154/536
BXC
Exchange B and C KSi)
The BXC command exchanges traces C and B, point by point.
Note that trace C is not a swept, active function. Therefore, exchange traces C and B as follows:
1. Select single sweep mode (SNGLS) .
2. Select desired analyzer settings.
3. Take one complete sweep (TS) .
4. Exchange data.
This procedure ensures that the current settings of the analyzer are reflected in the transferred data.
When transferring data from one trace to another, only amplitude information is exchanged, located in display
memory addresses 1025 through 2025 and 2049 through 3049.
The functions of the BXC and KSi commands are identical.
P r o g r a m m i n g 4 5

8/21/2019 analiz_espctros
http://slidepdf.com/reader/full/analizespctros 155/536
Bl
Clear-Write Bl
The Bl command enables the clear-write mode, which continuously displays any signals present at the spectrum
analyzer input.
OUTPUT 718;“Bl;”
The Bl command initially clears trace B, setting all trace B elements to a zero amplitude level. The sweep trigger
then signals the start of the sweep, and trace B is continuously updated as the sweep progresses.
tANALOG DISPLAY
V I D E O _D I G I T A L B A D D R E S S E Se
CT
TO MEMORYDETECTOR
C O N V E R T E R ;;A;:/ 1 0 2 5 - 2 0 2 5 REFRESH D’SPLAY
In addition, subsequent sweeps send new amplitude information to display memory addresses 1025 through
2025. Bl writes the instruction word 1048’ to address 1024. Therefore, any information stored in memory
address 1024 is always lost when Bl is executed.
If you have used address 1024 for a graphics program or label, you may wish to save its contents before executing
Bl.
For additional information, refer to Appendix A. The functions of the Bl command and front panel @ key are
identical. (See CLRW and Al .)
l 1048 is a machine instruction word that sets addresses 1025 through 2047 to zero, and draws trace B dimly.
46 Programming

8/21/2019 analiz_espctros
http://slidepdf.com/reader/full/analizespctros 156/536

8/21/2019 analiz_espctros
http://slidepdf.com/reader/full/analizespctros 157/536
B3
View B
(--=--pQ
The B3 command displays trace B and stops the sweep. Thus, the trace is not updated.
OUTF’UT 718;“B3;”
When B3 is executed, the contents of trace B are stored in display memory addresses 1025 through 2025. B3
writes the instruction word 1048’ to address 1024. Therefore, any information stored in address 1024 is lost when
B3 is executed.
If you have used address 1024 for a graphics program or label, you may wish to save its contents before executing
B3.
For additional information, refer to Appendix A. The functions of the B3 command and front panel m key are
identical. (See VIEW, A3, KSj, and TRSTAT.)
l 1048 is a machine instruction word that sets addresses 1025 through 2047 to zero, and draws trace B dimly.
48 Programming

8/21/2019 analiz_espctros
http://slidepdf.com/reader/full/analizespctros 158/536
B4
Blank
The B4 command blanks trace B and stops the sweep; the trace is not updated.
When I34 is executed, the contents of trace B are stored in display memory addresses 1025 through 2025. B4writes the instruction word 1072 *
B4 is executed.
used or label, you may wish to save its contents before executing
B4.
k
For additional information, refer to Appendix A. The functions of the B4 command and front panel m key are
identical. (See BLANK, A4, KSk, and TRSTAT.)
OUTPUT 718; “B4;”
l 1072 is a machine instruction word that sets addresses 1025 through 2047, and then skips to the next page of memory.
Programming 49

8/21/2019 analiz_espctros
http://slidepdf.com/reader/full/analizespctros 159/536
CA
Couple Attenuation
During normal operation, the spectrum analyzer is coupled to the reference level. This coupling keeps the mixer
input level at or below a threshold, when a continuous wave signal is displayed on the spectrum analyzer screen so
that its peak is at the reference level.
The CA command sets the threshold to - 10 dBm (or a value specified by KS or ML). The counterpart to the CA
command, the AT command, allows levels less than the threshold value at the mixer input.
OUTPUT 718;“CA;
d
The functions of the CA command and the front panel [,,,, key are identical.
50 Programming

8/21/2019 analiz_espctros
http://slidepdf.com/reader/full/analizespctros 160/536
CF
Center Frequency
SP real
T G Z-Di
The CF command specifies the value of the center frequency, performing the same function as the front panel
(xii-) key. (Refer to Chapter 3 in Section I.)
When queried (OA or ?), CF returns the center frequency value as a real number, followed by carriage-return/line-
feed (ASCII codes 13, 10). The end-or-identity state (EOI) is asserted with line feed.
The following program returns a center frequency value of 350 MHz. The program displays the center frequency
on the controller screen,
1 OUTPTJT718;“IP;LF;01;10 OUTPU'l'718; CF2OOMZ;20 0UTPUT718;“CFUP;
30 OTJTPTJT718; CF?;40 ENTER718;N
50 PRINTN
60 END
Programming 51

8/21/2019 analiz_espctros
http://slidepdf.com/reader/full/analizespctros 161/536
CLRAVG
Clear Average
The CLRAVG command sets the average counter to 1. The average counter is active during execution of the AVG
command.
OTJTPU’l’ 718; “CLRAVG;”
52 Programming

8/21/2019 analiz_espctros
http://slidepdf.com/reader/full/analizespctros 162/536
CLRW
Clear/Write
The CLRW command enables the clear-write mode, which continuously displays any signals present at the
spectrum analyzer input.
The CLRW command operates on either trace A or trace B. Trace A is discussed below. For detailed information
about the clear-write mode and trace B. see Bl in this section.
The CLRW command initially clears trace A, setting all trace A elements to a zero amplitude level. The sweeptrigger then signals the start of the sweep, and trace A is continuously updated as the sweep progresses.
ANALOG DISPLAYV I D E O _ MEMORY
TO
DETECTOR DlG?TAL A D D R E S S E S CRT
CONVEHTEH ;;;;;/ l - 1001 HEFHESH D’SPLAY
10 2 50p2 0 2 5
In addition, subsequent sweeps send new amplitude information to display memory addresses 1 through 1023.
Address p is reserved for the instruction word, 1040’. Therefore, any information stored in memory address 0 is
always lost when CLRW is executed.
If you have used address P, for a graphics program or label, you may wish to save its contents before executing
CLRW
OUTPUT 718; “CLRW TRA;”
For additional information, refer to Appendix A. The functions of the CLRW command and front panel @
are identical. (See Bl and Al.)
l instruction word that

8/21/2019 analiz_espctros
http://slidepdf.com/reader/full/analizespctros 163/536
CNVLOSS
Conversion Loss
integer
Item
INTEGER
Description/Default
Selects reference level offset to
compensate for conversion loss.
Range Restriction
O-60
The CNVLOSS command offsets the reference level. The reference level is calibrated when the analyzer is in
external mixing mode by compensating for the conversion loss of an external mixer with the CNVLOSS offset.
If a harmonic of the analyzer LO is not locked before the CNVLOSS command is executed, the message “NOTHARMONIC LOCKED” is displayed on the CRT and the CNVLOSS command is ignored.
The analyzer stores the value of the offset entered with the CNVLOSS command. One offset value is stored for
each of the external mixing bands. The offset value remains as long as the band is locked. The offset value is
erased whenever the band is unlocked. (See HNUNLK or KSQ.)
54 Programming

8/21/2019 analiz_espctros
http://slidepdf.com/reader/full/analizespctros 164/536
COMPRESS
Compress
COMPRESSION, -DESTI NATI ON 7 r SOURCE 7 ,r ALGORITHM 7
COMPRESSt raceI abe I
Item
TRACE LABEL
Description/Default Range Restriction
Alpha character. User-defined label in AA-ZZ and_
TRDEF statement. 2- 12 characters required.
The COMPRESS command compresses the source trace to fit the destination trace, according to the compression
algorithm, and ratio of source and destination trace sizes.
The source trace must be longer than the destination trace. The ratio of source trace length to destination trace
length, in display units, equals K.
source trace length / destination trace length = K
number of points in interval = K
COMPRESS divides the source trace into intervals, and computes a compressed value for each interval. The
compressed values become the amplitude values for all of the points in the destination trace. For example, if the
source trace is 1000 points long, and the destination trace is 100 points long, K equals 10. COMPRESS divides
the source trace into 100 intervals of 10 points each, and computes a compressed value for each interval. The 10
points are operated on by the compression algorithm, and the compressed value for the first interval becomes the
amplitude of the first point in the destination trace. The 99 remaining compressed values determine the amplitude
of the last 99 points of the destination trace.
Programming 55

8/21/2019 analiz_espctros
http://slidepdf.com/reader/full/analizespctros 165/536
COMPRESS (Continued)
The compression algorithms determine how the compressed values are computed.
Specifying AVG (average) computes the average value of the points in the interval as the compressed value.
Specifying POS (positive) selects the highest point in the interval as the compressed value.
Specifying NEG (negative) selects the lowest point in the interval as the compressed value.
Specifying NRM (normal) computes the compressed value of the interval using the Rosenfell algorithm,
which chooses between negative and positive peak values.
Specifying PK-PIT (peak-pit) computes the greatest peak-to-peak deviation within the interval as the com-
pressed value.
Specifying PK-AVG (peak average) selects the difference of the peak and average value of the interval as the
compressed value.
Specifying SMP (sample) selects the last point in the interval as the compressed value.
The program below compresses a full sweep to one-fifth its size. The result is moved to trace A for display.
14 OUTPUT 71a;“DISPOSE ALL;IP;Al;EM;S2;TS;”
21 OUTPUT 71a;“TFLDEF NEWA,200;”22 OUTPUT 7 la; “FUNCDEF C-P, ! ”
24 OUTPUT 718;“S2;TS;”
26 OUTPUT 71a;“COMPRESS NEWSI,TRA,AVG;”27 OUTPUT 71a;“MOV TRA,NEW>;”28 OUTPUT 7la;y
31 oufrmr 7la;“c,p;”
35 END
56 Programming

8/21/2019 analiz_espctros
http://slidepdf.com/reader/full/analizespctros 166/536
CONCAT
Concatenate
CONCAT
/ -DESTINATION 7 r OPERAND 17 r OPERAND 2 7
Item Description/Default Range RestrictionI
TRACE LABEL Alpha character. User-defined label AA-Zz anddeclared in TRDEF statement. 2- 12 characters required.
The CONCAT command concatenates the operands and sends the new trace array to the destination.
The size of the destination varies from 1 to 1008 elements. Traces A, B, and C each contain 1001 elements. If
necessary, use the COMPRESS command to reduce the length of the operands. Otherwise, the concatenated
arrays may not fit in the destination, and trace information is lost.
10 OTJ’ITUT 71S;“IP$32;Bl;TS;B3;RL -3ODM;TS;A3;”20 !
30 OUTPUT 716;“ FRDEF xXx,500;”40 OUTPUT 71S;“COMPFlJ%SS xxX,TRA,AVG;”50 !
60 OUTPUT 71S;“EX;”70 OUTPUT 1S;“TRDEF 222,500;”a0 OUTPUT 718;9zoMpREss ZZZ,TRA,AVG;”90 !
100 OUTPUT 71B;“B3;”
110 OTJTPUT 718;“CONCAT RB,XXX,ZZZ;”120 !
130 END
Programming 57

8/21/2019 analiz_espctros
http://slidepdf.com/reader/full/analizespctros 167/536
CON-S
Continuous Sweep
61)
The CONTS command sets the analyzer to continuous sweep mode. In the continuous sweep mode, the analyzer
continues to sweep (sweep times L 20 ms) at a uniform rate from the start frequency to the stop frequency, unless
new data entries are made from the front panel or via HP-IB. If the trigger and data entry conditions are met, the
sweep is continuous.
The sweep light indicates that a sweep is in progress. The light is out between sweeps, during data entry, and for
sweep times 110 ms.
OUTPUT riamoms;**
The functions of the CONTS and Sl commands, and front panel m key are identical.
58 Programming

8/21/2019 analiz_espctros
http://slidepdf.com/reader/full/analizespctros 168/536
CR
Couple Resolution Bandwidth
The CR command couples the resolution bandwidth with the video bandwidth and sweep time. The counterpart
to the CR command, the RB command, breaks coupling. Use CR to reestablish coupling after RB has been
executed.
A
The functions of the CR command and the front panel key (,,,, are identical
Programming 59

8/21/2019 analiz_espctros
http://slidepdf.com/reader/full/analizespctros 169/536
Couple Step Size
The CS command couples the center frequency step size to the span width, so that step size equals 10 percent of
the span width, or one major graticule division. The counterpart to the CS command, the SS command, breaks
coupling. Use CS to reestablish coupling after SS has been executed.
E
The functions of the CS command and the front panel (,,,, key are identical.
60 Programmi ng

8/21/2019 analiz_espctros
http://slidepdf.com/reader/full/analizespctros 170/536
CT
Couple Sweep Time
The CT command couples the sweep time with the resolution and video bandwidths. The counterpart to the CT
command, the ST command, breaks coupling. Use CT to reestablish coupling after ST has been executed.
OUTPUT 718;“CT;"
C
The functions of the CT command and the front panel m key are identical.
Programming 6 1

8/21/2019 analiz_espctros
http://slidepdf.com/reader/full/analizespctros 171/536
CTA
Convert to Absolute Units
/- DESTINATION -x r OPEHAND 7
CT A
Item Description/Default Range Restriction
VARIABLE
IDENTIFIER
Alpha character. User-defined
identifier declared in VARDEF
statement.
AA-ZZ and_
2- 12 characters required.
Alpha character. Measurement-
variable identifier representing
amplitude value, such as MKA.
NUMERIC
DATA FIELD
Real
The CTA command converts the operand values from display units to the current absolute amplitude units.
62 Programmi ng

8/21/2019 analiz_espctros
http://slidepdf.com/reader/full/analizespctros 172/536
C-I-M
Convert to Display Units
,- DESTINATION 7 r OPERAND 7
CTM
Item Description/Default Range Restriction
VARIABLE
IDENTIFIER
Alpha character. User-defined
identifier declared in VARDEF
statement.
AA-Z2 and_
2- 12 characters required.
Alpha character. Measurement-
variable identifier representing
amplitude value, such as MKA.
NUMERIC
DATA FIELD
Real
The CTM command converts the operand values to vertical display units.
OUTPUT 718;“VAFLDEFXXX,l; CTMXXX,lB; DSPL xXx,13.5;”
Programming 63

8/21/2019 analiz_espctros
http://slidepdf.com/reader/full/analizespctros 173/536
v
Couple Video Bandwidth
The CV command couples the video bandwidth with the resolution bandwidth and sweep time. The counterpart
to the CV command, the VB command, breaks coupling. Use CV to reestablish coupling after VB has been
executed.
OUTPUT 718; “Cv;”
B
The functions of the CV command and the front panel (,,,, key are identical.
64 Programming

8/21/2019 analiz_espctros
http://slidepdf.com/reader/full/analizespctros 174/536
C l
A-B off
The Cl command turns off the A-minus-B mode.
OUTF’UT 718;“Cl;”
The functions of the Cl command and the front panel (,,I] key, located above the 0 key, are identical. (Refer
to Chapter 5 in Section I. Also see AMB and CZ.)
Programming 65

8/21/2019 analiz_espctros
http://slidepdf.com/reader/full/analizespctros 175/536
c 2
A-B-A
(AMB)
The C2 command subtracts trace B from trace A, point by point, and sends the difference to trace A.
A-B-A
OUTF’UT 718; “C2;”
The A-minus-B mode is turned off with the Cl command. The function of C2 is identical with that of the
command AMB, and the front panel , key. (Refer to Chapter 5 in Section I.)
66 Programming

8/21/2019 analiz_espctros
http://slidepdf.com/reader/full/analizespctros 176/536
DA
Display Address
,-DISPLAY MEMORY 7ADDRESS
I Item Description/Default Range Restriction
INTEGER Represents analyzer display memory
address.
p, - 4095
J
The DA command selects a specified display memory address to be the initial current (in-use) register. The display
address register can then be accessed and advanced one address at a time with the DW, DD, and DR commands.
Refer to Appendix B for additional information on the DA command.
A typical use of the DA command is shown in the sample program below.
10 OUTPUT 718;“01;DA;1024;20 FORI=lTOS
30 OUTPUT718;“DA;OA;40 ENTER718;A50 OUTPUT 718;“DR;
60 ENTER718;W
70 OUTPUT718;A,W80 NEXT1
90 END
Line 10:
Line 20430:
Line 30:
Line 50:
Addresses the analyzer, formats the output in decimal display units, and selects the fist address to
be read.
Reads and prints five successive display program addresses and their contents. The address is
automatically advanced one address for each DR execution.
Activates the output of each display address.
Activates the output of each current display address.
Each display address contains twelve bits of information.
Programming 67

8/21/2019 analiz_espctros
http://slidepdf.com/reader/full/analizespctros 177/536
DD
Display Write Binary
DD i n teger
I Item Description/Default Range Restriction I
INTEGER Represents 16-bit binary byte that is
transmitted as two &bit bytes.0 4095
The DD command writes two &bit bytes into the current or specified (with DA command) display memory
address, and advances the address selection to the next higher address. If the DD command is followed by more
than one pair of bytes, DD loads the pairs into consecutive display addresses. The display address is always
advanced after a number is loaded into an address. (Each display address contains twelve bits.)
The bytes represent data or a display instruction.
Use the DD command in conjunction with the DR and DA commands to draw on the spectrum analyzer CRT The
functions of the DD and DW commands are identical, except that the controller must send instructions or data in
binary form instead of decimal form. This difference is illustrated in the program below. The program tells the
analyzer, in four different ways, to dim trace A. The number 1048 is an instruction word that means “dim trace.”
10 OUTPUT718;“Al;S2;TS;20 OUTPUT718;“DA0;DW1048;
30 PAUSE40 OTJTPUT718;“Al;S2;TS;50 OTJTPUT718USING“#,K,W ;“DA0;DD ;104860 PAUSE
70 OUTPUT718; Al;S2;TS;80 OUTPUT718USING“#,K,B,B ;“DA1;DD ,4,2490 PAUSE
100 0UTPUT718;“A1$32;TS;110 A$=CHR$(4)&CHR$(24)120 OUTPUT718USING “#,K”;“DAPIDD”,A$130 END
Lines 10,4O, 70, 100:Line 20:
Line 50:
Line 80:
Line 110:
Line 120:
Sweeps trace and displays trace A once.Transmits instruction word 1048, in decimal form, to display address 0.
Suppresses carriage-return/line-feed (#) , transmits instruction word 1048 as one word
(W for word, or 16 bits).
Suppresses carriage-return/line-feed (#), transmits instruction word 1048 as two &bit
bytes (B,B for byte,byte).
Declares A4 equal to CHR$(4) plus CHR$(24).
Transmits instruction word 1048, as A$.
68 Programming

8/21/2019 analiz_espctros
http://slidepdf.com/reader/full/analizespctros 178/536
(Continued) DD
Refer to Appendix B for additional information about instruction words and display programming. The Consoli-
dated Coding table in Appendix B is especially useful.
Programming 69

8/21/2019 analiz_espctros
http://slidepdf.com/reader/full/analizespctros 179/536
DET
Input Detector
The DET command selects the kind of spectrum analyzer input detection: normal, sample, positive peak, or
negative peak.
Normal (NRM) enables the Rosenfell detection algorithm that selectively chooses between positive and negative
peak values. The IP command (instrument preset) also activates normal detection.
Sample (SMP) displays the instantaneous signal value detected at the analog-to-digital converter output. Video
averaging and a noise-level marker, when active, also activate sample detection. (See MKNOISE, VAVG, or KSe.)
Positive peak detection (POS) displays the maximum signal value detected during the conversion period.
Negative peak detection (NEG) displays the minimum signal value detected during the conversion period. The
program line below selects the negative peak detection.
OUTPUT718;“DETNEG;
When queried (?), DET returns the detection type to the controller (NRM, SMP NEG, or POS) followed by
carriage-return/line-feed (ASCII codes 13, 10). The line feed asserts the end-or-identify state (EOI) .
70 Programming

8/21/2019 analiz_espctros
http://slidepdf.com/reader/full/analizespctros 180/536
DISPOSE
Dispose
7 OPERAND -- \
DISPOSEf u n c t i o n
a b e l
Item Description/Default Range Restriction
TRACE LABEL Alpha character. User-defined
label declared in TRDEF
statement.
AA -ZZ and_
2-12 characters required.
VARIABLE
IDENTIFIER
Alpha character. User-defined
VARDEF statement.
AA-22 and _
2-12 characters required.
Alpha character. Measurement-
variable identifier, such as
Trace element, such as TRA [ 101
FUNCTION
IDENTIFIER
Alpha character. User-defined
label declared in FUNCDEF
statement.
and _
2-
KEY NUMBER Integer representing number of
KEYDEF statement.
0-999
The DISPOSE command clears any operand listed above. DISPOSE ALL clears all operands. The program line
below disposes all command lists declared with a TRMATH command.
OUTPUT 7 18; “DISPOSE TRMATH; ”
P r o g r a m m i n g 71

8/21/2019 analiz_espctros
http://slidepdf.com/reader/full/analizespctros 181/536
DISPOSE (Continued)
If the analyzer remains locked up- that is, it does not respond to remote commands but does respond to front
panel commands - and interface clear (shift reset) does not free up the analyzer, then execute the following lines:
Send 7; LISTEN CMD 12Clear 718
This forces DISPOSE ALL.
72 Programming

8/21/2019 analiz_espctros
http://slidepdf.com/reader/full/analizespctros 182/536
r DEST I NAT ION I r OPERAND 17 /- OPERAND 27
DIV
Divide
D I V
Item Description/Default Range Restriction
TRACE LABEL Alpha character. User-defined
label declared in TRDEF
statement.
AA-ZZ and_
2-12 characters required.
VARIABLE
IDENTIFIER
Alpha character. User-defined
identifier declared in
VARDEF statement.
AA-ZZ and_
2- 12 characters required.
Alpha character. Measurement-
variable identifier, such as
CF or MA.
Trace element, such as TRA [lo]
NUMERIC
DATA FIELD
Real
The DIV command divides operand 1 by operand 2, point by point, and sends the difference to the destination.
operand 1/ operand 2 + destination
The operands and destination may be of different length. The trace operands (TRA, TRB, TRC, and trace label)
range from 1 to 1008 elements in length. A variable identifier or numeric data field is 1 element long. When
operands are of different lengths, the last element of the shorter operand is repeated for operations with the
remaining elements of the longer element. When the operands are longer than the destination, they are truncated
to fit.
Programming 73

8/21/2019 analiz_espctros
http://slidepdf.com/reader/full/analizespctros 183/536
DIV (Continued)
The operands and results of trace math are truncated if they are not within certain limits. If operating on traces A,
B, or C, results must be within 1023. If operating on user-defined traces, results must be within 32,767.
7 4 Pr o g r a m m i n g

8/21/2019 analiz_espctros
http://slidepdf.com/reader/full/analizespctros 184/536
DL
Display Line
DL
Item
VARIABLE
Description/Default
Alpha character. User-defined
identifier declared in VARDEF
statement.
Range Restriction
AA-ZZ and_
2-12 characters required.
Alpha character. Measurement-
variable identifier, such as
CF or MA.
Trace element, such as TRA [ 101
The DL command defines a display line level and displays it on the CRT. The level is in dBm and can be used in
arithmetic functions, such as DIV or MXM.
The functions of the DL command and the front panel reference level a key are identical. The display line also
can be turned on or off by the DLE and L(a commands.
The following program lines compare a display line level of - 10 dBm to the largest signal detected. If the display
line level is greater than the signal level, the display line is lowered.
10 OUlTUT718;“IP;DL-1ODM;TS;MKPK;MAOA;20 ENTER718;N
30 OUTPUT718;“IFDL,GT,NTHENDLDNENDIF;40 0uTPuT718;5050 END
P r o g r a m m i n g 7 5

8/21/2019 analiz_espctros
http://slidepdf.com/reader/full/analizespctros 185/536
DL (Continued)
When queried (? or OA), DL returns the display line level as a real number, folowed by carriage-return/line-feed
(ASCII codes 13, 10). The end-or-identify state (EOI) is asserted with line feed. (See DLE.)
7 6 Pr o g r a m m i n g

8/21/2019 analiz_espctros
http://slidepdf.com/reader/full/analizespctros 186/536
DLE
Display Line Enable
DLE
OFF The DLE command enables or disables the display line.
The function of this command is similar to that of the DL and LI2) commands, and the display line mm and ‘m
keys on the front panel.
When queried (?), DLE returns the display line state, ON or OFF followed by carriage-return/line-feed (ASCII
codes 13, 10). The line feed asserts the end-or-identify state (EOI) .
10 OUTPUT718;“IP;DLE ?;
20 ENTEiR718;AJb30 PRINT718;Adb
Since IP deactivates the display line, the query in the above program returns “OFF” to the controller.
P r o g r a m m i n g 7 7

8/21/2019 analiz_espctros
http://slidepdf.com/reader/full/analizespctros 187/536
DONE
Done
commandl i s t DONE
Item Description/Default Range Restriction
COMMAND LIST Any spectrum analyzer commandsfrom this Remote section
The DONE command is a synchronizing function. When DONE follows a command list, it sends the controller a 1
after the command list is executed. The TS command may also be a synchronizing function. If TS precedes the
command list, list execution begins after the sweep is completed.
78 Programming

8/21/2019 analiz_espctros
http://slidepdf.com/reader/full/analizespctros 188/536
DR
Display Read
The DR command sends the contents of the current display address to the controller. Thus, the controller “reads”
the contents of the display memory address. Use the DA command to specify the display memory address when
executing DR for the fist time. After DR is executed, the display address is automatically advanced to the next
higher address. Thus, the DA command is only needed to specify the first address, because subsequent DR
commands read consecutive addresses.
10 OTJTPTJ t'718;“DA501DR20 ENTER718;A30 OUTPUT718;“DA1525DR;40 ENTER718;B
50 OUTPUT718;“DR60 ENTER718;C
Line 10:
Line 30: Reads contents of address 1525.
Reads contents of address 1526.
Lines 20,40, and 60: Assigns address contents to variables A, B, and C.
P r o g r a m m i n g 7 9

8/21/2019 analiz_espctros
http://slidepdf.com/reader/full/analizespctros 189/536
DSPLY
Display
DSPLY
FIE L D DECIMALr -WIDTH-- \ r- PLACES I
Item Description/Default Range Restriction
INTEGER Specifies number of digits
decimal point.
INTEGER Specifies number of digits to
VARIABLE
IDENTIFIER
Alpha character. User-defined
statement.
Measurement-
variable identifier, such as
CF or MA.
Trace element, such as TRA [ 101
0 to 9
AA-22 and _
2-12 characters required.
The DSPLY command displays the value of a variable anywhere on the spectrum analyzer display.
Field width specifies the number of digits displayed, including sign and decimal point. Places to the right of the
decimal point are limited by decimal places. For example, the number 123.45 has a field of 7, and 2 decimal
places.
Use the DA, PU, PD, and PA commands to position the variable on the screen.
80 Programming

8/21/2019 analiz_espctros
http://slidepdf.com/reader/full/analizespctros 190/536
D-l-
Define Terminator
Item Description/Default Range Restriction
TERMINATOR Marks end of text. ASCII codes 0 - 255
In the sample program below, the @ symbol is defined as a terminator by the DT command immediately preced-
ing it. In line 30, separates the command string “RL -5ODM” from the title string “CAL OUT 2ND HAR-
MONIC.” Without the @ symbol, “RL -5ODM” would be written on the analyzer’s CRT as part of the title instead of
10 OUTPTJT 718;“DT@”20 OTJTPUT 718; “CF BOOM Z”30 OUTFVT 718;“KSE CAL OUT 2ND HARMONIC@RL -5ODM”40 END
Programming 8 1

8/21/2019 analiz_espctros
http://slidepdf.com/reader/full/analizespctros 191/536
DW
Display Write
Item Description/Default Range Restriction
INTEGER Integers representing displaymemory values or instructionwords.
0 - 4095
The DW command sends a decimal number from the controller to the current or specified (with the DA com-mand) display memory address, and advances the address selection to the next higher address. If the DW
command is followed by more than one number, they are all loaded into consecutive display addresses. The
display address is always advanced by one after a number is loaded into an address. (Each display address
contains 12 bits. See DA.)
The decimal number represents data, or is an ASCII representation of a display instruction.
Use the DW command in conjunction with the DR and DA commands to draw on the spectrum analyzer CRT
when the 03 or 01 output format is active. Refer to Appendix B for additional information about display memory
instructions and display programming. The Consolidated Coding table and Data Word Summary in Appendix B
are especially useful.
The program line below contains an instruction word, 1026, followed by data, 500 and 600. The DW command
writes the numbers 1026, 500, and 600 into display addresses 1024, 1025, and 1026, respectively. The DA
command specifies 1024 as the first address.
OUTPUT 718;“DA 1024; DW 1026,500,600;”
The instruction word (1026) causes the analyzer to draw a vector from the current position to the X-Y coordinates
500,600. (See Chapter 4 in Section I for a description of display unit coordinates.)
82 Programming

8/21/2019 analiz_espctros
http://slidepdf.com/reader/full/analizespctros 192/536
D 1 Display Size Normal
D2 Display Size Full CRT
D3 Display Size Expand
Display size commands Dl, D2, and D3 set the display size for CRT graphics. BEX is a fourth display size that can
only be accessed by a display control instruction: graph, label, or vector mode. 256 (big expand) must be added to
the control word, i.e., graph (1024 + 256). Once a code is selected, it remains in effect until changed.
Positions on the CRT display are referenced in display units as x, some horizontal position, and y, some vertical
position. The coordinates (x,y) represent distance from the lower left-hand corner of the graticule (O,O), which is
also the origin. The upper right-hand corner is the (1000, 1000) point.
B
- C R T BEZEL
S I Z E 0,O) AA B C D E
Dl AA
D 2 A
D3 A
bex AA
@,O)l (1000,1000) (1023,1023)
(120,73) (1023,1023) (1005,957) (785,978)
(81,491 (689,689) (676,645) (690,658)
Display size 4 cannot be accessed by the command code D4
(O,O)t (671,671) (686,686)
(500,500)
(562,515)
(379,347)
(336,336)
*No writing outside boundary marked by AA, D
Programming 83

8/21/2019 analiz_espctros
http://slidepdf.com/reader/full/analizespctros 193/536
Dl , D2, D3 (Continued)
Display size 4 can only be accessed by a display control instruction such as graph, label, or vector mode. Big
expand (256) must be added to the word selected (i.e., label is 1025 + 256).
A display program word can be a value from P, to 4095. The value is stored as a 12-bit binary word. The bits define
the type of word. Graphic representations used are defined as follows:
Most Stgnrflcanl Btt Least Slgnlflcant Bit
MSB LSBDecimal
bit 11 10 9 8 7 6 5 4 3 2 1 0 total
0 1 0 x x x x x x x 1 0 1 26
decimal 2048 1024 512 256 128 64 32 16 8 4 2 1
valuewhere x IS either a 1 (true) or a 0 (false)
Changing the display size and beam intensity are controlled by setting various bits along with the control instruc-
tions and data words. These functions are called auxiliary functions to the instruction.
11 10 9 8 7 6 5 4 3 2 1 0
auxiliary functions 0 ~l~0~x~x~x~s~x~x~e~x~x
display size beam intensity big expand (bex) l , + 256 dim (dim), + 8
expand and shift (exs) , + 64 bright (brt), + 128
clear x position (clx), + 16
clear x position (clx) :
big expand (hex) :
expand and shift (exs) :
Resets the axis display position to the far left (0, y).
Amplifies the x and y CRT beam deflection by a 1.49 factor.
Amplifies the x and y CRT beam deflection by a 1.13 factor (expand) and shifts
the (0,O) reference point to the lower left of the CRT screen.
dim (dim): Sets the CRT beam intensity below the normal level.
bright (brt) : Sets the CRT beam intensity to the maximum level.
I
Abbreviations within the parentheses are useful as a shorthand notation for writing display programs. They are not programming
codes.
8 4 P r o g r a m m i n g

8/21/2019 analiz_espctros
http://slidepdf.com/reader/full/analizespctros 194/536
(Continued) Dl , D2, D3
The display size commands combine the size instructions as follows:
I
Display
Size
Consolidated
Coding
Instructions
Ratio
to Dl
Origin
Shifted
Dl none 1.00D2 exs 1.13
D3 bex and exs 1.68
big expand bex 1.49
noyes9s
no
The display size determines the position and number of rows and columns for characters on the CRT display. This
can be an important consideration when labeling graph lines or points.
Dl Display Size
T1024UNITS
32CHARACTER
LINES
1024 UNITS64 CHARACTER SPACES
D2 Display Size
1024
UNITS
32CHARACl
LINES‘ER
1024 UNITS64 CHARACTER SPACES I
Programming 85

8/21/2019 analiz_espctros
http://slidepdf.com/reader/full/analizespctros 195/536
Dl, D2, D3 (Continued)
Display memory is set up to contain 64 character spaces per line with respect to display size 1. When using the
third and fourth display sizes, a label can only be a maximum of 44 characters. The remaining 20 characters of the
label will be stored in display memory, but will not show up on the CRT display due to the expansion of D3 and
bex. At character space 65, an automatic carriage-return and line-feed will occur, at which point labeling will
continue to be written on the CRT display.
The automatic carriage-return and line-feed occur only when character space 65 is reached. Thus, in the third andfourth display sizes, the characters from the 44th character space through the 64th character space will not appear
on the CRT display Therefore, labeling with display size 3 and bex needs appropriate placement of characters
because of the limited number of character spaces for these display sizes.
D3 Display Size
Big Expand (bex)
- r 1024
UNITS
21
CHARACTER
LINES
-L1024 UNITS
42 CHARACTER SPACES
86 Programming

8/21/2019 analiz_espctros
http://slidepdf.com/reader/full/analizespctros 196/536
(Continued) Dl , D2, D3
OUTPUT 718; “D2;”
The above program line selects display size 2 for the CRT display of the analyzer.
32
30
6,
0,
’R aference
T
Ascender Limit
Character Boundary
r
except for p, 11 hand 00.
Base Line
Descender Limit
6 12 16
Distance from References
are in Display Units
Single Character Space
A single character space (see above) has an absolute outside limit of 16 (x) by 32 (y) units in any display size. A
character position is referenced from the lower left corner of each character space. The actual “character bound-
ary” is designated by the ascender and descender limits.
From the center of the character space, x may be changed as many as + 7 units and y by as many as + 15 units
before the text begins at the next x and y character. If a plot absolute statement calls a position anywhere in the
character space, the character will be placed within the “character boundary.” If two characters are labeled into the
same character space, they will be superimposed over one another.
Example :
To begin labeling text 6 characters up from the bottom and 24 characters from the left (in any display size), the plot
absolute vector values are calculated for the center of the character location as follows:
x = (character spaces) (16) - 8
= (24) (16) - 8 = 376
y = (character spaces) (32) - 16
= (6) (32) - 16 = 176
“PA 376,176 LB <text>”
Programming 87

8/21/2019 analiz_espctros
http://slidepdf.com/reader/full/analizespctros 197/536
Dl , D2, D3 (Continued)
The first character of text will be positioned as shown:
304- ‘9” -8
7
176- ;
4
32
1 I I I I I I I I III I l l l I l l l l l I I I I
1 5 10 15 Character Spaces
I Lower Left Display 152 312 376 Units at Center
88 Programming

8/21/2019 analiz_espctros
http://slidepdf.com/reader/full/analizespctros 198/536
EE
Enable Entry
The EE command sends values entered by the operator on the analyzer DATA keyboard to the controller. Gener-
ally, the sequence of programmed events is as follows:
1. A program loop prevents the controller from using the entered value until the operator signals that the entry is
complete.
2. The operator makes a DATA entry, which is stored in the analyzer internal data register.
3. The operator signals completion of the entry.
4. The controller reads the value of the entry and continues to the next program step.
Depending on the type of DATA entry required, one of two different methods is used. The first method does not
require the use of service requests and is used only for entering positive single digits, the second is for entering
positive integers from PI to [ 18( 12) - 11.
Method 1: Testing for a non-zero entry.
1 0 OUTPUT 718;“EE;20 REPEAT
30 OUTPUT 718;"OA;"40 ENTER718;N
50 UNTILN>@
60 P R I N T E R I S
70 PRINTN80 END
Line 10: Allows data to be entered with the analyzer DATA keys and presets the entry to @ (default value).
The OA command transfers this value to the analyzer.
Lines 20 to 50: Forms a program loop that is exited when a single digit entry between 1 and 9 is made.
Line 20: Reads the current value of the DATA keys into the variable N.
Lines 60 to 70: Prints the entered number on a printer whose address in 701.
Programming 89
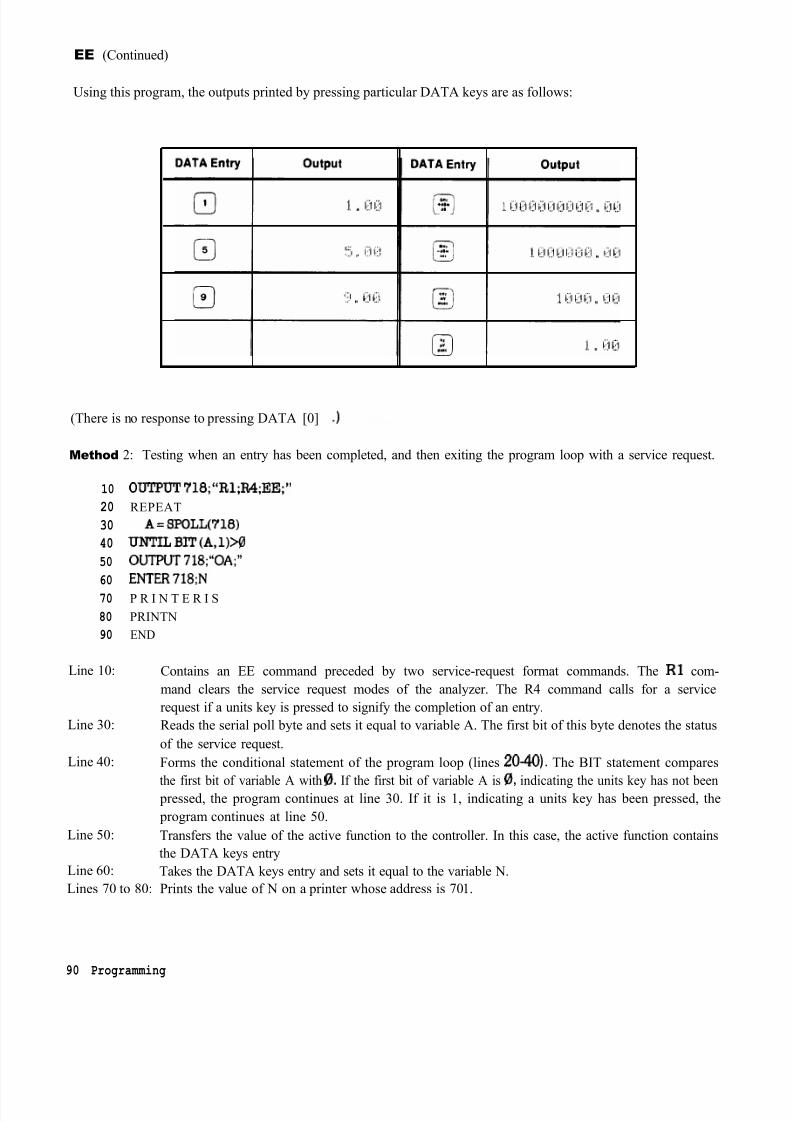
8/21/2019 analiz_espctros
http://slidepdf.com/reader/full/analizespctros 199/536
EE (Continued)
Using this program, the outputs printed by pressing particular DATA keys are as follows:
(There is no response to pressing DATA [0] .)
10 OUTPUT718;“R1;R4;EE;
20 REPEAT
30 A=SPOLL(718)
40 UNTILBIT(A,1)>0
50 OUTPUT718;“OA;"
60 ENTER718;N
70 P R I N T E R I S
80 PRINTN
90 END
Line 10: Contains an EE command preceded by two service-request format commands. The Rl com-
mand clears the service request modes of the analyzer. The R4 command calls for a service
request if a units key is pressed to signify the completion of an entry.
Line 30: Reads the serial poll byte and sets it equal to variable A. The first bit of this byte denotes the status
of the service request.
Line 40: Forms the conditional statement of the program loop (lines 20-40). The BIT statement compares
the first bit of variable A with 0. If the first bit of variable A is 0, indicating the units key has not been pressed, the program continues at line 30. If it is 1, indicating a units key has been pressed, the
program continues at line 50.
Line 50: Transfers the value of the active function to the controller. In this case, the active function contains
the DATA keys entry
Line 60: Takes the DATA keys entry and sets it equal to the variable N.
Lines 70 to 80: Prints the value of N on a printer whose address is 701.
Method 2: Testing when an entry has been completed, and then exiting the program loop with a service request.
90 Programming

8/21/2019 analiz_espctros
http://slidepdf.com/reader/full/analizespctros 200/536
(Continued) EE
Some DATA entries and the corresponding printed outputs, as executed by this program, are shown in the
following table.
DATA Entry output
Programming 91

8/21/2019 analiz_espctros
http://slidepdf.com/reader/full/analizespctros 201/536
EK
Enable Knob
The EK command allows data entry with the front panel data knob when the analyzer is under remote control.
The front panel ENABLED indicator lights, indicating the data knob is functional, but other front panel functions
remain inoperative.
The following program requests the operator to position a marker on a signal that needs further analysis, while the
program is paused.
10 OUTPUT 718:“MB;EK;”20 PRINT “USE DATA KNOB TO PLACE MARKER ON SIGNAL. PRESS CONTINUE”
30 PAUSE40 ! Analysis program here
50 END
The program above is continued by pressing the EloNT’N”E key on the controller keyboard
Be sure to pause program operation after executing EK. This gives the operator time to turn the data knob.
92 Programming

8/21/2019 analiz_espctros
http://slidepdf.com/reader/full/analizespctros 202/536
r OPERAND 1 > ,- OPERAND 2 7
IF THEN ELSE N IF
THEN
commandI st ELSE
command ist END I F
Item
COMMAND LIST
Description/Default
Alphanumeric character. Any spectrum
analyzer command from this section
Range Restriction
VARIABLEIDENTIFIER
Alpha character. User-defined identifier declared in VARDEF statement.
Alpha character. Measurement-variable
identifier, such as CF or MA.
AA-ZZ and _2- 12 characters required.
Trace element, such as TRA( lo].
NUMERIC DATA
FIELDReal
The IF-THEN-ELSE-ENDIF commands form a decision and looping construct. They compare operand 1 to
operand 2. If the condition is true, the command list is executed. Otherwise, commands following ELSE or ENDIF
are executed.
The IF command must be delimited with the ENDIF command.
Programming 93

8/21/2019 analiz_espctros
http://slidepdf.com/reader/full/analizespctros 203/536
IF THEN ELSE ENDIF (Continued)
The following program uses the IF THEN ELSE ENDIF command to place a marker on the largest signal that is
greater than the threshold level.
10 OUTPUT 718;“IP;LF;TH-35DM;
20 OUTPUT718;“TS;MKPKHI;MA;
30 OUTPUT718;“IFMA,GT,TH
40 0UTPUT718;“THENCF20MZ;50 OUTPUT7l8;“ELSECF100MZ;TS;M.KPKHI;
60 OUTPUT718;“ENDIF;
70 END
The program below does not incorporate the ELSE branch of the IF THEN ELSE ENDIF command. The program
lowers any signal positioned about (off) the analyzer screen.
10 OUTPUT718;“S2;TS;E1;
20 OTJTPUT718;“IFMA,GT,RLTHEN
30 OUTPUT718;“REPEATRLUP;TS;El;
40 OUTPUT718;“UNTILMA,LE,RL
50 OUTPUT 718;“ENDIF Sl;
60 END
94 Programming

8/21/2019 analiz_espctros
http://slidepdf.com/reader/full/analizespctros 204/536
EM
Erase Trace C Memory
The EM command clears display memory addresses 3072 through 4095, which contain instruction words and
amplitude information for trace C. The EM command loads the instruction word 1044 into addresses 3072
through 4095, and then establishes address 3072 as the current (in-use) address, placing this address in the display
address register. (See Appendix A for more information about trace C.)
The EM command is often incorporated in a routine that blanks the spectrum analyzer screen in preparation for
the display of custom graphics. Execute the following program line to blank the analyzer screen;
OUTF’UT 718; “EM;BLANK TRA;BLANK TRB; GRAT OFF; KSo; DLE OFF;”
The line above clears trace C memory, and blanks the graticule, characters, display line, and traces A and B.
Though the display can be blanked with the KSg command, which turns off the CRT beam, the above program
line is advantageous. It clears the display faster than KSg. In addition, the contents of traces A and B are saved, the
instrument state is not altered, and the beginning of trace C memory, address 3072, is established as the current
address.
To reinstate the analyzer display, execute the following program line:
OUTF’UT 718;“EM;CLRW TRA;CLRW TRB; GRAT ON; KSp;DLE ON;”
Programming 95

8/21/2019 analiz_espctros
http://slidepdf.com/reader/full/analizespctros 205/536
IF THEN ELSE ENDIF
rOPEAAND 1 \ / - O P E R A N D 2 7
n u m e r i c W CL(LTb i U . n ume r. i
9 6 P r o g r a m m i n g

8/21/2019 analiz_espctros
http://slidepdf.com/reader/full/analizespctros 206/536
(Continued) IF THEN ELSE ENDIF
Item Description/Default Range Restriction
COMMAND LIST Alphanumeric character. Any spectrum
analyzer command from this section.
VARIABLE
IDENTIFIER
Alpha character. User-defined identifier
declared in VARDEF statement.
AA-22 and _
2- 12 characters required.
Alpha character. Measurement-variable
identifier, such as CF or MA.
Trace element, such as TRA[ lo].
NUMERIC DATA
FIELD
Real
The IF-THEN-ELSE-ENDIF commands form a decision and looping construct. They compare operand 1 to
operand 2. If the condition is true, the command list is executed. Otherwise, commands following ELSE or ENDIF
are executed.
The IF command must be delimited with the ENDIF command.
P r o g r a m m i n g 9 7

8/21/2019 analiz_espctros
http://slidepdf.com/reader/full/analizespctros 207/536
IF THEN ELSE ENDIF (Continued)
The following program uses the IF THEN ELSE ENDIF command to place a marker on the largest signal that is
greater than the threshold level.
10 OUTPTJT718;“IP;LF;TH-38DM;
20 OUTPUT718;“TS;MKPKHI;MA;
30 OUTPUT718;“IFMA,GT,TH
40 OUTPUT718;“THENCF20MZ;80 OUTPUT718;“ELSECF100MZ;TS;MKPKHI;
80 OUTPUT718;“ENDIF;
70 END
The program below does not incorporate the ELSE branch of the IF THEN ELSE ENDIF command. The program
lowers any signal positioned above (off) the analyzer screen.
10 OUTPUT718;“S2;TS;E1;
20 OUTPUT 718;“IfMA,GT,RLTHEN
30 0UTPUT718; REPEATRLUP,TS;E1;
40 OUTPUT7l8;“UNTILMA,LE,RL50 OUTPUT718;“ENDIFS1;
80 END
9 8 Pr o g r a m m i n g

8/21/2019 analiz_espctros
http://slidepdf.com/reader/full/analizespctros 208/536
EX
Exchange A and B
W W
The EX command exchanges traces A and B, point by point.
OUTPUT 718;“EX;"
The functions of the AXB and EX commands are identical. (Refer to Chapter 5 in Section I.)
P r o g r a m m i n g 9 9

8/21/2019 analiz_espctros
http://slidepdf.com/reader/full/analizespctros 209/536
EXP
Exponential
EXP
rDESTINATION T r OPERAND ?SCALING
/- FACTOR 7
Item Description/Default Range Restriction
TRACE LABEL
VARIABLE
IDENTIFIER
Alpha character. User-defined label declared in
TRDEF statement.
Alpha character. User-defined identifier
declared in VARDEF statement.
Alpha character. Measurement-variable
identifier, such as CF or MA.
AA- 22 and _
2- 12 characters required.
AA--and-
2- 12 characters required.
Trace element, such as TRA( lo].
NUMERIC DATA
FIELD
Real
The EXP command processes the operand as follows:
l@porand/rcalmg factor_ destination
The operand and scaling factor are shown in the syntax chart above.
100 Programming

8/21/2019 analiz_espctros
http://slidepdf.com/reader/full/analizespctros 210/536
External Mixing Mode
MW
The EXTMXR command presets the external mixing mode, setting the frequency range from 18.0 GH z to 26.5
GHz. The frequency range is derived from the sixth harmonic of the analyzer local oscillator (LO).
The preset conditions are as follows:
Specifies the fifth LO harmonic as the start harmonic for the signal identification routine. (See NSTART)
Specifies forty-second harmonic as the stop harmonic for the signal identification routine. (See NSTOI?)
Specifies 10 dB as the maximum amplitude difference between a signal and its image. (See SIGDEL.)
On execution of EXTMXR, the active function readout displays the following:
FULLBAND
6(k)
The 6 represents the current LO harmonic. The K represents the frequency band to which the analyzer is tuned.
If a harmonic lock is in effect (KSt or HNLOCK), an 7.” is displayed above the graticule next to the harmonic
number. The conversion loss offset value is annotated to the left of the graticule.
Changing the frequency range with the start and stop frequencies automatically changes the harmonic used for
tuning.
The functions of the EXTMXR and KSU commands, and m keys are identical. See NSTART NSTOR
SIGDEL, HNLOCK, and CNVLOSS.
10 ASSIGN @Sa TO 718
20 OUTPUT @Sa; “Ip, ”30 OUTPUT @Sa;“FA&P)GZ;”
40 OUTPUT @Sa;“S2;TS;”
50 OUTPUT Q Sa; “HNLOCK; ”
60 OUTPUT @Sa;“Sl;”
70 OUTPUT @Sa;“FA8.0GZ;FB12.5GZ;”
80 END
Programming 101

8/21/2019 analiz_espctros
http://slidepdf.com/reader/full/analizespctros 211/536
EXTMXR (Continued)
Line 20: Presets the instrument.
Line 30: Sets a start frequency of 6.0 GHz which automatically selects the second harmonic.
Line 40: Sets the analyzer to single sweep mode and takes one complete sweep of the current display.
Line 50: Locks the second harmonic of the local oscillator.
Line 60: Resets the analyzer to continuous sweep mode.
Line 70: Sets the frequency range of the second harmonic.
The functions of the HNLOCK and KSt commands are identical.
IO2 Programming

8/21/2019 analiz_espctros
http://slidepdf.com/reader/full/analizespctros 212/536
E l
Peak Search
The El command positions the marker at the signal peak. See MKPK
OUTPUT 718;“El;
Programming 103

8/21/2019 analiz_espctros
http://slidepdf.com/reader/full/analizespctros 213/536
E2
Marker to Center Frequency
(MKCF)
The E2 command centers the active marker on the analyzer screen, moving the marker to the center frequency.
OUTF'UT 718; “E2;"
The functions of the E2 and MKCF commands, and the front panel @ key are identical.
104 Programming

8/21/2019 analiz_espctros
http://slidepdf.com/reader/full/analizespctros 214/536
E3
Delta Marker Step Size
MKSS)
(--G---)-Q
The E3 command establishes the center frequency step size as the frequency difference between the delta and
active markers. (See M3 or MKD.)
OUTPUT 718;“E3;
The functions of the MKSS and E3 commands are identical.
Programming 105

8/21/2019 analiz_espctros
http://slidepdf.com/reader/full/analizespctros 215/536
E4
Marker to Reference Level
(MKRL)
The E4 command moves the active marker to the reference level.
OUTPTJT 718;“E4;
The functions of the E4 and MKRL commands, and the front panel @ key are identical.
106 Programming

8/21/2019 analiz_espctros
http://slidepdf.com/reader/full/analizespctros 216/536
FA
Start Frequency
real
The FA command specifies the start frequency value. The function is identical with that of the front panel key The program line below illustrates command syntax.
OTJTPUT718;“FA88MZ;
When queried (? or OA), FA returns the start frequency value, a real number, followed by carriage-return/line-
feed (ASCII codes 13, 10). The end-or-identify state (EOI) is asserted with line feed.
Programming 107

8/21/2019 analiz_espctros
http://slidepdf.com/reader/full/analizespctros 217/536
FB
Stop Frequency
no,The FB command specifies the stop frequency value. The function is identical with that of the front panel ““,
key The program below illustrates command syntax.
OUTPUT 718;"FB 88MZ;
When queried (? or OA), FB returns the stop frequency value, a real number, followed by carriage-return/line-
feed (ASCII codes 13, 10). The end-or-identify state (EOI) is asserted with line feed.
108 Programming

8/21/2019 analiz_espctros
http://slidepdf.com/reader/full/analizespctros 218/536
FFT
Fast Fourier Transform
?DESTINATION -\ rSOURCE 7 rWIND0W-x
FFT
Item Description/Default Range Restriction
TRACE LABEL Alpha character. User-defined label declared in
TRDEF statement.
AA-Z2 and _
2- 12 characters required.
Trace length must be 1008.
For window, TRACE LABEL is also defined
by TWNDOW
The FFT command performs a forward fast fourier transform on a trace array. The results of the transform contain
logged magnitude components only.
The FFT algorithm assumes the source trace array is one period of an infinitely long string of concatenated,
duplicate arrays. Thus, in order to avoid discontinuities when the source trace is concatenated, the beginning andend elements of the source trace array must gradually diminish to the same amplitude value. If the endpoints of the
original trace array were of different amplitudes, the discontinuities in the resulting array series would introduce
false frequency components into the fourier transform. This is illustrated in the following figure.
Programming 109

8/21/2019 analiz_espctros
http://slidepdf.com/reader/full/analizespctros 219/536
FFT (Continued)
ORIGINAL
S A M P L E D l . .
WAVEFORM
ANA LYSIS
I N T E R V A L . l . em .
=SWEEPTIME
SAMPLED
A NA L YTIC .l l
WAVEFORM
The TWNDOW command allows the source trace array to be modified so the amplitude of the trace endpoints
gradually diminish to zero.
The TWNDOW command formats trace arrays with one of three built-in “window” algorithms: HANNING, UNI-
FORM, and FLATTOI? Each simulates a series of equally spaced filters (see figure below). The detected, spectral
line traces the top of the passband while moving from NAf to (N + 1)Af.
110 Programming

8/21/2019 analiz_espctros
http://slidepdf.com/reader/full/analizespctros 220/536
(Continued) FFT
The amplitude and frequency uncertainty of the FFT display depends on the choice of the window, and the
analyzer sweeptime. Amplitude uncertainty is maximum when the spectral component falls midway between the
filter shapes. Passbands that are flatter in shape, like the FLATTOP filter, contribute less amplitude uncertainty, but
frequency resolution and sensitivity are compromised (see TWNDOW)
Of the three algorithms, the FLATTOP has the least amplitude uncertainty and greatest frequency uncertainty.
Worst-case accuracy is - 0.1 dB. Use this passband when transforming periodic signals.
The UNIFORM algorithm has the least frequency uncertainty and greatest amplitude uncertainty. Worst-case
amplitude uncertainty is 3.9 dB and its 3 dB resolution bandwidth is 60% of the HANNING bandwidth. The
UNIFORM algorithm contains no time domain window weighting. Use it for transforming noise signals or tran-
sients that fully decay within one sweeptime period.
The HANNING algorithm is a traditional passband window found in most real time analyzers. It offers a compro-mise between the FLATTOP and UNIFORM shapes. Its amplitude uncertainty is - 1.5 dB, and its 3 dB band-
width is 40% of the FLATTOP bandwidth.
The FFT results are displayed on the spectrum analyzer in logarithmic scale. For the X dimension, the frequency at
the left side of the graph is 0 Hz, and at the right side is Fmax. Fmax can be calculated using a few simple equations
and the sweeptime of the analyzer.
The sweeptime divided by the number of trace array elements containing amplitude information (in this case,
1000) is equal to the sampling period. The inverse of the sampling period is the sampling rate. The sampling rate
divided by two yields Fmax. For example, let the sweeptime of the analyzer be 20 msec. 20 msec divided by 1000
equals 20 psec, the value of the sampling period. The sampling rate is l/20 psec. Fmax equals l/20 pet divided
by 2, or 25 kHz.
The fourier transforms of the window functions are shown in the following figure. Use these graphs to estimateresolution and amplitude uncertainty of a fourier transform display. Each horizontal division of the graphs equals
l/sweeptime or Fmax/500 (which can be calculated from the previous equations), and represents two trace array
elements.
Programming 1 1 1

8/21/2019 analiz_espctros
http://slidepdf.com/reader/full/analizespctros 221/536

8/21/2019 analiz_espctros
http://slidepdf.com/reader/full/analizespctros 222/536
(Continued) FFT
In summary, keep the following in mind when executing FFT:
Perform fourier transforms on trace A, B, or C, or user-defined traces containing 1008 elements only. (FFT
automatically creates a 1008 point array from trace A, B, or C.)
FFT is designed to be used in transforming zero span information into the frequency domain. Performing FFT on a
frequency sweep will result in inaccurate FFT data.
Define a trace window with the TWNDOW command before performing an FFT on a trace.
It is possible to get numbers outside the boundaries of the screen (0 - 1023) after executing an FFT. If the destina-
tion trace is trace A, then the results are automatically clipped. For traces B, C, and user-defined traces, the results
are not automatically clipped. When using these traces, avoid writing in locations outside the boundaries of the
screen.
To get an FFT frequency readout on the FFT trace, use the Marker Read command (MKREAD Fm,,) .
The following is an example of an FFT program.
10 OUTPUT 718; “TFLDEF W-INDOW, 1008;”20 OUTPUT 718;“TWNDOW WeINDOW,HANNING;”
2130 OUTPUT 718;“FFT TFLB,TRA,W-INDOW,”3140 END
Line 10: A trace array of 1008 points is defined as W-INDOW.Line 20: The trace array is formatted according to the HANNING algorithm.
Line 30: An FFT is performed on trace A and the results are stored in trace B.
P r o g r a m m i n g 1 1 3

8/21/2019 analiz_espctros
http://slidepdf.com/reader/full/analizespctros 223/536
FOFFSET
Frequency Offset
integer
Item Description/Default Range Restrictions I
INTEGER Default is hertz.I
I I
The FOFFSET command selects a value that offsets the frequency scale for all absolute frequency readouts, such
as center frequency. Relative values, like span, and delta marker, are not offset.
After execution, the FOFFSET command displays the frequency offset in the active function readout. The offset
value is always displayed beneath the CRT graticule line, as long as the offset is in effect.
The following program returns an offset value of 100 MHz to the controller and prints it on the controller screen.
10 OUTPUT7l8;“FOFFSET100MZ;FOFFSET?;20 ENTER718;N
30 PRINTN
40 END
When queried (?), FOFFSET returns the offset value as a real number, followed by carriage-return/line-feed
(ASCII codes 13, 10). The end-or-identify state (EOI) is asserted with the line feed.
114 Programming

8/21/2019 analiz_espctros
http://slidepdf.com/reader/full/analizespctros 224/536
FORMAT STATEMENTS
01,02,03,04
The spectrum analyzer outputs must be formatted appropriately for the controller and measurement requirements.
The spectrum analyzer transmits decimal or binary values, via the Hewlett-Packard Interface Bus (HP-IB), to a
controller or other HP-IB device, such as a printer. The decimal and binary values represent trace information or
instructions.
The format characteristics are summarized in the table below.
Analyzer Output
Output Example of Marker
Format Amplitude. Marker is at 10 dBmCommand reference level.
Sends trace information only as a decimal value in Hz,
dB, dBm, volts, or seconds.
03 - 10.00
Sends trace amplitude and position information, or
instruction word as decimal values ranging from P, to
4095:
01 1001
P, to 1023 represent positive, unblanked amplitudes
in display units.
1024 to 2047 are instruction words (analyzer
machine language).
2048 to 3071 represent positive, blanked amplitudes
in display units.
3072 to 4095 represent negative, blanked
amplitudes in display units,
Sends trace amplitude and position information, or
instruction word as binary values in two &bit bytes,
sending the most significant bit first. The four most
significant bits are zeroes.Sends trace amplitude information only as binary value
in one 8-bit byte, composed from the 02 output bytes:
o o o o x x x x x x x x x x x 0 2
1 1 //////
x x x x x x x x 0 4
02 ooooxxxx x x x x x x x x
(31 231)
values 0 to 4095
04 x x x x x x x x
250)
values (a to 255 (full scale)
Programming 115

8/21/2019 analiz_espctros
http://slidepdf.com/reader/full/analizespctros 225/536
FORMATSTATEMENTS (Continued)
03 Format
The 03 format transmits trace amplitude information only, in measurement units: Hz, dBm,dB, volts, or seconds.
The 03 format cannot transmit instruction words.
A carriage-return/line-feed (ASCII codes 13, 10) always follows any data output. The end-or-identify state (EOI)
is asserted with line feed.
Instrument preset (IP) automatically selects the 03 format.
01 Format
The 01 format transmits trace amplitude information as decimal values in display units. (See Chapter 4 in Section
I for a description of display units.)
Trace amplitude values can be positive and unblanked, positive and blanked, or negative and blanked. Positive,
unblanked values (0 to 1023) cover the visible amplitude range on the spectrum analyzer CRT
Negative trace values (3072 to 4095) usually result from trace arithmetic, and are not displayed because they are
off (below) the screen. Negative values are represented by the 12-bit two’s complement of the negative number,
that is, 4096 - lnegative value/. For example, a - 300 value is an output of 3796.
4096 - I-3001 = 3796
Positive, blanked values (2048 to 3071) are those responses immediately ahead of the updated, sweeping trace.
These values form the blank-ahead marker, and represent the amplitude responses of the previous sweep, plus
2048. Thus, they are off (above) the screen. (See Appendix B.)
The 01 format also transmits instruction words as decimal values. See the Instruction and Data Word Summary in
Appendix B
A carriage-return/line-feed (ASCII codes 13, 10) always follows any data output in the 01 format. The end-or-
identify state (EOI) is asserted with line feed.
02 Format
The 02 format transmits trace information or instruction words as two 8-bit binary numbers. The most significant
bit is sent first. The four most significant bits are always zeroes.
Most Significant Byte Least Significant Byte
o o o o x x x x x x x x x x x x
Refer to the Consolidated Coding table in Appendix B for instruction word information.
Note that the 02 format sends the same kind of information that the 01 format sends, except that 02 transmits
the information in binary numbers instead of decimal numbers. Also, the end of transmission is not marked by
carriage-return/line-feed (ASCII codes 13, 10) in the 02 format.
116 Programming

8/21/2019 analiz_espctros
http://slidepdf.com/reader/full/analizespctros 226/536
(Continued) FORMATSTATEMENTS
04 Format
The 04 format transmits trace amplitude information only as a binary number. The binary number is one 8-bit byte
composed from the bytes established with the 02 format.
o o o o x x x x x x x x x x x x 0 2
11x x x x x x x x 0 4
The 04 output is the fastest way to transmit trace date from the spectrum analyzer to the HP-IB bus. However, sign
information is lost. Keep this in mind when transmitting delta marker information (MKD). The end of data trans-
mission is not marked by a carriage-return/line-feed.
Format Statements and the HP-IB Bus
The table below shows a transmission sequence on the HP-IB bus for each of the four formats. Each format is
transmitting the amplitude of a marker positioned at the - 10 dBm reference line.
Format
Vte
Byte
Byte
Byte
Byte
Byte
Carriage Return
Line Feed
(EOI asserted)
0 3 01 0 2 0 4
NUM (-) NUM (“1”) 3) 250)
NUM (1) NUM “@“, 231)
NUM (8) NUM (“ d”)
NUM ) NUM (“1”)
NUM 8) 13
NUM 8) 10
13
10
Though the spectrum analyzer transmits either binary or digital information on the HP-IB bus, a decimal number is
always returned to the controller display. This is illustrated in the program below, which reads the instruction word
1040 at display address 8, the fist memory location of trace A. The program reads the instruction word, usingeach of the formats, and the DR command.
1 ASSIGN @Sa TO 7 182 PRINTER IS 7014 OUTPUT @Sa;“Al;SB;TS;”10 OUTPUT @Sa;“DA 0 01 DR”20 ENTER @Sa;Drl30 OUTPUT @a; “ DA 0 02 DR”40 ENTER @Sa USING “# W”:Dr2
P r o g r a m m i n g 1 1 7

8/21/2019 analiz_espctros
http://slidepdf.com/reader/full/analizespctros 227/536
FORMATSTATEMENTS (Continued)
5 0 OUTPUT @Sa; “ DA 0 03 DR ”
6 0 E N T E R @Sa;Dr3
7 0 OUTPUT @Sa; “ DA 0 04 DR”
8 0 ENTER @Sa USING “#,B”;Dr4
9 0 P R I N T Drl,DrB,Dr3,Dr4
100 END
Running the program above produces the following responses on the controller display. Note that all the responses
are decimal numbers. Also note that the 03 and 04 formats do not return the correct data. (As mentioned above,
03 and 04 do not transmit instruction words.)
01 FORMAT response: 1040
02 FORMAT response: 1040
03 FORMAT response : - 200.8
04 FORMAT response: 4
Controller Formats
The format of the controller must be compatible with the output format of the analyzer.
Analyzer
Format
Requirements
Controller Format
Example Statement and Analyz-
er Response
0 1 free field ENTER 718; PK-AMPLITUDE
Response: 1001
0 3
0 2
field size dependent on output, use freefield format
binary, read twice for each value
ENTER 718; PK-AMPLITUDEResponse: - 10.0
ENTER 7 18 USING “#, W”
Response: 1001
0 4 binary, read once for each value ENTER 718 USING “#,B”
Response: 250
NOTE
The 0 in 01,02,03, and 04 is the letter 0 and not the number zero.
1 1 8 P r o g r a m m i n g

8/21/2019 analiz_espctros
http://slidepdf.com/reader/full/analizespctros 228/536
FPKA
Fast Preselector Peak
The FPKA command automatically adjusts the preselector frequency to yield the greatest signal level at the active
marker. The FPKA command peaks the preselector faster than the preselector-peak command, PI?
Although this command can be executed in all frequency spans, it performs best when the instrument is in zero
span. Use the standard preselector peak for all other frequency spans.
P r o g r a m m i ng 1 1 9

8/21/2019 analiz_espctros
http://slidepdf.com/reader/full/analizespctros 229/536
FS
Full Span
The FS command selects the full frequency span of 0 - 2.5 GHz.
OUTPUT 718; “FS; ”
The functions of the commands FS and LF; and the front-panel m function, are identical.
1 2 0 P r o g r a m m i n g

8/21/2019 analiz_espctros
http://slidepdf.com/reader/full/analizespctros 230/536
FULBAND
Full Band (External)
FULBAND
I Item Description/Default Range Restriction I
INTEGER Specifies waveguide band. 6to 17 I
Band Frequency Range Mixing Harmonic
6 K) 18.0- 26.5 GH z
7 (A) 2 6 . 5 - 4 0 . 0
8 Q) 33.0- 50.09 U) 40.0- 60.0
10 W) 50.0- 75.0
11 El 60.0- 90.0
12 w 75.0- 110.0
13 F) 90.0- 140.0
14 0) llO.O- 170.0
15 G) 140.0- 220.0
16 WI 170.0- 260.0
17 J) 220.0- 325.0
6+
8+
lO+lO+
14+
16+
18+
24+
30+
36+
44+
54+
The FULBAND command sets the start and stop frequencies for the analyzer external mixing bands. In the tableabove, the start and stop frequencies for each band are shown in the Frequency Range column. On execution of
the FULBAND command, a harmonic lock (HNLOCK) is automatically executed. (See HNLOCK.)
Programming 12 1

8/21/2019 analiz_espctros
http://slidepdf.com/reader/full/analizespctros 231/536
FUNCDEF
Function Define
p STRING DATA F I ELD \
FUNCDEF iunct ion
I abetstring command
del imi ter ist
p A -BLOCK DATA F IELD \
iength
p I - B L O C K D A T A F I E L D ‘ -\
Item Description/Default Range Restriction
COMMAND LIST
LENGTH
Any spectrum analyzer commands from thisRemote section.
Two &bit bytes specifying length of commandlist, in 8-bit bytes. The most significant byte is
first: MSB LSB
Command list length is
limited to 2015 characters,
including carriage return (CR)and line feed (LF).
STRING Must match. Marks beginning and end of DELIMITER command list.
“ %&‘/: = @\S2
1
J
The FUNCDEF command defines a program routine as a function label. After FUNCDEF is executed, the com-
mand list is executed whenever the function label is encountered.
Once the function label is defined, it can be loaded into a softkey which can be executed remotely, or locally from
the front panel.
When queried (?) , FUNCDEF returns the command list in an A-block data format.
(See KEYDEF and KEYEXC.)
122 Programming

8/21/2019 analiz_espctros
http://slidepdf.com/reader/full/analizespctros 232/536
CR
Graph
integer
Item Description/Default Range Restriction
INTEGER Represents display memory Y-axis values. PI- 4095 The GR command, in the trace modes of operation only, plots HP-IB inputs as graphs on the analyzer CRT It is
also used with auxiliary function codes to modify the appearance on the CRT of stored trace data (highlighting a
portion of the trace, for example). Following the GR command, HP-IB inputs in y (amplitude) display units are
entered on the CRT, starting at the far left side of the display For each y display unit added to the trace, the x
(horizontal) coordinate is automatically advanced one display unit to the right.
Execution of the GR command tells the analyzer to start plotting a graph at the amplitude point indicated by thenext y (amplitude) coordinate received from the HP-IB input. This first amplitude point, yl, appears at the left of
the display; successive points are then plotted, and the lines connecting them are drawn from left to right within the
display area limits. (The display area size is established with display size command Dl, D2 , or D3, or the bex
programming instruction .)
A sample program using the GR command is shown below.
10 ASSIGN @Sa TO 718;FORMAT ON20 OUTPUT @SA;“IP;LF;FA200KZ;FB5MZ;S2;GR”30 FORN=lTO400
40 OUTPUT@Sa;400-
(3.5/4)*N50 NEXTN
60 FOR N = 401 TO 100070 OUTPUT @%a;30080 NEXTN
90 OUTPUT @Sa;“KSi;TS;KSk;B3$2;TS;”100 OUTPUT @Sa;“HD;EM;KSo;DT@;”110 FORN=ltollSTEP2120 OUTPUT @Sa;“DB;PU;PA 50”;(90*N)- 2O;“LB”;(lO*N)- lo;“@”130 NEXTN140 OUTPUT @Sa;“B4”150 OUTPUT @Sa USING “K,B,B,K “;“DB;PU;PA 0,600 LBdB”; 10,13;OUT OF SPEC@”160 OUTPUT @Sa;“D3;PA 100,500 LB RADIATED INTERFERENCE, 2OOkHz- SMHz@”
170 END
Line 20:
Lines 30 to 80:
Line 90:
Line 200:
Lines 110 to 160:
Initiates the graph mode. The IP insures that the graphing starts at the beginning of trace
C.
Writes test limit values into the trace C memory.
Sends graph data to trace B memory and enables A- B- >A.
Clears the active function readout (HD), prepares trace C for input (EM), clears the dis-
play annotation (KSo) , and sets the label terminator to @.
Labels the graticule.
P r o g r a m m i n g 1 2 3

8/21/2019 analiz_espctros
http://slidepdf.com/reader/full/analizespctros 233/536
GRAT
Graticule
GRAT
The GRAT command turns the graticule on and off.
0UTPUT718; GRAT;
When queried (?) , GRAT returns the graticule state: ON or OFF
(See also KSn and KSm.)
124 Programming

8/21/2019 analiz_espctros
http://slidepdf.com/reader/full/analizespctros 234/536
HD
Hold Data Entry
(-X->-c;)
The HD command disables data entry via the front panel DATA keyboard and blanks the active function readout.
OUTPUT 718; “HD; ”
Programming 125
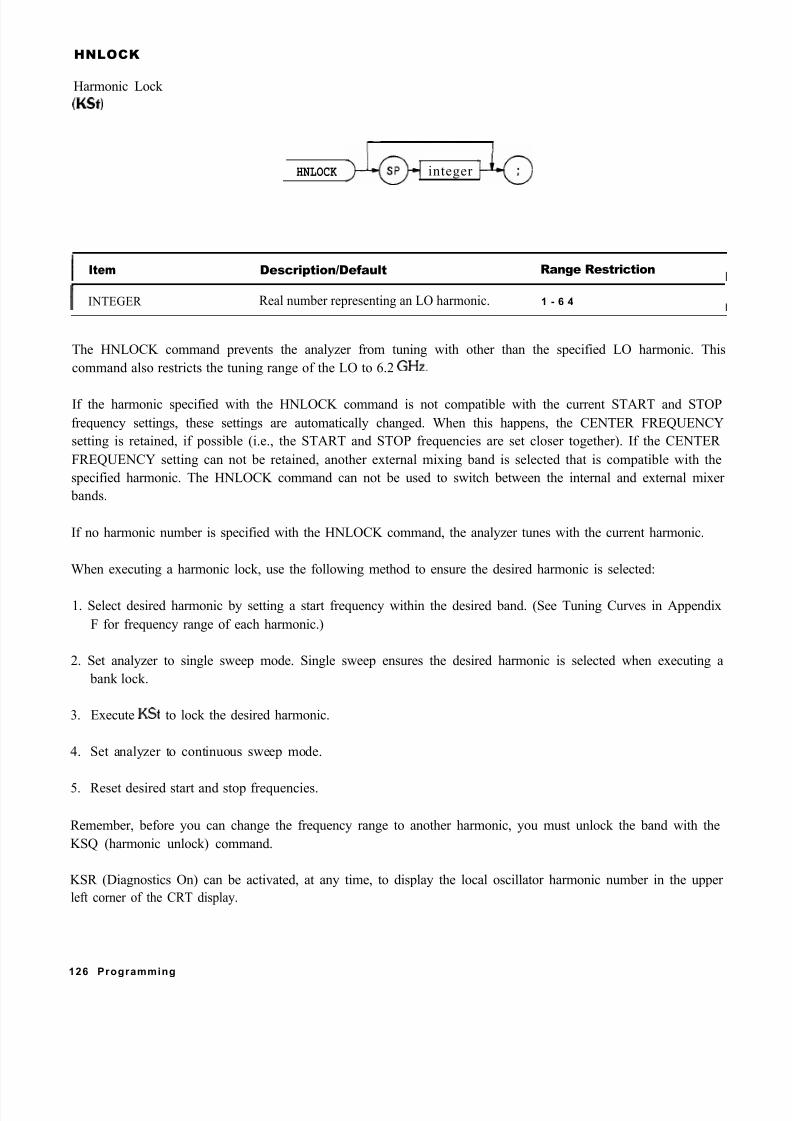
8/21/2019 analiz_espctros
http://slidepdf.com/reader/full/analizespctros 235/536
HNLOCK
Harmonic Lock
(KW
HNLOCK integer
Item Description/Default Range RestrictionI
INTEGER Real number representing an LO harmonic. 1 - 6 4I
The HNLOCK command prevents the analyzer from tuning with other than the specified LO harmonic. This
command also restricts the tuning range of the LO to 6.2 GHz.
If the harmonic specified with the HNLOCK command is not compatible with the current START and STOP
frequency settings, these settings are automatically changed. When this happens, the CENTER FREQUENCY
setting is retained, if possible (i.e., the START and STOP frequencies are set closer together). If the CENTER
FREQUENCY setting can not be retained, another external mixing band is selected that is compatible with the
specified harmonic. The HNLOCK command can not be used to switch between the internal and external mixer
bands.
If no harmonic number is specified with the HNLOCK command, the analyzer tunes with the current harmonic.
When executing a harmonic lock, use the following method to ensure the desired harmonic is selected:
1. Select desired harmonic by setting a start frequency within the desired band. (See Tuning Curves in Appendix
F for frequency range of each harmonic.)
2. Set analyzer to single sweep mode. Single sweep ensures the desired harmonic is selected when executing a
bank lock.
3. Execute KSt to lock the desired harmonic.
4. Set analyzer to continuous sweep mode.
5. Reset desired start and stop frequencies.
Remember, before you can change the frequency range to another harmonic, you must unlock the band with the
KSQ (harmonic unlock) command.
KSR (Diagnostics On) can be activated, at any time, to display the local oscillator harmonic number in the upper
left corner of the CRT display.
126 Programming

8/21/2019 analiz_espctros
http://slidepdf.com/reader/full/analizespctros 236/536
(Continued) HNLOCK
10 ASSIGN @Sa TO 71820 OTJTPUT @Sa; “Yp,”
30 OUTPUT @Sa;“FAG.P)GZ;”
40 OUTPUT @Sa; “S2;TS;”
50 OUTPTJT @Sa; “HNLOCK;”
60 OUTPUT @Sa;“Sl;”
70 OU’ITUT @Sa;“FAS.PIGZ;FB12.5GZ;”
80 END
Line 20: Presets the instrument.
Line 30: Sets a start frequency of 6.0 GHz which automatically selects the second harmonic.
Line 40: Sets the analyzer to single sweep mode and takes one complete sweep of the current display.
Line 50: Locks the second harmonic of the local oscillator.
Line 60: Resets the analyzer to continuous sweep mode.
Line 70: Sets the frequency range of the second harmonic.
The functions of the HNLOCK and KS t commands are identical.
Programming 127

8/21/2019 analiz_espctros
http://slidepdf.com/reader/full/analizespctros 237/536
HNUNLK
Harmonic Bank Unlock
WQ
The HNUNLK command removes the harmonic lock established with the HNLOCK command, thus allowing the
analyzer to tune over the whole input frequency range.
The functions of the HNUNLK and KSQ commands are identical.
128 Programming

8/21/2019 analiz_espctros
http://slidepdf.com/reader/full/analizespctros 238/536
IB
Input B
The IB command transmits the contents of an array, located in the controller to trace B memory. Use IB with the
02 format, which formats data in two &bit bytes.
The IB command cannot be executed when it is followed by a carriage-return/line-feed. Two examples of termi-
nating the IB command are shown below:
OUTPUT 718;“IB;“;
OUTPUT 718 USING “#, k”;“IB;”
The program below demonstrates the use of IB.
10 ASSIGN @Sa TO 718;FORMAT ON20 ASSIGN @@a-bin TO 718;FORMAT OFF30 INTEGER BZOO( 1: 1001)40 OUTPUT @Sa;“CF200MZ Bl;A4;RB30KZ;SP2MZ;S2;TS;”50 OUTPUT @Sa; “02TB”60 ENTER @Sa_bin;B200( *)70 OUTPUT @Sa;“CFlOOMZ;RB30KZ;SPlMZ;TS;”80 PAUSE
90 OUTPUT @Sa;“IB”;100 OUTPUT @Sa_bin;B200( *)
110 END
Line 30:
Line 40:
Declares, dimensions, and reserves memory for array BZOO.
Blanks trace A and sets the analyzer to 200 MHz center frequency. Selects single sweep mode,
and sweeps trace B.
Lines 50 and
6 0 : Stores trace B (in binary) in controller array.
Line 70: Sets analyzer to 100 MHz center frequency. Sweeps trace B with new data.
Line 90: Prepares analyzer to receive previous trace B data.
Line 100: Sends trace B data to analyzer.
Programming 129

8/21/2019 analiz_espctros
http://slidepdf.com/reader/full/analizespctros 239/536
ID
Identify
The ID command returns the instrument identity to the controller: HP 8568B or HP 8566B.
OUTPUT 718;“ID;
130 Programming

8/21/2019 analiz_espctros
http://slidepdf.com/reader/full/analizespctros 240/536
IDSTAT
Signal Identifier Status
IDSTAT
The IDSTAT command returns a 1,8, or - 1, representing the completion status of the signal identifier routine, to
the controller.
The 1 means the signal was found, indicating signal identification routine identifies signal and moves signal to
center screen. The pI means signal was not found, analyzer recalled register 7. The - 1 means the signal was
found, indicating signal identification routine found signal but did not move signal to center screen because of a
harmonic lock (see HNLOCK) .
10 OUTPUT 718;“IDSTAT?;”
20 ENTER 718;N30 PRINT N
4 0 E N D
See SIGID or KSv.
Programming 131

8/21/2019 analiz_espctros
http://slidepdf.com/reader/full/analizespctros 241/536
IF THENELSEENDIF
rOPERAND 1 -\ rOPERAND 2 I
v a r i a b l ei d e n t i f i e r
n u m e r i cd a t a f i e l d
v a r i a b l ei d e n t i f i e r
n u m e r i cd a t a f i e l d
THEN
commandI i s t
commandI i s t
Item
COMMAND LIST
Description/Default
Alphanumeric character. Any spectrum
analyzer command from this section.
Range Restriction
VARIABLEIDENTIFIER
Alpha character. User-defined identifier declared in VARDEF statement.
Alpha character. Measurement-variable
identifier, such as CF or MA.
AA-22 and _Z- 12 characters required.
Trace element, such as TRA[ lo].
NUMERIC DATA
FIELD
Real
The IF-THEN-ELSE-ENDIF commands form a decision and looping construct. They compare operand 1 to
operand 2. If the condition is true, the command list is executed. Otherwise, commands following ELSE or ENDIF
are executed.
The IF command must be delimited with the ENDIF command.
1 3 2 P r o g r a m m i n g

8/21/2019 analiz_espctros
http://slidepdf.com/reader/full/analizespctros 242/536
(Continued) IF THENELSEENDIF
The following program uses the IF THEN ELSE ENDIF command to place a marker on the largest signal that is
greater than the threshold level.
10 OTJTPUT718;“IP;LF;TH-35DM;20 OUTPTJT718;“TS;MKPKHI;MA;30 OUTPUT718;“IFMA,GT,TH
40 0TJTPUT718;“THENCF20MZ;50 OUTPUT7l8;“ELSECF100MZ;TS;MKPKHI;60 OUTPUT718;“ENDIF;70 END
The program below does not incorporate the ELSE branch of the IF THEN ELSE ENDIF command. The program
lowers any signal positioned above (off) the analyzer screen.
10 OUTPUT718;“S2;TS;E1;20 OUTPUT718;“IFMA,GT,RLTHEiN30 0UTPUT718;“REPEATRLUP,TS;E1;40 OUTPUT718;“UNTILMA,LE,RL
50 OUTPUT718;“ENDIFS1;60 END
P r o g r a m m i n g 1 3 3

8/21/2019 analiz_espctros
http://slidepdf.com/reader/full/analizespctros 243/536
IP
Instrument Preset
The instrument preset command, IP executes the following commands:
CLRW A (Al)
BLANK B (B4)
CR
CA
c s
CT
c v
AMB OFF (Cl)
FAFB
HD
AUNITS DBM (KSA)
VAVG OFF (KSH)
DET NRM (KSa)
MKNOISE OFF (KSL)
DET NRM (KSa)
GRAT ON (KSn)
KSPLG
MKTRACK OFF (MT@
MKOFF (Ml)
CONTS (Sl)
THE OFF (TO)
TM FREE (Tl)
TDF P (03)
DA
Dl
PD
R3
MKPZ 6dB
MDS W
DISPOSE ONEOS
DISPOSE ONSWP
DISPOSE TRMATH
MKPAUSE OFF
Clears and writes trace A.
Blanks trace B .
Couples resolution bandwidth.
Couples input attenuation.
Couples step size.
Couples sweep time.
Couples video bandwidth.
Turns off A-B mode.
Sets start frequencySets top frequency.
Hold
Selects dBm amplitude units.
Turns off video averaging.
Selects normal detection mode.
Turns off noise markers.
Selects normal detection mode.
Turns on graticule .
Turns on characters.
Selects lOdB/DIV log scale.
Turns off marker tracking.Turns off markers.
Selects continuous sweep mode.
Turns off threshold.
Selects free run trigger.
Selects 03 output format.
Selects 3072 as the current address.
Selects normal display size.
Puts pen down at current address.
Allows SRQ 110.
Selects data size of one word, which is two 8-bit bytes.Erases command list associated with the end of the sweep. (See ONEOS.)
Erases command list associated with the beginning of the sweep. (See ONSWF? )
Erases command list associated with the end of the sweep. (See TRMATH.)
Turns off marker pause mode.
In addition, IP re-assigns user-defined variables to their initial values, specified by the VARDEF command.
134 Programming

8/21/2019 analiz_espctros
http://slidepdf.com/reader/full/analizespctros 244/536
(Continued) IP
Instrument preset automatically occurs when you turn on the analyzer, and is a good starting point for many
measurement processes, especially when followed by the TS command. (When IP is executed remotely, the
analyzer does not necessarily execute a complete sweep.)
OTJTF’UT 718; “ 1P;TS;”
P r o g r a m m i n g 1 3 5

8/21/2019 analiz_espctros
http://slidepdf.com/reader/full/analizespctros 245/536
KEYDEF
Key Define
KEYDEF f u n c t i o n l a b e l
Item Description/Default Range RestrictionI
KEY NUMBER
FUNCTION LABEL
Integer 0 through 999
Alpha character. User-defined label declared in AA---and-
FUNCDEF statement. 2- 12 characters required.
The KEYDEF command associates a numbered key with a programming routine, which can be executed remotely
or from the front panel.
The program below stores a routine in key 999. The program, contained in lines 20 through 70, increases the
reference level until the signal peak is below the reference level. The routine is assigned a name with the FUNC-
DEF command, and then assigned to key 999. Note that the program is delimited with single’ quotation marks.
10 OUTPUT 718;“FUNCDEF ROUTINE,” ” ”
20 OTJTPTJT 718;“52; T&El;”
30 OUTPUT 718;“IF MA&IT&L THEN”
40 OUTPUT 718;“REPEAT RL UP;TS;El;”
50 OUTPUT 718;“UNTIL MA,LE,RL”
60 OUTPUT 718;“ENDIF Sl;” ” ”
70 OUTPUT 718;“KEYDEF 999,ROUTINE;”
80 EN D
Line 10:
Lines 20 through 70:
Line 70:
Assign ROUTINE as the name of the routine in lines 20 - 70.
Execute a peak search. If the marker amplitude is greater than the reference level,
increase the reference level until it is greater than the marker amplitude.
Store the routine in the analyzer, and assign it to key 999.
To execute key 999 remotely, use the KEYEXC command:
OUTPUT 718; “XEYEXC 999”
1 3 6 P r o g r a m m i n g

8/21/2019 analiz_espctros
http://slidepdf.com/reader/full/analizespctros 246/536
(Continued) KEYDEF
To execute key 999 from the front panel, press these front panel keys:
~@@(g@
Once a key is defined, the routine is saved, even when the analyzer loses power or is preset. Use the DISPOSE
command to clear a user-defined key
When queried, KEYDEF returns the command list in a A-block data format. (See DISPOSE, KEYEXC, and
FUNCDEE)
l When quotation marks are nested, use two quotes “‘I) for the inner marks, and one quote “) for the outer mark, as shown in lines 10
and 60.
Programming 137

8/21/2019 analiz_espctros
http://slidepdf.com/reader/full/analizespctros 247/536
KEYEXC
Key Execute
Item Description/Default Range Restriction
I KEY NUMBER INTEGER. User-defined key number delcared 0 to 999in KEYDEF statement.
The KEYEXC command executes the specified defined key. The program below executes key 2, which contains a programming routine called M-AIN. The routine consists of several user-defined functions, declared with the
FUNCDEF command, which sweep the analyzer over different frequency ranges.
1 OUTPTJT718;“FUNCDEFM_AIN, “ “PRESET;TS;FIRST;TS;SECOND;TS;THIRD;TS;10 0lJTPUT718;“FUNCDEFPRESET, “IP;LF;S2;20 OUTPUT718;“FUNCDEFFlRST, “FA100MZ;FB3OOMZ;30 OUTPUT7l8;“FTJNCDEFSECOND, “FA5OOMZ;FB7OOMZ;40 OUTPTJT7l8;“FUNCDEFTHIRD, “FA800MZ;FBlOOOMZ;50 OUTPUT718;“KEYDEF 2,M-AIN;”
50 END
138 Programming

8/21/2019 analiz_espctros
http://slidepdf.com/reader/full/analizespctros 248/536
KSA
Amplitude in dBm
The KSA command sets the amplitude readouts (reference level, marker, display line, and threshold) to dBm
units.
OUTPUT 718;“KSA;
A
The KSA command is identical to manual operation of the front panel (,,,, (,,,, keys, (See AUNITS.)
Programming 139

8/21/2019 analiz_espctros
http://slidepdf.com/reader/full/analizespctros 249/536
KSB
Amplitude in dBmV
The KSB command sets the amplitude readouts (reference level, marker, display line, and threshold) to dBmV
units.
OUTPUT 718;“KSB;
B
The KSB command is identical to manual operation of the front panel m m keys. (See AUNITS.)
140 Programming

8/21/2019 analiz_espctros
http://slidepdf.com/reader/full/analizespctros 250/536
KSC
Amplitude in dBuV
The KSC command sets the amplitude readouts (reference level, marker, display line, and threshold) to dBuV
units.
OUTPUT 718; “KSC;”
The KSC command is identical to manual operation of the front panel [,,,, h keys. (See AUNITS.)
Programming 141

8/21/2019 analiz_espctros
http://slidepdf.com/reader/full/analizespctros 251/536
KSD
Amplitude in volts
The KSD command sets the amplitude readouts (reference level, marker, display line, and threshold) to V units.
OUTPUT 718;‘KSD;”
D
The KSD command is identical to manual operation of the front panel (,,,, a keys. (See AUNITS.)
142 Programming

8/21/2019 analiz_espctros
http://slidepdf.com/reader/full/analizespctros 252/536
KSE
Title Mode
KSE
Item
Character
REAL
Terminator
Description/Default
Represents text displayed on screen.
Represents text displayed on screen.
Character defined in OT command that
terminates text.
Range Restriction
ASCII codes 32 through 126.
ASCII codes 0 through 255
Carriage Return Terminates text. ASCII code 13
Line Feed Terminates text. ASCII code 10
etx Terminates text. (End-of-text)
The KSE command activates the title mode. This function writes a message in the top CRT display line.
Any character on the controller keyboard can be written. The full width of the display is available for writing a
maximum of 58 characters. However, the marker readout may interfere with the last sixteen characters of the title.
The message must be terminated. Terminate the message with one of the following:
A terminator defined with the DT command.
Carriage-return (ASCII 13).
Line-feed (ASCII 10).
End-of-text command (controller dependent).
Programming 143

8/21/2019 analiz_espctros
http://slidepdf.com/reader/full/analizespctros 253/536
KSE (Continued)
To erase the message, execute instrument preset (IP) or recall an instrument state with the RCLS or RC command.
The message can also be erased by executing a KSE command that does not contain a message, as in the program
below.
Line 10: Instrument preset.
Line 20: Activates the title mode and writes “Adjust Antenna” in the top CRT display line.
Line 30: Pauses program until CONTINUE is pressed on the HP series 200 controller.
Line 40: Prints a blank message on the screen; thus blanking the “Adjust Antenna” message.
The HP series 200 computers execute a carriage-return/line-feed whenever the ENTER key is pressed. Thus,
lines 20 and 40 of the program above terminate the message this way The same program is shown below, but the
KSE command message is terminated with a terminator defined by the DT command.
10 OUTPUT 718;“DTQ;”20 OUTPUT 718;“KSEAdjust Antenna@;”30 PAUSE
40 OUTPUT 718; “KSE”
50 END
Line 20 can also be terminated with a carriage-return this way:
20 OUTPUT 718; “KSEAdjust Antenna”;CHR$(l3)
E
The functions of the KSE command and the m m keys are identical.
144 Programming

8/21/2019 analiz_espctros
http://slidepdf.com/reader/full/analizespctros 254/536
KSF
Shift YTO
The KSF command is a diagnostic aid used for servicing the spectrum analyzer.
The KSF command removes the IF offset from the YIG-tuned oscillator so that the start frequency can be tuned
directly from the front panel.
F
The functions of the KSF command and the m [:‘;1 keys are identical.
Programming 145

8/21/2019 analiz_espctros
http://slidepdf.com/reader/full/analizespctros 255/536
KSG
Video Averaging On
KSG
The KSG command enables video averaging. During video averaging, two traces are displayed simultaneously.
Trace C contains signal responses as seen at the input detector. Trace A or B contains the same responses digitally
averaged. The digital reduces the noise floor level, but does not affect the sweep time, bandwidth, or any other analog characteristics of the analyzer.
Before executing KSG, select trace A or B as the active trace (CLRW) and blank the remaining trace.
The active function readout indicates the number of sweeps averaged; the default is 100 unless otherwise speci-
fied. Increasing the number of sweeps averaged increases the amount of averaging.
Use KSG to view low level signals without slowing the sweep time. Video averaging can lower the noise floor more
than a 1 Hz video bandwidth can, if a large number of sweeps is specified for averaging. Video average may also
be used to monitor instrument state changes (such as changing bandwidths or center frequencies) while maintain-
ing a low noise level. (See Chapter 11 in Section I. Also see KSH and VAVG .)
OUTPUT 718;“KSG;"
G
The functions of the KSG command and the @ m keys are identical.
146 Programming

8/21/2019 analiz_espctros
http://slidepdf.com/reader/full/analizespctros 256/536
KSH
Video Averaging off
The KSH command disables e video averaging function of the analyzer. The KSH command is identical with
manual operation of the ( , . I , fz-& keys.
OTJTPUT 718;“KSH;”
(See KSG and VAVG .)
Programming 147

8/21/2019 analiz_espctros
http://slidepdf.com/reader/full/analizespctros 257/536
KSI
Reference Level Range (Extended)
The KS1 command extends the analyzer reference level range to maximum limits of - 139.9 dBm and + 60
dBm. The functions of the KS1 command and the m l& , keys are identical.
The lower limit of the reference level depends on resolution bandwidth and scale selection, log or linear. When the
reference level is set at minimum, the level may change if either resolution bandwidth or scale selection is changed.
The table below shows the relationship between the scale and/or the resolution bandwidth, and the reference level
range.
The extended reference level range is disabled with an instrument preset (II?)
Scale
log
log
linear
linear
Resolution
Bandwidth
Minimum reference level
with extended reference level
10 dB attenuation 0 dB attenuation
11 kHz - 129.9 dBm
13 kHz - 109.9 dBmIikHz - 109.9 dBm
13 kHz - 89.9 dBm
- 139.9 dBm
- 119.9 dBm- 119.9 dBm
- 99.9 dBm
148 Programming

8/21/2019 analiz_espctros
http://slidepdf.com/reader/full/analizespctros 258/536
KSJ
DAC Control
KSJ
Item Description/Default
Carriage Return Sets all DACs to the specified value.
Line Feed Sets all DACs to the specified value.
etx Asserts end of text.
Range Restriction
ASCII code 13
ASCII code 10
The KSJ command is a diagnostic aid used for servicing the spectrum analyzer.
The KSJ command allows the DACs on the Al6 Scan Generator and the A19 Digital-Analog Converter to be
manually controlled from the front panel.
J
The functions of the KSJ command and the (,,,, m keys are identical.
Programming 149

8/21/2019 analiz_espctros
http://slidepdf.com/reader/full/analizespctros 259/536
KSK
Marker to Next Peak
If an active marker is on screen, KSK moves the marker to the next signal peak of lower amplitude.
See MKPK.
The functions of the KSK command and the (snln b keys are identical.
150 Programming

8/21/2019 analiz_espctros
http://slidepdf.com/reader/full/analizespctros 260/536
KSL
Marker Noise Off
The KSL command disables the noise level function which displays the RMS noise level at the marker. (See
MKNOISE or KSM.)
KSL does not blank the marker. Use MKOFF or Ml to blank the marker. (Because MKOFF and M2 remove the
marker from the screen, they also disable the noise level mode.)
10 OIJTRJT718;“MKF50MZ;
20 OUTPUT718;“KSM;30 OUTPUT718;“KSL;40 OUTPUT 718;“Ml;50 END
Line 10:
Line 20:
Line 30:
Line 40:
Positions marker at 50 MHz.
Selects noise level mode.
Turns off noise level mode.
Blanks marker.
L
The functions of the KSL command and [,,,, a keys are identical.
Programming 151

8/21/2019 analiz_espctros
http://slidepdf.com/reader/full/analizespctros 261/536
KSM
Marker Noise On
KSM
The KSM command displays the RMS noise level at the marker. The RMS value is normalized to a 1 Hz band-
width.
The KSM command averages the amplitude of 32 elements about the location of the marker, in the frequency or
time scale. The average value is converted to the current reference level unit (dBm, dBmV dBuV, or volts).
The noise level function measures accurately to within 10 dB of the analyzer’s own internal noise level. The
readout resolution is + - 0.1 dB.
OUTPUT 718;“KSM;”
M
The functions of the KSM command and the [,,,, IIM*lll keys are identical. See also MKNOISE and KSO.
152 Programming

8/21/2019 analiz_espctros
http://slidepdf.com/reader/full/analizespctros 262/536
Marker Minimum
(MKMIN)
The KSN command moves the active marker to the minimum value detected. (See also MKMIN.)
OUTPUT 718; “KSN; ”
The functions of the KSN and MKN commands are identical. See MKPK.
N
The functions of the KSN command and the a m keys are identical.
Programming 153

8/21/2019 analiz_espctros
http://slidepdf.com/reader/full/analizespctros 263/536
KS0
Marker Span
(MKSP)
The KS0 command operates only when the delta marker is on. (See MKD or M3.) When the delta marker is on,
and KS0 is executed, the delta marker and active marker specifies start frequency, and the right marker specifies
stop frequency If delta marker is off, there is no operation.
OUTPUT 718;“KSO;”
The functions of the MKSP and KS0 command are identical.
0
The functions of the KS0 command and the m m keys are identical.
154 Programming

8/21/2019 analiz_espctros
http://slidepdf.com/reader/full/analizespctros 264/536
KSP
HP-IB Address
Item
Integer
Description/Default Range Restriction
Id thru 30
The KSP command enables the user to display or change the current read/write HP-IB address of the analyzer.
The KSP command is identical with manual operation of the front panel (,,,, ’a
keys.
OUTPUT 718;“KSP 15HZ;”
Programming 155

8/21/2019 analiz_espctros
http://slidepdf.com/reader/full/analizespctros 265/536
KSQ
Band Unlock
The KSQ command unlocks the analyzer from a specific band (harmonic number). The functions of the KSQ
command and the front panel m Q@sJ
keys are identical.
Either one of the full span keys, @ or m, will also unlock a preselected band.
OUTPUT 718; “KSQ;”
The functions of the KSQ and HNUNLK commands are identical.
156 Programming

8/21/2019 analiz_espctros
http://slidepdf.com/reader/full/analizespctros 266/536
KSR
Diagnostics On
The KSR command is a diagnostic aid used for servicing the spectrum analyzer.
The KSR command displays specific internal frequency control parameters in the upper left corner of the CRT
display. These parameters are the programmed values determined by the Controller Assembly, A15.
The following is a sample of what might appear when KSR is executed.
(1) 400
(2) P)BpI
(3) 1 25 13
(4) lSg.769 231
( 5 ) 15kwBer m J
6) 168.816 Bldp,
Line -1:
Line 2:
Line 3:
Displays the YIG-tuned oscillator (YTO) start frequency in GHz.
Displays the 2@/3pI loops frequency.
Displays the band number, M phase-lock-loop divide number, and N phase-lock-loop divide num-
ber.
Line 4: Displays the M/N loop frequency.
Line 5: Displays the phase-lock-loop 2 (PLL2) voltage-controlled oscillator (VCO) frequency.
Line 6: Displays the phase-lock-loop 3 (PLL3) voltage-controlled oscillator (VCO) frequency.
NO TE
In line 6, an asterisk (*) appears in front of the VCO frequency when the span width is
greater than the LO harmonic number times 100 kHz, or the span width is less than or equal to the LO harmonic number times 5 MHz.
The asterisk indicates that the VCO frequency is not used to determine the 2121/3121 loop frequencyR
The functions of the KSR command and the @ [:::;Ll keys are identical.
Programming 157

8/21/2019 analiz_espctros
http://slidepdf.com/reader/full/analizespctros 267/536
KSS
Fast HP-IB Remote Operation
The KSS command enables fast HP-IB operation that allows the analyzer to operate faster than normal under
remote operation.
Fast HP-IB operation (KSS) remains in effect until deactivated by one of the following commands: IP LF, KSU,
RCLS, or a local message (e.g. LOCAL 718).
For further information on the KSS command, refer to Appendix E.
S
The functions of the KSS command and the @ @ keys are identical.
158 Programming

8/21/2019 analiz_espctros
http://slidepdf.com/reader/full/analizespctros 268/536
KS-I-
Fast Preset 2-22 GHz
The KST command enables a fast preset (2-22 GHz), similar to an instrument preset (IP) ypt that the internal
bus check is not performed. The functions of the KST command and the front panel m
0keys are identical.
0
For additional information on fast operation, refer to Appendix E.
Programming 159

8/21/2019 analiz_espctros
http://slidepdf.com/reader/full/analizespctros 269/536
KSU
Fast Preset External Mixer
The KSU command presets the external mixer mode by setting the frequency range to 18.0-26.5 GHz. This
frequency range is derived from the 6th harmonic of the analyzer local oscillator. The functions of the KSU
command and the front panel m U4 keys are identical.
‘When KSU is executed, the analyzer does a fast preset (similar to KST) and readies the analyzer for external
mixing by locking the frequency range to the 6th harmonic. The current harmonic number is displayed above the
graticule, and the current conversion loss is displayed to the left of the graticule.
If a harmonic lock (such as KSt) is in effect, an “I.” is also displayed following the current harmonic number.
Changing the frequency range with start and stop frequencies automatically changes the local oscillator frequency
to the corresponding harmonic.
OTJTFVT 718;“KSU;
160 Programming

8/21/2019 analiz_espctros
http://slidepdf.com/reader/full/analizespctros 270/536
KSV
Frequency Offset
reai i
The KSV command selects a value that offsets the frequency scale for all absolute frequency readouts, such as
center frequency Relative values, like span and delta marker, are not offset.
After execution, the KSV command displays the frequency offset in the active function readout. The offset value is
always displayed beneath the CRT graticule line, as long as the offset is in effect.
10 OTJTPUT718;“KSV100MZ;2 0 ENTER718;N
30 PRINTN
4 0 E N D
When queried(?), KSV returns the offset value as a real number, followed by carriage-return/line-feed (ASCII
codes 13, 10). The end-or-identify (EOI) is asserted with the line feed.
V
The functions of the KSV command and the [,,,, [=I keys are identical.
Programming 161

8/21/2019 analiz_espctros
http://slidepdf.com/reader/full/analizespctros 271/536
KSW
Error Correction Routine
The KSW command executes a built-in error correction routine. This routine takes approximately 30 seconds to
run and when completed, the instrument returns to its previous state. The functions of the KSW command and
the front panel @ W
CEI
keys are identical.
The error correction routine measures and records the amplitude and frequency error factors with reference to the
100 MHz calibration output (CAL OUT) signal, the 1 MHz resolution bandwidth, the 10 dB input attenuator, and
the step gains. The “CORR’D” message to the left of the graticule indicates the routine has been run and the
display has been corrected.
Use the error correction routine to ensure data has been corrected to the most recent calibration.
Before executing KSW, recall registers 8 and 9, follow the calibration procedure described in the introduction in
Section I.
10 OTJTPUT 718;“RCLS 8;”20 PAUSE30 OUTPUT 718; “RCLS 9;”
40 PAUSE
50 OUTPTJT 718;“KSW,”
When the routine is completed, the error correction data can be displayed on the CRT with the KSw (display
correction data) command. (See KSw.)
Accuracy of an amplitude measurement can be improved by taking advantage of the correction data stored in the
analyzer by the KSW command. For additional information on improving the amplitude accuracy, see the KS91
command.
162 Programming

8/21/2019 analiz_espctros
http://slidepdf.com/reader/full/analizespctros 272/536
KSX
Correction Factors On
KSX
The KSX command automatically incorporates the error correction factors into measurements taken by the analyz-
er. The CRT readout values are automatically offset by the error correction value. The functions of the KSX
command and the front panel [,,I, @ keys are identical.
The error correction factors are generated by an error correction routine. Use the KSW command to run the
routine. (To view the correction factors, execute KSW.)
For additional information on amplitude accuracy, see KS91, KSW, KSw, and KSY
OUTF'UT 718; “KSX;”
Programming 163

8/21/2019 analiz_espctros
http://slidepdf.com/reader/full/analizespctros 273/536
KSY
Correction Factors Off
The KSY command prevents the error correction factors from being used in measurements taken by the analyzer.
The functions of the KSY command and the front panel m ’
keys are identical.
STOPPREP
OUTPUT 718;“KSY;
5 KSW, KSw, and KSX.
164 Programming

8/21/2019 analiz_espctros
http://slidepdf.com/reader/full/analizespctros 274/536
Reference Level Offset
(ROFFSET)
Item Description/Default
REAL Default value for units is dBm (DM)
Range Restriction
+-3OOdB
The KSZ command offsets all amplitude readyts on the CRT display without affecting the trace. The functions of
the KSZ command and the front panel (,,,,[-Tq
keys are identical.
Once activated, the KSZ command displays the amplitude offset in the active function block. And, as long as the
offset is in effect while doing other functions, the offset is displayed to the left of the graticule.
OD’I’PUT 718;“KSZ 12DM;”
The functions of the KSZ and ROFFSET commands are identical.
Programming 165

8/21/2019 analiz_espctros
http://slidepdf.com/reader/full/analizespctros 275/536
KSa
Normal Detection
The KSa command selects normal input detection for displaying trace information. This enables a detection
algorithm called the Rosenfell detection, which selectively chooses between positive and negative peak values.
The choice depends on the type of video signal present.
OTJTPUT 718; “KSa; ”
The KSa function and the front panel function m b“11~ are identical. (See DET)
166 Programming

8/21/2019 analiz_espctros
http://slidepdf.com/reader/full/analizespctros 276/536
KSb
Positive-Peak Detection
The KSb command selects positive-peak input detection for displaying trace information. During this mode, the
trace elements are updated only when the detected signal level is greater than the previous signal level. (See DET.)
OUTPUT 718; “KSb;”
bThe KSb function and the front-panel m Ial function are identical.
Programming 167

8/21/2019 analiz_espctros
http://slidepdf.com/reader/full/analizespctros 277/536
KSc
A+B+A
(APB)
The KSc command adds trace A to trace B, point by point, and sends the result to trace A. Thus, KSc can restore
the original trace after an A - minus - B function (AMB) is executed.
A + B - > A
To successfully add all trace elements, place trace A in VIEW or BLANK display mode before executing KSc.
10 ASSIGN @Sa TO 71820 OUTPUT @Sa;“IP,LF;”
30 OUTPUT @Sa;“CFlOOMZ;SP2MZ;”40 OUTPUT @Sa; “A4; ”
50 OUTPUT @Sa;“Bl;CF2OOMZ;”60 OUTPUT @a; 24; ”70 OUTPUT @Sa;“A3;B3;”80 OUTPUT @Sa; “KSc; ”90 END
Line 20: Presets the instrument.
Line 30: Sets trace A to 100 MH z center frequency with 2 MHz frequency span.
Line 40: Blanks trace A.
Line 50: Selects trace B and sets center frequency to 200 MHz.
Line 60: Blanks trace B.
Line 70: Views trace A and trace B.
Line 80: Combines the amplitude of trace B with trace A and displays this combination as trace A.
The functions of the KSc and APB commands are identical.
The KSc function and the front-panel (,*,, b are identical.
168 Programming

8/21/2019 analiz_espctros
http://slidepdf.com/reader/full/analizespctros 278/536
KSd
Negative-Peak Detection
The KSd command selects negative-peak input detection for displaying trace information. During this mode, the
trace elements are updated only when the detected signal level is less than the previous signal level. (See DET)
The functions of the KSd command and the I,-] b keys are identical.
Programming 169

8/21/2019 analiz_espctros
http://slidepdf.com/reader/full/analizespctros 279/536
KSC?
Sample Detection
The KSe command selects the sample detection modeefor displaying trace information. The KSe command is
identical with manual operation of the front panel m I-] keys.
In sample mode, the instantaneous signal value of the final analog-to-digital conversion for the sample period is
stored in trace memory. As sweep time increases, many analog-to-digital conversions occur in each period, but
only the final signal value is stored and displayed.
Sample detection mode is automatically selected for video averaging and noise level measurements.
OUTF'UT 718;“KSe;
The above program line selects the sample detection mode of the analyzer.
170 Programming

8/21/2019 analiz_espctros
http://slidepdf.com/reader/full/analizespctros 280/536
KSf
Protect Instrument State During Power Loss
Use the KSf command to recall any instrument configuration in the event of power loss.
If KSf is the last command executed, and the analyzer loses power, the instrument state at the time of power
loss is restored when power returns.
If any spectrum analyzer command is executed, or any front panel key is pressed after KSf is executed, the
analyzer configuration can not be regained if power is lost.
The functions of the KSf command and the m b keys are identical.
Programming 17 1

8/21/2019 analiz_espctros
http://slidepdf.com/reader/full/analizespctros 281/536
CRT Beam Off
The KSg command turns off the CRT beam power supply to avoid unnecessary wear of the CRT in cases where
the arlyzer is in unattended operation. The KSg command is identical with manual operation of the front panel
@@jjj keys.
The KSg command does not affect HP-IB input/output of instrument function values or trace information.
OUTPUT 718;“KSg;”
The above program line turns the CRT beam power supply off.
172 Programming

8/21/2019 analiz_espctros
http://slidepdf.com/reader/full/analizespctros 282/536
KSh
CRT Beam On
The KSh command turns the CRT beam on and is activated automatically with an instrument preset. The KSh
command is identical with manual operating of the front panel [,.lrr hIz]
keys.
OUTPUT 718;“KSh;
The above program line activates the CRT beam power supply of the analyzer.
Programming 173

8/21/2019 analiz_espctros
http://slidepdf.com/reader/full/analizespctros 283/536
KSi
Exchange B and C
WW
The KS i command exchanges traces C and B, point by point.
Note trace C is not a swept, active function. Therefore, exchange traces C and B as follows:
1. Select single sweep mode (SNGLS) .
2. Select desired analyzer settings.
3. Take one complete sweep (TS) .
4. Exchange data.
This procedure ensures that the current settings of the analyzer are reflected in the transferred data.
When transferring data from one trace to another, only amplitude information is exchanged, located in display
memory addresses 1025 through 2025 and 2049 through 3049.
The functions of the KSi and BXC commands are identical.
i
The functions of the KSi command and the m m keys are identical.
174 Programming

8/21/2019 analiz_espctros
http://slidepdf.com/reader/full/analizespctros 284/536
KSj
View Trace C
The KSj command displays trace C. Amplitude information for trace C is contained in display memory addresses
3073 through 4073. The KSj command displays this trace information on the analyzer display.
KSj also sends the instruction word, 1048 l , to address 3072. Therefore, any information stored in address 3072 is
lost when KSj is executed. If you have used address 3072 for a graphics program or a label, you may wish to save
its contents before executing KSj.
Trace C is not a swept, active trace, as are traces A and B. Send data to trace C with these commands:
BTC or KS1 transfers trace B amplitude information to trace C.
BXC or KSi exchanges trace B and trace C amplitude information.
DW or KS125 sends trace information to trace C.
Transfer trace amplitude information as follows:
1. Select single sweep mode (SNGLS or S2).
2. Select desired analyzer settings.
3. Sweep analyzer (TS) .
4. Transfer data.
The program below demonstrates KSj .
10 ASSIGN @Sa TO 71820 OUTPUT @Sa; IP;LF;
30 OUTPTJT @Sa; A4;52; 40 OUTPUT @Sa;“B1;CF2OOMZ;SP2MZ;TS;
50 OUTPUT @Sa“KSi;60 OUTFWT asa; “B4;70 OUTPUT QSa;“KSj;50 END
Line 20:
Line 30:
Line 40:
Presets the instrument.
Stores and blanks trace A. Selects single sweep mode (S2).
Selects trace B. Sets the analyzer to 200 MHz center frequency with a 2 MHz frequency span.
Takes one complete sweep of trace B at the current settings (TS) .
Programming 175

8/21/2019 analiz_espctros
http://slidepdf.com/reader/full/analizespctros 285/536
KSj (Continued)
Line 50: Exchanges trace B and trace C. Trace C (containing no trace data) now appears on the display as
trace B. The asterisk (‘) in the top right corner of the analyzer does not agree with the current
display.
Line 60: Stores and blanks trace B (containing no trace data and an asterisk in the top right corner).
Line 70: Views trace C .
Commands BTC, KSl, BXC, and KS i manipulate trace amplitude information in display memory addresses
3074 through 4073. They do not manipulate data in the remaining display addresses that are allocated to trace C:
addresses 4073 through 4095, and 3072. These addresses are available, in addition to address 3073 and 4074,
for custom graphics programming or labels. (See Appendix B.)j
The functions of the KSj command and (,,,,, [-I keys are identical. (See VIEW and BLANK.)
l 1048 is a machine instruction word that sets addresses 3073 through 4073 to zero and draws the trace dimly.
176 Programming

8/21/2019 analiz_espctros
http://slidepdf.com/reader/full/analizespctros 286/536
KSk
Blank Trace C
The KSk command blanks trace C. Amplitude information for trace C is contained in display memory addresses
3073 through 4073. The KSk command blanks trace C but does not alter the information stored in these
addresses.
KSk also sends the instruction word, 1044*, to address 3072. Therefore, any information stored in address 3072
is lost when KSk is executed. If you have used address 3072 for a graphics program, or label, you may wish to
save its contents before executing KSk.
k The functions of the KSk command and 11-1 11-11 keys are identical. (See KSj, VIEW and BLANK.)
l 1044 is a machine instruction word that sets addresses 3073 through 4073 to zero and skips to the next page memory.
Programming 177

8/21/2019 analiz_espctros
http://slidepdf.com/reader/full/analizespctros 287/536
KSI
Transfer B to C
W-C)
The KS1 command transfers trace B to trace C.
Note trace C is not a swept, active function. Therefore, transfer trace information to trace C as follows:
1. Select single sweep mode (S2).
2. Select desired analyzer settings.
3. Take one complete sweep (TS) .
4. Transfer data.
This procedure ensures that the current settings of the analyzer are reflected in the transferred data.
10 0UTPUT718;“IP;LF;TS;SNGLS;A3;20 OUTPUT718;“B1;CF20MZ;TS;B4;30 OUTPTJT718;“KSl;KSj31 LOCAL718
40 END
When transferring trace data from one trace to another, only the trace information from 1001 display memory
addresses is transferred out of the total 1024 available display memory addresses. Information in address 1024
and addresses 2026 through 2047 is not transferred. (Addresses 2026 through 2047 are usually used for custom
graphics.)
The functions of the KS1 and BTC commands are identical.
1
The functions of the KSI command and the m [I-,DIl keys are identical.
178 Programming

8/21/2019 analiz_espctros
http://slidepdf.com/reader/full/analizespctros 288/536
KSm
Graticule Off
The KSm command blanks the graticule on the analyzer display. The KSm command is identical with manual
operation of the front panel m b keys.
OUTFVT 718;“KSm.”
See also GRAT.
Programming 179

8/21/2019 analiz_espctros
http://slidepdf.com/reader/full/analizespctros 289/536
KSn
Graticule On
The KSn command turns on the graticule of the analyzer display. The KSn command is identical with manual
operation of the front panel I,nml b keys.
OUTPUT 718;“KSn;
See GRAT and KSm .
I80 Programming

8/21/2019 analiz_espctros
http://slidepdf.com/reader/full/analizespctros 290/536
KSo
Characters Off
The KSo command blanks the annotation on the analyzer display. The functions of the KSo command and the
front panel [,.,,, keys are identical.
OUTPUT 718; “KSo;”
See ANNOT and KSp.
Programming 18 1

8/21/2019 analiz_espctros
http://slidepdf.com/reader/full/analizespctros 291/536
W
Characters On
The KSp command turns on all annotation on the analyzer display. The functions of the KSp command and the
front panel (,., p(,,,
keys are identical.
OUTPUT 718;“KSp;”
See KSo and ANNOT.
182 Programming

8/21/2019 analiz_espctros
http://slidepdf.com/reader/full/analizespctros 292/536
Step Gain Off
The KSq command is a diagnostic aid used for servicing the spectrum analyzer.
The KSq command uncouples the step gain amplifiers (from attenuator changes) of the IF section (A4A5 Step
Gain and A4A8 Attenuator-Bandwidth Filter).
The functions of the KSq command and the (,.,, key are identical.
Programming 183

8/21/2019 analiz_espctros
http://slidepdf.com/reader/full/analizespctros 293/536
KSr
Service Request 102
The KS r command sends service request 102 to the controller, notifying the controller that the operator has
requested service. See Appendix D.
fLlN
The functions of the KSr command and the (,,I, keys are identical.
184 Programming

8/21/2019 analiz_espctros
http://slidepdf.com/reader/full/analizespctros 294/536
KSt
Harmonic Lock
(HNLOCK)
The KSt command (harmonic lock) limits the tuning range of the analyzer to a specific harmonic of the local
oscillator as selected by start and stop frequencies. The functions of the KS t command and the front panel (,.,
I-1 keys are identical.
When executing a harmonic lock, use the following method to ensure the desired harmonic is selected:
1. Select desired harmonic by setting a start frequency within the desired band. (See Tuning Curves in Appendix
F for frequency range of each harmonic.)
2. Set analyzer to single sweep mode. Single sweep ensures the desired harmonic is selected when executing a
bank lock.
3. Execute KSt to lock the desired harmonic.
4. Set analyzer to continuous sweep mode.
5. Reset desired start and stop frequencies.
Remember, before you can change the frequency range to another harmonic, you must unlock the band with the
KSQ (harmonic unlock) command.
KSR (Diagnostics On) can be activated, at any time, to display the local oscillator harmonic number in the upper
left comer of the CRT display
10 ASSIGN @Sa TO 71820 OTJTTTJT @Sa; Zp; ”30 OUTPUT @Sa;“FA8.0GZ;”40 OUTPlJT @Sa;“S2;TS;”80 OTJTPUT @Sa; “KSt; ”
80 OTJTPUT @Sa:“Sl;”70 OUTPUT @Sa;“FA8.0GZ;FB12.8GZ;”80 END
Line 20:
Line 30:
Line 40:
Line 50:
Line 60:
Line 70:
Presets the instrument.
Sets a start frequency of 6.0 GHz which automatically selects the second harmonic.
Sets the analyzer to single sweep mode and takes one complete sweep of the current display
Locks the second harmonic of the local oscillator.
Resets the analyzer to continuous sweep mode.
Sets the frequency range of the second harmonic.
Programming 185

8/21/2019 analiz_espctros
http://slidepdf.com/reader/full/analizespctros 295/536
KSu
Marker Stop
(X--
The KSu command stops the sweep at the active marker. (See also MKSTOF?)
The functions of the KSu command and the @ b keys are identical.
186 Programming

8/21/2019 analiz_espctros
http://slidepdf.com/reader/full/analizespctros 296/536
KSv
External Marker Signal Identifier
The KSv command enables a signal identifier routine that use the active marker to automatically identify the signal
under observation in the external mixing mode.
OUTPUT 718;“KSv;”
If a marker is present on screen when KSv is executed, KSv determines the frequency and mixing harmonic of the
signal at the marker. If a marker is not on screen, KSv fit places a marker at the highest peak on screen, and then
determines the frequency and mixing harmonic of that signal. If no identification can be made, the original state,
prior to executing the KSv command, is automatically restored. If this should occur, change the harmonics and
amplitude delta values used by the signal identification routine, and then reexecute KSv. (See SIGDEL, NSTART
and NSTOI?)
If a harmonic lock (KSt) is in effect when the KSv command is executed, the lock is restored when the identifica-
tion process is finished.
The functions of the SIGID and KSv commands are identical.
The functions of the KSv command and the [,,,, keys are identical.
Programming 187

8/21/2019 analiz_espctros
http://slidepdf.com/reader/full/analizespctros 297/536
KSw
View Correction Data
The KSw command displays the correction data of the error correction routine of the analyzer. KSW executes the
correction routine. (See KSW.) The functions of the KSw command and the front panel i w[ ,I . , keys are
identical.
Correction data can also be transferred to the controller by executing the KSw (display correction routine) com-
mand. The correction data is transferred in sequence as a series of 43 strings using the following program:
10 DIMA$(1:43)[80]20 0lJTPUT718;“KSw;30 FORN=lTO4340 ENTER718;A$[N]80 NEXTN
Line 10: Dimensions string array storage (in the controller memory) for correction data.
Line 20: Sends correction data to controller.
Line 30 to 50: Sequentially stores correction data in array.
The content of each string is the error in dB or Hz for a specific control setting relative to a set of standard settings
determined at the factory. Strings 6 through 29 contain the amplitude and frequency errors displayed on CRT lines
6 through 17. Data in strings 1 through 5 correspond to CRT lines 1 through 5, and data in strings 30 through 43correspond to lines 18 through 31. The errors listed should be within the specification listed on the Error Correc-
tion Routine Table.
For additional information on the error correction routine, see Error Correction Routine in Chapter 11 of Section I.
188 Programming

8/21/2019 analiz_espctros
http://slidepdf.com/reader/full/analizespctros 298/536

8/21/2019 analiz_espctros
http://slidepdf.com/reader/full/analizespctros 299/536
KSx
External Trigger
The KSx command activates the normal external trigger mode, but eliminates the automatic refresh for sweepti-
mes less than 20 msec. (The T3 and TM commands do not inhibit the automatic refresh.) The functions of the
KSx command and the front panel m keys are identical.
When the KSx command is executed, the RF input signal is displayed only when the external trigger signal
exceeds the threshold of the trigger level.
OUTPUT 718;“KSx;”
190 Programming

8/21/2019 analiz_espctros
http://slidepdf.com/reader/full/analizespctros 300/536
KSY
Video Trigger
The KSy command activates the normal video trigger mode, but eliminates the automatic refresh for sweeptimes
less than 20 msc. (The T4 and TM commands do not inhibit the automatic refresh.) The functions of the KSy
command and the front panel (,., ’E3
Trigger keys are identical.
When the KSy command is executed, the RF input signal is displayed only when the video trigger signal, which is
internally triggered off the input signal, exceeds the threshold of the trigger level.
OTJTPUT 718;“KSy;
Programming 19 1

8/21/2019 analiz_espctros
http://slidepdf.com/reader/full/analizespctros 301/536
KSz
Storage Address
The KSz command displays the specified display memory address of the analyzer from 0 to 4095. If an address is
not specified, the analyzer displays the current address. The functions of the KSz command and the front panel
El zo(D 1
keys are identical.
The KS z command has the same function as the DA command.
OUTF’UT 718; “K&y ”
For additional information on the KSz command, see DA.
192 Programming

8/21/2019 analiz_espctros
http://slidepdf.com/reader/full/analizespctros 302/536
KS,
Mixer Level
(ML)
KS,
The KS, command specifies the maximum signal level that is applied to the input mixer for a signal that is equal to
or below the reference level.
The effective mixer level is equal to the reference level minus the input attenuator setting. When KS, is activated,
the effective mixer level can be set from - 10 dBm * to - 70 dBm in 10 dB steps. Instrument preset (IP) selects -
10 dBm.
The program line below sets the mixer level to - 40 dBm
OUTPUT 718;“KS, 40DM;”
As the reference level is changed, the coupled input attenuator automatically changes to limit the maximum signal
at the mixer input to - 40 dBm for signals less than or equal to the reference level.
The functions of the KS, and ML commands, and the (,., ($ keys are identical. See also AT
l In the extended reference level range, the effective mixer level can be set to 0 dBm.
Programming 193

8/21/2019 analiz_espctros
http://slidepdf.com/reader/full/analizespctros 303/536
KS=
Automatic Preselector Tracking
Use the KS= command to reinstate automatic preselector tracking after KS/ has been executed. Normally, the
center of the preselector filter automatically tracks signal responses in the four frequency bands of the 2 to 22 GHz
range.
The KS/ command allows manual adjustment of the preselector tracking. The PP command automatically opti-
mizes preselector tracking at any one frequency.
OUTPUT 718; “KS = ;”
The functions of the KS = command and the (,,lrrl keys are identical.
(See KS/ and PI?)
194 Programming

8/21/2019 analiz_espctros
http://slidepdf.com/reader/full/analizespctros 304/536
Lock Registers
The KS( command secures the contents of registers one through six. When the registers are secured, the SV and
SAVE commands cannot save more instrument states in the registers, but instead write “SAVE LOCK” on the
analyzer display. To save an instrument state in a locked register, first execute KS) to unlock the registers.
The recall function of the analyzer is not affected by this function.
OUTPUT 718;“KS(;
The functions of the KS( command and the (,.,,, [,,, keys are identical.
The KS( command also protects the contents of any user-defined softkeys when the analyzer is under manual
operation. During manual operation, softkeys are loaded by pressing the 29 key. Lyadiwz;;:,%:
information erases the original contents of the softkey. If KS( has been execu ed, pressing
softkey. Thus, existing softkey contents cannot be altered. Execute KS) to unsecure the softkey’s:
Programming 195

8/21/2019 analiz_espctros
http://slidepdf.com/reader/full/analizespctros 305/536
Unlock Registers
The KS) command unlocks the registers where instrument states are stored with SV and SAVE commands. The
functions of the KS) command and the front panel (,.,, )(,,,,
keys are identical.
When the registers are unlocked, new instrument states can be saved in registers one through six. Each time new
states are stored, the original register contents are erased.
The recall function of the analyzer is not affected by this function.
OUTF’UT 718; “KS);”
The KS) command also unlocks user-defined softkeys, which are locked during manual operation only, by the KS(
command.
See KS(.
196 Programming

8/21/2019 analiz_espctros
http://slidepdf.com/reader/full/analizespctros 306/536
KSI
The KS1 command writes the instruction word or data value into the specified display memory address. The
functions of the KS1 command, the front panel [,,,) keys, and the DW command are all identical.
iI30
The sample program lines below demonstrate how to format the KS1 command.
10 OUTPTJT 718;“KSI;
20 OU'TPTJT718; KS ;CHR$(124)30 OUTPUT718 USING“K,B ;“KS ,124
For additional information on display write, refer to the DW command.
Programming 197

8/21/2019 analiz_espctros
http://slidepdf.com/reader/full/analizespctros 307/536
KS
The KS# command turns off the YIG#tuned mixed (YTX) self-heating correction factor. The functions of the KS#
command and the front panel (,., IL
keys are identical.
,”
Normally, preselector tracking is controlled by the preselector digital-to-analog converter (DAC) , and the thermal
correction factor determined by the microprocessor. When KS# is executed, the thermal correction factor is not
applied to the preselector tracking. Therefore, a DAC value is the only condition affecting preselector tracking.
Executing an instrument preset (IP) is the only way to re-enable the YTX self-heating correction factor.
OUTPU'l'718;“KS#;
198 Programming

8/21/2019 analiz_espctros
http://slidepdf.com/reader/full/analizespctros 308/536
K S /
Manual Preselector Tracking
Use the KS/ command to manually adjust the internal preselector tracking. Normally, preselector tracking is
automatically adjusted. (See PP and KS = .) However, the KS/ function is useful for adjusting preselector tracking
of unstable signals, such as drifting signals or pulse modulated signals.
To manually adjust tracking, execute KS/ and then use the spectrum analyzer data knob to peak the signal
response at the marker position. If no marker is on screen, KS/ automatically places a marker at the signal with
greatest amplitude.
When KS/ is executed, the active function readout displays a number, from B to 63, which corresponds to the preselector frequency Changing the active function readout by 1, shifts the preselector tuning by 1.13 MHz.
Once the preselector tracking is altered with the data knob, tracking is no longer automatically adjusted. Executing
KS = is the only way to re-enable automatic preselector tracking.
OTJTPTJT 18;“KW;
/
The functions of the KSE command and the @ @ keys are identical.
(See KS = and Pl?)
Programming 199

8/21/2019 analiz_espctros
http://slidepdf.com/reader/full/analizespctros 309/536
KS39
Write to Display Memory
ANAL YZERMEMORY
‘ r ADDAESS y/1 DATA I r TERMINATOR 7
KS 39
Item Description/Default Range Restriction
INTEGER Represents the analyer display memoryaddress. Must be sent to analyzer as two 8-bit
bytes.
1 to 4095
INTEGER Represents amplitude data. Each data valuemust be sent to analyzer as tow 8-bit bytes.
0 to 1022 Number of addresses betweenstarting address and 4095.
KS39 is the general purpose command for writing data into the analyzer display memory. Any starting display
address is allowed with KS39. Up to 4096 display memory values can be sent in one operation. Data send with
KS39 must be in 2-byte binary format, 02, and be terminated with a single binary byte value of 32. The number of
bytes sent to the analyzer is limited by the number of addresses between the starting address and address 4095, the
last display memory address. The display address must be sent to the analyzer in the 2-byte binary format.
KS123 and KS39 are often used together to read and write the contents of display memory The following program demonstrates this.
10 OPTION BASE 120 DIM M$(8)[ 1024130 OWUT 718;“02;
40 Da=050 !
60 FORI=lTO870 OUTPUT 718;“DA”;Da;“;KS”;CHR$(123)80 ENTER 718 USING “#,1024A”;M$(I)90 Da=Da+512
loo NEXT1110 I
120 OUTPUT 718;“;A3;B3;Ml;L0;KSm;KSo;”130 OWUT 718;“EM;KSI;EM; EX;KSi;EM;”140 PRINT “OBSERVE BLANK 8CREEN;PRESS CONTINUE”150 PAUSE
160 !
170 OUTPUT 718 USING “#,K,B,W,“;“KS”;39;0180 OUTPUT 718 USING “8(K),B”;M$( * );32190 OUTPUT 718;“;Al;”
200 END
200 Programming

8/21/2019 analiz_espctros
http://slidepdf.com/reader/full/analizespctros 310/536
(Continued) KS39
Lines 10 to 100:
Lines 120 to 150:
Line 170:
Line 180:
Line 190:
Sends the content of trace memory to the controller. Refer to the description of the KS123
mnemonic for a complete explanation of these lines.
Erases trace A, B, and C memories and blanks the annotation and graticule.
Sends the KS39 command and the display memory address to the analyzer. The USING
part of the OUTPUT statement formats the controller to send the KS as a compact field,
the 39 as a single binary byte, and the PI (display address) as a two byte binary word, the #
sign suppresses the trailing CR/LF so it will not be send as part of the display memory
data.
Sends the display memory data contained in array M$ to the analyzer and terminates the
KS39 command with a 32. The USING part of the OUTPUT statement formats the
controller to end the contents of the array as eight strings and the 32 as a single binary
byte.
Al sets trace A to the clear-write mode. HD clears the active function block of the display,
which contained a display address.
The KS39 command cannot be executed from the front panel.
l This is the decimal ASCII equivalent and is transmitted to the analyzer as a single bit byte.
Programming 201

8/21/2019 analiz_espctros
http://slidepdf.com/reader/full/analizespctros 311/536
KS43
Frequency Limit SRQ
l
KS 43
The KS43 command tells the analyzer to send the service request (SRQ) called “102” to the controller, if the
analyzer current frequency band has been exceeded. In effect, KS43 lets the controller determine if the analyzer
(because of commands given by the controller which exceed the analyzer frequency band) has automatically
readjusted the start or stop frequency to keep it in the current band, or changed bands.
When the controller gives a command that exceeds the frequency range of the current band, the analyzer status
byte is set to 66, which is equivalent to an octal 102. The analyzer then notifies the controller that a service request
is ready. It does this by setting the HP-IB SRQ line true. To determine which service request the analyzer is
indicating, the controller must do a serial poll of the analyzer status byte.
Note that service request 140 (illegal command) is always allowed by the analyzer. If the analyzer receives an illegal
command from the controller, it set its status byte to 96 (octal 140).
The following program demonstrates the KS43 command. Note that the 43 in KS43 must be sent to the analyzer
as a single binary byte.
10 OWUT718;“IP;LF;
20 OWUT718USING“K,B ;“KS ;43
30 OWUT718;“CF1OOMZ
40 OWUT718;“FAlOMZ;FB3GZ50 ! NOTE “SRQ 102" message on analyzer’s CRT
60 END
The FB3GZ command exceeds the frequency range of the O-2.5 GHz band. This causes the analyzer to display
the SRQ 102 message. Note that when this program is run, the analyzer automatically changes the stop frequency
(FB) to 2 GHz, instead of 3 GHz.
The KS43 command cannot be executed from the front panel.
l This is the decimal ASCII equivalent and is transmitted to the analyzer as a single 8-bit byte.
202 Programming

8/21/2019 analiz_espctros
http://slidepdf.com/reader/full/analizespctros 312/536
KS91
Read Amplitude Error
KS 91
KS91 sends an amplitude correction value to the controller. This correction value improves measurement accuracy
when it is subtracted from the amplitude measured by the analyzer.
The analyzer compiles the KS91 correction value from calibration data stored in its memory by the KSW com-
mand, the error correction routine. When the KS91 command is executed, the correction value is compiled from
those parts of the KSW data that apply to the present instrument state. Execute KSW before KS91 to ensure the
correction value is based on recent KSW data. Execute KS91 immediately after making your amplitude measure-
ment to ensure the correction value is based on the right instrument settings.
The KSX (Use Correction Data) command puts the analyzer into a “corrected” mode. In this mode the analyzer automatically corrects its measurements with the data collected by the KSW command. The KSX command
makes amplitude corrections by adjusting the IF gain. Because of the inaccuracies inherent in changing the IF gain,
the correction mode established by the KSX command is up to 0.4 dB less accurate than the external mathemati-
cal correction made with the KS91 correction value.
The following program gives a sample readout of the KS91 correction value.
10 OUTPUT 718;“KSW;”
2 0 !
30 ! Any amplitude measurement routine
4 0 I
50 OWTJT 718 USING “K,B”;“KS”;9160 ENTER 718;E
70 PRINT “AMPLITUDE ERROR IS “;E;” dB”8 0 END
The correction value stored in variable E improves the amplitude measurement accuracy when it is subtracted from
the measured amplitude.
The KS91 command cannot be executed from the front panel
l This is the decimal ASCII equivalent and is transmitted to the analyzer as a single E bit byte.
Programming 203

8/21/2019 analiz_espctros
http://slidepdf.com/reader/full/analizespctros 313/536
KS92
Write in Display Units
l r DATA I
DL KS 02 integer
TH
M2
M3
DM
@
Da
HZ
Item Description/Default Range Restriction
INTEGER Represents display line, threshold, active
marker, or delta marker amplitude in display
units.
1 to 1022
The KS92 command tells the analyzer to receive the display line (DL), threshold line (TH), marker normal (M2),
or delta marker (M3) position in display units. The program line below shows the KS92 syntax.
OWTJT 718 USING “K,B,K”;“DL KS”;92;“300HZ;”
The HZ keyword is this line functions as a terminator for the DL command. Without the HZ keyword, the DL
command will not work. When used with KS92, the DL, TH, M2, and M3 commands must be terminated with
one of the following keyword terminators: DM, DB, or HZ.
The KS92 command cannot be executed from the front panel.
l This is the decimal ASCII equivalent and is transmitted to the analyzer as a single 8-bit byte.
204 Programming

8/21/2019 analiz_espctros
http://slidepdf.com/reader/full/analizespctros 314/536
KS94
Read LO Harmonic Number
4t
KS 84
The KS94 command reads the analyzer current LO harmonic number. On execution of KS94, the analyzer sends
a binary code to the controller, which represents the LO harmonic number. The decimal equivalent of this binary
code represents the LO harmonic number such that B represents the 1st harmonic, 1 represents the 2nd harmon-
ic, 2 represents the 3rd harmonic, and so forth.
The analyzer binary code is not followed by a terminator, Therefore, the controller must terminate its own ENTER
command, which it uses to read the binary code. This is the function of the # sign in line 20 of the following
program. This program reads the current LO harmonic number and prints it on the controller CRT
10 OWUT718USING“K,B ;“KS ;9420 ENTER718USING“B, ;H30 PRINTH
40 END
The KS94 command cannot be executed from the front panel.
l This is the decimal ASCII equivalent and is transmitted to the analyzer as a single 8-bit byte.
Programming 205

8/21/2019 analiz_espctros
http://slidepdf.com/reader/full/analizespctros 315/536
KS 123
Read Display Memory
t
KS 123
The KS123 command sends the contents of display memory to the controller. Thus, the controller “reads” display
memory.
Starting at a designated address, KS123 sends 1001 of the 4096 analyzer display memory values to the control-
ler. The analyzer output format and display memory address must be specified before executing KS123.
Follow the three steps listed below to send any section (up to 1001 addresses long) of display memory.
1. Specify the first display memory address of the section to be read.
2. Format a string or string array in the controller to store the exact number of values you need.
3. Terminate the KS123 command with a LOCAL 718 or an OUTPUT statement.
The KS123 command tells the analyzer to “wait” until 1001 memory values are read. If the controIIer does not
read all 1001 memory values, the program must terminate this “wait” mode with step 3. The sample program
below reads 10 memory values, starting at the center of trace A.
10 OPTIONBASE20 INTEGERA(10)
30 !40 OWUT718USING“K,B ;“O1;DA500;KS ;12350 ENTER718;A(*)60 OWUT 718;“;"
70 LOCAL718
80
90 FORI=ltolB
100 PRINT A(1)110 NEXT1
120 END
If KS123 is used with DA1 or DA1025, it imitates the TA and TB commands; however, TA and TB are slightly
faster and therefore preferable. The only efficient way to read the entire contents of trace C memory, however, iswith KS123. This is done by executing a DA3073 before the KS123 command, and dimensioning enough
controller memory for 1001 display values. To read individual values of trace data, use the DR command.
KS123 can also send all display memory contents (4096 values) to the controller. This is done with a program loop
that advances the display address by one and executes subsequent KS123 commands. The program below is an
example of this application.
206 Programming

8/21/2019 analiz_espctros
http://slidepdf.com/reader/full/analizespctros 316/536
(Continued) KS 123
10 OPTIONBASE 1
2 0 DIM M$(B)[ 10241
3 0 OUTPUT 718;“02;”
4 0 Da=0
8 0 !
60 FORI=lTO87 0 OUTPUT718;“DA”;Da;“;KS”;CHB$( 123)
8 0 ENTER 718 USING “#,1024A”;M$(I)90 Da=Da+512
100 NEXT1110 !
120 OUTPUT 718;“;A3;B3;Ml;LP);KSm;KSo;”130 OUTPUT 718;“EM;KSi;EM; EX;KSi;EM;”140 PRINT “OBSERVE BLANK SCBEEN;PBESS CONTINUE”180 PAUSE
18C !170 OUTPUT 718 USING “#,K,B,W,“;“KS”;39;0
180 OUTPUT 718 USING “8(K),B,K”;M$( *);32;“;”
190 OUTPUT 718;“Al ED”2 0 0 END
Line 20:
Line 30:
Line 40:
Line 60:
Line 70:
Line 80:
Line 100:
Lines 120 to 150:
Line 170 to 190:
Dimensions enough memory in M$ to contain all 4096 values of display memory. (8192
bytes or 2 times 4096 .)
Sets the analyzer output format to 2-byte binary. The KS39 command used in line 170
requires this format.
Sets the display address variable, Da, equal to the first address.
Defines the program loop. Eight cycles are necessary. The total number of display mem-
ory values (4096) is not evenly divisible by 1001, which is the number of values read by
KS123. The next smallest number by which 4096 is evenly divisible is 512. 4096/512 =
8.Sets the display address and executes KS123. The 123 must be sent as a single binary
byte.
Enters the display memory data into the string array M$. (1024 or 2 times 512 bytes are
entered.)
Continues the program at line 70. Line 70 readdresses the analyzer, clearing the “wait”
mode. This “wait” mode is a result of using KS 123 to read less than 1001 display mem-
ory values.
Erases trace A, B, and C memories and blanks the annotation and graticule.
Restores the analyzer display by writing the contents of M4 back into display memory.
The KS123 command cannot be executed from the front panel.
l This is the decimal ASCII equivalent and is transmitted to the analyzer as a single 8-bit byte.
Programming 207

8/21/2019 analiz_espctros
http://slidepdf.com/reader/full/analizespctros 317/536
KS125
Write to Display Memory
it r DATA -\
KS 125
I Item Description/Default Range RestrictionI
INTEGER Represents amplitude data. Each trace datavalue must be sent as two &bit bytes. Up to
2002 bytes (1001 values) can be sent.
o- 1022
The KS125 command writes data, which is formatted in 2-byte binary, into the analyzer display memory The
KS125 syntax requires a specified starting address that immediately precedes KS125. Specify the address with the
DA command. Up to 1001 display memory values are written with each execution of KS125.
The following program first uses KS123 to send the contents of trace B memory to the controller array. The
program then writes the contents of the array back to the analyzer trace B memory
10 OPTION BASE 120 INTEGER B-store( 1001)3 0
4 0 OUTPUT 718;“A4;Bl;TS;B3;”50 OUTPUT 718 USING “K,B,#“;“02;DA1024;KS”;12360 ENTER 718 USING “W”;B-store( *)7 0 !
8 0 OUTPUT 715;“;Sl;Al;Bl;”
90 LOCAL718100 PRINT “CHANGE ANALYZER DISPLAYPRESS CONTINUE”110 PAUSE
120 130 OUTPUT 718;“B3;”140 OUTPUT 718; “DA 1024;”150 OTJTPUT 718 USING “K,B,#“;“KS”;125
160 OTJTPUT 718 USING “W”;B-&or@ *)170 OU’ITUT 718;“;”180 END
Line 20:
Lines 40 to 60:
Lines 80 to 110:
Dimensions enough memory to store the contents of trace B memory. The INTEGER statement automatically dimensions 2 bytes for each element of string B-store (1001
elements).
Sweeps trace B and then sets it to the view mode. The analyzer is then set to the 2-byte
binary display-units output format. Next, the contents of trace B are read by the controller
and stored in string B-store.
Clears trace B, places the analyzer in the LOCAL mode, and tells the operator to change
the analyzer display (trace B display) and continue the program.
208 Programming

8/21/2019 analiz_espctros
http://slidepdf.com/reader/full/analizespctros 318/536
(Continued) KS1 25
Line 130:
Lines 40 to 150:
Line 160:
Places trace B in the view mode. This is necessary to prevent the analyzer from writing
over the data placed back into trace B by KS125.
Sets the analyzer display address to 1024 with the DA command and sends the KS125
command to the analyzer. The “125” in KS125 is sent as a single binary byte.
Writes the integer string B-store, which contains the display memory values for the origi-
nal trace B display, into the analyzer trace B memory, restoring the original trace B display.
The KS125 command cannot be executed from the front panel.
l This is the decimal ASCII equivalent and is transmitted to the analyzer as a single 8-bit byte.
Programming 209

8/21/2019 analiz_espctros
http://slidepdf.com/reader/full/analizespctros 319/536
KS126
Read Every Nth Value
NTH
l7 VALUE 7
KS 126
I Item Description/Default Range Restriction I
INTEGER Represents every Nth value of trace A, B, or Cdisplay memory.
PI- 1022
KS126 sends every Nth value in display memory to the controller. This is useful when more trace data than
required are available. For example, when displaying noise data in zero span, a small number of points can be
sampled and averaged without a significant loss of data. Another example is when the resolution bandwidth is
wide enough relative to the spanwidth so that only minimum display resolution is required.
Before executing the KS126 command, the analyzer output format and starting display memory address must be
specified. All trace memories must be in a store mode (VIEW or BLANK) when they are read by KS126. Immedi-
ately following the command, the variable N must be specified as follows:
N = point interval and is described by the formula N = lOOO/(M - 1).
M = the number of points to be read and is described by the formula M
= (1000/N) - 1.
The value of N must be an integer and must be sent to the analyzer as a single binary byte. The resulting value of M
dimensions memory in the controller.
The following program is an example of reading 11 values of trace B with KS126.
10 OPTION BASE 12 0 INTEGER A( 11)3 0 OUTPUT 718 USING “K,B,K”;“O1;DA1025;KS”;126;“100;”4 0 FORI=lTOll
5 0 ENTER 718;A(I)
6 0 PRINT A(1)7 0 NEXT1
8 0 END
The KS126 command cannot be executed from the front panel.
l This is the decimal ASCII equivalent and is transmitted to the analyzer as a single 8-bit byte
2 10 Programming

8/21/2019 analiz_espctros
http://slidepdf.com/reader/full/analizespctros 320/536
KS127
Write to Display Memory
KS
l r DATA 7
12 7l o c a l
command
Item
INTEGER
LOCAL COMMAND
Description/Default
Represents amplitude data.
Return spectrum analyzer to local control.Controller dependent.
Range Restriction
p to 1022
The KS127 command sends data, formatted in 2-byte binary, to the analyzer display memory All of the display
memory addresses can be written to with a single execution of KS127. The syntax of the KS127 command
requires a specified starting address that immediately precedes KS127. Specify the starting address with the DA
command.
If the controller is instructed to write to more addresses than there are between the specified starting address and
the last address in display memory, 4095, then a “wrap around” occurs, and the remaining display memory values
are sent to successive addresses starting at address p).
10 OPTION BASE 12 0 INTEGER B-&or@ 1001)3 0 !
4 0 OUTPUT 718;“A4;Bl;TS;B3;”50 OUTPUT 718 USING “K,B,#“;“02;DA 1024;KS”;12360 ENTER 718 USING “VP”;B-store( *)
70 OUTPUT 718;“;Al;Bl;”80 LOCAL 718
90 PRINT “CHANGE ANALYZER DISPLAYPRESS CONTINUE”100 PAUSE110
120 OUTPUT 718;“B3;”
130 OUTPUT 718;“DA 1024;”140 OUTPUT 718 USING “K,B,#“;“KS”;l27160 OUTPUT 718 USING “W,K”;B-store( *);“;‘I
16O LOCAL7181 7 0 END
The KS127 command cannot be executed from the front panel.
l This is the decimal ASCII equivalent and is transmitted to the analyzer as a single bit byte.
Programming 2 11

8/21/2019 analiz_espctros
http://slidepdf.com/reader/full/analizespctros 321/536
LB
Label
Item Description/Default Range Restriction
CHARACTER
REAL
TERMINATOR
Represents text displayed on screen.
Represents text displayed on screen.
Terminates text. Character defined in DT
command.
ASCII codes 32- 126
ASCII codes g- 255
ETX End of text. ASCII code 3
The LB command writes text (label) on the CRT display with alphanumeric characters specified in the program.
The text characters are each specified by 8 bits in a 12-bit data word which immediately follows the LB command.
(The 4 most significant bits in the data word are set to 0.) The decimal equivalent of the binary number formed by
the 12-bit data word corresponds to a particular one of the available alphanumeric characters. Decimal numbers PI
through 255 and their corresponding characters are shown in the Character Set Table at the end of this command
description.
Characters generated for the LB command are aligned on the CRT in the same manner as typeset characters on a
printed page (that is, in rows and columns). This alignment is important when you are labeling graph lines or
points.
The display size specified by the display size command (Dl, D2, D3), or the “big expand (hex)” instruction,
determines the position of the text on the CRT, the number of rows and columns, and the size of the characters.
A typical use of the LB command is shown in the sample program below.
10 OTJTPUT 718;“Ip;”20 OUTPUT 718;“A4;KSo;D3;”
30 OUTPUT 718;“DT@;”40 OUTPUT 718;“PU PA 75,650 LB LABEL@;”50 END
Line 20:
Line 30:
Line 40:
Blanks display and selects display size.
Establishes a character (@I) to terminate label text.
Positions start of label text, writes text, and terminates label mode.
212 Programming

8/21/2019 analiz_espctros
http://slidepdf.com/reader/full/analizespctros 322/536
(Continued) LB
When using LB, the end of the text must be terminated. If the text is not terminated, instructions and other text
following the actual label statement are displayed on the CRT The label mode can be terminated with an ASCII
end-of-text code (decimal code 3), or with a character specified by the DT command. The label terminator
command, DT suffixed with the character selected as the terminator (see line 30 above), must precede the label.
The terminator character itself must immediately follow the label.
The character codes listed below provide special label functions. Instructions for a particular function are normally
given in the function’s decimal code.
Code l Function l l
B
8
10
11
12
13
17
18
32
145
146
147
null
back space (BS)
line feed
vertical tab (opposite of line feed) (VT)
form feed (move beam to f&O) (FMFD)
carriage return (CR)
blink on (bkon)
blink off (bkof)
space (SP)
skip to next higher block of 16 addresses (sk 16)
skip to third higher block of 16 addresses (sk 16)
skip to fifth higher block of 16 addresses (sk 64)
* Character codes can be used with both the label instruction code (1025 + ) and the LB command.
* l Abbreviations within the parenthesis are shorthand notation for writing display programs. They are not pro-
gramming codes.
A blink-on instruction causes the label statement to blink until a subsequent blink-off or end-of-text instruction in
the program is executed.
For the skip-to-next-block instructions, the 4096 addresses in the display memory are hypothetically divided into
256 blocks of 16 addresses each. Execution of a skip instruction causes the program to skip to the fist address in
the next higher block of 16 addresses (code 145)) to skip over the next two higher blocks to the fist address in the
third higher block (code 146)) or to skip over four blocks to the first address in the fifth higher block (code 147).
For example, if the program is at any address from (b through 15 (the fist block of 16 addresses) and a
skip-to-next-16-b&k is executed, the program skips to address 16 (the fist address in the second block of 16
addresses). Similarly, if the program is at address 84 in the sixth block of 16 addresses, and a skip-to-next-32-block
is executed, the program skips over two blocks of 16 addresses to address 128 (the fist address in the ninth block).
Again, if the program is at address 84 in the sixth block, but the instruction this time is for a skip-to-next&l-block,
the program skips over four blocks to address 160 in the eleventh block of 16 addresses.
Programming 2 13

8/21/2019 analiz_espctros
http://slidepdf.com/reader/full/analizespctros 323/536
LB (Continued)
A sample program using the blink-on and blink-off codes is shown below.
20 ASSIGN @?Sa TO 71830 OUTPUT @Sa; “IPi”40 OUTPUT @Sa;“A4;KSo;D3;”80 OUTPUT @Sa;“PU;PA 344,656;LB”;CHRS(17);“LABEL”;CHRJb(l8);CHR$(3);
60 END
For a binary format, line 50 can be written as follows:
50 OUTPUT @Sa USING “K,B,K,B,B “;“PU;PA 344,666;LB”;l7;“LABEL”;l8.3;
Line 30: Presets the instrument.
Line 40: Blank trace A and characters and selects display size 3.
Line 50: Positions the beginning of the label, blinks the label, and terminates the label.
Character Set
The character set for the label command is the same as the ASCII set. There are 86 additional characters available.
214 Programming

8/21/2019 analiz_espctros
http://slidepdf.com/reader/full/analizespctros 324/536

8/21/2019 analiz_espctros
http://slidepdf.com/reader/full/analizespctros 325/536
LF
PresetO-25GHz
The LF command selects start/stop frequencies of $4 Hz and 2.5 GH z (in full span), a reference level of fiI dBm,
and sets all the coupled functions to automatic. The functions of the LF command and the front panel FULL
SPANa key are identical.
The Full Span 0 - 2.5 GHz function provides a convenient starting point for making measurements in the low
band because it presets the analyzer functions to known states and values. (See II?)
OTJTPUT 718;“LF;
The above program line enables the full 0 - 2.5 GHz span with coupled operation functions.
216 Programming

8/21/2019 analiz_espctros
http://slidepdf.com/reader/full/analizespctros 326/536
LG
Log Scale
LG integer
Item
INTEGER
Description/Default Range Restriction
1,2,5, 10
The LG command specifies the vertical graticule divisions as logarithmic units without changing the reference level.
The vertical scale may be specified as 1,2,5, or 10 dB per major division. If no value is specified, as shown below,
the logarithmic scale is 10 dB per division.
OUTPUT 718;“LG;”
The functions of the LG command, and the front panel @ key are identical.
When queried (? or OA) , LG returns the current log scale as a real number, followed by a carriage-return/line-feed
(ASCII codes 13, 10). The end-or-identify state (EOI) is asserted with line feed.
Programming 217

8/21/2019 analiz_espctros
http://slidepdf.com/reader/full/analizespctros 327/536
Lower Left
The LL command sends a voltage to the rear panel RECORDER OUTPUTS. The voltage level remains until a
different command is executed. Use the LL command to calibrate the lower left dimension of a recorder. The LL
command is illustrated in the sample program below.
10 OUTPUT 718;“LL;20 PRINT“ALIGNPLOTTERPENLOWERLEFTCORNEROFPAPER:PRESSCONTINUE.
30 ENDZ
The functions of the LL command and front panel key are identical. (See Introduction in Section I.)
218 Programming

8/21/2019 analiz_espctros
http://slidepdf.com/reader/full/analizespctros 328/536
LN
Linear Scale
The LN command scales the amplitude (vertical graticule divisions) proportional to input voltage, without chang-
ing the reference level. The bottom graticule line represents a signal level of zero volts.
The LN command selects V mV or UV as the vertical scale, depending on the vertical scale before LN is executed.
Units other than V/DIV MV/DIV or uV/DIV can be selected by changing the reference level after executing LN.
For example, to set the scale to 3 mV/DN, specify a reference level of 30 mV
OUTPUT 718; “LN; RL 3OmV;
Note that voltage entries are rounded to the nearest 0.1 dB. Thus, 30 mV becomes 30.16 mV which equals -17.4
dBm.
LIN
The functions of the LN command and front panel0 key are identical. (See also KSB, KSC, and KSD.)
Programming 2 19

8/21/2019 analiz_espctros
http://slidepdf.com/reader/full/analizespctros 329/536
LOG
Logarithm
r D E S T I N A T I O N 7 r OPERAND \SCAL INB
r FACTOR Y
v a r i a b l e
i d e n t i f i e r
n u m e r i cd a t a f i e l d
Item Description/Default Range Restriction I
TRACE LABEL
VARIABLE
IDENTIFIER
Alpha character. User-defined label declared inTRDEF statement.
Alpha character. User-defined identifier declared in VARDEF statement.
Alpha character. Measurement-variableidentifier, such as CF or MA.
AA-22 and _2- 12 characters required.
AA-Z? and _2- 12 characters required.
Trace element, such as TRA[ lo].
NUMERIC DATAFIELD
Real
The LOG command modifies the operand:
LOG operand 1 x scaling factor - destination
The operands and destination may be different lengths. The trace operands (TRA, TRB, TFK, and trace label)
range from 1 to 1008 elements in length; a variable identifier or numeric data field is one element long. When
2 2 0 Pr o g r a m m i n g

8/21/2019 analiz_espctros
http://slidepdf.com/reader/full/analizespctros 330/536
(Continued) LOG
operands differ in length, the last element of the shorter operand is repeated for processing. When the operands
are longer than the destination, they are truncated to fit.
OUTF'TJT718;“LOGTRC, J RA10;
Programming 22 1

8/21/2019 analiz_espctros
http://slidepdf.com/reader/full/analizespctros 331/536
LB
Display Line Off
The LPI command disables the display line.
The functions of the Llzl command and the front panel, reference line (ORj key are identical. The display line also
can be turned on or off by the DLE and DL commands.
OUTPUT 718;“L0;
222 Programming

8/21/2019 analiz_espctros
http://slidepdf.com/reader/full/analizespctros 332/536
MA
Marker Amplitude Output
The MA command returns the amplitude level of the active marker to the controller, if the marker is on screen. If
both the delta marker and active marker are on screen, MA returns the amplitude difference between the two
markers. (See MKDELTA and M3.) The amplitude is also displayed in the upper right-hand corner of the analyzer
display.
The output can be formatted in any of the four output formats. (Refer to FORMAT commands, 01,02, 03,04.)
However, do not use output format 04 for marker delta output, because sign information is lost.
A typical use of the MA command is shown in the sample program below.
10 ASSIGNCMaTO71820 P R I N T E R I S
30 OlJTPUT@Sa;“FA80MZ;FB120MZ;40 OUTPUT @Sa;“M2;El;
50 OUTPUT QSa; MA;60 ENTER@Sa;A
70 PRINTA
80 END
Line 30: Selects start and stop frequencies.
Line 40: Activates a normal marker and peak search.
Line 50: Returns the amplitude to the controller.Line 60: Assigns the amplitude to variable A.
Line 70: Prints the marker amplitude.
An ENTER command must follow each output command, or output data is lost. For example, the following
program assigns only the marker amplitude to variable E and the marker frequency value is lost.
OUTPUT 718; MF;IVIA;
OUTPUT718;F,A
Programming 223

8/21/2019 analiz_espctros
http://slidepdf.com/reader/full/analizespctros 333/536
MBRD
Processor Memory Block Read
ANALYZER NUMBERMEMORY OF
- A D D R E S S - / - - - B Y T E S -
MBRD
I Item Description/Default Range RestrictionI
INTEGER ASCII decimal number representing analyzer
memory address.
INTEGER
NUMERIC DATA
FIELD
ASCII decimal number indicating number of
bytes to read.Real
The MBRD command reads an indicated number of bytes, beginning at the specified microprocessor address, and
returns the bytes to the controller.
224 Programming

8/21/2019 analiz_espctros
http://slidepdf.com/reader/full/analizespctros 334/536
MBWR
Processor Memory Block Write
p S T R I N G D A T A F I E L D . \
MBWR
A-BL OCK DA TA F I ELD --\
/ I -BLOCK DATA F I ELD \
I Item Description/Default Range Restriction
STRING Mark beginning and end of command string. “ %& ‘/: = @\-J
DELIMITER End and beginning delimiter must be identical.
LENGTH Two 8bit bytes specifying length of command
list, in 8-bit bytes. The most significant byte is
first: MSB LSB.
DATA BYTES 8-bit bytes of data representing command list.
INTEGER ASCII decimal number representing analyzer
memory address.
The MBWR command writes a block message to analyzer memory, starting at specified address.
Programming 225

8/21/2019 analiz_espctros
http://slidepdf.com/reader/full/analizespctros 335/536
MDS
Measurement Data Size
cuThe MDS command formats binary measurement:
B selects a data size of one &bit byte.
W selects a data size of one word, which is two 8-bit bytes.
226 Programming

8/21/2019 analiz_espctros
http://slidepdf.com/reader/full/analizespctros 336/536
MDU
Measurement Data Units
MDU
The MDU command returns values for the CRT base line and reference level, in display units and measurement
units.
For example, the program below returns the following to the controller:
0 1000 -110 -10
This means the vertical scale spans B to 1000 display units, or 100 dB, and the reference level is -10 dBm.
10 OUTPUT718;“Ip;O3;20 OUTPUT718; RL-10DM;100 0uTPuT718;“MDu?;140 ENTER718;A,B,C,D150 PRINTA,B,C,D160 END
Programming 227

8/21/2019 analiz_espctros
http://slidepdf.com/reader/full/analizespctros 337/536
MEAN
Mean
MEAN tracel a b e l
t-aTRA
I Item Description/Default Range Restriction
TRACE LABEL Alpha character. User-defined label declared in AA-ZZand-TRDEF statement. 2- 12 characters required.
The MEAN command returns the mean value of the trace, in display units. Note that the value must be moved
into a variable to be accessed.
OUTPTJT 718;“TRDEF TEXT; 1008; VARDEF DESTINATION,0;”OUTPTJT 718;“MOV DESTINATION, MEAN TEST;”
228 Programming

8/21/2019 analiz_espctros
http://slidepdf.com/reader/full/analizespctros 338/536
MEM
Memory
MEM
The MEM command returns the amount of unused memory available for user-defined functions. These functions
include TRDEF VARDEF FUNCDEF, ONSW, ONEOS, and TRMATH.
The MEM command returns the number of available bytes to the controller followed by a carriage-return/line-feed
(ASCII codes 13, 10). The end-or-identify state (EOI) is asserted with line feed.
10 OUTF’UT 718; “MEM?;”20 ENTER 718;How-much-memory30 PRINT How-much-memory40 END
Programming 229

8/21/2019 analiz_espctros
http://slidepdf.com/reader/full/analizespctros 339/536
MF
Marker Frequency Output
The MF command returns the frequency level of the active marker to the controller, if the marker is on screen. If
both the delta marker and active marker are on screen, MF returns the frequency difference between the two
markers. (See MKDELTA and M3.)
The output can be formatted in any one of the four output formats. (Refer to FORMAT command, 01, 02, 03,
and 04.) However, do not use output format 04 for marker delta output, because sign information is lost.
A typical use of the MF command is shown in the sample program below.
10 ASSIGN @Sa to 71820 PRINTER IS 70130 OUTPUT @Sa;“FA 80MZ;FB 12OMZ;”40 OUTPUT @Sa;“M2;El;”50 OUTPTJT @Sa; “MF;”60 ENTER @Sa;A70 PRINT A 80 END
Line 30:
Line 40:
Line 50:
Line 60:Line 70:
Selects start and stop frequencies.
Activates a normal marker and peak search.
Returns the frequency to the controller.
Assigns the frequency to variable A.Prints the frequency amplitude.
An ENTER command must follow each output command, or output data is lost. For example, the following
program assigns only the marker amplitude to variable FT and the marker frequency value is lost.
OUTPUT 718;“MF;MA;”OTJTPU’I’ 718;F,A
230 Programming

8/21/2019 analiz_espctros
http://slidepdf.com/reader/full/analizespctros 340/536
r DESTINATION \ r OPERAND 1 y
t r a c el a b e l
* v a r i a b l ei d e n t i f i e r
r
n u m e r i c-W d a t a f i e l d
MIN
Minimum
r OPERAND 2 7
t r a c el a b e l
I Item Description/Default Range Restriction
TRACE LABEL Alpha character. User-defined label declared in
TRDEF statement.
AA- 22 and _
2- 12 characters required.
VARIABLE
IDENTIFIER
Alpha character. User-defined identifier
declared in VARDEF statement.
AA-22 and _
2- 12 characters required.
Alpha character. Measurement-variable
identifier, such as CF or MA.
Trace element, such as TRAIlO].
NUMERIC DATA
FIELD
Real
The MIN command compares operand 1 and operand 2, point by point, sending the lesser values of each
comparison to the destination.
If one of the operands is a single value, it acts as a threshold, and all values equal to or less than the threshold pass
to the destination.
OUTPUT 718;“MIN TRB,TRC,TFiB;”
P r o g r a m m i n g 23 1

8/21/2019 analiz_espctros
http://slidepdf.com/reader/full/analizespctros 341/536
MKA
Marker Amplitude
MKA
Item
REAL
Description/Default Range Restriction
Amplitude range of analyzer
screen.
The MKA command specifies the amplitude of the active marker in dBm, when the active marker is the fixed or
amplitude type. (Instrument preset (IP) selects an amplitude marker. See MKTYPE.)
When queried (?), MKA returns the marker amplitude, a real number, followed by a carriage-return/line-feed
(ASCII codes 13, 10). The end-or-identify state (EOI) is asserted with line feed.
OUTPUT 718; “MXCA -2ODM;”
232 Programming

8/21/2019 analiz_espctros
http://slidepdf.com/reader/full/analizespctros 342/536
MKACT
Marker Active
Item Description/Default
MARKER NUMBER Integer. Default is 1.
Range Restriction
1,2,3,4
The MKACT command establishes the active marker. There can be four different numbered markers, but only one
marker can be active at any time.
A variety of commands listed in this remote section operate on the active marker. Most of them begin with the
letters “MK.”
When MKACT is executed, the display readout indicates the active marker state.
OUTPUT 718;“MKACT3;
When queried (?) , MKACT returns the number of the current active marker, followed by carriage-return/line-feed
(ASCII codes 13, 10). The end-or-identify state (EOI) is asserted with line feed.
Programming 233

8/21/2019 analiz_espctros
http://slidepdf.com/reader/full/analizespctros 343/536
MKCF
Marker to Center Frequency
W
The MKCF command centers the active marker on the analyzer screen, moving the marker to the center frequen-
CY.
OUTPUT 718; “MKCF;”
The functions of the MKCF and E2 commands, and the front panel (“2:-) key are identical.
234 Programming

8/21/2019 analiz_espctros
http://slidepdf.com/reader/full/analizespctros 344/536
MKCONT
Marker Continue
WW
The MKCONT command resumes the sweep after execution of a MKSTOP or KSu command. Execute MK-
CONT after MKSTOP or KSu .
The functions of the MKCONT and KSt commands are identical.
Programming 235

8/21/2019 analiz_espctros
http://slidepdf.com/reader/full/analizespctros 345/536
Marker Delta
(M3)
DELTA MARKER/ FREOUENCY -
MKD real
I Item Description/Default Range Restriction I
IREAL Selects delta marker frequency. Default units is
HZ.
The MKD command computes the frequency and amplitude difference of the active marker and a special marker,
called the delta or differential marker. These values are displayed in the display readout.
Differential value = active marker frequency - delta marker frequency
Differential value = active marker amplitude - deIta marker amplitude
If a delta marker is not on screen, MKD places one at the specified frequency, or at the right side of the CRT If an
active marker is not on screen, MKD positions an active marker at center screen. (The active marker is the number
1 marker, unless otherwise specified with the MKACT command.)
0UTPUT718;“MKD 12OMZ;
The MKD command function is identical with that of the M3 command, and similar to that of the front panelm
key
236 Programming

8/21/2019 analiz_espctros
http://slidepdf.com/reader/full/analizespctros 346/536
(Continued) MKD
When queried(?), MKD returns the frequency difference between the delta and active markers. The frequency
difference is returned as a real number, followed by a carriage-return/line-feed (ASCII codes 13, 10). The
end-or-identify state (EOI) is asserted with line feed.
Programming 237

8/21/2019 analiz_espctros
http://slidepdf.com/reader/full/analizespctros 347/536
MKF
Marker Frequency
c -0iHZ
1
L
0
I Item Description/Default Range RestrictionI
REAL Represents marker frequency. Marker frequency limited to
frequency range of spectrum
analyzer display.
Default value for units is Hz.
The MKF command specifies the frequency value of the active marker.
OIJTTUT718;“MKF 1OOMZ;”
W he n que r i e d (?), M KF r e tu r ns the a c t ive ma r ke r f r e que nc y a s a r e a l numbe r f o l lowe d by a
carriage-return/line-feed (ASCII codes 13, 10). The end-or-identify state (EOI) is asserted with line feed.
238 Programming

8/21/2019 analiz_espctros
http://slidepdf.com/reader/full/analizespctros 348/536
Marker Minimum
WW
The MKMIN command moves the active marker to the minimum value detected. (See also KSN.)
OUTPUT 718; “MKMIN;”
Programming 239
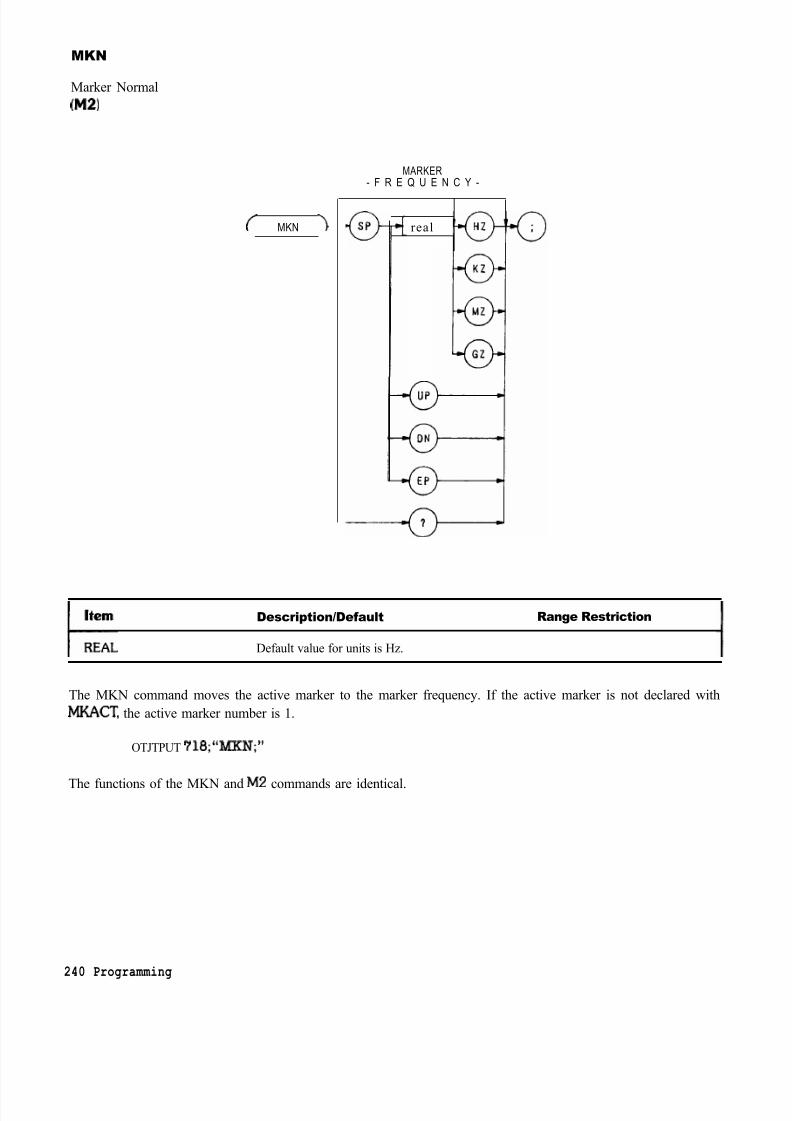
8/21/2019 analiz_espctros
http://slidepdf.com/reader/full/analizespctros 349/536
MKN
Marker Normal
0’42)
MKN >
MARKER- F R E Q U E N C Y -
real
Description/Default Range Restriction
Default value for units is Hz.
The MKN command moves the active marker to the marker frequency. If the active marker is not declared with
MKACT, the active marker number is 1.
OTJTPUT 718;“MXN;”
The functions of the MKN and M2 commands are identical.
240 Programming

8/21/2019 analiz_espctros
http://slidepdf.com/reader/full/analizespctros 350/536
Marker Noise
W-W
MKNOI SE
The MKNOISE command displays the RMS noise level at the marker. The RMS value is normalized to a 1 Hz
bandwidth.
10 OTJTPUT 18;“Ip;O3;
20 OUTPUT 718;“MKACT 1;"
30 OUTPUT718;“MKF3GZ;40 OTJTPUT7l8;“MKNOISEON;50 OTJTPUT7l8; MXNOISE?;60 ENTER718;A$70 PRINTA$80 END
When queried (?), MKNOISE returns ON or OF followed by a carriage-return/line-feed (ASCII codes 13, 10).
The end-or-identify state (EOI) is asserted with line feed.
The functions of the MKNOISE and KSM commands are identical.
Programming 241

8/21/2019 analiz_espctros
http://slidepdf.com/reader/full/analizespctros 351/536
MKOFF
Marker Off
MKOFF
The MKOFF command turns off either the active or all markers displayed on the CRT Up to four markers can be
displayed at one time.
OTJTPTJT 18; MKOFF;
242 Programming

8/21/2019 analiz_espctros
http://slidepdf.com/reader/full/analizespctros 352/536
MKP
Marker Position
MKP
item
INTEGER
Description/Default Range Restriction
1 to 1001
The MKP command specifies the marker position horizontally, in display units.
The program line below positions the marker at the first major graticule line
OUTPUT 7 18; “MKP 100;”
When queried (?) , MKP returns the active marker frequency as a real number followed by a carriage-return/line-
feed (ASCII codes 13, 10). The end-or-identify state (EOI) state is asserted with line feed.
Programming 243

8/21/2019 analiz_espctros
http://slidepdf.com/reader/full/analizespctros 353/536
MKPAUSE
Marker Pause
DELAYrPERIOD- \
Item Description/Default
REAL Delay time in seconds.
Range Restriction
0 to 1000 seconds.
The MKPAUSE command pauses the sweep at the active marker for the duration of the delay period.
OUTPUT 718;“MKPAUSE 100;”
When queried (?), MKPAUSE returns the value of the delay period as a real number followed by a
carriage-return/line-feed (ASCII codes 13, 10). The end-or-identify state (EOI) is asserted with line feed.
To turn pause off, turn off markers.
244 Programming

8/21/2019 analiz_espctros
http://slidepdf.com/reader/full/analizespctros 354/536
MKPK
Marker Peak
The MKPK command positions on the active marker on signal peaks.
OUTPUT 718;“MXPK NR;
Executing MKPK HI, or simply MKPK, positions the active marker at the highest signal detected.
If an active marker is onscreen, NH, NR, and NL move the marker accordingly:
Specifying NH moves the active marker to the next signal peak of lower amplitude.
Specifying NR moves the active marker to the next signal peak of higher frequency.
Specifying NL moves the active marker to the next signal peak of lower frequency.
(See also KSK and El .)
Programming 245

8/21/2019 analiz_espctros
http://slidepdf.com/reader/full/analizespctros 355/536
MKPX
Marker Peak Excursion
The MKPX command specifies the minimum signal excursion for the analyzer internal signal-identification routine.
The default value is 6 dB. In this case, any signal with an excursion of less than 6 dB on either side is not identified.
If MKPK HI (peak search) were executed on such a signal, the analyzer would not place a marker at the signal
peak.
OUTPUT 718;“MKPX 8dB;
246 Programming

8/21/2019 analiz_espctros
http://slidepdf.com/reader/full/analizespctros 356/536
MKREAD
Marker Readout
MKREAD
The MKREAD command selects the type of active trace information displayed by the analyzer marker readout:
marker frequency, period, sweep time, inverse sweep time, or fast fourier transform readout.
When queried (?) , MKREAD returns the marker readout type, followed by carriage-return/line-feed (ASCII codes
13, 10). The end-or-identify state (EOI) is asserted with line feed. The program prints “FFT” on the computer
screen.
10 0UTPUT718;“MKREADFFT;
20 OUTF'UT718;“MKREAD?;30 ENTER718;A$40 PRINTAt50 END
Programming 247

8/21/2019 analiz_espctros
http://slidepdf.com/reader/full/analizespctros 357/536
MKRL
Marker to Reference Level
E4)
The MKRL command moves the active marker to the reference level.
OUTF'UT 718;‘WKRL;
The functions of the MKRL and E4 commands, and the front panel @ key are identical.
248 Programming

8/21/2019 analiz_espctros
http://slidepdf.com/reader/full/analizespctros 358/536
MKSP
Marker Span
WW
The MKSP command operates only when the delta marker is on. (See MKD or M3.) When the delta marker is on
and MKSP is executed, the delta marker and active marker determine the start and stop frequencies. The left
marker specifies start frequency, and the right marker specifies stop frequency. If marker delta is off, there is no
operation.
OUTPUT 718;‘MKSp;”
The functions of the MKSP and KS0 commands are identical.
Programming 249

8/21/2019 analiz_espctros
http://slidepdf.com/reader/full/analizespctros 359/536
Delta Marker Step Size
E3)
The MKSS command establishes the center frequency step size as the frequency difference between the delta and
active markers. (See M3 or MKD.)
OUTPUT 718; “MKSS;”
The functions of the MKSS and E3 commands are identical.
250, Programming

8/21/2019 analiz_espctros
http://slidepdf.com/reader/full/analizespctros 360/536
Marker Stop
(KS4
The MKSTOP command stops the sweep at the active marker. (See also KSu.)
OUTPUT 718;“MKSTOp;”
Programming 251

8/21/2019 analiz_espctros
http://slidepdf.com/reader/full/analizespctros 361/536
MKTRACE
Marker Trace
MKTRACE
The MKTRACE command moves the active marker to a corresponding position in trace A, B, or C.
0UTPUT718;“MKTRACETRB;
252 Programming

8/21/2019 analiz_espctros
http://slidepdf.com/reader/full/analizespctros 362/536
MKTRACK
Marker Track
MKTRACK
The MKTRACK command keeps the active marker at the center of the display. To keep a drifting signal at center
screen, place the active marker at the desired signal before executing MKTRACK. (See MT1 and MT@. Also see
( @ key in Section I.)
OTJTPlJT7l8;“MKTRACKON;
Programming 253

8/21/2019 analiz_espctros
http://slidepdf.com/reader/full/analizespctros 363/536
MKTYPE
Marker Type
( M K T Y P E )-
The MKTYPE command specifies the kind of marker,
Specifying MKTYPE AMP allows markers to be positioned according to amplitude, as shown in the line below,which positions a marker on a signal response at the -3 dBm level.
OUTPTJT718;“TS;MKTYPEAMP;M.KA-3;
The program line below returns the 3-dB bandwidth to the controller.
10 0UTPTJT718;“TS;MKPKHI;MKD;20 OUTPUT718; "MKTYPE AMp;MKA-3;30 OUTPUT718;“MKD;MF?40 END
Line 10 executes a sweep, places a reference marker at the signal peak, and enables the delta marker mode.
Line 20 searches for an amplitude that is 3 dB below the reference marker at the signal peak, because the delta
marker mode is active.
The MKD in line 30 establishes the marker that is 3 dB below the peak as the new reference marker. However,
since the amplitude and reference markers cannot occupy the same position, the analyzer searches again for an
amplitude 3 dB below the signal peak and places another marker there. The MF? command returns the frequency
difference between the markers.
Specifying MKTYPE PSN allows markers to be positioned according to a horizontal position in display units. The program line below positions a marker on the third major graticule.
OUTPUT.718;“MKTYPEPSN;MKP300;
Specifying MKTYPE FIXED allows a marker to be placed at any fiied point on the CRT
254, Programming

8/21/2019 analiz_espctros
http://slidepdf.com/reader/full/analizespctros 364/536
ML
Mixer Level
(KS,)
The ML command specifies the maximum signal level that is applied to the input mixer for a signal that is equal to
or below the reference level.
The effective mixer level is equal to the reference level minus the input attenuator setting. When ML is activated,
the effective mixer level can be set from - 10 dBm* to - 70 dBm in 10 dB steps. Instrument preset (IP) selects -
10 dBm.
The program line below sets the mixer level to -40 dBm.
OUTPUT 718;“ML 4ODM;”
As the reference level is changed, the coupled input attenuator automatically changes to limit the maximum signal
at the mixer input to -40 dBm for signals less that or equal to the reference level.
The functions of the ML and KS, commands, and the m b keys are identical. See also AT
In the extended reference level range, the effective mixer level can be set to 0 dBm.
Programming 255

8/21/2019 analiz_espctros
http://slidepdf.com/reader/full/analizespctros 365/536
MOV
Move
r D E S T I N A T I O N 7 r OPERAND 7
trac e
l a b e l t race
l a b e l
data f i e l d
Item Description/Default Range Restriction
TRACE LABEL Alpha character. User-defined label declared inTRDEF statement.
AA- Zz and _
Z- 12 characters required.
VARIABLEIDENTIFIER
Alpha character. User-defined identifier declared in VARDEF statement.
AA-22 and _2- 12 characters required.
Alpha character. Measurement-variable
identifier. such as CF or MA.
Trace element, such as TRA[ 101.
NUMERIC DATAFIELD
Real
The MOV command moves the operand to the destination.
The operand and destination may be of different length: the trace operands (TRA, TRB, TRC, and trace label)range from 1 to 1008 elements in length, and a variable identifier or numeric data field is 1 element long. When
the operand is longer than the destination, it is truncated to fit. When the operand is shorter than the destination,
the last element is repeated to fill the destination.
256 P r o g r a m m i n g

8/21/2019 analiz_espctros
http://slidepdf.com/reader/full/analizespctros 366/536
MPY
Multiply
r D E S T I N A T I O N y r OPERAND 1 -, rOPERAN 2 T
Item Description/Default Range Restriction
TRACE LABEL Alpha character. User-defined label declared in
TRDEF statement.
AA- 22 and _
2- 12 characters required.
VARIABLE
IDENTIFIER
Alpha character. User-defined identifier
declared in VARDEF statement.
AA-22 and _
2- 12 characters required.
Alpha character. Measurement-variable
identifier, such as CF or MA.
Trace element, such as TRA[ lo].
NUMERIC DATA
FIELD
Real
The MPY command multiples the operands, point by point, and places the result(s) in the destination.
operand 1 x operand 2 - destination
The operands and destination may be of different length: the trace operands (TRA, TRB, TRC, and trace label)
range from 1 to 1008 elements in length; and a variable identifier or numeric data field is 1 element long. When
operands are of different lengths, the last element of the shorter operand is repeated and multiplied with the
remaining elements of the longer element. When the operands are longer than the destination, they are truncated
to fit.
Programming 257

8/21/2019 analiz_espctros
http://slidepdf.com/reader/full/analizespctros 367/536
MPY Continued
The results and operands of trace math are truncated if they are not within certain limits. If operating on traces A,
B, or C, results must be within 1023. If operating on user-defined traces, results must be within 32,767.
OUTF’UT 718;“Ml’Y TFLA,TFLC,TRB;”
258 Programming

8/21/2019 analiz_espctros
http://slidepdf.com/reader/full/analizespctros 368/536
MRD
Memory Read Word
ANAL YZERMEMORY
r -ADDRESS 7
MRD integer
Item Description/Default Range Restriction
INTEGER ASCII decimal number representing analyzer
memory address.
Must be even.
J
The MRD command reads two bytes, starting at the indicated spectrum analyzer memory address, and returns the
word to the controller.
Programming 259

8/21/2019 analiz_espctros
http://slidepdf.com/reader/full/analizespctros 369/536
MRDB
Memory Read Byte
ANAL YZERMEMORY
FADDRESS-
MRDB
Description/Default Range Restriction
INTEGER ASCII decimal number representing analyzer
memory address.
The MRDB command reads the 8-bit byte at the analyzer memory address, and returns the byte to the controller,
as ASCII code.
260 Programming

8/21/2019 analiz_espctros
http://slidepdf.com/reader/full/analizespctros 370/536
MT0
Marker Track Off
The MTP) command disables the marker tracking mode. (See MKTRACK and MT1 . Also see @ key in Section
I.1
OUTPUT 718;“IWl’0;”
Programming 261

8/21/2019 analiz_espctros
http://slidepdf.com/reader/full/analizespctros 371/536
MT1
Marker Track On
(X--)--Q
The MT1 command keeps the active marker at the center of the display. To keep a drifting signal at center screen,
place the active marker at the desired signal before executing MTl. (See MKTRACK and MT@. Also see @ key
in Section I.)
OUTPUT 718;“MTl;”
262 Programming

8/21/2019 analiz_espctros
http://slidepdf.com/reader/full/analizespctros 372/536
MWR
Memory Write Word
ANAL YZERMEMORY
- A D D R E S S - - M E S S A G E - - \
in teger
I Item Description/Default Range RestrictionI
INTEGER ASCII decimal number representing analyzer
memory address.
Must be even number.
INTEGER ASCII decimal number indicating number of
bytes to read.
The MWR command writes a two-byte message to spectrum analyzer memory, starting at the indicated address.
Programming 263

8/21/2019 analiz_espctros
http://slidepdf.com/reader/full/analizespctros 373/536
MWRB
Memory Write Byte
ANAL YZERMEMORY
ADDRESS - M E S S A G E
MWRB
Item Description/Default Range Restriction
INTEGER ASCII decimal number representing analyzer
memory address.
INTEGER ASCII decimal number representing one 8-bit
byte.
The MWRB command writes a one-byte message to a memory address in the analyzer.
2 6 4 P r o g r a m m i n g

8/21/2019 analiz_espctros
http://slidepdf.com/reader/full/analizespctros 374/536
MXM
Maximum
r D E S T I N A T I O N 7 rOPERAND 1 -\ r OPERAND 2 T
Item Description/Default Range Restriction
TRACE LABEL Alpha character. User-defined label declared in
TRDEF statement.
AA-Z.Zand-
2- 12 characters required.
VARIABLE
IDENTIFIER
Alpha character. User-defined identifier
declared in VARDEF statement.
AA-22 and _
2- 12 characters required.
Alpha character. Measurement-variable
identifier, such as CF or MA.
Trace element, such as TRA[ 101.
NUMERIC DATA
FIELD
Real
The MXM command compares operand 1 and operand 2, point by point, sending the greater value of each
comparison to the destination.
If one of the operands is a single value, it acts as a threshold, and all values equal to or greater than the threshold
pass to the destination.
The operands and destination may be of different length. However, the destination must be as long as the largest
operand. The trace operands (TFW, TRB, and TFK, and trace label) range from 1 to 1008 elements in length,
and a variable identifier or numeric data field is 1 element long.
P r o g r a m m i n g 265

8/21/2019 analiz_espctros
http://slidepdf.com/reader/full/analizespctros 375/536
MXM (Continued)
The operands are truncated if they are not within certain limits. The limit for operands other than trace A, B, or C,
is 32,767.
OuTpuT718; MxMTRA,TRC,TRB;
266 Programming

8/21/2019 analiz_espctros
http://slidepdf.com/reader/full/analizespctros 376/536
MXMH
Maximum Hold
The MXMH command updates each trace element with the maximum level detected, while the trace is active and
displayed. The functions of the MXMH and A2 commands, and front panel Iz] key are identical.
ANALOG DISPLAY
V I D E O _ AMPL I TUDE MEMORYDETECTOR D KiThAL COMPARATOR ADDRESSES
= CTROT
C O N V E R T E R i ; ;;t i - 1 0 0 1 REFRESH D’SPLAYOR
1 0 2 5 - 2 0 2 5
1CLOSED IF RESPONSE AMPLITUDE ’
STORED AMPLITUDE
Programming 267

8/21/2019 analiz_espctros
http://slidepdf.com/reader/full/analizespctros 377/536
Ml
Marker Off
The Ml command blanks any markers present on the CRT (See also M2, MKOFF, and MKN.)
OUTPUT 718; Ml;
268 Programming

8/21/2019 analiz_espctros
http://slidepdf.com/reader/full/analizespctros 378/536
M2
Marker Normal
NW
- M A R K E R F R E O U E N C Y \
-0P r e a l
Item Description/Default Range Restriction I
Real Default value for units is Hz.I
I
The M2 command moves the active marker to the marker frequency. If the active marker is not declared with
MKACT, the active marker number is 1.
OUTPUT 718;“M2;”
The functions of the M2 and MKN commands are identical.
Programming 269

8/21/2019 analiz_espctros
http://slidepdf.com/reader/full/analizespctros 379/536
Delta Marker
(MW
DELTA MARKER FREOUENCY
Item
REAL
Description/Default
Selects delta marker frequency. Default valuefor units is Hz.
Range Restriction
The M3 command computes the frequency and amplitude difference of the active marker and a special marker,
called the delta or differential marker. These values are displayed in the display readout.
Differential value = active marker frequency - delta marker frequency
Differential value = active marker amplitude - delta marker amplitude
If a delta marker is not on screen, MKD places one at the specified frequency, or at the right side of the CRT If an
active marker is not on screen, MKD positions an active marker at center screen. (The active marker is the number
1 marker, unless otherwise specified with the MKACT command.)
270 Programming

8/21/2019 analiz_espctros
http://slidepdf.com/reader/full/analizespctros 380/536
(Continued) M3
OUTPUT 718; “M3 120MZ;”
The M3 command function is identical with that of the MKD command, and similar to that of the front panel a
key.
Programming 27 1

8/21/2019 analiz_espctros
http://slidepdf.com/reader/full/analizespctros 381/536
M4
Marker Zoom
The M4 command activates a single marker at center frequency, the DATA knob changes the position of the
marker and the STEP keys change the frequency span and sets the center frequency equal to the marker frequen-
cy The functions of the M4 command and the front panel Marker Mode a key are identical.
Once a single marker is positioned anywhere on the display, executing the M4 command immediately positions
the marker at center frequency.
OUTPUT 718; “M4;
272 Programming

8/21/2019 analiz_espctros
http://slidepdf.com/reader/full/analizespctros 382/536
NSTART
Start Harmonic
NSTAAT
Item
INTEGER
Description/Default
Real number representing analyzer LO
harmonic.
Range Restriction
4- 63
The NSTART command specifies the start harmonic for the signal identification (SIGID) routine. The signal
identification routine searches with all harmonics between the start harmonic (NSTART) and the stop harmonic
(NSTOP) .
Programming 273

8/21/2019 analiz_espctros
http://slidepdf.com/reader/full/analizespctros 383/536
NSTOP
Stop harmonic
NSTOP
I Item Description/Default Range Restriction
INTEGER Real number representing analyzer LOharmonic.
4-63
The NSTOP command specifies the stop harmonic for the signal identification (SIGID) routine. The signal identifi-
cation routine searches with all harmonics between the start harmonic (NSTART) and the stop harmonic
(NSTOP) .
274 Programming

8/21/2019 analiz_espctros
http://slidepdf.com/reader/full/analizespctros 384/536
OL
Output Learn String
The OL command transmits information to the controller that describes the state of the analyzer when the OL
command is executed. This information is called the learn string. The learn string can be sent from the controller memory back to the analyzer to restore the analyzer to its original state.
A list of the learn string contents and coding, and the control settings restored when the learn string is sent to the
analyzer is provided in Appendix C. Note that the trace data and the state of some analyzer functions are not
contained in the learn string.
The learn string requires 80 bytes of storage space. The program below sends the value of the resolution band-
width to the controller.
10 DIM A$[801
20 PRINTER IS 70130 !
40 OUTPUT 718;“OL;"50 ENTER 718 USING “80A”;A$
60 Bandwidth = NUM(A$[27,27])70 PRINT SHIFl’ (Bandwidth,4)
80 !
90 END
Line 10: Dimensions enough storage to contain the 80-byte learn string.
Lines 40 to 50: Reads and stores the contents of the learn string.
Lines 60 to 70: Prints the numerical equivalent of bits 4 through 7 of byte 27.
When this program is run, the printer prints the code for the current bandwidth. The instrument state is not
affected. Interpreting the codes of some function values, such as resolution bandwidth, requires additional pro-
gram lines that equate these codes to specific function values.
Use OL command to return the state of most instrument functions to the controller simultaneously. Use a query (?)
to return the state of a single instrument function. Below, a query returns the value of the input attenuation to the
controller.
10 OUTPUT 718; “AT?; ”20 ENTER 718;N
30 END
The OL command and ,?” do not alter the state of the spectrum analyzer, and for this reason, are the best way to
send the states of the analyzer functions to the controller. An analyzer state may be returned to the controller with
“OA”, but this sometimes necessitates changing the analyzer state. For example, the program below changes the
attenuation from the coupled state to the uncoupled state when the attenuation value is queried with OA.
10 OUTPUT 718;“AT; OA;”20 ENTER 718;N30 END
Programming 275

8/21/2019 analiz_espctros
http://slidepdf.com/reader/full/analizespctros 385/536
ONEOS
On end of sweep
/ .
O N E O S
STRING DATA F I ELDa\
s t r i n g command
d e l i m i t e r I i s t
A -B LOC K DA TA F I ELD
l e n g t h
I - B L O C K D A T A F I E L D
Item Description/Default Range Restriction
COMMAND LIST Alphanumeric character. Any spectrum
analyzer command from this section.
STRING
DELIMITER
Mark beginning and end of command string. “ %&‘{: = \2 ’
End and beginning delimiters must be
identical.
COMMAND LIST Any spectrum analyzer command from this
section, except TS, ONSWR or ONEOS.
LENGTH Two &bit bytes specifying length of command
list, in &bit bytes. The most significant byte is
first: MSB LSB.
At the end of the sweep, the ONEOS command executes the contents of the data field.
OUTPUT 718;“ONEOS”“CF 1OOMZ;” ” ”
When queried (?) , ONEOS returns the command list.
2 7 6 Pr o g r a m m i n g

8/21/2019 analiz_espctros
http://slidepdf.com/reader/full/analizespctros 386/536
ONSWP
On Sweep
STRING DATA F IELD
ONSWP s t r i n g commandd e l i m i t e r
I i s t
A -B L OCK DA TA F IELD
l e n g t h commandI i s t
I - B L O C K D A T A F I E L D
commandI i s t
Item Description/Default Range Restriction
COMMAND LIST Alphanumeric character. Any spectrum
analyzer command from this section.
STRING
DELIMITER
Mark beginning and end of command string. “$%&&‘{: = \2 ’
End and beginning delimiters must be
identical.
COMMAND LIST Any spectrum analyer command from thissection.
LENGTH Two &bit bytes specifying length of command
list, in &bit bytes. The most significant byte is
first: MSB LSB.
At the beginning of the sweep, the ONSWP command executes the command list.
OUTPUT 718;“ONSV7P”“CF 1OOMZ;” ” ”
When queried (?) , ONSWP returns the command list.
P r o g r a m m i n g 2 7 7

8/21/2019 analiz_espctros
http://slidepdf.com/reader/full/analizespctros 387/536
OP
Output Parameter
OP
The OP command returns parameter values, Pl and P2, which represent the dimensions of the lower left, and
upper right analyzer display. The values returned represent X and Y in display units.
A typical response to OP is O,O, 1023,1023;
0 , 1 0 2 3 , 1 0 2 3
/O. / \ \PlX PlY P2X P2Y
OUTFVT 718; “OP?;
278 Programming

8/21/2019 analiz_espctros
http://slidepdf.com/reader/full/analizespctros 388/536
OT
Output Trace Annotations
(T-J--Q
The output annotations command sends 32 character-strings, each up to 64 characters long, to the controller.
These character strings contain all the CRT annotations except annotations written with the label command, LB,
the title mode, KSE, or the text command, TEXT The controller must read all 32 strings to successfully execute
the command. The strings, listed below in the order they are sent, contain the following information:
String Readout
1
2
3
4
5
67
8
9
10
11
12
13
14
15
16
1718
19
20
21
22
23
24
25
26
27
2829
30
31
32
“BATTERY”
“CORR’D”
resolution bandwidth
video bandwidth
sweep time
attenuationreference level
scale
trace detection
center frequency or start frequency
span or stop frequency
reference level offset
display line
threshold
marker frequency
marker amplitude
frequency offsetvideo averaging
title
“PLl UNLOCK”
“PL2 UNLOCK”
“Y-I-0 UNLOCK”
“HET UNLOCK”
“M/N UNLOCK”
“REFUNLOCK”
“EXT/OVEN”
“MEAS UNCAL” ” * ”
frequency diagnostics
“SRQ”
center frequency “STEP”
active function
The following program stores all the CRT annotations in the string array, A$:
10 DIMA$(32)[64120 PRINTERIS
30 !
Programming 279

8/21/2019 analiz_espctros
http://slidepdf.com/reader/full/analizespctros 389/536
OT (Continued)
40 OUTPTJT718; OT50 FORN=lTO3260 ENTER718;A$[N]70 NEXTN
80 !
90 FORN=lTO32
100 PRINTA$(N)110 NEXTN120 END
After turning line power on, an OT command and print routine print the following string array contents:
1
2
3
4
5
67
8
9
10
11
12
13
14
15
16
1718
19
20
21
22
23
24
25
26
27
28
29
30
31
32
RES BW 3 MHz
VBW 3 MHz
SWP 500 msec
ATTEN 10 dBREF 0.0 dBm
10 dB/
START 2.0 GHz
STOP 22.0 GHz
HP-IB ADRS:
All blank lines represent empty strings.
280 Programming

8/21/2019 analiz_espctros
http://slidepdf.com/reader/full/analizespctros 390/536
01,02,03,04
FORMAT STATEMENTS
The spectrum analyzer outputs must be formatted appropriately for the controller and measurement requirements.
The spectrum analyzer transmits decimal or binary values, via the Hewlett-Packard Interface Bus (HP-IB), to a
controller or other HP-IB device, such as a printer. The decimal and binary values represent trace information or
instructions.
The format characteristics are summarized in the table below.
Analyzer Output
Output Example of Marker
Format Amplitude. Marker is at 10 dBm
Command reference level.
Sends trace information only as a decimal value in Hz,
dB, dBm, volts, or seconds.
0 3 - 10.00
Sends trace amplitude and position information, or
instruction word as decimal values ranging from 0 to
4095:
0 1 1001
0 to 1023 represent positive, unblanked amplitudes
in display units.
1024 to 2047 are instruction words (analyzer
machine language).
2048 to 3071 represent positive, blanked amplitudes
in display units.
3072 to 4095 represent negative, blanked
amplitudes in display units.
Sends trace amplitude and position information, or
instruction word as binary values in two 8-bit bytes,
sending the most significant bit first. The four most
significant bits are zeroes.
0 2 0000 xxxx x x x x x x x x
(3) 231)
values 0 to 4095
Sends trace amplitude information only as binary value
in one &bit byte, composed from the 02 output bytes:
o o o o x x x x x x x x x x x x 0 2
11 /I////
x x x x x x x x 0 4
0 4 x x x x x x x x
250)values 0 to 255 (full scale)
Programming 28 1

8/21/2019 analiz_espctros
http://slidepdf.com/reader/full/analizespctros 391/536
01,02,03,04 (Continued)
03 Format
The 03 format transmits trace amplitude information only, in measure units: Hz, dBm, dB, volts, or seconds. The
03 format cannot transmit instruction words.
A carriage-return/line-feed (ASCII codes 13, 10) always follows any data output. The end-or-identify state (EOI)
is asserted with line feed.
Instrument preset (IP) automatically selects the 03 format.
01 Format
The 01 format transmits trace amplitude information as decimal values in display units. (See Chapter 4 in Section
I for a description of display units.)
Trace amplitude values can be positive and unblanked, positive and blanked, or negative and blanked. Positive,
unblanked values (fJ to 1023) cover the visible amplitude range on the spectrum analyzer CRT
Negative trace values (3072 to 4095) usually result from trace arithmetic, and are not displayed because they are
off (below) the screen. Negative values are represented by the X&bit two’s complement of the negative number,
that is, 4096- (negative valuel. For example, a - 300 values is an output of 3796.
4096 I- 3001 = 3796
Positive, blanked values (2048 to 3071) are those responses immediately ahead of the updated, sweeping trace.
These values form the blank-ahead marker, and represent the amplitude responses of the previous sweep, plus
2048. Thus, they are off (above) the screen (See Appendix B.)
The 01 format also transmits instruction words as decimal values. See the Instruction and Data Word Summary inAppendix B.
A carriage-return/line-feed (ASCII codes 13, 10) always follows any data output in the 01 format. The
end-or-identify state (EOI) is asserted with line feed.
02 Format
The 02 format transmits trace information or instruction words as two 8-bit binary numbers. The most significant
bit is sent fii. The four most significant bits are always zeroes.
Most Significant Byte Least Significant Byte
0000 xxxx xxxxxxxx
Refer to the Consolidated Coding table in Appendix B for instruction word information.
Note that the 02 format sends the same kind of information that the 01 format sends, except that 02 transmits
the information in binary numbers instead of decimal numbers. Also, the end of transmission is not marked by
carriage-return/line-feed (ASCII codes 13, 10) in the 02 format.
282 Programming

8/21/2019 analiz_espctros
http://slidepdf.com/reader/full/analizespctros 392/536
04 Format
(Continued) 01,02,03,04
The 04 format transmits trace amplitude information only as a binary number. The binary number is one 8-bit byte
composed from the bytes established with the 02 format.
0000 xxxx xxxxxxxx 02
ll//////
xxxxxxxx 04
The 04 output is the fastest way to transmit trace data from the spectrum analyzer to the HP-IB bus. However, sign
information is lost. Keep this in mind when transmitting delta marker information (MKD) . The end of data trans-
mission is NOT marked by a carriage-return/line-feed.
Format Statements and the HP-IB Bus
The table below shows a transmission sequence on the HP-IB bus for each of the four formats. Each format is
transmitting the amplitude of a marker positioned at the - 10 dBm reference line.
Format
BVte
Bvte
Byte
We
BVte
Bvte
Carriage Return
Line Feed
EOI asserted)
0 3 01 0 2 0 4
NUM(-) NUM “1 ) 3) (250)
NUM (1) NUM( 0 ) 231)
NUM (0 ) NUM 0 )
NUM . NUM (“1")
NUM (0) 13
NUM (0) 10
13
10
Though the spectrum analyzer transmits either binary or digital information on the HP-IB bus, a decimal number is
always returned to the controller display. This is illustrated in the program below, which reads the instruction word
1040 at display address 0, the fist memory location of trace A. The program reads the instruction word, using
each of the formats, and the DR command.
1 ASSIGN@SaTO718
2 P R I N T E R I S
4 OUTPUT @Sa; Al;S2;TS;10 OlJTPUT@Sa;“DA001DR20 ENTER@Sa;Drl30 OlJTPTJT@Sa; DA002DR
Programming 283
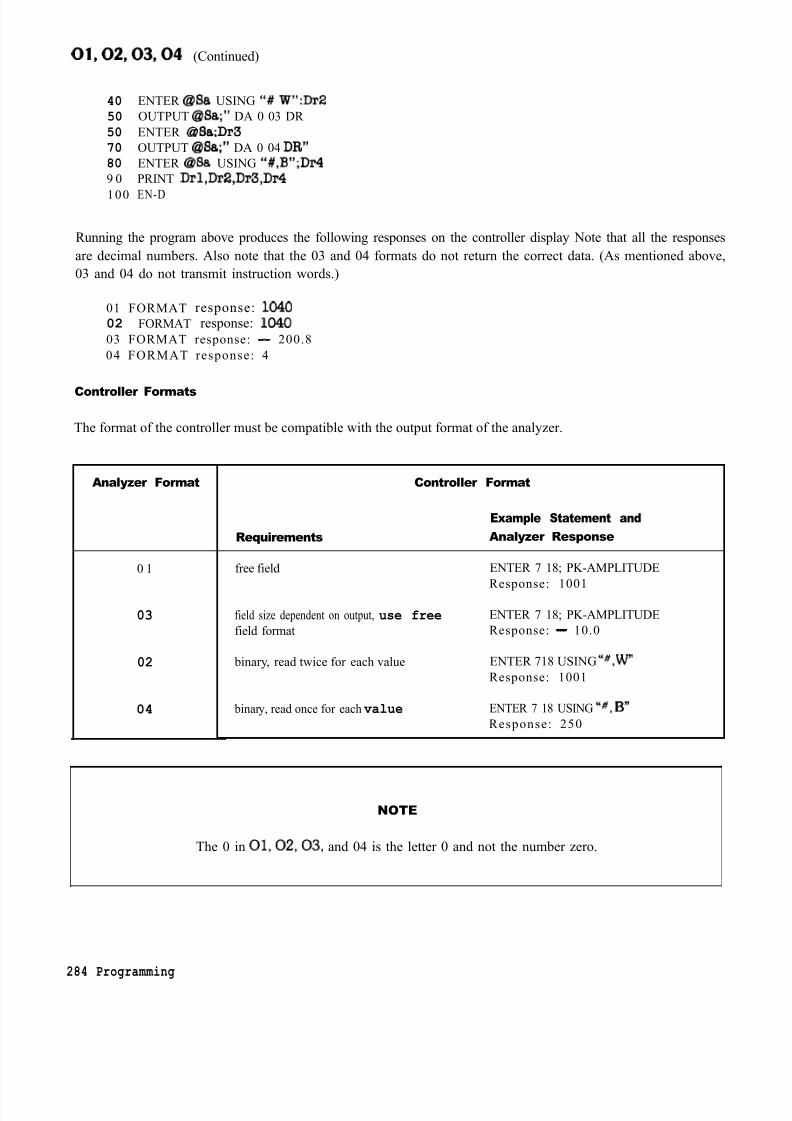
8/21/2019 analiz_espctros
http://slidepdf.com/reader/full/analizespctros 393/536
01,02,03,04 (Continued)
40 ENTER @Sa USING “# W”:Dr2
50 OUTPUT @Sa;” DA 0 03 DR
50 ENTER @Sa;Dr3
70 OUTPUT @Sa;” DA 0 04 DR”
80 ENTER @Sa USING “#,B”;Dr4
9 0 PRINT Drl,Dr2,Dr3,Dr4
100 EN-D
Running the program above produces the following responses on the controller display Note that all the responses
are decimal numbers. Also note that the 03 and 04 formats do not return the correct data. (As mentioned above,
03 and 04 do not transmit instruction words.)
01 FORMAT response: 1040
02 FORMAT response: 1040
03 FORMAT response: - 200.8
04 FORMAT response: 4
Controller Formats
The format of the controller must be compatible with the output format of the analyzer.
Analyzer Format Controller Format
0 1
03
02
04
Requirements
Example Statement and
Analyzer Response
free field ENTER 7 18; PK-AMPLITUDE
Response: 1001
field size dependent on output, use free
field format
binary, read twice for each value
ENTER 7 18; PK-AMPLITUDE
Response: - 10.0
ENTER 718 USING “#,w”
Response: 1001
binary, read once for each value ENTER 7 18 USING “++‘, B”
Response: 250
NOTE
The 0 in 01,02,03, and 04 is the letter 0 and not the number zero.
284 Programming

8/21/2019 analiz_espctros
http://slidepdf.com/reader/full/analizespctros 394/536
PA
Plot Absolute
PA
rX POSITION7 ,-Y POSITION7
integer
Item
INTEGER
Description/Default
Represents x,y coordinates of vector endpoint(s), in display units.
Range Restriction
0- 1022
The PA command specifies in display units a vector location on the CRT relative to display reference coordinates0,O. (See also display size commands Dl, D2, and D3.) The vector is drawn on the CRT if the pen-down (PD)
command is in effect. If the pen-up (PU) command is in effect, the vector does not appear of the CRT A sample
program using the PA command is shown below.
10 ASSIGN @Sa TO71820 OUTPUT @Sa;“IP;A4;KSm;KSo;30 OUTPUT @Sa;“DB;PU;40 OUTPUT@Sa;“PA700,500;PD900,5OO;50 0UTPUT@Sa;“900,300,700,300,700,500;80 END
Line 20:
Line 30:
Line 40:
Line 50:
Presets the analyzer and clears the display
Specifies the full CRT display size. The pen-up command prevents the initial vector (to point
700,500) from being drawn.
Specifies the starting point of the rectangle to be drawn by the program (coordinates 700,500).
The PD (pen-down) command causes a vector to be drawn on the CRT from the starting point
coordinates to the next set of coordinates (900,500) specified in the program.
Plots the remainder of the rectangle on the CRT The pen-down command remains in effect.
Programming 285

8/21/2019 analiz_espctros
http://slidepdf.com/reader/full/analizespctros 395/536
PD
Pen Down
X Y/ - C O O R D I N A T E -\ r C O O R D I N A T E 7
Item
INTEGER
Description/Default
Represents x,y coordinates of vector endpoint(s), in display units.
Range Restriction
0- 1022
The PD command draws one or more vectors on the analyzer screen. The PA command, plot absolute, may be
used to mark the starting point of the vector.
10 ASSIGN @Sa to 71820 OlJTPDT @@a; “IP,A4;KSm;KSo;”30 OIJTPUT @Sa;“D3;PU;”40 OUTPTJT @Sa;“PA 300,500;PD 450,250;”50 OUTPTJT@Sa;“150,250,300,500;”
60 END
Line 20:
Line 30:
Line 40:
Line 50:
Presets the instrument and clears the display.
Specifies the expanded CRT display size. The pen-up command ensures that the initial vector to
point (300,500) is not drawn.
Plot absolute command and the starting point of the triangle. The following pen-down command
draws the vector from (300,500) to (450,250).
Plots the remainder of the triangle on the CRT The pen-down condition is still in effect.
286 Programming

8/21/2019 analiz_espctros
http://slidepdf.com/reader/full/analizespctros 396/536
PDA
Probability Distribution in Amplitude
RESOLUTIONrDESTINATION- - S O U R C E -- \ r PARAMETER -\
PDA
Item Description/Default Range RestrictionI
REAL
TRACE LABELDefault is dBm.Alpha character. User-defined label declared inTRDEF statement.
AA-ZZand-2- 12 characters required.
The PDA command loads the destination trace according to the pattern of amplitude values in the source trace.
Thus, the destination trace represents the amplitude probability function of the source trace.
The assumption is that the source trace is taken from the display. Hence, the values of the source trace are in dBm
(or dBmV or dBpV) when the display is in the log mode, or in display units when the display is in the linear mode.
The resolution parameter determines how the screen is divided vertically to create the probability function.
If the display is in the 10 dB/div log mode and the resolution parameter is specified as 5, then the screen is divided
into twenty 5-dB increments. Each value of the source trace is tested in turn and the appropriate element of the
destination trace is incremented by one. For example, if the first point of the source trace is 12 dB below the
reference level (and thus falls in the eighteenth 5-dB increment from the bottom of the screen), then the 18th
element of the destination trace is incremented. Note that the destination trace must have an appropriate number
of points (in this case, 20).
If the display mode is linear, then the resolution parameter divides the screen into increments that are a percentage
of the total number of display units within the graticule (1000). For example, if the resolution parameter is 5, the
screen is divided into twenty 50-display-unit increments (5% of 1000 is 50). Otherwise, the procedure is the sameas above.
The data need not be taken from the screen. PDA can be used on an array of calculated data. However, the
resolution parameter must be chosen as if the data were in display units. For example, if the array values vary from
0 to 200, and you want to divide it into twenty increments (1 - 10, 11 - 20, 21- 30, etc.), then the resolution
parameter must be 1.0 (1.0% of 1000 is 10).
Programming 287

8/21/2019 analiz_espctros
http://slidepdf.com/reader/full/analizespctros 397/536
Probability Distribution in Frequency
rDESTINATION-\ r SOURCE -\
Item
TRACE LABEL
Description/Default Range Restriction
Alpha character. User-defined label declared in AA- 22 and _
TRDEF statement. 2- 12 characters required.
When the PDF command is executed, elements of the source trace that are above the threshold value cause
corresponding elements in the destination trace to be increased in amplitude by one display unit. The threshold
value may be specified by the TH command. Otherwise, its default value is nine major divisions below the
reference level.
OUTPTJT 718;“TRDEF S-AMJ?LE,SO;”
OUTPUT 718;“PDF S>MFLE,TRA;”
288 Programming

8/21/2019 analiz_espctros
http://slidepdf.com/reader/full/analizespctros 398/536
PEAKS
Peaks
PEAKS
rDESTINATION- r SOURCE
I Description/Default Range Restriction
TRACE LABEL Alpha character. User-defined label declared inTRDEF statement.
AA- 22 and _2- 12 characters required.
The PEAKS command sorts signal peaks by frequency or amplitude. PEAKS sorts the source trace and sends
sorted results to the destination trace.
10 OUTPUT 718; “Ip;”20 OUTPUT 718;“TRDEF FBEQ;”30 OUTPUT 718;“TS;MOV FREQ,TBA;”40 OUTPUT 718;“PEAKS TRC,FREQ,FBQ;”
80 END
When sorting by frequency, PEAKS first computes, in display units, the horizontal position of all peaks. These
values are consecutively loaded into the destination trace, the lowest value occupying the first element. Thus,
signal horizontal positions, from low to high, determine the amplitude of the destination trace from left to right. To
obtain results in frequency units, scale the destination trace from display units to frequency units using either the
center frequency and frequency span, or the start and stop frequencies.
When sorting by amplitude, PEAKS first computes the amplitudes of all peaks in the source trace. The horizontal
position corresponding to each signal peak is loaded, in display units, into the destination trace. The horizontal
position corresponding to the signal with the highest amplitude is loaded into the first element of the destination
trace. The horizontal position corresponding to the signal with the second highest amplitude is loaded into thesecond element of the destination trace, and so on. It is in this manner that the horizontal positions corresponding
to signals ranging from the highest amplitude to the lowest amplitude determine, from left to right, the amplitude of
the destination trace.
PEAKS only sorts signals that are above the threshold value; to change the threshold, use the TH command
before PEAKS is executed.
If necessary, the last sorted value is repeated to fill remaining elements of the destination trace.
Programming 289

8/21/2019 analiz_espctros
http://slidepdf.com/reader/full/analizespctros 399/536
PEAKS (Continued)
PEAKS also returns the number of signal peaks found. To access this value, execute
ENTER718;N
PRINTN
after line 40 of the example program.
To access the data in the destination trace once PEAKS is executed, move the indexed trace data into a variable
and display the variable on the screen, or return it to the controller by querying the variable. The following
program example displays the first value of the destination trace, TRC, on the analyzer screen at the analyzer’s
current pen location.
10 OUlTUT718; VARDEFFlRST,O;20 OUTPTJT718;“MOVFIFfST,TFKI[1];30 OUTPUT718;“DSPLYFIRST,4.5;40 END
290 Programming

8/21/2019 analiz_espctros
http://slidepdf.com/reader/full/analizespctros 400/536
PLOT
Plot
PLOT
Item Description/Default Range Restriction
PlX
PlY
P2X
P2Y
Plotter-dependent values that specify lower left
plotter dimension.
Plotter-dependent values that specify upper
right plotter dimension.
Plotter dependent
Plotter dependent
The trace data, graticule, and annotation of the analyzer’s screen can be directly transferred via HP-IB to a Hewlett-Packard plotter such as the 7245A/B, 724OA,7470A, 9872C, or 7550 using the PLOT command.
Before executing a program, set the HP-IB on the plotter to address 5:
16 8 4 2 1
4+1=5\ /
ADDRESS
If the address switch on the plotter cannot be located, refer to the plotter’s operation manual.
When using the PLOT command, the scaling points (Plx, Ply; P2x, P2y) must be specified. These scaling points
specify the x,y coordinates which determine the size of the plot. (For more scaling point information, refer to the
plotter’s operation manual.)
P2x,P2y
I - _ - - - - - -+
;
I
I
I
I
C-------J
Plx,Ply
Programming 29 1

8/21/2019 analiz_espctros
http://slidepdf.com/reader/full/analizespctros 401/536
PP
Preselector Peak
The PP command optimizes preselector tracking to peak the amplitude of a signal at the active marker. If a marker
is not on screen, PP places a marker at the highest signal level, and optimizes preselector tracking at that frequency.
Normally, preselector tracking is automatically maintained so that the center of the preselector filter tracks the
sweep. The PP command monitors the signal amplitude at the marker while the preselector frequency is adjusted
to yield the maximum level of the signal response, provided the signal is a stable continuous wave signal. Use the
KS/ command to manually adjust the preselector frequency when measuring unstable signals.
OUTPUT.718;“Pp;
The functions of the PP command and the @ key are identical. (See KS/ and KS = .)
292 Programming

8/21/2019 analiz_espctros
http://slidepdf.com/reader/full/analizespctros 402/536
PR
Plot Relative
Xr C O O R D I N A T E 7 7 COOR NATE 7
PR
Item Description/Default Range RestrictionI
INTEGER Represents CRT beam x and y coordinates, indisplay units, relative to the last beam position.
0- 1022
The PR command specifies a plot location on the CRT relative to the last plot point coordinates. Vector coordinate
sets (x,y pairs) following the PR command can be either positive or negative, depending on the direction the
individual vectors are to be drawn. PU (pen-up) and PD (pen-down) commands tell the analyzer to draw or not
draw the vectors on the CRT display.
A typical use of the PR command is shown in the sample program below.
10 ASSIGN @Sa TO 71820 OUTPTJT@Sa;“IP;A4;KSm;KSo;”30 FOR X = 200 TO 800 STEP 20040 OUTPUT @Sa;“PUPA”,X,l,l*X
50 GOSTJB Rectangle60 NEXTX
70 STOP80 Rectangle:90 OUTPUT @Sa;“PD PR 300,0,0- 200,- 300,0,0,200”100 RETTJRN
110 END
Line 20:
Line 40:
Line 90:
Presets the analyzer and clears the display.
PA (plot absolute) command defines the starting point for the three rectangles to be drawn on the
CRT display.
PD (pen-down) command tells the analyzer to display the vectors drawn in accordance with the
vector coordinates (x,y pairs) that follow the PR command. Vectors are then drawn to the four
corners of the current rectangle.
Programming 293

8/21/2019 analiz_espctros
http://slidepdf.com/reader/full/analizespctros 403/536
PS
Skip Page
The PS command causes the address pointer to skip over the addresses in the remaining portion of the display
memory page in use, and go to the first address at the beginning of the next display memory page. Display control
work 1056 (DW 1056) can be substituted for the PS command.
If PS is executed when the address pointer is at an address in the fourth and last page (Trace C) of display memory,
the pointer skips to address B in page 1. Because the program does not wait for a new refresh cycle l to begin
before executing the next instruction, the skip may cause an increase in trace intensity as new data is written over
the old. Increased trace intensity occurs only when the time span of the program is less than the default refresh
rate. End-of-display control instruction word 1028 in the trace C page normally makes sure a refresh cycle occurs.
A typical use of the PS command is shown in the sample program below.
10 ASSIGN@Sato71820 OUTPUT @Sa;“IP,S2;TS;DAlOO;PS;30 END
In the sample program above, the analyzer is preset (IP), put in the single-sweep mode (Sl), instructed to take a
single sweep (TS), and then, from address 100 (DAlOO) in display memory page 1 (trace A), skip over (PS) the
remainder of the page 1 addresses to the fist address in display memory page 2 (trace B) .
(See Appendix B.)
l (Refresh means to update the display from the display memory. Refresh cycles occur at a rate of approximately 50 Hz
294 Programming

8/21/2019 analiz_espctros
http://slidepdf.com/reader/full/analizespctros 404/536
PU
Pen-up
The PU command blanks the CRT beam to prevent plot vectors from being displayed on the CRT.
A typical use of the PU command is shown in the sample program below.
10 ASSIGN@SaTO71820 OUTPUT @Sa;“IP,A4;KSm;KSo;30 OUTPUT@Sa;“D2;PU;40 OUTPUT@Sa;“PA700,500PD900,50050 OUTPUT @Sa;“900,300,700,300,70060 END
Line 20:
Line 30:
Line 40:
Line 50:
Presets the instrument and clears the display.
Specifies display size D2 and, with the PU command, instructs the analyzer not to display the
vector to the initial point specified by x,y coordinates 900,500.
PA (plot absolute) command establishes the starting point of the rectangle to be drawn on the
CRT The following PD (pen-down) command instructs the analyzer to display the vector to
coordinates 700,500.
Plots and displays the remainder of the rectangle on the CRT
Programming 295

8/21/2019 analiz_espctros
http://slidepdf.com/reader/full/analizespctros 405/536
PWRBW
Power Bandwidth
PERCENT OFrTOTAL POWER-
PWRBW
Item Description/Default Range Restriction
TRACE LABEL
REAL
Alpha character. User-defined label declared in
TRDEF statement.
AA- 2.7 and _
2- 12 characters required.
0 to 100
The PWRBW command first computes the combined power of all signal responses contained in a trace array. The
command then computes the bandwidth equal to a percentage of the total power, and returns this value to the
controller.
For example, if the percent of total power is specified as 100%) the power bandwidth equals the frequency range
of the CRT display, which is 100 MHz if the frequency span per division is 10 MHz. If 50% is specified, trace
elements are eliminated from either end of the array until the combined power of the remaining signal responses
equals half of the original power computed. The frequency span of these remaining trace elements is the power
bandwidth returned to the controller.
The following example computes the power bandwidth of a trace, and returns 99% of the total power.
10 OUTPUT 718;“VARDEF P-BW,O;”20 OUTPUT 718;“MOVP,BW,PWRBW l’RA,99.0;”
30 OUTPU C 718; “DIV P,sW,P,BW, lE6;”40 OUTPUT 718;“D2;EM;PU;PA380,1000;”45 OUTPUT 718;“TEXT @QQ POWER BANDWIDTH = @;DSPLY P,BW,6.3;”4 6 OUTPUT 718;“TEXT @ MHZ@;HD;”
50 END
Line 10:
Line 20:
Line 30:
Line 40:
Define a variable, P-BW, to store the power bandwidth.
Find the power bandwidth and move it into P,BW.
Convert P-BW to MHz.
Set display size to D2, erase trace C memory (which sets the display address to 30721,
and set pen position to x = 380, y = 1000.
Lines 45 and 46: Write the results on the analyzer screen.
296 Programming

8/21/2019 analiz_espctros
http://slidepdf.com/reader/full/analizespctros 406/536
uP
-o--bHZ ;
RB
Resolution Bandwidth
The RB command specifies the resolution bandwidth. Available bandwidths are 10 Hz, 30 Hz, 300 Hz, 1 kHz, 3kHz, 30 kHz, 100 kHz, 300 kHz, 1 MHz, and 3 MHz. The resolution bandwidths, video bandwidths, and sweep
time are normally coupled. Executing RB decouples them. Execute CR to reestablish coupling.
OTJTPUT718; RB 1KZ;
The execution of the RB command, and the m key is identical.
Programming 297

8/21/2019 analiz_espctros
http://slidepdf.com/reader/full/analizespctros 407/536
RC
Recall Last State
RCLS)
RC
Item Description/Default
DIGIT Specifies analyzer register.
Range Restriction
1 through 9
The RC command recalls registers containing a set of instrument states. Registers one through six are reserved for
the user, and contain instrument states (such as front panel configuration) sorted with the SAVES or SV com-
mands.
Register 7 is a special register that contains the instrument state prior to the last instrument preset (IP) or single
function change. Use the contents of register 7 to recover from inadvertent entries:
OUTPUT 718;“RC 7; ”
Registers 8 and 9 recall factory-selected control settings for calibration purposes.
The functions of the RCLS and RC commands, and front-panel RECALL key are identical. (Also see SAVES or
SV)
298 Programming

8/21/2019 analiz_espctros
http://slidepdf.com/reader/full/analizespctros 408/536
Recall State Register
(W
RCLS
Item Description/Default
DIGIT Specifies analyzer register.
Range Restriction
1 through 9
The RCLS command recalls registers containing a set of instrument states. Registers one through six are reserved
for the user, and contain instrument states (such as front panel configuration) stored with the SAVES or SV
commands.
Register 7 is a special register that contains the instrument state prior to the last instrument preset (IP) or single
function change. Use the contents of register 7 to recover from inadvertent entries:
OUTPUT 718; “RCLS 7;”
Register 8 and 9 recall factory-selected control settings for calibration purposes.
The functions of the RCLS and RC commands, and front-panel [-II key are identical. (Also see SAVES or SV)
Programming 299

8/21/2019 analiz_espctros
http://slidepdf.com/reader/full/analizespctros 409/536
REPEAT UNTIL
c o m m a n d
I i s tUN1 I L
I Item Description/Default Range Restriction
VARIABLE
IDENTIFIER
Alpha character. User-defined identifier
declared in VARDEF statement. Do not follow
identifier with semicolon.
AA-U and _
2- 12 characters required.
Alpha character. Measurement-variable
identifier, such as CF or MA. Do not follow
identifier with semicolon.
NUMERIC DATA
FIELD
COMMAND LIST
Trace element, such as TRA[ lo].
Real
Any commands from this remote section.
REPEAT and UNTIL commands form a looping construct. The command list is repeated until condition is true.
The following program lowers any off-screen signal.
10 OUTPUT 718;“S2;TS;El;”
2 0 OUTPUT 718;“IF’MA,GT,RL THEN”
3 0 OUTPUT 718;“BEPEAT RL UP;TS;El; ”
4 0 OUTPUT 718;“UNTlL MA,LE,RL ”5 0 OUTPUT 718;“ENDlF 52;” ” ”
6 0 E N D
300 Programming

8/21/2019 analiz_espctros
http://slidepdf.com/reader/full/analizespctros 410/536
(Continued) REPEAT UNTIL
Use the FUNCDEF command to nest a REPEAT UNTIL command within another REPEAT UNTIL looping
construct. The program below defines “C-LOP” as a looping construct in lines 30 through 60. The construct is
then nested into the REPEAT UNTIL command in line 80.
10 OUTPUT718;“SNGLS;20 OUTPlJT718;“VARDEFCOUNT.,0;VARDEFSCORE,0;
30 OUTPUT718;“FUNCDEFC~LOP,40 OUTPUT718;“FtEPEATTS;50 OUl'PUT718;“ADDCOlJNT,COlJNT,1;80 OUTPlJT718;“UNTILCOTJNT,EQ,3;70 OUTPUT718;“REPEAT;80 OUTPUT718;“C~LOp;90 OUTPUT718;“ADDSCOFiE,SCORE,1;100 OTJTPUT718;“UNTILSCOR.E,EQ,4;
The program below does not work because the REPEAT UNTIL commands are nested without the use of the
FUNCDEF command.
10 0UTPUT718;“SNGLS;20 OUTPUT718;“VAFbDEFCOUNT,0;VAFbDEFSCORE,0;30 0UTPUT718;“REPEAT;40 OUTPUT718;“REPEAT;50 OUTPUT 718;“TS;"80 OUTPTJT7l8; ADDCOUNT,COUNT,1;70 OTJTPUT7l8;“UNTILCOUNT,EQ,3;80 OUTPUT7l8;“ADDSCORE,SCORE,1;90 OUTPUT7l8;“UNTILSCORE,EQ,4;100 END
Programming 301

8/21/2019 analiz_espctros
http://slidepdf.com/reader/full/analizespctros 411/536
REV
Revision
The REV command returns the firmware revision number and HP date code.
OUTPUT 718;“FLEV,”
302 Programming

8/21/2019 analiz_espctros
http://slidepdf.com/reader/full/analizespctros 412/536
RL
Reference Level
The RL command specifies the amplitude value of the top CRT graticule line, which is called the reference level.
The reference level can be specified from - 89.9 dBm to + 30 dBm with 0.1 dB resolution.
The reference level and input attenuator are coupled to prevent gain compression. Any signals with peaks at or
below the reference level are not affected by gain compression.
The reference level range can be extended from - 129.9 dBm to +60 dBm with the KS1 command. When the
reference level range is extended, and the mixer level commands, KS1 or ML, are used to change the threshold of
the mixer input to values greater than - 10 dBm, signals on the spectrum analyzer screen may be affected by gain
compression. (See AT and ML.)
OUTPUT718;“RL-1ODM;
The functions of the RL command and the [ Z” ) key are identical.
Programming 303

8/21/2019 analiz_espctros
http://slidepdf.com/reader/full/analizespctros 413/536
RMS
Root Mean Square
Item
TRACE LABEL
Description/Default Range Restriction
Alpha character. User-defined label declared in AA- 22 and _
TRDEF statement. 2- 12 characters required.
The RMS command returns the RMS value of the trace, in display units. Note that the value must be moved into a
variable to be accessed.
OUTPUT 718;“VARDEF DESTINATION, 0;”OUTPUT 718;“MOV DESTINATION,RMS TRC;”
304 Programming

8/21/2019 analiz_espctros
http://slidepdf.com/reader/full/analizespctros 414/536
ROFFSET
Reference Level Offset
(KSZ)
( R O F F S E TROFFSET
Item Description/Default
REAL Default value for units is dBm (DM) .
Range Restriction
+-3OOdB
The ROFFSET command offsets all amplitude readouts on tp CRT display without affecting the trace. The
functions of the ROFFSET command and the front panel [,,,,fy
keys are identical.
Once activated, the ROFFSET command displays the amplitude offset in the active function block. And, as long as
the offset is in effect while doing other functions, the offset is displayed to the left of the graticule.
Entering a zero with ROFFSET activated eliminates any amplitude offset.
Ou'TPUT718;“ROFFSET-12DM;
The functions of the ROFFSET and KSZ commands are identical.
Programming 305

8/21/2019 analiz_espctros
http://slidepdf.com/reader/full/analizespctros 415/536
RQS
SRQ Mask
ROS
Item
INTEGER
Description/Default
Integer representing a bit mask for service
requests (SRQ) .
Range Restriction
@- 255
The RQS command sets a bit mask for service requests (SRQ command).
On execution of a SRQ command, the analyzer logically ANDs the RQS mask with the binary equivalent of the
SRQ operand. When the result of this AND operation is a non-zero number, the analyzer sends a service request
to the HP-IB controller.
A query for the RQS command returns the RQS operand.
See also SRQ and Appendix D.
3 0 6 Pr o g r a mmin g

8/21/2019 analiz_espctros
http://slidepdf.com/reader/full/analizespctros 416/536
Rl
Illegal Command SRQ
The Rl command deactivates all analyzer service requests (SRQs) except SRQ140, the illegal-command service
request.
See Appendix D for more information on the Rl command
Programming 307

8/21/2019 analiz_espctros
http://slidepdf.com/reader/full/analizespctros 417/536
R2
End-of-Sweep SRQ
The R2 command activates the end-of-sweep and illegal-command service requests.
See Appendix D for more information on the R2 command.
308 Programming

8/21/2019 analiz_espctros
http://slidepdf.com/reader/full/analizespctros 418/536
R3
Hardware-Broken SRQ
The R3 command activates the hardware-broken and illegal-command service requests.
See Appendix D for more information on the R3 command.
Programming 309

8/21/2019 analiz_espctros
http://slidepdf.com/reader/full/analizespctros 419/536
R4
Units-Key-Pressed SRQ
The R4 command activates the units-key-pressed and illegal-command service requests.
See Appendix D for more information on the R4 command.
310 Programming

8/21/2019 analiz_espctros
http://slidepdf.com/reader/full/analizespctros 420/536
SAVES
Save State
W)
NUMERIC DATArFIELD-.
SAVES
Item
DIGIT
Description/Default
Specifies register for storage of instrument
states.
Range Restriction
l - 6
The SAVES command saves the current spectrum analyzer state in any of registers one through six. Register
contents are not affected by power loss, but previously saved data is erased when new data is saved in the same
register.
The functions of the SAVES and SV commands, and front-panel I,*I) key are identical.
OUTPUT 718;“SAVES 5;”
Programming 311

8/21/2019 analiz_espctros
http://slidepdf.com/reader/full/analizespctros 421/536
Signal Identification Delta Value
SIBDEL integer
Item Description/Default Range Restriction
INTEGER Specifies maximum difference allowed between the amplitude of a signaland its image, in dB.
0,5, 10, 15,20,25,30, and 35.
The SIGDEL command specifies the maximum difference allowed between the amplitude of a signal and its image
for the internal signal identification routine, used for external mixing bands.
Execute the signal identification routine with the SIGID command.
312 Programming

8/21/2019 analiz_espctros
http://slidepdf.com/reader/full/analizespctros 422/536
Signal Identification
WV)
The SIGID command enables a signal identifier routine that uses the normal marker to automatically identify the
signal under observation in the external mixing mode. The functions of the SIGID and KSv commands, and the
front panel [,,,, ~lb
keys, are identical.
A normal marker must be activated prior to executing the SIGID (external mixer signal identifier) command. The
SIGID command determines the true frequency and mixing harmonic of the signal that the marker is on.
When signal identification is complete, the CENTER FREQUENCY is changed to match the frequency of the true
signal, and CENTER FREQUENCY is left as the active function. If no identification can be made, the state before
the SIGID command was executed is automatically restored with the “RECALL 7” function. When this happens,changing the harmonics and amplitude delta used by the signal identification routine may give better results. See
SIGDEL, NSTART and NSTOI?
If a harmonic lock is in effect when the SIGID command is executed, it is restored on completion of the SIGID
command unless the identified signal cannot be tuned to with the “locked” harmonic. In this case, the original
state, prior to executing the SIGID command, is automatically restored with the “RECALL 7” function, and the
message “IDENTIFIED OUT OF BAND” appears on the CRT
If no marker is activated prior to executing SIGID, a peak search is done looking for the highest peak.
The SIGID command syntax is shown in the sample program line below.
OUTPUT 718;“SIGID;”
Programming 3 13

8/21/2019 analiz_espctros
http://slidepdf.com/reader/full/analizespctros 423/536
SMOOTH
Smooth
SMOOTH n u m b e r o f p a i n t s
I Item Description/Default Range Restriction
TRACE LABEL
NUMBER OF
POINTS
Alpha character, User-defined label declared in AA-22 and _
TRDEF statement. 2- 12 characters required.
Integer representing number of points for 1 < number of points < 39
running average. Must be odd number.
The SMOOTH command smooths the trace according to the number of points specified for the running average.
Increasing the number of points increases smoothing.
OUTPUT 718; “SMOOTH TRA 23; ”
314 P r o g r a m m i n g

8/21/2019 analiz_espctros
http://slidepdf.com/reader/full/analizespctros 424/536
SNGLS
Single Sweep
The SNGLS command sets the analyzer to single sweep mode. Each time single sweep is pressed, one sweep is
initiated if the trigger and data entry conditions are met. The functions of the SNGLS and S2 commands, and
front-panel (,,,,, key are identical.
OUTPUT 718;“SNGLS;”
Programming 3 15

8/21/2019 analiz_espctros
http://slidepdf.com/reader/full/analizespctros 425/536
SP
Frequency Span
cz SP r e a l
iH
The SP command changes the total display frequency range symmetrically about the center frequency. Thefrequency span readout displays the total display frequency range. Divide the readout by ten to determine the
frequency span per division.
Specifying 111 Hz enables zero span mode, which configures the analyzer as a fix-tuned receiver. Otherwise, the
minimum span width is 100 Hz. Maximum span width is 2.5 GHz in the low band, and 22 GHz (2 to 24 GHz) in
the microwave band.
The functions of the SP command and the front panel key are identical. Thus, if span width is coupled
to the resolution and video bandwidths, the bandwidths change with the span width to provide a predetermined
level of resolution and noise averaging. Likewise, sweep time changes to maintain a calibrated display, if coupled.All of these functions are normally coupled, unless RB, VB, or ST have been executed. (See CR, CV or CT)
OUTPUT718;“SP1OMZ;
316 Programming

8/21/2019 analiz_espctros
http://slidepdf.com/reader/full/analizespctros 426/536
SQR
Square Root
- D E S T I N A T I O N -
t r a c e
I abel
- S O U R C E
t r a c e
l a b e l
v a r i a b l ei d e n t i f i e r
r e a l
Item Description/Default Range Restriction
TRACE LABEL Alpha character. User-defined label declared AA-Z and_
in TRDEF statement. 2- 12 characters required.
~VARIABLE IDENTIFIER Alpha character. User-defined label declared
in VARDEF statement.
AA-22 and _
2-12 characters required.
Alpha character. Measurement-variable
identifier, such as CF or MA.
Trace element, such as TRA [lo].
The SQR command computes the square root of the source trace amplitude, point-by-point. The results go to the
destination trace.
OUTPUT 718;“SQR TRC,Tl%B;”
Programming 3 17

8/21/2019 analiz_espctros
http://slidepdf.com/reader/full/analizespctros 427/536
SRQ
User-defined SRQ
SRO
Item Description/Default Range Restriction
INTEGER Integer representing a service request. 8- 255
The SRQ command sends a service request to the controller when the SRQ operand fits the mask specified with
the RQS command.
On execution of a SRQ command, the analyzer logically ANDs the RQS mask with the binary equivalent of theSRQ operand. When the result of this AND operation is a non-zero number, the analyzer sends a service request
to the HP-IB controller.
See also RQS and Appendix D.
318 Programming

8/21/2019 analiz_espctros
http://slidepdf.com/reader/full/analizespctros 428/536
0P
ss
Center Frequency Step Size
0
Item Description/Default
REAL Default is Hz.
Range Restriction
The SS command specifies center frequency step size, and is the same function as the [“-“I key.
OUTPUT 718;“SS 10MZ;CF up;”
The above program line changes center frequency by 10 MHz.
Programming 3 19

8/21/2019 analiz_espctros
http://slidepdf.com/reader/full/analizespctros 429/536
ST
Sweep Time
c u -P
=--IQr e a l SC
Lo.US
The ST command specifies the rate at which the analyzer sweeps the displayed frequency or time span.
The sweep times available are shown below.
FREQUENCY SPAN
(> = 1OOHz)
SWEEP TIME SEQUENCY
20 ms to 1500 set continuously
ZERO FREQUENCY
SPAN (0 Hz)
1ustolOms 1,2,5, and 10
20 ms to 1500 set continuously
OUTPUT 718; “ST 100MS;”
The above program line sets the sweep time of the analyzer to 100 milliseconds.
320 Programming

8/21/2019 analiz_espctros
http://slidepdf.com/reader/full/analizespctros 430/536
STDEV
Standard Deviation
STDEV
Item Description/Default Range Restriction
TRACE LABEL Alpha character. User-defined label declared inTRDEF statement.
AA-Z2 and _2- 12 characters required.
The STDEV command returns to the controller the standard deviation of the trace amplitude in display units.
OUTPUT 718;“IP;TS;S I’DEV TRA;”
ENTER 718;N
PRINT N
END
Programming 32 1

8/21/2019 analiz_espctros
http://slidepdf.com/reader/full/analizespctros 431/536
SUB
Subtract
r DESTINATION I r OPERAND 1 7 r OPERAND 2 7
SUB
Item Description/Default Range Restriction
TRACE LABEL Alpha character. User-defined label declared in
TRDEF statement.
AA-22 and _
2- 12 characters required.
VARIABLE
IDENTIFIER
Alpha character. User-defined identifier
declared in VARDEF statement.
AA-ZZ and _
2- 12 characters required.
Alpha character. Measurement-variable
identifier, such as CF or MA.
Trace element, such as TRA[ lo].
NUMERIC DATA
FIELD
Real
The SUB command subtracts operand 2 from operand 1, point by point, and send the difference to the destina-
tion.
operand 1 - operand 2 - destination
The operands and destination may be different lengths. The trace operands (TRA, TRB, TRC, and trace label)
range from 1 to 1008 elements in length. A variable identifier or numeric data field is one element long. When
operands diier in length, the last element of the shorter operand is repeated for the subtraction process. When the
operands are longer than the destination, they are truncated to fit.
3 2 2 P r o g r a m m i n g

8/21/2019 analiz_espctros
http://slidepdf.com/reader/full/analizespctros 432/536
(Continued) SUB
The results and operands of trace math are truncated if they are not within certain limits. If operating on traces A,
B, or C, results must be within 1023. If operating on user-defined traces, results must be within 32,767.
See TRMATH .
Programming 323

8/21/2019 analiz_espctros
http://slidepdf.com/reader/full/analizespctros 433/536
SUM
Item Description/Default Range RestrictionI
TRACE LABEL Alpha character. User-defined label declared in AA-22 and _
TRDEF statement. 2- 12 characters required.
The SUM command sums the amplitudes of the trace elements, and returns the sum to the controller.
10 OTJTPUT 718;“Ip; SNGLS; CLRW TRA; TS;”
20 OUTPUT 718;“SUNI TM;”30 ENTER 718;N
40 PRINTN
50 END
324 Programming

8/21/2019 analiz_espctros
http://slidepdf.com/reader/full/analizespctros 434/536
SUMSQR
Sum Square
Description/Default Range Restriction
TRACE LABEL Alpha character. User-defined label declared in AA-ZZ and _
TRDEF statement. 2- 12 characters required.
The SUMSQR command squares the amplitude of each trace element, and returns the sum of the squares to the
controller.
10 OlJTHJT 718;“Ip; SNGLS; CLRW TRA; TS;”
2 0 OUTPUT 718;“SUMSQR TRA;”
3 0 ENTER 7 1 8 ; N
4 0 P R I N T N
5 0 E N D
Programming 325

8/21/2019 analiz_espctros
http://slidepdf.com/reader/full/analizespctros 435/536
sv
Save State(SAVES)
Description/Default Range Restriction
DIGIT Specifies register for storage of instrumentstates.
l - 6
The SV command saves the current spectrum analyzer state in any of registers one through six. Register contents
are not affected by power loss, but previously saved data is erased when new data is saved in the same register.
The functions of the SAVES and SV command, and front panel a key are identical.
OUTPTJT 718; “SV 5; ”
326 Programming

8/21/2019 analiz_espctros
http://slidepdf.com/reader/full/analizespctros 436/536
SW
Skip to Next Control Instruction
(----G--)-Q
The skip-to-next-control-instruction command, SW, instructs the display to skip to the next control word from the
present display memory address. Use SW to omit labels, markers, etc. from the display Display control word
1027 (DW 1027) can be substituted for programming command SW
10 ASSIGN @Sa TO 71820 OTJTPUT @Sa; “DA 2073 SW,”
30 END
In the example above, display memory address 2073 contains the label control word that places the center
frequency “I I” mark on the CRT However, this marker is omitted from the display because the SW command has been added to the address.
(See Appendix B.)
Programming 327

8/21/2019 analiz_espctros
http://slidepdf.com/reader/full/analizespctros 437/536
Sl
Continuous Sweep
CONT)
The Sl command sets the analyzer to continuous sweep mode. In the continuous sweep mode, the analyzer
continues to sweep (sweep time L 20 ms) at a uniform rate, from the start frequency to the stop frequency, unless
new data entries are made from the front panel or via HP-IB. If the trigger and data entry conditions are met, the
sweep is continuous.
The sweep light indicates a sweep is in progress. The light is out between sweeps, during data entry, and for sweep
times 40 ms.
OUTPUT 718;“Sl;”
The functions of the Sl and CONT commands and the front panel i-1 key are identical.
328 Programming

8/21/2019 analiz_espctros
http://slidepdf.com/reader/full/analizespctros 438/536
Single Sweep
(SNGLS)
The S2 command sets the analyzer to single sweep mode. Each time single sweep is pressed, one sweep is
initiated if the trigger and data entry conditions are met.
OUTPUT 718;“52;”
The functions of the S2 and SNGLS commands and the front panel II-] key are identical.
Programming 329

8/21/2019 analiz_espctros
http://slidepdf.com/reader/full/analizespctros 439/536
TA
Transfer A
The TA command transfers trace A amplitude values, in display units, from the analyzer to the controller. The
display unit values are transferred in sequential order (from left to right) as seen on the CRT display. Display unit
values that are stored in the display memory can be transferred to the controller in any one of the four output
formats of the analyzer (01,02,03, or 04).
Transfer of trace amplitude data should only be done as follows:
1. Select single sweep mode (S2).
2. Select desired analyzer settings.
3. Take one complete sweep (TS) .
4. Transfer data.
This procedure ensures that the current settings of the analyzer are reflected in the transferred data.
When the TA command is executed, and the analyzer is in continuous sweep mode, the blank-ahead marker is
also transferred as amplitude values in the 01 and 02 format. The blank-ahead marker is not transferred in the 03
and 04 formats.
The blank-ahead marker is composed of positive, blanked amplitude values and is immediately ahead of the
updated, sweeping trace. These values represent the amplitude responses of the previous sweep, plus 2048.
Thus, they are off (above) the screen.
The blank-ahead marker is eight display units wide and is transferred as such. For example, if an amplitude value
of 100 falls within the blank-ahead marker area when the sweep is transferred, the amplitude value becomes 2148
(amplitude value 100 + data word 2048, in which bit number 11 of graph data is positive blanked). For further
information on data word coding see Consolidated Coding Data in Appendix B.
When transferring amplitude data, only the data words from 1001 display memory addresses are transferred out
of the total of 1024 available display memory addresses. Each of the 1024 display memory addresses contains a
single data word. The 23 data words not transferred are at address 0 (used for the control instruction word) and at
addresses 1002 through 1024 (not used by the analyzer for trace data, but available for programming custom
graphics or labels).
The sample program below demonstrates how to store a trace similar to the one in the following illustration.
330 Programming

8/21/2019 analiz_espctros
http://slidepdf.com/reader/full/analizespctros 440/536
(Continued) TA
10 ASSIGN @Sa TO 71820 PRINTER IS 70130 DIM A( 1001)40 !
50 OUTPUT @a; “TP,LF;”
60 ODTPDT @Sa;“CFlOOM3;SP2M3;S2;TS;”70 OUTPDT @Sa;“Ol;TA;”80 FOR N = 1 TO 100190 ENTER @Sa;A(N)100 NEXTN
110 !
120 FORN=490TO810
130 PRINT A(N)140 NEXTN
180 END
Line 30:
Line 50:
Line 60:
Line 70:
Lines 80 to 100:
Lines 120 to 140:
Reserves controller memory for 1001 amplitude values.
Presets the instrument.
Sets analyzer to 100 MHz center frequency with 2 MHz frequency span. Selects
single sweep mode and takes one complete sweep of the trace (graph) data.
Selects analyzer output to be in 01 format and commands the analyzer to transfer trace
A amplitude values to the controller.
Sequentially reads all 1001 trace A amplitude values into A(N) of the controller.
Prints out trace A amplitude values at all 20 points between x-axis coordinates 490 and510.
Programming 33 1

8/21/2019 analiz_espctros
http://slidepdf.com/reader/full/analizespctros 441/536
T B
Transfer B
The TB command transfers trace B amplitude values, in display units, from the analyzer to the controller. The
display unit values are transferred in sequential order (from left to right) as seen on the CRT display. Display unit
values that are stored in the display memory can be transferred to the controller in any one of the four output
formats of the analyzer (01,02,03, or 04).
Transfer of trace amplitude data should only be done as follows:
1. Select single sweep mode (S2).
2. Select desired analyzer settings.
3. Take one complete sweep (TS) .
4. Transfer data.
This procedure ensures that the current settings of the analyzer are reflected in the transferred data.
When the TB command is executed, and the analyzer is in continuous sweep mode, the blank-ahead marker is
also transferred as amplitude values in the 01 and 02 format. The blank-ahead marker is not transferred in the 03
and 04 formats.
The blank-ahead marker is composed of positive, blanked amplitude values and is immediately ahead of the
updated, sweeping trace. These values represent the amplitude responses of the previous sweep, plus 2048.
Thus, they are off (above) the screen.
The blank-ahead marker is eight display units wide and is transferred as such. For example, if an amplitude value
of 100 falls within the blank-ahead marker area when the sweep is transferred, the amplitude value becomes 2148
(amplitude value 100 + data word 2048, in which bit number 11 of graph data is positive blanked). For further
information on data word coding see Consolidated Coding Data in Appendix B.
When transferring amplitude data, only the data words from 1001 display memory addresses are transferred out
of the total of 1024 available display memory addresses. Each of the 1024 display memory addresses contains a
single data word. The 23 data words not transferred are at address P, (used for the control instruction word) and at
addresses 1002 through 1024 (not used by the analyzer for trace data, but available for programming custom
graphics or labels).
The sample program below demonstrates how to store a trace similar to the one in the following illustration.
332 Programming

8/21/2019 analiz_espctros
http://slidepdf.com/reader/full/analizespctros 442/536
(Continued) TB
10 ASSIGN@SaTO71820 PRINTJZRIS70130 DIMA(1001)40 !
80 OUTPTJT@Sa;“IP;LF;
60 OUTPTJT@Sa; CF100MZ;SP2MZ;S2,TS;70 OUTPUT @Sa;“Ol;TB;
80 FORN=lTOlOOl
90 EN'IlZR@Sa;A(N)100 NEXTN
110 !
120 FORN=490TO810
130 PRINT
140 NEXTN
180 END
Line 30:
Line 50:
Line 60:
Line 70:
Lines 80 to 100:
Lines 120 to 140:
Reserves controller memory for 1001 amplitude values.
Presets the instrument.
Sets analyzer to 100 MHz center frequecy with 2 MHz frequency span. Selects single
sweep mode and takes one complete sweep of the trace (graph) data.
Selects analyzer output to be in 01 format and commands the analyzer to transfer trace
B amplitude values to the controller.
Sequentially reads all 1001 trace B amplitude values into A(N) of the controller.
Prints out trace B amplitude values at all 20 points between x-a.xis coordinates 490 and510.
Programming 333

8/21/2019 analiz_espctros
http://slidepdf.com/reader/full/analizespctros 443/536
TDF
Trace Data Format
TDFTDF
The TDF command formats trace information for return to the controller.
OUTPUT 718; “TDF B;”
Specifying M enables the 01 format and returns values in display units, from 0 to 1001.
Specifying P enables the 03 format and returns absolute measurement values, such as dBm or Hz.
Specifying A returns data as an A-block data field. The MDS command determines whether data comprisesone or two 8bit bytes. (See MDS.)
Specifying I returns data as an I-block data field. The MDS command determines whether data comprises
one or two &bit bytes. (See MDS .)
Specifying B enables the 02 or 04 format. The MDS command determines whether data comprises one or
two 8-bit bytes.
See the 01,02,03, and 04 FORMAT commands.
334 Programming

8/21/2019 analiz_espctros
http://slidepdf.com/reader/full/analizespctros 444/536
TEXT
Text
TEXT
Item Description/Default Range Restriction
STRING
DELIMITER
Must match. Marks beginning and end of
command list.
“ %& ‘/: = @ \S
Characters Alphanumeric characters. ASCII character 32 through
126.
The TEXT command writes text on the spectrum analyzer screen at the current pen position.
OUTPUT 718; “TEXT ““CONNECT ANTENNA.” “;”
Programming 335

8/21/2019 analiz_espctros
http://slidepdf.com/reader/full/analizespctros 445/536
T H
Threshold
THTH
Item Description/Default
Threshold value defaults to nine major
divisions below reference level.
Range Restriction
UP or DN to step threshold by 10 dB.
The TH command blanks signal responses below the threshold level, similar to a base line clipper. The threshold
level is nine major divisions below the reference level, unless otherwise specified. The Up and DN commands
move the threshold 10 dB.
The threshold level is annotated in reference level units at the lower left-hand side of the CRT display. (See Tld and
THE.)
The threshold can also be used as a variable. The program below places a marker on the largest signal that is
greater than the threshold level.
10 OTJTPUT718;“IF$LF;TH-38DM;20 OUTPUT718;“TS;MIPKHI;MA;30 OlJTPUT718;“IF MA,GT,TH40 OTJTPUT718;“THENCF20MZ;50 OV'ITTJT718;“ELSECF100MZ;TS;MKPKHI;60 0UTPTJT718;“ENDIF;70 END
336 Programming

8/21/2019 analiz_espctros
http://slidepdf.com/reader/full/analizespctros 446/536
THE
Threshold Enable
THE
The THE command disables or enables the threshold level. The threshold level is specified by the TH command.
OUTF’UT 718;“THE OFF;"
When queried (? or OA), TH returns the threshold line state, followed by carriage-return/line-feed (ASCII codes13, 10). The end-or-identify state (EOI) is asserted with line feed.
Programming 337

8/21/2019 analiz_espctros
http://slidepdf.com/reader/full/analizespctros 447/536
IF THEN ELSE ENDIF
/ - O P E R A N D 11 r OPERAND 2 7
v a r i a b l ei d e n t i f i e r
n u m e r i cd a t a f i e l d -
v a r i a b l ei d e n t i f i e r
n u m e r i cd a t a f i e l d
THEN
commandI is t
ELSEcommand
I is tEND I F
Item Description/Default Range Restriction
COMMAND LIST Alphanumeric character. Any spectrum
analyzer command from this section.
VARIABLE Alpha character. User-defined identifier
IDENTIFIER declared in VARDEF statement.
I NUMERIC DATA Real
FIELD
Alpha character. Measurement-variable
identifier. such as CF or MA.
Trace element, such as TRA[lO].
AA-Z and _
2- 12 characters required.
The IF-THEN-ELSE-ENDIF commands form a decision and looping construct. They compare operand
1 to operand 2. If the condition is true, the command list is executed. Otherwise, commands following
ELSE or ENDIF are executed.
The IF command must be delimited with the ENDIF command.
The following program uses the IF THEN ELSE ENDIF command to place a marker on the largest signalthat is greater than the threshold level.
3 3 8 Pr o g r a m m i n g

8/21/2019 analiz_espctros
http://slidepdf.com/reader/full/analizespctros 448/536
(Continued) IF THEN ELSE ENDIF
10 OUTPUT718;“IP;LF;TH-35DM;20 OUTPUT718; T8;MKPKHI;MA;30 OUTPUT718;“IFMA,GT,TH40 OUTPUT718;“THENCF20MZ;50 0TJTPUT718; EL8ECF100MZ;TS;MKPKHI;60 OUTPUT718;“ENDIF;
70 END
The program below does not incorporate the ELSE branch of the IF THEN ELSE ENDIF command. The program
lowers any signal positioned above (off) the analyzer screen.
10 OUTPUT718;“S2;TS;El;20 OTJTPUT718;“IFMA,GT,RLTHEN30 OUTPUT718;‘%EPEATRLUP;TS;E140 OUTPUT718;“UNTILMA,LE,RL50 OUTPUT 718; ENDIF Sl;60 END
Programming 339

8/21/2019 analiz_espctros
http://slidepdf.com/reader/full/analizespctros 449/536
TM
Trigger Mode
TM
The TM command selects trigger mode: free, video, line, or external trigger. See Tl, T2, T3, and T4.
The query response return the trigger mode.
OUTPUT 718;“TM EXT;"
340 Programming

8/21/2019 analiz_espctros
http://slidepdf.com/reader/full/analizespctros 450/536
TRDEF
Trace Define
TRDEF tracel e n g t h
I Item Description/Default Range Restriction
Trace Label
TRACE LENGTH
Alpha character. User-defined label declared inTRDEF statement.
Determines the number of elements (points) in
a trace. Default is 1001.INTEGER.
AA- ZZ and _2- 12 characters required.
p, to 1008
J
The TRDEF statement establishes the length and name of auser-defined trace. User-defined traces form the
operand of many remote functions in this section. These functions show “TRACE LABEL.” as an operand in their
syntax diagrams. Following are some of the functions that operate on user-defined traces.
MO V MPk: XCH, TRACE, TRGRPH, NEG, DIV AVG, BLANK, ADD, MXM, SCALE, MXMH, SUB,
MIN, TWNDOW
If two traces have different lengths, the largest length is used for the specified span. The shorter length accepts datauntil filled.
When a trace of a greater length is operated on and stored in a trace of lesser length, the trace is truncated to fit.
Conversely, when a shorter trace is operated on and stored in a trace of longer length, the last trace element is
extended for operations with the longer length. Thus, a single element trace acts like a display line in trace
operations.
Programming 341

8/21/2019 analiz_espctros
http://slidepdf.com/reader/full/analizespctros 451/536
TRDSP
Trace Display
TRDSP
The TRDSP command displays a trace or turns if off. The command does not affect any other trace operations.
OUTPUT718;“TRDSPTRC,ON;
342 Programming

8/21/2019 analiz_espctros
http://slidepdf.com/reader/full/analizespctros 452/536
TRGRPH
Trace Graph
EXPAND I NGTRACE
rFACTOR Ir ARRAY 7
The TRGRPH command displays a trace A, B, or C, or a user-defined trace anywhere on the spectrum analyzer
display. The X and Y positions orient the trace above and to the right of a point on the CRT specified by the
display address. The trace can be expanded, according to the scale determined by the expanding factor.
For example, the following command would display a user-defined trace named TEST occupying the length of the
CRT at the base line, if TEST was originally full-scale, and was compressed by 10 with the COMPRESS com-
mand:
TRGRPH0,0,0,10TEST;
Note that the above TRGRPH command fills display addresses Id through 1000 with the amplitude information of
the TEST trace array. Thus, any original trace A information is lost.
The program below moves trace A data into a user-defined trace array, called TEST then positions TEST 100
display units above the CRT baseline.
10 0UTPUT718;“IP;LF;CF100MZ;SP20MZ;A1;S2;TS;20 OUTPUT718;“TRDEFTEX3T,1001;30 OUTPTJT718;“MOVTEST,TFU;
40 0UTPTJT718‘TRGRPH0,0,100,1,TEST;50 END
Line 10: Sets up an active trace.
Line 20: Defines user-defined trace array.
Line 30: Moves trace A into array
Line 40: Display array, filling display addresses allocated for trace A.
To reposition traces A, B, and C without the use of a user-defined trace array, substitute the letter I for the display
address.
Programming 343

8/21/2019 analiz_espctros
http://slidepdf.com/reader/full/analizespctros 453/536
TRMATH
Trace Math
S T R I N G D A T A F I E L D \
T R M A T H -s t r i n g command
del i m i t a r I i s t
A -B L O CK D A T A F I EL D ‘ -I
-- I - B L O C K D A T A F I E L D ‘ -\I
commandI i s t
Item
COMMAND LIST
Description/Default
Any spectrum analyzer commands from this
Remote section.
Range Restriction
LENGTH Two &bit bytes specifying length of command
list, in g-bit bytes. The most significant byte is
first: MSB LSB.
STRING Must match. Marks beginning and end of
DELIMITER command list.
‘, % &‘/: = @J\-
The TRMATH command executes a command list at the end of a sweep. Compose the command Iii with any of
the following commands only.
Trace Math Commands:
AMB, AMBPL, APB, AXB, BL, BML, BTC, BXC, Cl, C2, EX, KSG, KSH, KSc, KSi, KSI, VAVG
User-Operator Functions:
MO\ SUB, ADD, MPY DIV, LOG, EXP MXM, MIN, XCH, SQR, CONCAT, CTM, CTA, AVG
If an on-end-of-sweep command is encountered, it is executed after the contents of the TRMATH command are
executed.
The operands and resuks of trace math are truncated if they are not within certain limits. If operating on traces A,
B, or C, results must be within 1023. If operating on user-defined traces, results must be within 32,767.
3 4 4 Pr o g r a m m i n g

8/21/2019 analiz_espctros
http://slidepdf.com/reader/full/analizespctros 454/536
(Continued) TRMATH
The program below halves the amplitude of trace A and moves it to trace B. If trace A is in log mode, this is
equivalent to the square root of trace A.
10 OUTPUT718;“A1;B3;12 OUTPUT7l8;“DISPOSETRMA FH;
20 OTJTPUT718; TFtMATH DIVTFLB,TRA,2 ;30 END
See DISPOSE.
Programming 345

8/21/2019 analiz_espctros
http://slidepdf.com/reader/full/analizespctros 455/536
TRPST
Trace Preset
The TRPST command executes the following commands:
A l
B4
C l
KSK
EM
TP)
L J
DISPOSE ONEOSDISPOSE TRMATH
DISPOSE ONSWP
346 Programming

8/21/2019 analiz_espctros
http://slidepdf.com/reader/full/analizespctros 456/536
TRSTAT
Trace State
TRSTAT
The TRSTAT command returns trace states to the controller: clear-write, off, view, or blank.
Trace Is Swept and Updated Trace Is DisplayedI
Trace Clear/Write CLRW
Trace Off TRDSP
Trace View VIEW
Trace Blank BLANK
X X
X
X
Programming 347

8/21/2019 analiz_espctros
http://slidepdf.com/reader/full/analizespctros 457/536
TS
Take Sweep
The take sweep command, TS, starts and completes one full sweep before the next command is executed. One
TS command is required for each sweep in the single mode.
The function, marker, trace, coupled function, preselector peak, automatic zoom and video average commands,
and a number of the shii functions require one complete sweep to update the display and trace memory. This is to
avoid losing information for the output of measurement data on either the CRT display or through the HP-IB
interface.
In the example above, the command sequence does not allow sufficient time for a full sweep of the specified span,
before VIEW is executed. Therefore, only the span set by the instrument preset is displayed in trace A.
A TS command inserted before VIEW, as shown in the program line below, makes the analyzer take one complete
sweep before displaying trace A. This allows the analyzer sufficient time to respond to each command in the
sequence.
A TS command is also recommended before HP-IB transmission of marker data (amplitude, frequency) on the
HP-IB bus, and before marker operations (peak search, preselector peak). This is because the active marker is
repositioned at the end of each sweep.
The TS command guarantees that the HP-IB bus transmission and CRT display contain marker position informa-tion that is relative to the current trace response.
When the analyzer receives a TS command, it is not ready to receive any more data via HP-IB until one full sweep
has been completed. However, when slow sweep speeds are being used, the controller can be programmed to
perform computations or to address other instruments on the HP-IB bus while the analyzer is completing its sweep.
In normal programming practice, a semicolon terminates each command statement. By using the semicolon as a
terminator, an automatic carriage-return/line-feed is performed by the controller. However, the controller can
perform computations or address other instruments while the analyzer is executing TS, if the carriage-return/line-
feed is suppressed.
In the program line below, the semicolon at the end of the line (outside the quotation marks) suppresses the
carriage-return/line-feed. The controller is now available to proceed to the next program line while the analyzer is
completing its sweep.
OUTPUT718;“ST5SC;R2;TS ;
The R2 command in the program line above enables the end-of-sweep service request when the analyzer is
finished sweeping. This service request interrupts the controller program to allow subsequent addressing of the
analyzer. Refer to Appendix D for a complete description of the R2 Service Request.
348 Programming

8/21/2019 analiz_espctros
http://slidepdf.com/reader/full/analizespctros 458/536
TB
Threshold Off
The TP) command removes the threshold boundary and its readout from the CRT display.
OUTPUT 718; TO;
0
The function of the TpI command and the THRESHOLD m key are identical.
350 Programming

8/21/2019 analiz_espctros
http://slidepdf.com/reader/full/analizespctros 459/536
Tl
Free Run Trigger
The Tl command sets the analyzer sweep to free run trigger mode. The functions of the Tl command and front
panela key are identical.
See TM.
OUTPTJT718;T1;
Programming 35 1

8/21/2019 analiz_espctros
http://slidepdf.com/reader/full/analizespctros 460/536
T2
Line Trigger
The T2 command sets the analyzer sweep to line trigger mode. This function triggers the analyzer sweep when the
line voltage passes through zero in a positive direction. The functions of the T2 command and front panel m
key are identical. (See TM.)
OUTPUT 718; T2;
352 Programming

8/21/2019 analiz_espctros
http://slidepdf.com/reader/full/analizespctros 461/536
T3
External Trigger
The T3 command sets the analyzer to external trigger mode. This function triggers the analyzer sweep when an
external voltage passes through approximately 1.5 volts in a positive direction. The external trigger signal level
must be between 0 and 5 volts.
The functions of the T3 command and front panel (,,, trigger are identical. (See TM.)
OUTPUT 718; “T3;”
Programming 353

8/21/2019 analiz_espctros
http://slidepdf.com/reader/full/analizespctros 462/536
T4
Video Trigger
The T4 command sets the analyzer sweep to video trigger mode. This function triggers the analyzer sweep when
the voltage level of a detected RF envelope reaches the level set by the trigger LEVEL knob. The level (set by the
LEVEL knob) corresponds to detected levels displayed on the CRT between the bottom graticule (full CCW) and
the top graticule (full CW) .
The functions of the T4 command and front panel (,,,, trigger key are identical. (See TM.)
OUTPUT 718;“T4;
354 Programming

8/21/2019 analiz_espctros
http://slidepdf.com/reader/full/analizespctros 463/536
REPEAT UNTIL
/ C O N D I T I O N \
R E P E A Tcommand
I istU N T I L
Item Description/Default Range Restriction
VARIABLE
IDENTIFIER
Alpha character. User-defined identifier
declared in VARDEF statement. Do not follow
identifier with semicolon.
AA-Z2 and _
Z- 12 characters required.
Alpha character. Measurement-variable
identifier, such as CF or MA. Do not follow
identifier with semicolon.
Trace element, such as TRA[lOl
NUMERIC DATA
FIELD
Real
COMMAND LIST Any commands from this remote section.
The REPEAT and UNTIL commands form a looping construct. The command list is repeated until the condition is
true.
The following program lowers any off screen-signal.
10 OUTPUT 718;“SW;TS;El;”
2 0 OUTPUT 718;“lF MA,GT,RL THEN”
3 0 OUTPUT 718;“REPEATRL UP;TS;El; ”
4 0 OUTPUT 718;“lJNTlL MA,LE,RL ”
5 0 OUTPUT 718;“ENDlF Sl;” ” ”
6 0 E N D
Programming 355

8/21/2019 analiz_espctros
http://slidepdf.com/reader/full/analizespctros 464/536
REPEAT UNTIL (Continued)
Use the FUNCDEF command to nest a REPEAT UNTIL command within another REPEAT UNTIL looping
construct. The program below defines “C-LOP” as a looping construct in lines 30 through 60. The construct is
then nested into the REPEAT UNTIL command in line 80.
10 OUTPUT718;“SNGLS;
20 OUTPUT7l8;“VARDEFCOUNT,0;VARDEFSCORE,0;30 OUTPUT 718;“FUNCDEF C-LOP,"40 OUTPUT718;“REPEATTS;50 OUTPUT7l8;“ADDCOUNT,COUNT,1;80 OUTPUT718;“UNTILCOUNT,EQ,3;70 0lJTPUT718;“REPEAT;80 OUTPUT7l8;“C~LOp;90 OUTPUT718;“ADDSCORE,SCORE,1;100 OUTPUT718;“UNTILSCORE,EQ,4;
The program below does not work because the REPEAT UNTIL commands are nested without the use of the
FUNCDEF command.
10 OUTPUT718,“SNGLS;20 OUTPUT7l8;“VARDEFCOUNT,0;VARDEFSCORE,0;30 OUTPUT718;“REPEAT;40 OUTPUT718;“REPEAT;50 OUTPUT 718;“TS;50 OUTPUT718;“ADDCOUNT,COUNT,l;70 OWITUT718;“UNTILCOTJNT,EQ,3;80 OTJTPUT7l8;“ADDSCORE,SCORE,1;90 OUTPUT718;“UNTILSCORE,EQ,4;100 END
356 Programming

8/21/2019 analiz_espctros
http://slidepdf.com/reader/full/analizespctros 465/536
UR
Upper Right Recorder Output
The UR command sends a voltage to the rear panel RECORDER OUTFWTS. The voltage level remains until a
different command is executed. Use the UR command to calibrate the upper right dimension of a recorder.
OUTPUT 718; “U-R; ”UPPERRIGHT
The functions of the UR command and front panel key are identical (See Introduction in Section I.)
Programming 357

8/21/2019 analiz_espctros
http://slidepdf.com/reader/full/analizespctros 466/536
USTATE
State
A -B L OCK DA TA F I EL0
Item Description/Default Range Restriction
LENGTH Two 8-bit bytes specifying length of command
list, in 8-bit bytes. The most significant byte is
first: MSB LSB.
DATA BYTES 8-bit bytes of data representing command list. ASCII characters 0 to 255.
The USTATE command configures or returns configuration of user-defined states defined by these commands:
ONEOS
ONSWP
KEYDEF
FUNCDEF
TRDEF
TRMATH
358 Programming

8/21/2019 analiz_espctros
http://slidepdf.com/reader/full/analizespctros 467/536
VARDEF
Variable Define
VARDEFvariableidentifier real
I Item Description/Default Range Restriction I
I VARIABLE User-defined identifier. Alphanumeric AA-ZZ and_IDENTIFIER character. 2- 12 characters required. I
The VARDEF command assigns a real value to a variable. The value is assigned immediately after VARDEF
execution and reassigned during any instrument preset.
The following program demonstrates the VARDEF command.
10 OUTPUT 718;“SNGLS;”
20 OUTPUT 718;“VARDEF COUNT,0;V..DEF SCOR,0;”30 OUTPUT 718; “FUNCDEF C-LOP;” ” ”
40 OUTPUT 718; “REPEAT TS;”50 OUTPUT 718; “ADD COUNT,COUNT, 1;”80 OUTPUT 718;“TJNTIL COUNT,EQ,B;” ” ”70 OUTPUT 718;“REPEAT;”80 OUTPUT 718;“C-LOP;”90 OUTPUT 718;“ADD scoRE,scoRE,1;”100 OUTPUT 718;“lJNTIL SCORE,EQ,4;”
Programming 359

8/21/2019 analiz_espctros
http://slidepdf.com/reader/full/analizespctros 468/536
VARIANCE
Description/Default Range Restriction
TRACE LABEL Alpha character. User-defined label declared in AA-22 and _
TRDEF statement. 2- 12 characters required.
The VARIANCE command returns to the controller the amplitude variance of the specified trace, in display units.
10 OUTPUT 718;“VARIANCE TRC;”20 ENTER 718;N
30 PRINTN
40 END
360 Programming

8/21/2019 analiz_espctros
http://slidepdf.com/reader/full/analizespctros 469/536
VAVG
Video Average
VAVG
Item Description/Default Range Restriction
AVERAGE LENGTH Real. Default is 100. Represents maximum number
of sweeps executed for
averaging.
The VAVG command enables video averaging. During video averaging, two traces are displayed simultaneously.
Trace C contains signal responses as seen at the input detector. Trace A or B contains the same responses digitally
averaged. The digital reduces the noise floor level, but does not affect the sweep time, bandwidth, or any other
analog characteristics of the analyzer.
Before executing VAVG, select trace A or B as the active trace (CLRW) and blank the remaining trace.
The active function readout indicates the number of sweeps averaged; the default is 100 unless otherwise speci-
fied. Increasing the number of sweeps averaged increases the amount of averaging.
Use VAVG to view low level signals without slowing the sweep time. Video averaging can lower the noise floor more than a 1 Hz video bandwidth, if a large number of sweeps is specified for averaging. Video average may also
be used to monitor instrument state changes (changing bandwidths, center frequencies, etc.) while maintaining a
low noise floor. (See Chapter 11 in Section I. Also see KSG and KSH.)
OTJTPUT718; VAVG125;
Programming 36 1

8/21/2019 analiz_espctros
http://slidepdf.com/reader/full/analizespctros 470/536
VB
Video Bandwidth
The VB command specifies the video filter bandwidth, which is a post-detection filter. Available bandwidths are 1Hz, 3 Hz, 10 Hz, 30 Hz, 100 Hz, 300 Hz, 1 kHz, 3 kHz, 10 kHz, 30 kHz, 100 kHz, 1 MHz, and 3 MHz.
The program line below sets the video bandwidth to 10 kHz.
OUTPUT 718;“VB lOK Z;”
The functions of the VB command and front panel m key are identical.
362 Programming

8/21/2019 analiz_espctros
http://slidepdf.com/reader/full/analizespctros 471/536
VBO
Video Bandwidth Coupling Offset
The VBO command specifies the relation between the video and resolution bandwidths that is maintained when
these bandwidths are coupled. The bandwidths are usually coupled, unless the RB or VB commands have been
executed.
Selecting P, sets the ratio to one, that is, the resolution and video bandwidths are always equal.
Selecting 1 sets the video bandwidth one step wider than the resolution bandwidth:
Resolution Bandwidth
3 MHz
1 kHz
100 kHz
30 kHz
10 kH z
3 kHz
1 kHz
300 Hz
100 Hz
30 Hz
10 Hz
Video Bandwidth
3MHz
1 MHz
300 kHz
100 kH z
30 kHz
10 kH z
3 kHz
1 Hz
300 Hz
100 Hz
30 Hz
Selecting -1 sets the video bandwidth 1 step narrower than the resolution bandwidth.
Resolution Bandwidth
3 MHz
1 MHz
300 kHz
100 kHz30 kHz
10 kHz
3 kHz
1 Hz
300 Hz
100 Hz
30 Hz
Video Bandwidth
3 MHz
1 kHz
100 kH z
30 kHz
10 kHz
3 kHz
1 kHz
300 Hz
100 Hz
30 Hz
10 Hz
Programming 363

8/21/2019 analiz_espctros
http://slidepdf.com/reader/full/analizespctros 472/536
VIEW
View
VIEW
The VIEW command displays trace A, B, or C, and stops the sweep. Thus, the trace is not updated. Trace A and
C are discussed below. For detailed information about trace B. see B3 in this section.
DISPLAYMEMORY
ADDRESSESl - 1 0 0 1
1025o-R2025
3073°-R4073
CREFRESH D’SPLAY
When VIEW TRA is executed, the contents of trace A are stored in display memory addresses 1 through 1023.
Address 0 is reserved for the instruction word 1040’. Similarly, when VIEW TRC is executed, the contents of trace
C are stored in display memory addresses 3073 through 4095, and address 3072 is reserved for the instruction
work 1048’. Therefore, any information stored in address fJ is lost when VIEW TRA is executed. Likewise, the
contents of address 3072 are lost when VIEW TRC is executed.
If you have used address 91 or 3072 for a graphics program, or label, you may wish to save their contents before
executing VIEW.
OUTPUT 718;“vIEW TFLC;”
For additional information, refer to Appendix A. (See B3, A3, KSj, and TBSTAT)
l 1040 and 1048 are machine instruction words. 1040 sets addresses 1 through 1023 to zero, and draws trace A. 1048 does the same,
but draws the trace dimly.
364 Programming

8/21/2019 analiz_espctros
http://slidepdf.com/reader/full/analizespctros 473/536
XCH
Exchange
/ - - - D E S T I N A T I O N\ - D E S T I N A T I O N - - ,
XCH
c
t r a c e l a b e l * t r a c e l a b e l c
v a r i a b l e i d e n t i f i e r v a r i a b l e i d e n t i f i e r
I Item Description/Default Range Restriction
TRACE LABEL Alpha character. User-defined label declared in AA-Z.7 and _
TRDEF statement. 2- 12 characters required.
VARIABLE
IDENTIFIER
Alpha character. User-defined identifier
declared in VARDEF statement.
AA-22 and _
2- 12 characters required.
Alpha character. Measurement-variable
identifier, such as CF or MA.
Trace element, such as TRA( 101.
The XCH command exchanges the contents of the destinations. The destinations may be different lengths, as
trace operands (TRA, TRB, TRC, and trace label) range from 1 to 1008 elements in length, and a variable
identifier is 1 element long. During execution of the XCH command, the longer destination is truncated to fit the
shorter destination.
P r o g r a m m i n g 3 65

8/21/2019 analiz_espctros
http://slidepdf.com/reader/full/analizespctros 474/536

8/21/2019 analiz_espctros
http://slidepdf.com/reader/full/analizespctros 475/536
APPENDIX A DISPLAY MEMORY STRUCTURE
Appendix A
DISPLAYMEMORYSTRUCTURE
This appendix describes the spectrum analyzer display memory A summary of trace data manipulation by the
trace mode functions is also included.
The display memory is defined as the digital storage allocated in the spectrum analyzer for the information that is
presented on the CRT display. It comprises four different memories: three trace memories and one annotation
memory. Addresses are assigned as follows:
DISPLAY MEMORY ADDRESSES
Page 1Trace A
Page 2
Tirace B
Page 3Graticule
and
Annotation
Page 4
Trace C
1023
1024
2047
2048I
3071
3072
TRACES
The trace pages are used primarily to store analyzer response data to be displayed. Use is not restricted to the
storage of trace data. Operator defined graphics and annotation can also be written into the memory for display on
the CRT
Each trace address may contain an integer from 0 to 4095. When drawing, trace values from 0 to 1023 are plotted
on the CRT display as amplitude y position, in display units. Appendix B discusses these values in detail.
Appendix 1

8/21/2019 analiz_espctros
http://slidepdf.com/reader/full/analizespctros 476/536
DISPLAY MEMORY STRUCTURE APPENDIX A
1 0 2 3
1 0 0 0
7 0 0
6 0 0
Y P O S I T I O N
in D isp lay Uni ts5 0 0
4 0 0
3 0 0
2 0 0
1 0 0
0 \0 1 0 0 2 0 0 3 0 0 4 0 0 5 0 0 6 0 0 7 0 0 8 0 0 9 0 0 1 00 0 1 02 3
X POSITION in Display Units
For each trace, A, B, or C, the display width on the CRT is determined by the instruction word in the first address
for that trace. In the example below, the first address is 1024 and the instruction word is 1040.
Trace B
uyglll~
Addresses
Address
1024
10251026
:
:
I:
2d23
2024202520262027
::
:
:
201462047
Amplitude
Value, Y
1040
622531
:
:
:
181 :
162185
10721072
10721072
x,,dnP;i;on
Display Instruction
KU=9
(1,531)I:
:I
(998,181) :
(999,162)(1000,185)
i
Over-rangeAddresses(Blanked)
Addresses 2023 and 2024 describe one trace line drawn from x,y coordinates (998,181) to x,y coordinates(999,162). The 1072 values shown for the overrange addresses tell the analyzer to blank these values instead of
interpreting them as coordinates.
ANNOTATION AND GRATICULE
Page 3 of the display memory fills with instructions on instrument preset. These instructions draw the graticule and
annotation on the displays.
The display memory in page 3 contains the information necessary to position and display (or blank) labels,
graticule lines, and markers. A brief description of the contents of page 3 is given on the next page. The first
2 Appendi x

8/21/2019 analiz_espctros
http://slidepdf.com/reader/full/analizespctros 477/536

8/21/2019 analiz_espctros
http://slidepdf.com/reader/full/analizespctros 478/536

8/21/2019 analiz_espctros
http://slidepdf.com/reader/full/analizespctros 479/536
APPENDIX A DISPLAY MEMORY STRUCTURE
Blank A4 B4
1. The sweep is stopped and the trace is not displayed.
Exchange A and B EX
1. The sweep is stopped. If either trace is in a CLEAR WRITE or MAX HOLD mode, it is placed in VIEW.
2. The contents of traces A and B are exchanged.
A-B+AOn C 2
1.
2.
3.
4.
A
1.
2.
B
1.
2.
-
-
The sweep is stopped and trace B is placed in VIEW mode.
A is replaced with A - B (A minus B) .
The sweep is continued from the left. Each new analyzer response point is reduced by the amount stored in
the corresponding address of trace B, and the result is stored in trace A. This process continues at the sweep
rate.
Subsequent sweeps continue the process.
B AOff C l
Subsequent analyzer responses are written directly into trace A. Trace B and its mode are not changed.
The amplitude stored in the display line register is subtracted from the contents in each trace B address andthe result is stored at the same trace B address.
DL B BL
Trace B is placed in view. Trace A is not changed.
The amplitude stored in the display line register is subtracted from the contents in each trace B address. The
result is stored at the same trace B address.
Appendi x 5

8/21/2019 analiz_espctros
http://slidepdf.com/reader/full/analizespctros 480/536
ADVANCED DISPLAY PROGRAMMING APPENDIX B
Appendix B
ADVANCED DISPLAY PROGRAMMING
This appendix describes CRT display programming with the analyzer display language.
A display program increases the CRT graphics capability of the spectrum analyzer. Explicit display programminggenerally uses less display memory, allowing more efficient use of the 4,096 display addresses available.
Appendix A, Display Memory Structure, provides background material for information in this appendix.
DISPLAY PROGRAM DEFINED
A display program consists of a specific set of display commands which are followed by instructions and/or datawords written into the display memory.
Use these commands to write display programs into memory.
DA
DW
DD
DR
Display Address puts the address into the display memory address register (referred toas the current address).Instruction or Data Write writes the instruction or data word into the current displayaddress. The current display address pointer is then automatically advanced to the nexthigher address.Binary Instruction or Data Word writes two &bit binary words into the currentaddress. *Display Read places the contents of the current address on the HP-IB data lines. These
contents are then read by the HP-IB controller according to the current Output format
(01 to 04). Execution of each DR concludes by advancing the current address by one
(1).Instruction Words dictate the operating mode of the CRT circuitry, such as label, graph, or plot. The data words
contain amplitude or position information.
Instruction and data words are written into memory when the above commands are used. For example, the code“PA 500,600” writes into the display memory the instruction word for vector, 1026, followed by the x and y datavalues 500 and 600. This same “plot absolute” command could also be done as a display program by writing“1026,500,600” into the display memory. The display program is “executed” each time the CRT is refreshed frommemory.
LOADING AND READING A DISPLAY PROGRAM
Instruction and data words are loaded directly into the analyzer display memory by, fist, specifying the beginningaddress of the program, then writing in the instructions and data serially. To write the “1026,500,600” program
beginning at address 1024 (the first address of trace B) , execute
O U T P U T 718;“DA 1024:DW 1026,500,600;”
This program instructs the display to draw a vector to the position (500,600) on the CRT
*The first byte contains the four most significant bits, the second contains eight least significant bits of the E-bit instruction or data word.
DD must be executed for every 2 bytes input into the analyzer.
6 Appendi x

8/21/2019 analiz_espctros
http://slidepdf.com/reader/full/analizespctros 481/536

8/21/2019 analiz_espctros
http://slidepdf.com/reader/full/analizespctros 482/536

8/21/2019 analiz_espctros
http://slidepdf.com/reader/full/analizespctros 483/536
APPENDIX B ADVANCED DISPLAY PROGR AMMING
clear x position (clx) : Reset the x axis display position to the far left (0,~).
big expand (hex) : Amplify the x and y CRT beam deflection by a 1.9 factor.
expand and shift (exs) : Amplify the x and y CRT beam deflection by a 1.13 factor (expand) and shifts the
(zero,zero) reference point to the lower left of the CRT screen. l
dim (dim):
bright (brt) :
Set the CRT beam intensity below the normal level.2
Set the CRT beam intensity to the maximum level.*
Flow-of-Control Instruction Words. The CRT refresh program normally executes the contents of mem-
ory starting with address PI and working one address at a time to address 4095. Flow-of-control instruction words
alter the normal flow of a refresh program by allowing program execution to be transferred anywhere in memory.
They allow jumps to specific display addresses (imp), jumps to a display program subroutine (jsb), returns (ret),
skips to the next control instruction (skc), and a word that simulates a “for...next” loop, the decrement-and-skip-
on-zero (dsz). Control instructions contain pI 1 P, in bits 11, 10, and 9, respectively.
jump imp)
11109 8 7 6 54 3 2 10
011 lslxls 010 xl1 lel111 1035
jump to subroutine jsb)
return (ret) 1227
skip to next control instruction (skc) 1027
skip to next memory page (skp)
end of display (end)
decrement and skip on zero (dsz)
The address to be jumped to is the contents of the memory word following the jmp or jsb instruction. For example,
“1035,2048” causes program execution to jump to address 2048. The address given should contain a control
instruction. (If the address does not contain a control instruction, the program will go to the first control instruction
following the specified address.) A return (ret) causes the program execution to return to the first control instruction
following the jsb instruction that sent it to the subroutine.
‘The display size commands combine these size instructions as follows:
instructions ratio to D 1 origin shifted
Dl none 1.00 no
D2 exs 1.13 yes
D3 bex and exs 1.68 yes- beX 1.49 no
2The intensity of the beam is also dependent upon line length. Lines longer than a preset length will be brighter because beam writing rate
is slowed.
A p p en d i x 9
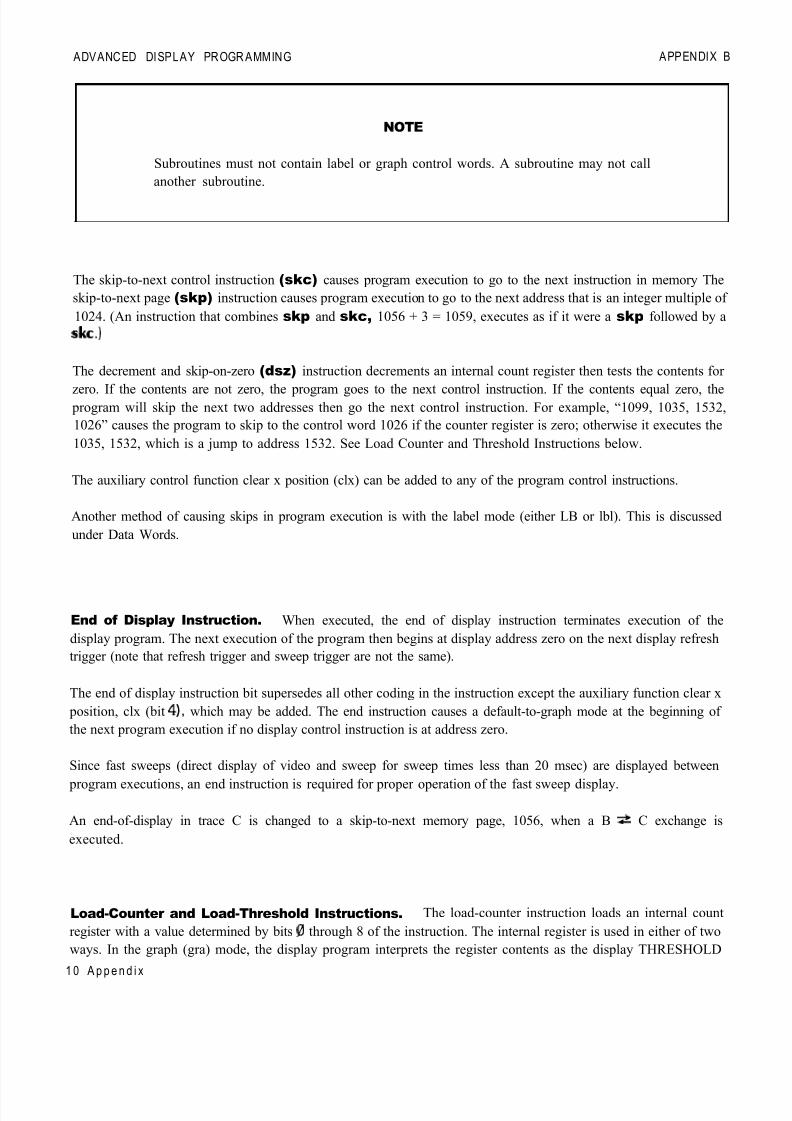
8/21/2019 analiz_espctros
http://slidepdf.com/reader/full/analizespctros 484/536
ADVANCED DISPLAY PROGR AMMING APPENDIX B
NOTE
Subroutines must not contain label or graph control words. A subroutine may not call
another subroutine.
The skip-to-next control instruction (skc) causes program execution to go to the next instruction in memory The
skip-to-next page (skp) instruction causes program execution to go to the next address that is an integer multiple of
1024. (An instruction that combines skp and skc, 1056 + 3 = 1059, executes as if it were a skp followed by a
skc.)
The decrement and skip-on-zero (dsz) instruction decrements an internal count register then tests the contents for
zero. If the contents are not zero, the program goes to the next control instruction. If the contents equal zero, the program will skip the next two addresses then go the next control instruction. For example, “1099, 1035, 1532,
1026” causes the program to skip to the control word 1026 if the counter register is zero; otherwise it executes the
1035, 1532, which is a jump to address 1532. See Load Counter and Threshold Instructions below.
The auxiliary control function clear x position (clx) can be added to any of the program control instructions.
Another method of causing skips in program execution is with the label mode (either LB or lbl). This is discussed
under Data Words.
End of Display Instruction. When executed, the end of display instruction terminates execution of the
display program. The next execution of the program then begins at display address zero on the next display refresh
trigger (note that refresh trigger and sweep trigger are not the same).
The end of display instruction bit supersedes all other coding in the instruction except the auxiliary function clear x
position, clx (bit 4)) which may be added. The end instruction causes a default-to-graph mode at the beginning of
the next program execution if no display control instruction is at address zero.
Since fast sweeps (direct display of video and sweep for sweep times less than 20 msec) are displayed between
program executions, an end instruction is required for proper operation of the fast sweep display.
An end-of-display in trace C is changed to a skip-to-next memory page, 1056, when a B s C exchange is
executed.
Load-Counter and Load-Threshold Instructions. The load-counter instruction loads an internal count
register with a value determined by bits fJ through 8 of the instruction. The internal register is used in either of two
ways. In the graph (gra) mode, the display program interprets the register contents as the display THRESHOLD
1 0 A p p e n d i x

8/21/2019 analiz_espctros
http://slidepdf.com/reader/full/analizespctros 485/536
APPENDIX B ADVANCED DISPLAY PROGRAMMING
position. The second use is the count register for the decrement and skip-on-zero (dsz) instruction. The interpreta-
tion for these two uses is shown below:
1110 9 8 7 6 5 4 3 2 10
load count register (Idc) COUNT
lto255
load threshold 0110xxxxxxxx
Display threshold position 1
dlvfded by 4
threshold off
NOTE
The Idc and dsr instructions use the THRESHOLD level register. Therefore, load
threshold instruction 1536 must be executed after all uses of Idc and dsz, and before
the next graph command is executed. If the load threshold is not executed, the thresh-
old may not function correctly.
DATA WORDS
Data words are differentiated from instruction words by the two most significant bits, bits 11 and 10. The following
words are data words:11109 8 7 6 5 4 3 2 1 0
00xXxX
Interpretation of these data word formats by the CRT refresh program depends entirely on the preceding instruc-
tion word.
Graph. Each data word following a graph instruction is interpreted as an absolute y position. Y position valuesfollow the general rule shown below:
11 10 9 8 7 6 5 4 3 2 1 0
positive data, displayed 0 0 x x x x x x x x x x Oto 1023=ypositlon
positive data, blanked x x x x x x 2048 + yposition
negative data, blanked 11xxxxxxxxxx 4096 - y magnitude
(a two’s complement value)
A p p e n d i x 1 1

8/21/2019 analiz_espctros
http://slidepdf.com/reader/full/analizespctros 486/536

8/21/2019 analiz_espctros
http://slidepdf.com/reader/full/analizespctros 487/536
APPENDIX B ADVANCED DISPL AY PROGRAMMING
carriage return (CR) 13
blink on (bkon) 17
blink off (bkof) 18
space (SP) 32skip to next 16 block (sk16) 145
skip to next 32 block (sk32) 146
skip to next 64 block (sk64) 147
A blink on (bkon) will cause blinking of everything drawn on the display until a subsequent blink off (bkof) or an
end of display (end) instruction is encountered with program execution.
A skip 16, 32, or 64 will cause program execution to go to the next address that is an integer multiple of 16, 32, or
64, respectively.
Note that these functions will work for both the lb1 instruction code (1025 + ) or the LB command.
PROGRAMMING WITH DISPLAY CONTROL INSTRUCTION WORDS
These examples illustrate the use of display control instructions and data words. The display memory commands
described at the start of this appendix are used for loading and reading.
Vector (vtr)
Instructions can be used to draw lines on the CRT display. The data words each determine whether the data is
plotted absolute/relative or blanked/unblanked (pen up/pen down). The auxiliary functions apply to the vector
instructions.
For example, a line is to be plotted on the display with plot relative instructions in trace C memory beginning at
address 3072.
address description program word
3072
3073
3074
3075
3076
vector
x = 450 absolute
y = 450 blanked
x = - 100 relative
y = + 100 relative
pen down
vtr
450 + 0
450 + 2048
(1024 - 100) + 2048
100 + 0
I I I
1026
450
2498
2972
100
A p p en d i x 13

8/21/2019 analiz_espctros
http://slidepdf.com/reader/full/analizespctros 488/536
ADVANCED DISPLAY PROGR AMMING
The load program is:
OUTPUT 718; DA 3072;DW 1026,450,2498,2972,100:
APPENDIX B
Vector and Label (vtr and Ibl). To demonstrate the display instructions, a simple block diagram is drawn
and labelled. Then the control words are modified with some of the auxiliary functions to demonstrate their use.
First a graphics plan is drawn:
(-300.0) Relative4
A
(0, -200) (0, +200)Relative Relative
(300,300) +260, +20) RelativeAbsolute _ - - a - - -
* +300,0) Relativec
/A (-100, 0) Relative
MR (-10, -40)Relative
MR* INPUT
Graphics Plan
The vectors with + and - signs are relative vectors, the others are absolute points. Dashed lines are to be
blanked.
1 4 A p p e n d i x

8/21/2019 analiz_espctros
http://slidepdf.com/reader/full/analizespctros 489/536
APPENDIX B ADVANCED DISPLAY PROGRA MMING
address description program word
3072
3073
3074
3075
30763077
3078
3079
3080
3081
3082
3083
3084
3085
3086
30873088
3089
3090
3091
3092
3093
3094
3095
vector absolute
x = 300 absolute
y = 300 pen up
x = + 300 relative
y = 0 pen downx = 0 relative
y = + 200 pen down
x = -3OOrelative
Y = 0 pen down
x = 0 relative
y = - 200 pen down
x = +260relative
y = +ZOpenup
x = 0 relative
y = - 100 pen down
x = - 10 relativey = -4Openup
label
the word
“INPUT”
end of display
vtr 1026
300 + 0 300
3OO ZO48 2348
300 + 2048 2348
o + o 0 2O48 2048
200 + 0 ZOO
(1024-300) -t 2048 2772
0 0
2O48 2048
(1024-200) + 0 824
260 + 2048 2308
2 2O48 2068
2O48 2048
(1024-100) + 0 924
(1024-10) +2048 3062(1024-40) +2048 3032
lb1 1025
I 73
N 78
P 80
u 85
T 84
end 1028
The above plan can then be programmed and run.
10
20
30405 0
60
i i :
OUTPUT 718;t~IP;KSo;KSm;A4;1
OUTPUT 718;"DA 3072;DW 1026, 300, 2348,OUTPUT 718; 2348, 0, 2048, 200,OUTPUT 718: 2772, 0, 2048, 824,OUTPUT 718; 2308, 2068, 2048, 924,
OUTPUT 718; 3062, 3032,OUTPUT 718; 1025, 73, 78, 80, 85, 84, 1028; "END
A p p en d i x 15

8/21/2019 analiz_espctros
http://slidepdf.com/reader/full/analizespctros 490/536
ADVANCED DISPL AY PROGRAMMING APPENDIX B
The display can now be modified by adding various auxiliary functions to the existing control words.
Brighten the “INPUT” term by adding 128 (brt) to the label address 3089 (1025 + 128 = 1153).
70 O U T P U T 718;“1153, 7 3 , 7 8 , 80, 85, 8 4 , 1028:”
The label “INPUT” can be made to blink by adding blink on (bk on) and blink off (bk of) words before and after the
“INPUT” label.
70 OUTPUT 718; 1025, 17, 73, 78, 80’ 85, 84’ 18’ 1028:”
Alternately, line 7 could have been replaced with the following lines:
61 OUTPUT 718:“DTB”70 OUTPUT 718 USING K,B,K,B,K“;“LB”; 17;“INPUT; 18;VDW1028"
1 6 A p p e n d i x

8/21/2019 analiz_espctros
http://slidepdf.com/reader/full/analizespctros 491/536
APPENDIX B ADVANCED DISPLAY PROGRAMMING
Note that a write binary (wtb) is used to transmit a mix of characters and non-character codes.
PROGRAMMING WITH PROGRAM CONTROL INSTRUCTION WORDS
These examples use both the commands listed in Section II and instruction words.
End-of-Display (end) and Skip-to-Next-Memory-Page (skp) Instruction Words. To end the dis- play after the first 100 points of trace A, write “DW 1028” into address 100.
OUTPUT 718; IP;S2;TS;DA 100;DW 1028:"
In this example, all display memory information beyond address 100 is ignored, including the annotation. Note
that the analyzer is in single sweep, S2, to prevent signal response data from writing over the control word.
Skip control words allow certain portions of the display to be omitted. There are two kinds of skip control words.
The fist enables a skip over the remainder of the present memory page to the beginning of the next memory
page, the second enables a skip to the next control word.
The skip-page and skip-to-next-control-word have been assigned two command codes, PS and SW, respectively
In the example, the annotation was blanked because of the end-of-display written into address 100. If a skip had
been written instead, the rest of the display memory would have been displayed, but the remainder of trace A
would have been omitted.
A p p en d i x 17

8/21/2019 analiz_espctros
http://slidepdf.com/reader/full/analizespctros 492/536
ADVANCED DISPLAY PROGRA MMING APPENDIX B
OUTPUT 718; IP;S2;TS;DA 100;DW 1056;”
(Note that programming code PS can be substituted for DW 1056.)
A skp written into the trace C page skips the refresh pointer to DA 0 (trace A). This may cause an increase in the
trace intensity because the program does not wait for a refresh trigger before beginning the next execution of the
program. An end of display, 1028, is normally used in the Trace C page. This instruction allows a new refresh
cycle to begin.
Skip-to-Next-Control-Instruction (skc). Program control is transferred to the next control instruction.
For example, address 2073 of the annotation memory page contains the label control word that places the center
frequency “I 1” mark on the CRT To omit this marker from the display, the label word is replaced by a skc word.
OUTPUT 718;“ DA 2073;DW 1027:”
or
hp
” m
OUTPUT 718; DA 2073:DW SW:
(Note that programming code SW can be used for DW 1027.)
Jump (imp). The example demonstrates jmp by jumping over the data in addresses 100 to 500 in trace A.
Since the jump should be made to a control word, gra is first written into DA 500.
1 8 A p p e n d i x

8/21/2019 analiz_espctros
http://slidepdf.com/reader/full/analizespctros 493/536
APPENDIX B
Before the program is loaded the display might look like this:
ADVANCED DISPLAY PROGRA MMING
After the following lines are executed the CRT would appear like this:
1 0 OUTPUT 718;“IP;S2;TS;DA 500:DW 1024;”
11 OUTPUT 718;“DA 100:DW 1035, 500;”
13 END
The trace data that would have been shown between display addresses 100 and 500 is omitted and the data for
addresses 501- 1001 is displayed at x positions 100 through 600.
Jump Subroutine jsb) and Return (rtn). The jsb instruction transfers program control to the address
specified. If the address does not contain a control word, the program skips to the next control word after that
address. The rtn instruction transfers program control to the first control word following the jsb instruction.
A p p en d i x 19

8/21/2019 analiz_espctros
http://slidepdf.com/reader/full/analizespctros 494/536

8/21/2019 analiz_espctros
http://slidepdf.com/reader/full/analizespctros 495/536
APPENDIX B ADVANCED DISPLAY PROGRAMMING
The display would appear similar to this:
Once a subroutine is written in a given location, care
must be exercised that it is not accidentally changed.
For example, storing a trace in trace C would destroy
the subroutine beginning at DA 3080.
LOOP INSTRUCTIONS C6NIER II .z? s ss MS 9-m 1.m bwzRF . ml 10 LW H 3s n, YIP 1s.0 a..‘
Load Counter Register (Idc) and Decrement and Skip on Zero (dsz). In the following example,
looping is used to draw a grid in two places on the CRT display on refresh. The trace C page is programmed to
contain the graphics.
positioningvector
address description
3072 plot absolute
3073 x = 600 (PA)
3074 y = 300 (PU)
3075 jump to subroutine
3076 at address
3077 plot absolute
3078 x = 100 (PA)
3079 y = 300 (PU)
3080 jump to subroutine3081 at address
3082 end of display
program word
vtr 1026
600 600
300 + 2048 2348
j sb 1163
address 3199
vtr 1026
100 100
300 + 2048 2348
jsb 1163address 3199
end 1028
looping
subroutine
3199 vector
3200 repeat 10 times
3201 plot relative
3202 x = 0 (PR)
3203 y = +25(PU)
3204 x = + 300 (PR)
3205 y (PD)= 03206 x = 0 (PR)
3207 y= +25(PU)
3208 x = -3OO(PR)
3209 y = 0 (PD)
3210 decrement
3211 jump to
3212 start
3213 return
vtr 1026
Idc + 10 1546
vtr 1026
0+2048 2048
25 + 2048 2073
300 + 2048 2348
0 00+2048 2048
25+2048 2073
1024-300 + 2048 2772
0 0
dsz 1099
jmp 1035
address 3201
rtn 1227
Appendix 2 1

8/21/2019 analiz_espctros
http://slidepdf.com/reader/full/analizespctros 496/536
ADVANCED DISPLAY PROGR AMMING APPENDIX B
The program can then be written, loading the words sequentially as listed in the prior plan.
10
g
50
60
70
80
90100
Line 10:
Lines 20 to 30:
Line 40:
Lines 50 to 90:
OUTPUT 718; IP;KSo;KSm:A4: ~
OUTPUT 718; DA 3072:DW 1026,600,2348,OUTPUT 718; 1163 3199 1026 188 2348 1163
OUTPUT 718: 3199, 1028:
OUTPUT 718; DA 3199;DW 1026,1546,1026,OUTPUT 718; 2048,2073,2348,0,2048,2073,OUTPUT 718; 2772,0,1099.OUTPUT 718; 1035,3201,OUTPUT 718; 1227: HD;
END
Blanks the analyzer display
Contain the positioning vectors.
An end of memory instruction (1028) insures that the following loop (DA 3199) is not
executed unless called from addresses 3075 and 3080, the jsb words.
Contain the grid subroutine.
Running the program results in the following display:
2 2 A p p e n d i x

8/21/2019 analiz_espctros
http://slidepdf.com/reader/full/analizespctros 497/536

8/21/2019 analiz_espctros
http://slidepdf.com/reader/full/analizespctros 498/536
ADVANCED DISPLAY PROGRA MMING APPENDIX B
INSTRUCTION AND DATA WORD SUMMARY
Display Control Instruction
graph kw4
label (Ibl)
vector
Auxiliary to gra, Ibl, and vtr instruction word:
big expand (hex)
expand and shift (exs)
bright (brt)
dim (dim)clear x position
Program Control Instruction
end of display (end)
skip to next memory page (skp)
skip to next control word(i) (skc)
jump(l) (jmp)
jump to subroutine”) f3) (isb)
return(l) t3) (ret)
decrement and skip two addresses
Data Word
1024
amplitude: position unblanked Y
position blanked y + 2048
negative blanked 4096-1~1
1025
character ASCII or special
character code (~25f
blink on (bkon) l 17
blink off (bkof) l 18
skip to next 16 block (sk16) * 145
skip to next 32 block (sk32) l 146
skip to next 64 block (sk64) l 147
1026
x position data in display unitsy position data in display units
absolute vectors x+0
relative vectors x + 2 0 4 8
pen down Y o
pen up (blanked) y+2048
word + 256
word + 64
word + 128
word + 8word + 16
Data Word
1028
1056 or “PS”
1027 or “SW”
1035
address 0 to 4096
1163
address 0 to 4096
1227
1099
on zero”) 2) (dsz)
load counter (THRESHOLD position)‘*) (Idc)
l
1536 + (count)
These can also be accessed using the LB command. These functions can be initiated any time the label mode is active.
w Jumps and skips will skip to an address containing a control word.
*I Loop should use only Ibl and vtr control words. Ldc is not a co&ol word.
c3 Subroutines may use only vtr control words.
2 4 A p p e n d i x

8/21/2019 analiz_espctros
http://slidepdf.com/reader/full/analizespctros 499/536
APPENDIX C
Appendix C
LEARN STRING CONTENT
LEARN STRING CONTENT
The following table describes the learn string contents and coding, and the control settings restored when the learn
string command, OL, is executed. (See OL.)
A p p en d i x 25

8/21/2019 analiz_espctros
http://slidepdf.com/reader/full/analizespctros 500/536
LEARN STRING CONTENT APPENDIX C
HP 8566B LEARN STRING DECODING (1 OF 6)
BYTE
NUMBEF
10
11
12
1314
1516
17
18
19
BIT USAGE
BY
EXAMPLE
7 6 5 4 3 2 1 0
0 0 0 1 1 1 1 1
EXAMPLE
- - - - - - 0
0 0 0 0 0 0 0 00 0 0 1 0 0 1 00 0 1 1 0 1 0 0
0 1 0 1 0 1 1 00 1 1 1 1 0 0 0
1 0 0 1 0 0 0 0
0 - - - - - - -
- - - - - - 0 0
3 1 (decimal)
+ (plus sign)
0 01 23 4
5 67 89 0
03
1 - - - - - - - Band lock
- - - 0 0 1 0 0
0 0 0 0 0 0 0 00 0 0 0 0 0 0 00 0 0 0 0 0 0 0
0 0 0 0 0 0 0 10 0 0 0 0 0 0 0
0 0 0 0 0 0 0 1
i v - - - - - -
- 1 - - - - - -
---l---
- - - - I---
- - - - - o - -
- - - - - - o -
- - - - - - - 0
1 - - - - - - -
- I - - - - - -
1- - - - - - -
---I----
- - - - I - - -
- - - - - - - 1
4th Harmonic
0 00 00 0
0 10 0
0 1
Enabled
On
On
On
Coupled
Coupled
Notifies analyzer that a learn string follows
Unused
Sign of center frequency: I= + , 1 = -
Center frequency (CRT annotation is rounded from this value)
BCD
MSD: Byte 4, bits 4 through 7
For this example, the Center frequency is 1234567896 Hz.
Bit 7 set to 1 if in zero span mode.
Output Format
#=03,1=01,2=04,3=02
Band Lock
0 = unlock (IP, KSQ)
1 = band lock (KSt)
Harmonic mode in use, 0, 1,2.. ., where 0 is fundamental mixing O-2.5 GHz.
Frequency span in Hz (CRT annotation is rounded from this value)
BCD
MSD: Byte 12, bits 4 thru 7
For this example: 10001 (Hz)
0 = DATA HOLD (HD) 1 = DATA Enabled
SIGNAL TRACK O=Off
Instr Check I LED O=Off
Instr Check II LED O=Off
CF STEP SIZE 0 = Coupled
ATTEN 0 = Coupled
SWEEP TIME 0 = Coupled
VIDEO BW 0 = Coupled
RES BW 0 = Coupled
THRESHOLD O=Off
DISPLAY LINE O=Off
Noise Marker (KSM) O=Off
Frequency display modeO=CF, SP
1 = start-stop
l=On
l=On
l=On
1 = Uncoupled
1 = Uncoupled
1 = Uncoupled
1 = Uncoupled
1 = Uncoupled
l=On
l=On
l=On
DESCRIPTION
2 6 A p p e n d i x

8/21/2019 analiz_espctros
http://slidepdf.com/reader/full/analizespctros 501/536

8/21/2019 analiz_espctros
http://slidepdf.com/reader/full/analizespctros 502/536
LEARN STRING CONTENT APPENDIX C
HP 8566B LEARN STRING DECODING (3 OF 6)
BIT USAGE
BYTE BY
NUMBER EXAMPLE EXAMPLE DESCRIPTION
7 6 5 4 3 2 1 0
27
llll---- 3 MHz Resolution Bandwidth (RES BW)
15=3MHz 6=1 kHz
14= 1 MHz 5=3OOHz
13=3OOkHz 4=1OOHz
12= 100 kHz 3=30Hz
11=30kHz 2= 10Hz
lO= 10 kHz
9=3 kHz
- - - - 0 1 0 1 300 Hz Video Bandwidth (VIDEO BW)
Coding is same as Resolution Bandwidth with the addition of:1=3Hz
O=lHz
28 Internal Flag
--OlO--- Sample Trace Detection Mode
0 = Negative peak (KSd)
1 = Positive peak (KSb)
2 = Sample (KSe)
4 = Normal (KSa)
29
- - - - - 0 1 0 Max Hold B TRACE display modes
0 = CLEAR-WRITE A
1 = CLEAR-WRITE B
2=MAXHOLDA
3 = MAX HOLD A, CLEAR-WRITE B
4=MAXHOLDB
5 = MAX HOLD B, CLEAR-WRITE A
6 = Write A-B
7 = Max Hold A-B
30
TRIGGER Mode
0 = FREE RUN---Ol--- EXT l=EXT
2 = LINE
3 = VIDEO
31
32
33
34
35
------ll
1 1 1 0 1 0 0 0
0 0 0 0 0 0 0 1
1 1 1 1 0 1 0 0
1000
500
Unused
DISPLAY LINE position in display units 0 thru 100 given by
16 bits of bytes 32 and 33 where bit 7 byte 32 is the MSB
THRESHOLD in display units. Coded the same as Display Line
bytes 32 and 33 (bit 7 of byte 34 is MSB).
2 8 A p p e n d i x

8/21/2019 analiz_espctros
http://slidepdf.com/reader/full/analizespctros 503/536
APPENDIX C LEARN STRING CONTENT
HP 8566B LEARN STRING DECODING (4 OF 6)
BYTE
NUMBER
36
37
38
39
40
41
42
43
44
45
46
47
4849
50
51
52
5 3
54
55
56
57
58
59
BIT USAGE
BY
EXAMPLE
7 6 5 4 3 2 1 0
O-------
- 0 0 0 0 0 0 0
1 0 0 1 0 1 1 0
- - - - - - - 1
0 0 0 1 0 0 1 0
0 0 1 1 0 1 0 0
0 1 0 1 0 1 1 0
0 1 1 1 1 0 0 0
1 0 0 1 0 0 0 0
0 0 0 1 0 0 1 0
- - - - - 101
1101000-
0 0 0 0 0 0 0 10 0 1 0 0 0 1 1
0 1 0 0 0 1 0 1
0 1 1 0 0 1 1 1
1 0 0 0 1 0 0 1
0 0 0 0 0 0 0 1
0 0 0 0 0 0 0 1
1 1 1 1 0 1 0 0
0 0 0 0 0 0 0 1
0 1 0 1 0 0 0 1
0 0 0 0 0 0 1 0
0 1 0 1 1 0 0 0
EXAMPLE DESCRIPTION
Positive
150
REF LEVEL Offset (KSZ), Sign o= + l= -
REF LEVEL Offset (KSZ), in dB
Where bit 6 Byte 36 is MSB and bit 0 byte 37 is LSB of a 15 bit binary
value. If sign bit is 0 (pos) offset is decimal equivalent of binary value/
10. If sign bit is 1 (neg) offset is two’s complement of binary value/lO.
Negative
1 2
3 4
5 6
7 8
9 0
1 2
1000
0 12 3
4 5
6 7
8 9
0 1
500
337
60 0
Unused
FREQUENCY OFFSET (KSV). Sign 0 = +l= -
FREQUENCY OFFSET (KSV), in Hz
B C D
MSD: Byte 40, bits 4 thru 7
Example:
1 2 3 4 5 6 7 8 9 0 1 2 H z
Video Averaging Limit (KSG)
Binary
MSB: Byte 46, bit 2
Center Frequency STEP SIZE (SS)BCD
MSD: Byte 48 bits 4 thru 7
Range: 0 to 24 GHz
Example:12345678901Hz
Reference Marker X-axis position
Binary
MSB: Byte 54, bit 7
Range: 1 to 1001
Reference Marker Y-axis positionBinary
MSB: Byte 56 bit 7
Range: 1 to 1023
4ctive Marker X-axis position
Binary
MSB: Byte 58 bit 7
Range: 1 to 1001
A p p en d i x 29

8/21/2019 analiz_espctros
http://slidepdf.com/reader/full/analizespctros 504/536
LEARN STRING CONTENT
HP 8566B LEARN STRING DECODING (5 OF 6)
APPENDIX C
BIT USAGE
BYTE BY
NUMBER EXAMPLE EXAMPLE DESCRIPTION
7 6 5 4 3 2 1 0
Active Marker Y-axis position
60 0 0 0 0 0 0 0 1 300 Binary
61 0 0 1 0 1 1 0 0 MSB: Byte 60 bit 7
Range: 1 to 1023
62 Unused
MARKER mode
O=Off
63 0 0 0 1 0 1 0 0 ZOOM 18 = NORMAL
19= A’
20 = ZOOM
()l------ dBmV Reference Level units which will be used when the LOG scale is chosen.
0 = dBm, 1 = dBmV, 2 = dBpV, 3 = Volts
---O---- Off Stop Sweep at marker (KSu)
64 O=Off, 1 =On
- - - - - o - - On *SRQ on Unlock or Hardware Broken, Activated only by R3 or IP
commands, 0 = On, 1 = Off
- - - - - - o- Off *SRQ at End of Sweep. Activated only by R2 command;
O=Off, 1 =On
- - - - - - - 0 Off *SRQ when Units key pressed. Activated only by R4 command;
O=Off, 1 =On
()------- Internal *Input Mixer 0 = Internal
1 = External
- O - - - - - - Disabled *Frequency SRQ, KS < 43 > ; 0 = Off, 1 = On
--I----- “CORR’D” Use CAL data O=No 1 =Yes
6 5 i--l-e--- Cal’d *Calibration routine correction data has been stored
O=No 1 = Yes
- - - - lO-- dBpV Reference Level units which will be used when the LIN scale is chosen.
0 = dBm 1 = dBmV, 2 = dBpV, 3 = Volts
- - - - - - l- View C View trace C O=Off l=On
These settings are recorded by the Learn String but not restored if the string is output to the analyzer (as with RECALL).
3 0 A p p e n d i x

8/21/2019 analiz_espctros
http://slidepdf.com/reader/full/analizespctros 505/536
APPENDIX C LEARN STRING CONTENT
HP 85668 LEARN STRING DECODING (6 OF 6)
BIT USAGE
BYTE BY
NUMBER EXAMPLE EXAMPLE DESCRIPTION
7 6 5 4 3 2 1 066 0 0 0 0 0 0 0 0 0 0 SWEEP TIME in pet.
67 0 0 0 0 0 0 0 0 0 0
68 0 0 0 0 0 0 0 0 0 0 BCD
69 0 1 0 1 0 0 0 0 5 0 MSD: Byte 66, bits 4 thru 7
70 0 0 0 0 0 0 0 0 0 0
71 0 0 0 0 0 0 0 0 0 0 Example: 5OOOOO psec.
72 Internal Flag
-l------ YeS *Power on in last state. This will be activated by KSf command.
O=No l=Yes
---O---- No Extended Reference Level allowed (KSI).
73 O=No l=Yes
- - - - - 1 - - On Video Averaging (KSG)
O=Off l=On
- - - - - - 0: Off Fast HP-IB (KSS)
O=Off l=On
Preselector tracking offset DAC settings:
74 - - 0 1 1 0 1 0 26 B Band (2.0 - 5.8 GHz)
75 - - 0 1 0 1 1 0 22 C Band (5.8 - 12.5 GHz)
76 - - 1 0 0 0 1 1 35 D Band (12.5 - 18.6GHz)
77 - - 0 1 1 1 0 0 28 E Band (18.6 - 24 GHz)
78 lOlOl--- 500 pet Fast SWEEP TIME’s ( < 20 msec)
0 = greater than 10 ms
16= 10ms 23= 100~s
17=5 ms 25=5Ops
18=2ms 26=2Ops
19=lms 27= 10~s
21=5OOps 29=5ps
22=2OOps 30=2ps
31=1ps
79 Unused
80 1 0 1 0 0 0 1 0 Identifies the end of the 8566A Learn String.
These settings are recorded by the Learn String but not restored if the string is output to the analyzer (as with RECALL).
Appen dix 3 1

8/21/2019 analiz_espctros
http://slidepdf.com/reader/full/analizespctros 506/536
SERVICE REQUESTS APPENDIX D
Appendix D
SERWCE REQUESTS
This appendix describes the analyzer service request (SRQ) capability and the use of service requests to interrupt
an HP-IB controller to obtain service. A service request is an analyzer output that tells the controller a specific event
has taken place in the analyzer. Service requests enable the analyzer to interrupt the controller program sequence,
causing the program to branch to a subroutine.
For example, by using service requests, the controller can perform other operations while the analyzer is sweeping,
and then service the analyzer when the sweep is completed. The analyzer sends its service request to the controller,
which triggers the controller to take action, such as changing the instrument state or reading data from the display
memory.
When making a service request, the analyzer places the HP-IB SRQ line true and the analyzer CRT display readsout “SRQ” with a number. Setting the SRQ line true announces to the HP-IB controller that the analyzer requires
attention. The controller can then command the analyzer to send its “status byte”. The status byte indicates the
type of service request.
NOTE
If the CRT display annotation has been blanked, the service request notation will not
appear.
I
DISPLAY DURING A SERVICE REQUEST
3 2 A p p e n d i x

8/21/2019 analiz_espctros
http://slidepdf.com/reader/full/analizespctros 507/536
APPENDIX D
NOTE
A serial polling technique must be used by the HP-IB controller to test for service
requests. The analyzer does not respond to HP-IB parallel polling.
The HP-IB controller response to a service request depends on the controller. The operating manuals for eachcontroller discuss that control&s reaction to setting the SRQ line true. Series 200 computers have a sequence of
commands which enable a response to a service request. These commands allow monitoring the SRQ line and
reading, interpreting, and then clearing the status byte. This sequence of commands and a subroutine, selected
according to the type of service request, form a service routine. A general setup is given below.
Specify iherface select code and label of subroutine
Enable interface card to interrupt
6Enable SRO
Read status byte
Interpret status byte
Computationlcontrol statements
Return to next line in Main Program
A p p en d i x 33

8/21/2019 analiz_espctros
http://slidepdf.com/reader/full/analizespctros 508/536

8/21/2019 analiz_espctros
http://slidepdf.com/reader/full/analizespctros 509/536
APPENDIX D SERVICE REQUESTS
The CRT SRQ number is an octal number based on the binary value of the status byte. This octal number always
begins with a “1” since this is translated from bit 6, the universal HP-IB service request bit. For example, the status
byte for an illegal analyzer command (SRQ 140) is as follows:
bit number 7 6 5 4 3 2 1 0
status byte 0 1 1 0 0 0 0 0
The CRT displays the octal equivalent of the status byte binary number:
“SRQ 140”
The octal equivalent is based on the whole binary number:
01100000 (binary) = 140 (octal)
One simple way to determine the octal equivalent of the binary number is to partition the binary number 3 bits at a
time from the least significant bit, and treat each part as a single binary number:
binary 0 1 1 0 0 0 0 0
octal 1 4 0
The decimal equivalent of the octal number is determined as follows: 140 (octal) = 1 * (8) + 4 l (8) + 0 * (8)
= 96 (decimal).
More than one service request can be sent at the same time. For example, if an illegal analyzer command and the
end of a sweep occurred at the same time, %RQ 144” appears on the CRT display.
bit number 7 6 5 4 3 2 1 0
status byte 0 1 1 0 0 1 0 0 = “SRQ 144”
octal value 1 4 4
Note if bit 1 is set, it has one of three meanings, depending on how SRQ 102 was activated. These meanings are
explained in the following section.
SERVICE REQUEST ACTIVATING COMMANDS
Service requests do not occur unless the appropriate activating command has been given, except for two service
requests: illegal command, SRQ 140, and [SHIFT r] command, SRQ 102 (local operation only). The following
chart summarizes the service request activating commands.
A p p en d i x 35

8/21/2019 analiz_espctros
http://slidepdf.com/reader/full/analizespctros 510/536

8/21/2019 analiz_espctros
http://slidepdf.com/reader/full/analizespctros 511/536
APPENDIX D SERVICE REQUESTS
Lines 130 to 200:
Line 130:
The “InterpreLsrq” subroutine.
Turns off further interrupts from the HP-IB. This prevents the cascading of interrupts
generated by another service request from the analyzer.
Line 140: Assigns the status byte to the variable “Status- byte”. This clears the analyzer’s SRQ
(i.e., the status byte is reset).
Lines 150 to 160: Compares the status byte to two analyzer SRQ codes, and prints the name of the SRQ.
Line 180: Turns on the controller interrupt capability.
Line 190: Re-enables the units-key-pressed SRQ.
Line 200: Returns program execution to the main program.
In the following program, the analyzer sweeps to measure a signal. The controller continues to run its main
program while the analyzer sweeps. An end-of-sweep service request tells the controller when the sweep is
completed. The controller then re-addresses the analyzer and records the measurement data. This procedure
ensures that test data is complete, and improves program execution speed when slow sweeps are used.
10 OPTION BASE 1
:o”
ON INTR 7 GOSUB Record-dataENABLE INTR 7;2
40 I
50 OUTPUT 718;“IP;S2;FA1MZ;FB150MZ;”60 OUTPUT 718;“ST3SC:R2;TSn:70 BEEP80
90 Idle: REPEAT1 0 0 PRINT “WORKING! ”
110 Idle=Idle+l1 2 0 WAIT 1130 UNTIL Idle=7140 PRINT “DONE”150 BEEP160 STOP170 180 Record-data:OFF INTR 7190 OUTPUT 718;“Rl;”200 Is_data_ready=SPOLL(718)
210 IF BIT(Is_data_ready,2)=1 THEN220 OUTPUT 718;“E1;03:MF;”
230 ENTER 718;Freq240 OUTPUT 7 18 “MA ” ;
250 ENTER 718;Ampl260 PRINT “FREQUENCY = I ;Freq:‘*Hz**
270 PRINT “AMPLITUDE = I ;Ampl; dBm
280 ELSE
290 PRINT I Illegal analyzer command?**
300 BEEP310 END IF320 RETURN
330 !340 END
A p p en d i x 37

8/21/2019 analiz_espctros
http://slidepdf.com/reader/full/analizespctros 512/536
SERVICE REQUESTS
Lines 20 and 30:
Lines 50 and 60:
Lines 90 to 150:
Line 180:
Line 190:
Line 200:
Line 210 to 310:
Line 320:
APPENDIX D
Executes the “Recorcldata” subroutine when an interrupt at select code 7 occurs.
Enables interrupts from the HP-IB interface card.
Sets the analyzer for the measurement. The TS command (take sweep) is the last
command sent to the analyzer, and the controller CR/LF is suppressed with a semico-
lon terminator. This is necessary; otherwise, the next program line is not executed until
the sweep is complete. (Refer to the description of the TS mnemonic for a detailedexplanation of line 60.)
Any main program.
“Record-data” subroutine. Turns off interrupts from the HP-IB. This prevents inter-
rupts from cascading.
Clears the end-of-sweep SRQ. This prevents the SRQ from interrupting the program at
the next sweep.
Reads the status byte and clears the SRQ.
Record data if end-of-sweep SRQ was sent.
Returns program execution to the main program.
The following program signals the controller when an operator has completed a data entry. With this information,
the controller can read the data entry or branch to a subprogram.
10 ENABLE INTR 7;2
20 ON INTR 7 GGSUB Read-entry
30 OUTPUT 718;“Rl;R4;EE;”40 PRINT “Enter center frequency on analyzer’s keyboard. **
PRINT “Press S on controller to stop program ”
6 :
70 1dle:REPEAT
80 ON KBD ALL GOSUB Stop90 UNTIL Idle1 0 0 Stop:OUTPUT 718:“Rl;”110 STOP120 !
130 Read-entry:OFF INTR 7140 Is entry readyzSPOLL(718)
150 IF-BIT(Ii entry ready, l ) =l THEN
160 OUTPUT ;r18;“0~;”
170 ENTER 718;Center-freq180 PRINT “YOU ENTERED” ; Center-freq; “Hz”190 OUTPUT 718; R4;EE;200 ON INTR 7 GOSUB Read-entry210 ELSE220 PRINT “ILLEGAL ANALYZER COMMAND?”
230 BEEP240 END IF250 RETURN260 END
3 8 Appendix

8/21/2019 analiz_espctros
http://slidepdf.com/reader/full/analizespctros 513/536
APP EN DI X D SERVICE REQUESTS
Lines 10 and 20: Executes the “Read-entry” subroutine when an interrupt at select code 7 occurs.
Enables interrupts from the HP-IB interface card.
Lines 70 to 90:
Line 100:
Lines 130 to ZOO:Line 130:
Line 140:
Line 150:
Any main program.
Disables the R4 service request.
Forms a subroutine that records the operator’s entry.Turns off interrupts from the HP-IB interface.
Clears the end-of-sweep SRQ and reads the status byte.
Checks the status byte to verify that the interrupt was caused by the units-key-pressed
SRQ. If this is not the case, the program continues at line 220.
Lines 160 to 180:
Lines 200 and 210:
Lines 220 to 250:
Reads the operator’s entry and displays it.
Re-enables operator entry, units-key-pressed SRQ, and the controller interrupt capabil-
ity.
Notifies the operator if the illegal analyzer command SRQ triggered the interrupt.
SERVICE REQUEST FROM THE FRONT PANEL
When the spectrum analyzer is in local operation mode (unaddressed), the operator can call for service from a
controller by pressing front panel key [SHIFT r]. This front panel request for service sends SRQ 102, the units-key-
pressed SRQ. The SRQ command, R4, need not be enabled in order to use the front panel service request.
Example
The front panel service request can summon a controller for assistance. The following example shows one way todo this. During the data transfer, beginning at line 430, the CRT display appears as shown below, with the “DATA
TRANSFER” message blinking.
Several analyzers, each with a different HP-IB address, can call for individual service. This requires serial polling at
the beginning of the service subroutine.
A p p en d i x 39

8/21/2019 analiz_espctros
http://slidepdf.com/reader/full/analizespctros 514/536
SERVICE REQUESTS APPENDIX D
10 DIM A(l001)
20 DIM A [201
43 ”
ENABLE INTR 7;2PRINT “Pressing S on the controller stops program when data is received.”LOCAL 718
2
70 1dle:REPEAT
80 ON INTR 7 GOSUB Which-inst90 ON KBD ALL GOSUB Stop100 UNTIL Idlello stop:STOP120 !
130 *w *** * *s* * ** * *f f * * f f *
140 Which inst:OFF INTR 7150 ff**i~****i*4k***~*4f**
160 Analyzer-a=SPOLL(718)170 IF BITtAnalyzer a, l )>B THEN
180 GOSUB Record Tata190 END IF
200 RETURN210 !
220 i*~ff*ff~~*~+~+ff~*~~ffi
230 Record data: !240 i *~~*~*i +, +f f *f f ~**~~*
250 OUTPUT 718;Y3V1;EM;01;KSm;KSo;A4;DT:n260 OUTPUT 718;“D3;PU;PA64,544;LBOPERATOR NO.?:”270 REPEAT280 OUTPUT 718;“EE;OA;”
290 ENTER 718;Operator
300 UNTIL Operator>0
310 OUTPUT 718;nD3PU;PA512,544;LB”;Operator;n:11
320
330 OUTPUT 718;“D3PU;PA64,512;LBTEST DEVICE SERIAL NO?:”340 OUTPUT 718;“Dj PU;PA64,490;LBPress Hz key when ready. : "
350 OUTPUT 718;“Rl;R4;EE;”
360 REPEAT
370 Hz-key-pressedzSPOLL(718)
380 UNTIL BIT(Hz-key-pressed,l)>B
390 OUTPUT 718; ,IOA”
400 ENTER 718;Serial-number410 OUTPUT 718;~PU;PA512,512;LB”;Serial_number;”:”420 !
430 OUTPUT 718 USING “K,B,K,B,B1’;PU;PA64,312;LB”:17;”DATA TRANSFER INPROGRESS”;18;3
440 OUTPUT 718;“TB;’450 FOR N=l TO 1001
460 ENTER 718:A(N)470 NEXT N480 OUTPUT 718;“EM;RC1;KSn;KSp;HD;f’490 LOCAL 718500 RETURN510 END
4 0 A p p e n d i x

8/21/2019 analiz_espctros
http://slidepdf.com/reader/full/analizespctros 515/536
APPENDIX D SERVICE REQUESTS
A N A L Y Z E RHP4B
C O N T R O LLER
Operator 3 performs Idletests on device (lines 70 through 110)
serial number 123
Stores results in
trace B
Service analyzer 18
SRQ Subroutine (lines 230 through 500)
When complete,operator calls for
service using m r Ask for operator number
KEY FUNCTION4.
and device serial number
l - (I ines 270 through 410)
Operator
Operator uses DATA 3 Record answerskeyboard to answer
questions (see CRT
Device Serial No.
photograph)
QQQEH d lines 290
Record trace B into A N
(lines 450 through 470)
Operator continues
with next device ‘Ic ---a
measurement --99
---mm---wgg Return control to operator
(line 490) 1
Return to idle
(line 500)
Appendix 4 1

8/21/2019 analiz_espctros
http://slidepdf.com/reader/full/analizespctros 516/536
FAST REMOTE OPERATION (KSS AND KST) APPENDIX E
Appendix E
FAST REMOTE OPERATION (KSS AND KST)
This section describes the execution time reduction for commonly used commands that involve sweeping, tuning,
or active functions (for example - TS, CF; or El).
NORMAL OPERATION
During normal operation, the analyzer repeats a specific cycle of operations each time it sweeps. If a single sweep
mode command (S2 or TS) is used, the following sequence of operations occurs once the trigger conditions are
met:
1. Phase lock to the start frequency.
2. Begin and complete sweep.
3. Perform computations for the CRT annotations.
4. Write annotations on the CRT
5. Reset sweep ramp and phase lock to the start frequency.
The analyzer repeats this cycle each time a single sweep command is executed.
In most cases, the remote operation mode does not require operation 4, updating of CRT annotation; and until
another single sweep command is executed, operation 5 is not needed either. Therefore, eliminating operations 4
and 5 does not sacrifice any information or accuracy. Depending on the current instrument state, eliminating
operations 4 and 5 saves between 20 and several hundred milliseconds for each single sweep command execu-
tion. This is important, because the execution of subsequent analyzer commands must wait for the completion of
the sweep cycle. Reducing the required sweep time and eliminating unnecessary operations significantly reduces
the command execution time.
FAST OPERATION KSS)
The KSS command saves execution time by eliminating operation 4, the internal CRT annotation routine, and
operation 5, the second phase lock. KSS is activated with a controller, not from the front panel, and remains in
effect until deactivated by IP LF, KSU, KST, RC, or a local command such as BASIC command lcl. If a single
sweep is executed when KSS is activated, only the first three operations of the sweep cycle are performed; the
analyzer is left tuned to the stop frequency. While KSS is activated, the analyzer is in the single sweep mode;
therefore, a new sweep does not begin until another single sweep command is given. When KSS is deactivated,
the analyzer returns to the sweep mode that was in effect when KSS was activated.
4 2 A p p e n d i x

8/21/2019 analiz_espctros
http://slidepdf.com/reader/full/analizespctros 517/536
APPENDIX E FAST REMOTE OPERATION (KSS AND KST)
Because KSS removes operation 4 and part of operation 5 from the sweep cycle, it reduces the execution time of
commands involving a sweep cycle, tuning, or annotation. The following commands are some of those that
execute faster with KSS: TS, CR, El, RB, SF?
If a command does not require a sweep, or fetches information directly from the analyzer memory, its execution
time is not affected by KSS. This kind of command includes OL, RC, Rl, and KS94.
The following program illustrates how the KSS command saves time.
1 0
2 0
304 0
6” :
870”
90100
DIM A(100),B(100)
OUTPUT 718; “ IP;SPlMZ:M2;S2; ”
FOR N=l TO 100OUTPUT 718; CF4GZ;TS;El;MA;
ENTER 718;A(N)OUTPUT 718;“CF6GZ;TS;El;MA;”
ENTER 718;B(N)
NEXT NEND
The program above stores the amplitude of the largest signal within a 1 MHz band centered about a frequency that
alternates between 4 and 6 GHz. This program takes approximately 40 seconds to run. The program takes only
25 seconds to run if line 20 is changed to read as follows:
OUTPUT 718; IP KSS SPlMZ MS S2
When the program has finished running, the CRT display is as shown in the following illustration.
A p p en d i x 43

8/21/2019 analiz_espctros
http://slidepdf.com/reader/full/analizespctros 518/536
FAST REMOTE OPERATION (KSS AND KST)
To deactivate KSS and leave the analyzer in the same state, execute this command:
OUTPUT 718; RC0
APPENDIX E
NOTE
The p) in “RCO” is a zero and not the letter 0.
FAST PRESET KST)
The instrument preset command, IP initiates a cycle of operations similar to the five steps outlined before, but withthe addition of an internal bus check. If this check detects any faults, one or both of the INSTR CHECK LEDs
remain on. Fast preset is identical with instrument preset command IP except that it does not perform the internal
bus check. In practice, the instrument bus check routine is not needed every time the instrument is preset;
therefore, the analyzer can be preset with the fast preset command, KST. KST takes approximately 0.2 seconds to
execute; IP takes 0.8 seconds.
4 4 A p p e n d i x

8/21/2019 analiz_espctros
http://slidepdf.com/reader/full/analizespctros 519/536
APPE NDIX FTUNING CURVES
60.
50.1
.O
I
o -
) -
I -
/
-
40.t
3o.t
‘f3
5
z22.0
2 b- 20.0
16.0
16.0
14.0
12.0
10.0
6.0
6.0
4.0
2.0
Appendix F
TUNING CURVES
2.0 3.0 4.0 5. 0 6.0 ko GHz
A p p en d i x 45

8/21/2019 analiz_espctros
http://slidepdf.com/reader/full/analizespctros 520/536
CENTER FREQUENCY/SPAN TUNING CHARACTERISTICS APP EN DI X G
Appendix G
CENTERFREQUENCY/SPANTUNINGCHARACTERJSTICS
At the location of the band overlap (2.0- 2.5 GHz) or on band edges (- 1.0 GH z and 24 GHz), the frequency
span may change as center frequency is tuned near the above locations. This situation occurs when the frequency,
span is such that the equivalent start/stop frequency exceeds the tuning range of the analyzer.
Example
Analyzer Settings: 0 - 2.5 GHz Band
FREQUENCY SPAN = 1 GHz
CENTER FREQUENCY = 2 GHz
Note that the equivalent start/stop frequencies are 1.5
GHz and 2.5 GHz.
Now tune to 2.2 GHz.
4 6 A p p e n d i x

8/21/2019 analiz_espctros
http://slidepdf.com/reader/full/analizespctros 521/536
APP EN DI X G CENTER FREQUENCY/SPAN TUNING CHARACTERISTICS
Since the maximum stop frequency in low band is 2.5 GHz, the analyzer will reduce the span by changing the
START FREQ in order to enable the center frequency to be tuned to 2.2. GHz. Hence, the equivalent START/
STOP FREQ is now 1.9 GHz/2.5 GHz, which yields a 600 MHz span. If the CENTER FREQUENCY is tuned to
2.25 GHz, the SPAN will be reduced to 500 MHz, a CENTER FREQUENCY greater than 2.25 GHz will automat-
ically switch the analyzer to the microwave (2 - 22 GHz) band while maintaining a 500 MHz span.
The CENTER FREQUENCY/SPAN TUNING CHART below graphically illustrates the aforementioned tuning
characteristics.
- 1
SPAN > 500 MHz
I I
I
/ 3, 4
0 1 2 2.5
CENTER FREGUENCY GHzl
A p p en d i x 47

8/21/2019 analiz_espctros
http://slidepdf.com/reader/full/analizespctros 522/536
1 ST LO OUTPUT AP PENDIX H
Appendix H
1 ST LO OUTPUT
The 1st LO OUTPUT provides a nominal + 5 dBm signal that is tunable from 2.3214-6.1214 GHz. Since the
HP 8566B is synthesized, the 1st LO can be used as a precise tunable microwave source.
Example
Using the 1st LO OUTPUT as a precision source; connect equipment as shown:
Spectrum Analyzer
Instrument Preset: (ZJ
Select zero span with: (‘“ZY ]0 H z
Offset IF with: B F. This removes the 321.4 MHz IF offset.
By pressing(ii%-], you now have a precision source that can be tuned from 2.3214-6.1214 GHz with 1 Hz
resolution.
Example
Using the 1st LO OUTPUT as a tracking signal source from 2 - 5.8 GHz; connect equipment as shown:
Instrument Preset: @J
+5 d nc 2-6 GHz
BPF
Set START/STOP FREQ: @ 2 GHz, @ 5.8 GHz.
The dynamic range will depend on the conversion loss and isolation characteristics of the mixer. Flatness variations
can be normalized through trace arithmetic.
4 8 A p p e n d i x

8/21/2019 analiz_espctros
http://slidepdf.com/reader/full/analizespctros 523/536
APPENDIX I
Appendix I
OPERATING DIFFERENCES
OPERATING DIFFERENCES
Because of the faster processing speed, the addition of new commands, the slight modification of some oldcommands, and the input buffering capability of the HP 8566B, there are a few minor operating differences
between the HP 8566B and its predecessor, the HP 8566A. If you intend to use the HP 8566A and HP 8566B
interchangeably, become familiar with the following differences.
EXPONENTIAL FORMAT
With the HP 8566B, any command that specifies the display address (e.g., DA, DR, DW), and which is given in
the exponential format (i.e., with notation El, E2 , E3, etc.), executes its prescribed functions as described in this
manual. The HP 8566A, however, interprets the exponential notation as an analyzer command. For example, the
El notation is interpreted as a peak search command, the E2 notation as a marker-into-center-frequency com-
mand, etc.
RESE-lTING THE INPUT BUFFER AND INSTRUMENT PRESET
The HP 8566A does not have an input buffer, and the HP-IB can be reset with an interface clear (IFC) . To reset the
input buffer in the HP 8566B, use a device clear (CLEAR 718). This way, any commands in the input buffer of the
HP 8566B are executed before instrument preset (IP) occurs. However, if device clear (CLEAR 718) is preceded
by interface clear (ABORT 7), an instrument preset (IP) occurs and clears the input buffer immediately. Thus, all
commands in the buffer are lost and not executed.
REMOTE INSTRUMENT PRESET
gxecution of a remote Instrument Preset (IP) causes the HP 8566B merely to preset its controls. The same
command causes the HP 8566A to preset its controls and run a check of its IO bus and memory.
RELOCK
In the HP 8566A, the local oscillator (LO) is phase-locked to the reference oscillator after every data entry. In theHP 8566B, the relock does not occur until the analyzer needs to relock for taking data readings. Because the
relock occurs less often in the HP 8566B than in the HP 8566A, the HP 8566B operates faster than the HP
8566A.
TIMING
The HP 8566B processes data faster than the HP 8566A (see RELOCK, above). Therefore, if you attempt to use
HP 8566A software with the HP 8566B, timing problems may occur.
A p p en d i x 49

8/21/2019 analiz_espctros
http://slidepdf.com/reader/full/analizespctros 524/536
OPERATING DIFFERENCES APPENDIX I
ACTIVE FUNCTION
Occasionally, a two-letter command to the HP 8566B might not activate the specified function. The reason is that
the command mnemonic has been interpreted by the analyzer as the first two letters of a longer command
mnemonic that starts with the same two letters. For example, the command ST for Sweep Time could be inter-
preted by the analyzer as the first two letters of STDEV the command for Standard Deviation. In this situation, theanalyzer simply waits for another character before activating the function. To prevent this problem, insert a space
or a terminator immediately after the two-letter command.
SWEEP + TUNEOUTPUT
The Tuning Algorithm in the HP 8566B causes large pulses to appear at the end of a sweep or at a band crossing.
These pulses do not appear on the HP 8566A.
BAND CROSSING
In the HP 8566A, a band crossing can occur within the last ten display units of a sweep. In the HP 8566B, a band
crossing cannot occur within the last ten display units of a sweep.
SOFTWARE INCOMPATIBILITY
If there are no spaces or semicolons between two-letter commands in HP 8566A software, certain“A” commands
might be misinterpreted by the HP 8566B analyzers.
The following is a list of examples where “A” commands might be misinterpreted by the HP 8566B:
“A” SOFIWARE EXAMPLE
CTAl (Couple Sweeptime, View
Trace A)
CTMTl (Couple Sweeptime, Signal
Track On)
DLEl (Activate Display Line,
Peak SearchGRAT (Graph, Set Attenuator)
PDA4 (Pen Down, Blank Trace A)
PDFA (Pen Down, Start Frequency)
THE1 (Activate Threshold, Peak
Search)
VBOA (Activate Video Bandwidth,
Output Active Function)
5 0 A p p e n d i x
CTA
CTM
DLE
GRAT
PDA
THE
VBO
“B” MISINTERPRETATION
(Convert to dBm)
(Convert to Display Units)
(Enable Display Line)
(Graticule on or off)
(Probability Distribution in
Amplitude)
(Probability Distribution in
Frequency
(Enable Threshold)
(Set Video Bandwidth and Resolution
Bandwidth Ratio)

8/21/2019 analiz_espctros
http://slidepdf.com/reader/full/analizespctros 525/536
APPENDIX I OPERATING DIFFERENCES
Examples that are least likely to occur are GRAT, PDA4, and PDFA because, in these sets of commands, the
second command will not typically follow the first command. However, all examples have the potential to cause
problems, because they don’t follow “B” syntax requirements. The HP 8566B interprets “A” software written like
the above examples as invalid commands. As a result, the commands are not executed and an HP-IB command
error should appear on the analyzer CRT Fortunately, this command error can be used as a method of finding
software errors.
Append ix 5 1

8/21/2019 analiz_espctros
http://slidepdf.com/reader/full/analizespctros 526/536
EQUIVALENT HP 8566B AND HP 8566A COMMANDS APPENDIX J
Appendix J
EQUIVALENT HP 8566B AND 8566A COMMANDS
The following list shows combinations of 8566B commands and secondary keywords that are equivalent to other 8566B commands common to the HP 8566A. The commands are interchangeable when programming the
8566B.
Alphabetical Listing Equivalent Commands Alphabetical Listing Equivalent Command5
of 8566B Commands Common to the 8566A of 8566B Commands Common to the 8566A
AMB ONAMB Off ANNOT ON
ANNOT OFFAPBAUNITS DBMAUNITS DBMVAUNITS DBUVAUNITS VAXBBLANK TRABLANK TRBBLANKTRCBMLBTCBXCCLRW TRACLRW TRBCONTSDET NRMDET SMPDET POSDET NEGDLE OFFEXTMXR FOFFSETGRAT ONGRAT OFF
HNLOCK HNUNLK MKA?
MKCFMKDMKF?
MKMIN
MKNMKNOISE ON
c 2C l
KSP
KSoKScKSAKSBKSCKSDEXA4B4KSkBLKSI
KSi
A lBl
Sl
KSaKSeKSbKSdLO
KSUKSVKSnKSm
KS tKSQMA
E2M3MF
KSNM2
KSM
MKNOISE OFFMKPK MKPK HI
MKPK NHMKRLMKSPMKSSMKSTOPMKTRACK ONMKTRACK OFFML
MOV TRC, TRBMXMH TRAMXMH TRBRCLSROFFSETSAVESSIGIDSNGLSTDF MTDF PTDF BTHE ONTHE OFFTM FREETM LINETM EXTTM VID
VAVGVAVG ONVAVG OFFVIEW TRAVIEW TRBVIEW TRCXCH TRA, TRBXCH TRB, TRC
KSLE lE l
KSK E4KS0
E3KSuMT1
MT0
KS,KSI
E
RCKSZs vKSv
E
0 302 or 04THTO
:;
T3T4
KSGKSGKSHA3B3KSjEXKS i
5 2 A p p e n d i x

8/21/2019 analiz_espctros
http://slidepdf.com/reader/full/analizespctros 527/536
APPENDIX J EQUIVALENT HP 8566B AND HP 8566A COMMANDS
Mphabetical Listing of Alphabetical Listing of
Commands Common Equivalent Equivalent
to the 8566A8566B Command
Commands Common
to the 8566A8566B Command
A lA2A3A4Bl
B2
B3B4BLC lc2EX
E lE2E3E4KSAKSBKSCKSDKSGKSHKSK KSLKSM
KSNKS0
KSQKSUKSVKSZKSaKSbKSc
CLRWTRAM X M H T R A
VIEWTRABLANKTRACLRWTRBMXMHTRBVIEWTRBBLANKTRBBMLAMBOFFAMBONXCHTRA,TRBorAXB
MKPKorMKPKHIMKCFMKSSMKRLAUNITSDBMAIJNITSDBMVAUNITSDBUVAUNITSVVAVGorVAVGONVAVGOFFMKPKNHMKNOISEOFFMKNOISEONMKMINMKSPHNUNLK EXTMXR FOFFSETROFFSETDETNRMDETPOSAPB
KSdKSeKSiKSjKSkKSI
KSmKSnKSo
KSPKStKSu
KSvKS,LO
MAMF
MT0MT1M2M30 10 302or04
RC
Sls2s vTHTOTlT2T3T4
DETNEGDETSMPXCHTRB,TRCorBXCVIEWTRCBLANKTRCBTCorMOVTRC,TRE
GRATOFFGRATONANNOTOFFANNOTONHNLOCK MKSTOP
SIGIDML
DLEOFFMKA?MKF?
MKTRACKOFFMKTRACKONMKN
MKDTDFMTDFPTDFBRCLS
CONTSSNGLSSAVESTHEON
THEOFF
TMFREETMLINETMEXTTMVID
A p p en d i x 53

8/21/2019 analiz_espctros
http://slidepdf.com/reader/full/analizespctros 528/536
SectionINDEX

8/21/2019 analiz_espctros
http://slidepdf.com/reader/full/analizespctros 529/536

8/21/2019 analiz_espctros
http://slidepdf.com/reader/full/analizespctros 530/536

8/21/2019 analiz_espctros
http://slidepdf.com/reader/full/analizespctros 531/536

8/21/2019 analiz_espctros
http://slidepdf.com/reader/full/analizespctros 532/536

8/21/2019 analiz_espctros
http://slidepdf.com/reader/full/analizespctros 533/536

8/21/2019 analiz_espctros
http://slidepdf.com/reader/full/analizespctros 534/536

8/21/2019 analiz_espctros
http://slidepdf.com/reader/full/analizespctros 535/536
priority, 42store mode, 37 - 39transfer trace B to C (KSI) ,99VIEW, 35,36,37write modes, 36,37
Traces, 31- 32TRDEE 341
TRDSP 342TRGRPH, 343Trigger, 79,80 - 81
automatic, zero span, 80EXT (external), 80, 103FREE RUN, 79LINE, 79VIDEO, 79,103VIDEO LEVEL, 81
TRMATH, 344 - 345TRPST, 346TRSTAT, 347TS, 348
Tuning curves, App. FTWNDOW, 349TPI, 350Tl, 351T2,352T3,353
T4,354
V
VARDEE 359VARIANCE, 360VAVG, 361VB, 362VBO, 363
Vector, 32Video
averaging (KSG, KSH), 72,101- 103 bandwidth (VIDEO BW), 71- 72connectors, 8,9
INP connector, 9OUT connector, 9trigger, 79, 103trigger level, 81
VIEW, 36,37,364Voltage scale (LINEAR), 63VoIts (KSD), 93
W
WRITE modes, 36
Xu
XCH, 365Uncoupled functions, 13Units, 93
(KSA, KSB, KSC, KSD)Unlock SAVE registers (KS)), 103UNTIL, REPEAT 355 - 356UR, 357User-defined keys, 109USTATE, 358
Z
Zero frequency span, 23,80Zero span, automatic trigger, 80Zoom, automatic, zero span, 51,52
Zoom to marker, 48
NOTE: Page numbers in regular typeface refer to Section I, Manual Operation. Page numbers in bold typeface refer to
Section II, Programming.
I n d e x 7

8/21/2019 analiz_espctros
http://slidepdf.com/reader/full/analizespctros 536/536
HEWLETT-PACKARD SALES AND SERVICE OFFICES
To obtain servicing information or to order replacement parts, contact the nearest Hewlett-PackardSales and Service Office listed in the HP Catalog, or contact the nearest regional office listed below:
IN THE UNITED STATES
CALIFORNIAPO. Box 4230
1421 South Manhattan AvenueFullerton 9263 1
IN GERMAN FEDERAL REPUBLIC
Hewlett-Packard GmbHVertriebszentrale Frankfurt
Berner Strasse 117Postfach 560 140