analyses of specialty alaska seafood products of specialty alaska seafood products mcdowell group,...
TRANSCRIPT
Analyses of Specialty Alaska Seafood Products
Prepared for:
Alaska Seafood Marketing Institute
November 2017

Analyses of Specialty Alaska Seafood Products
Prepared for:
Alaska Seafood Marketing Institute
Prepared by:
November 2017
McDowell Group Anchorage Office 1400 W. Benson Blvd., Suite 510 Anchorage, Alaska 99503
McDowell Group Juneau Office 9360 Glacier Highway, Suite 201 Juneau, Alaska 99801
Website: www.mcdowellgroup.net
Table of Contents
Executive Summary ....................................................................................................................... 1 Introduction & Methodology ...................................................................................................... 5 Fish Heads ...................................................................................................................................... 6 Internal Organs ............................................................................................................................ 16 Fishmeal and Fish Oil .................................................................................................................. 19 Roe Products ................................................................................................................................ 34 Arrowtooth Flounder .................................................................................................................. 67 Skates ........................................................................................................................................... 87 Specialty Product Challenges and Opportunities .................................................................... 93 Appendix .................................................................................................................................... 100
List of Tables
Table 1. Summary of Alaska Seafood Specialty Products and Selected Low-Value Species .......................................... 4 Table 2. Fish Head Production, 5 Year Average, 2011-2015 ....................................................................................................... 6 Table 3. Fish Head Seasonal Availability by Key Species .............................................................................................................. 8 Table 4. Potential Production of Fish Heads, in Million lbs., 2011-2015 ................................................................................ 8 Table 5. Fish Head Availability by Key Region .................................................................................................................................. 9 Table 6. First Wholesale Price Range of Frozen Alaska Fish Heads, FOB Alaska, 2011-2015 ....................................... 12 Table 7. Potential Value of Selling All Fish Heads from Selected Alaska Species ............................................................. 12 Table 8. Alaska Fishmeal and Oil Production, in Metric Tons, 2011-2016 ........................................................................... 20 Table 9. Estimated Amount of Round Weight Utilized by Fishmeal Production, 2015 .................................................. 20 Table 10. Value/MT of Alaska Pollock Fish Oil Used as Fuel Depending on Diesel Prices ............................................ 22 Table 11. Alaska Fishmeal and Oil First Wholesale Value, in $000s, 2011-2015 ............................................................... 23 Table 12. Alaska Fishmeal and Oil First Wholesale Value per Metric Ton, 2011-2015 ................................................... 23 Table 13. Alaska Fishmeal and Oil, Pct. of Production and Value, 2011-2015 ................................................................... 25 Table 14. Retail Products Containing Alaska Meal/Oil ................................................................................................................ 31 Table 15. Alaska Pollock Roe Production and Value, 2005-2016 ............................................................................................ 35 Table 16. Alaska Cod Roe Production and Value, 2011-2016 .................................................................................................. 35 Table 17. Alaska Herring Roe Production and Value, 2005-2016 ........................................................................................... 36 Table 18. Alaska Salmon Roe Production and Value, 2005-2016 ........................................................................................... 36 Table 19. Alaska Pink Salmon Roe Production and Value, 2005-2016 ................................................................................. 37 Table 20. Alaska Chum Salmon Roe Production and Value, 2005-2016 .............................................................................. 37 Table 21. Alaska Sockeye Salmon Roe Production and Value, 2005-2016 ......................................................................... 38 Table 22. World Production of Selected Roe-Bearing Species, in Metric Tons, 2010-2016 ......................................... 38 Table 23. Frozen Pollock Roe Imports by Japan and South Korea from U.S. and Russia, 2006-2016 ...................... 39 Table 24. Sales Volume, Value, and Average Prices at Japan’s Tsukiji Wholesale Fish Market, 2010-2016 ........... 43 Table 25. Estimated Wholesale Value of Alaska Roe Oil ............................................................................................................. 45 Table 26. Alaska Crab Harvests, in Million Lbs. and $Million, 2011-2015 ............................................................................ 51 Table 27. Total Allowable Catch in Selected Bering Sea Crab Fisheries, 2016/2017 ....................................................... 52 Table 28. Production of Alaska Crab Species, in Million Lbs. and $Million, 2011-2015 ................................................. 52 Table 29. Average Wholesale Value of Crab, by Species ............................................................................................................ 53 Table 30. Crab Shell Potential Volume and Value, 2011-2015 ................................................................................................. 55 Table 31. Global Supply of Chitin-Producing Species, in MT, 2011-2015 ........................................................................... 56 Table 32. King Crab Tail Volume and Potential Value, 2011-2015 ......................................................................................... 58 Table 33. Alaska Herring Harvest and Wholesale Production, 2011-2015 .......................................................................... 60 Table 34. 2015 Commercial Herring Seasons by Major Production Area ............................................................................ 62 Table 35. Pacific Herring Nutrition ...................................................................................................................................................... 62 Table 36. Potential Additional First Wholesale Value from Togiak Herring Fillets ........................................................... 64 Table 37. U.S. Herring Imports, in MT and $Millions, 2010-2014 ............................................................................................ 64
Table 38. World Herring Production, in MT, 2010-2014 ............................................................................................................. 66 Table 39. BSAI and GOA Arrowtooth Flounder TAC and Biomass, 2006-2016 .................................................................. 67 Table 40. Gulf of Alaska Arrowtooth Flounder TAC and Biomass, 2006-2016 ................................................................... 68 Table 41. BSAI Arrowtooth Flounder TAC and Biomass, 2006-2016...................................................................................... 68 Table 42. Alaska and U.S. Arrowtooth Flounder Harvest, in Metric Tons, 2011-2015..................................................... 69 Table 43. Alaska Arrowtooth Flounder Production Volume and First Wholesale Value, 2011-2015 ........................ 69 Table 44. Arrowtooth Flounder Yield Rates ..................................................................................................................................... 71 Table 45. Top Export Destinations of Alaska Flounder, in Metric Tons, 2011-2015 ........................................................ 72 Table 46. Global Production of Arrowtooth Flounder, in Metric Tons, 2010-2014 .......................................................... 73 Table 47. Comparison of Arrowtooth Flounder and Pacific Halibut Biomass, 1996-2016 ............................................ 74 Table 48. Potential First Wholesale Value from Increasing Arrowtooth Flounder Harvests ......................................... 77 Table 49. Alaska Dogfish Harvest, in Metric Tons, 2011-2015 ................................................................................................. 81 Table 50. Global Production of Dogfish, in Metric Tons, 2010-2014 ..................................................................................... 83 Table 51. Exports of U.S. Dogfish by Region, in Metric Tons, 2011-2015 ............................................................................ 84 Table 52. Potential Dogfish Value ........................................................................................................................................................ 86 Table 53. Current Skate Harvest, in Metric Tons, 2011-2015 .................................................................................................... 87 Table 54. Alaska Skate Production Volume and Value, 2011-2015 ........................................................................................ 88 Table 55. Skate Wing Nutrition ............................................................................................................................................................. 89 Table 56. Global Production of Skates and Rays, in Metric Tons, 2010-2014 .................................................................... 90 Table 57. Top Exports of U.S. Skates by Region, in Metric Tons, 2012-2015...................................................................... 91 Table 58. Estimated Shipping Costs for Frozen Product .......................................................................................................... 100
List of Figures
Figure 1. Composition of Fish Oil Production in Alaska, in Metric Tons, 2015 .................................................................. 21 Figure 2. Fishmeal and Oil Production Process .............................................................................................................................. 26 Figure 3. Alaska Fishmeal & Pet Food Paste Supply Chain........................................................................................................ 27 Figure 4. Global Fishmeal Use by Sector, 2010 ............................................................................................................................... 29 Figure 5. Global Fish Oil Use by Sector, 2010 ................................................................................................................................. 29 Figure 6. First Wholesale Value of Key Alaska Roe Products, 2005-2015 ............................................................................ 41 Figure 7. Average First Wholesale Roe Value by Species, in $Millions, 2011-2015 Average ....................................... 41 Figure 8. Top Crab Processing Regions, by Volume ..................................................................................................................... 53 Figure 9. Crab Shell Supply Chain ........................................................................................................................................................ 55 Figure 10. Crab Tail Meat Supply Chain ............................................................................................................................................ 58 Figure 11. Togiak Sac Roe Herring Fishery Volume and Value, 1995-2015 ........................................................................ 61 Figure 12. Alaska Herring Supply Chain ............................................................................................................................................ 63 Figure 13. Arrowtooth Flounder Supply Chain ............................................................................................................................... 72 Figure 14. Dogfish Supply Chain .......................................................................................................................................................... 83 Figure 15. Skate Supply Chain ............................................................................................................................................................... 90
This project benefitted greatly from the experience of industry professionals and government researchers. The insights
presented here would not have been possible without their support. In addition to everyone who has published research on
specialty product innovation, ASMI and McDowell Group would like to thank the following people and companies for their
input and support on this project: Peter Bechtel (USDA), Gleyn Bledsoe (WA State Univ.), Tommy Buzbee (Dalian Yingjie
Foods), Joel Cowger (Aleutian Proteins), Keith Criddle (UAF), Julie Decker (AFDF), Anne DiFiore (TerraMar Ingredients), Chris
Dorff (Olsen Fish Company), Richard Draves (American Seafoods), Thomas Farrugia (UAF), Quentin Fong (UAF), John Gardner
(North Pacific Seafoods), Jason Gaspar (NMFS), John Gauvin (Alaska Seafood Cooperative), William Guo (Qingdao Fortune
Seafoods), Brian Himelbloom (UAF), Brandii Holmdahl (Icicle Seafoods), Senya Joerss (Trident Seafoods), Craig Kasberg (Tidal
Vision), Gordon Kruse (UAF), Emile Lane (Trident Seafoods), Scott Lehouiller (Peterson Company), Warner Lew (Icicle
Seafoods), Charles McEldowney (Icicle Seafoods), Gregg Morrow (US Seafoods), Ocean Beauty Seafoods, Frank O’Hara III
(O’Hara Corporation), Shigeki Okano (Silver Bay Seafoods), Alex Oliveira (BluWrap), Dean Pugh (Peter Pan Seafoods), Chris
Riley (Trident Seafoods), James Riley (Trident Seafoods), Chris Sannito (UAF), Bruce Schactler (ASMI), Jennifer Shriver
(ADF&G), Ingrid Spies (NOAA), Ian Stewart (IPHC), Ken Tameishi (Trident Seafoods), and Cheryl Warpinski.

Analyses of Specialty Alaska Seafood Products McDowell Group, Inc. Page 1
Executive Summary
The Alaska Seafood Marketing Institute (ASMI) commissioned McDowell Group to compile reference
information and identify development challenges/opportunities for specialty seafood products from Alaska. The
scope of this project was intentionally broad, covering 10 low-value species and specialty (ancillary) product
categories. Categories were selected based on their potential as an ancillary product form that could utilize
current waste streams, or because the species currently produces low values but could be harvested in greater
quantities.
This report is intended to serve as a resource document for ASMI, industry, economic development
professionals, and fishery managers. Key takeaways from each species/product are provided below:
FISH HEADS
• Alaska produces an estimated 1 billion pounds of fish heads per year. Heads likely account for the
majority of processing waste created by Alaska commercial fisheries.
• Some fish heads are used in meal/oil production, and approximately 1 percent are sold as frozen heads.
The volume of heads discharged each year is unknown, but represents a substantial amount of raw
material.
• Export markets for frozen fish heads exist, but markets tend to be relatively limited in size and most
favor cod/salmon heads from approximately 10-lb. fish. Depending on the species, fish heads can be
used to produce fishmeal and oil. However, not all species carry much oil in the head area and since
heads contain a high percentage of bone, meal, and hydrolysate products tend to have higher ash
percentages (which greatly reduces value).
FISHMEAL & OIL
• Alaska processors produce approximately 70,000 metric tons (MT) of fishmeal and 90,000 MT of fish oil.
Most large fishing ports in Alaska have meal/oil facilities, but collectively there is much meal/oil which
could be produced from smaller ports (and/or those with more seasonal landings). However, industry
experts believe meal/oil production is near its feasible limit in Alaska. Increasing the number of meal/oil
plants will probably require a change in investment/operational costs, technology, raw material supply,
or product value.
• The pet food sector shows promise as a market for Alaska fishmeal and other products derived from
waste streams as the Alaska seafood brand resonates strongly with consumers and provides a point of
differentiation for pet food manufacturers.
• The majority of fish oil produced in Alaska is burned as a diesel fuel substitute or sold into lower value
commodity markets. Supplement grade fish oil commands much higher prices and the value of Alaska
seafood resources could be increased by successfully selling more oil into the supplement market.

Analyses of Specialty Alaska Seafood Products McDowell Group, Inc. Page 2
ROE PRODUCTS
• Alaska faces many challenges in key roe markets, including: a strong U.S. dollar, changing eating
patterns in core Asian markets, access to Russia, competition from Russian producers, oversupplied
markets, and inherent variability in Alaska roe supply and quality. Roe is a critical product for the
industry, but its value has generally been in decline over the past decade.
• Increasing the value of Alaska roe products will require the industry to do one or both of the following:
o Develop alternative markets for traditional roe products, either in existing or new markets
o Develop new roe products or find new markets that make use of low to medium grade roe,
such as roe oil products.
INTERNAL ORGANS
• Internal organs are usually discharged or used as raw material for fish meal/oil production. Cod and
pollock livers are especially high in valuable omega-3 fatty acids. Niche markets also exist for cod milt
and stomachs.
SPECIALTY CRAB PRODUCTS
• Alaska’s crab fisheries produce an average of 10.6 million lbs. of crab shells. Crab and other arthropods
shells contain chitin, a relatively valuable material used in a variety of industries. Until recently, shells
were typically discarded but that is changing as Tidal Vision has plans to scale up chitin and chitosan
production using waste crab shells from Alaska fisheries.
HERRING FILLETS
• Male herring are essentially a by-product of Alaska’s sac roe fisheries, but larger fish from the Togiak
fishery could be used to produce a herring fillet product; up to an estimated 10 million lbs. is available
for that purpose.
• Alaska herring promotions in the Pacific Northwest have been successful. Competing on fillet quality
with other global herring producers who target fish well before spawning is challenging for Alaska, but
the regional allure of Alaska herring may connect with “foodie” consumers on the West Coast.
ARROWTOOTH FLOUNDER
• Arrowtooth flounder look similar to Pacific halibut and live in similar habitats, but whereas halibut flesh
is sweet and dense, Arrowtooth meat often contains an enzyme that results in very soft, poor fillet
quality. As a result, Arrowtooth flounder is one of Alaska’s lowest priced commercial species, whereas
halibut is one of the most valuable.
• Arrowtooth and halibut compete for habitat and food and the imbalance in their populations have
shifted dramatically over the past 20 years. In 1996, there was 3.1 metric tons of Arrowtooth/Kamchatka
flounder for each metric ton of exploitable Alaska halibut biomass. That figure increased nearly 250
percent to 10.7 metric tons by 2017, as Arrowtooth populations continued to rise and halibut
populations declined.
• A concerted effort to significantly increase Arrowtooth harvests, while minimizing halibut bycatch
mortality, could increase the value of Arrowtooth and provide better growth prospects for halibut
populations.
Analyses of Specialty Alaska Seafood Products McDowell Group, Inc. Page 3
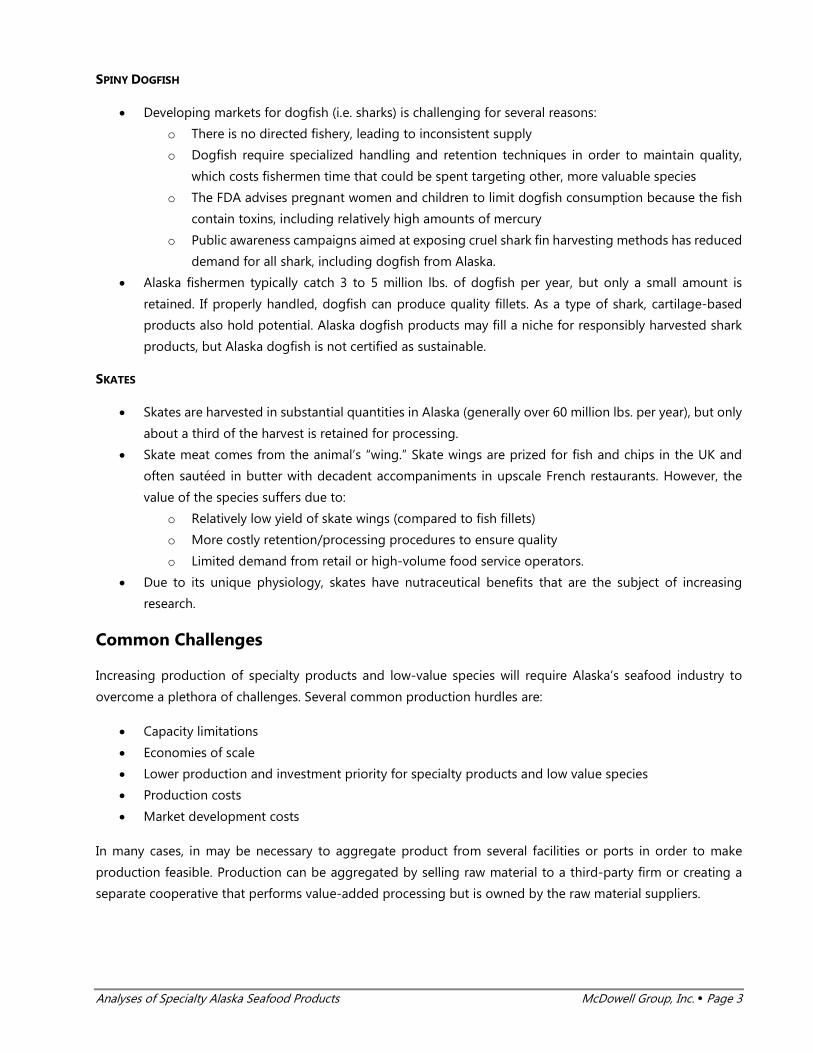
SPINY DOGFISH
• Developing markets for dogfish (i.e. sharks) is challenging for several reasons:
o There is no directed fishery, leading to inconsistent supply
o Dogfish require specialized handling and retention techniques in order to maintain quality,
which costs fishermen time that could be spent targeting other, more valuable species
o The FDA advises pregnant women and children to limit dogfish consumption because the fish
contain toxins, including relatively high amounts of mercury
o Public awareness campaigns aimed at exposing cruel shark fin harvesting methods has reduced
demand for all shark, including dogfish from Alaska.
• Alaska fishermen typically catch 3 to 5 million lbs. of dogfish per year, but only a small amount is
retained. If properly handled, dogfish can produce quality fillets. As a type of shark, cartilage-based
products also hold potential. Alaska dogfish products may fill a niche for responsibly harvested shark
products, but Alaska dogfish is not certified as sustainable.
SKATES
• Skates are harvested in substantial quantities in Alaska (generally over 60 million lbs. per year), but only
about a third of the harvest is retained for processing.
• Skate meat comes from the animal’s “wing.” Skate wings are prized for fish and chips in the UK and
often sautéed in butter with decadent accompaniments in upscale French restaurants. However, the
value of the species suffers due to:
o Relatively low yield of skate wings (compared to fish fillets)
o More costly retention/processing procedures to ensure quality
o Limited demand from retail or high-volume food service operators.
• Due to its unique physiology, skates have nutraceutical benefits that are the subject of increasing
research.
Common Challenges
Increasing production of specialty products and low-value species will require Alaska’s seafood industry to
overcome a plethora of challenges. Several common production hurdles are:
• Capacity limitations
• Economies of scale
• Lower production and investment priority for specialty products and low value species
• Production costs
• Market development costs
In many cases, in may be necessary to aggregate product from several facilities or ports in order to make
production feasible. Production can be aggregated by selling raw material to a third-party firm or creating a
separate cooperative that performs value-added processing but is owned by the raw material suppliers.

Analyses of Specialty Alaska Seafood Products McDowell Group, Inc. Page 4
Table 1. Summary of Alaska Seafood Specialty Products and Selected Low-Value Species
Potential for Increased
Total Value
Species/ Product Challenges Opportunities
Alaska Supply (Million Lbs.) First Wholesale Value
(2011-2015 Avg., $Millions) 2011-2015
Avg. Potential
Highest Fish Oil - Refining product to supplement grade - Accessing new markets
- Supplement market offers much higher value - Significant supply
54 201 $30
Roe
- Oversupply of some species and stagnant demand in key markets - Variable production and quality
- New products in traditional markets - U.S. & Europe - Roe oil
40 N/A $413
Fishmeal & Bonemeal
- Creating economies of scale for new production - Commodity product
- Pet food market - Soil remediation - Large potential supply
142 N/A $108
Skates
- More difficult to retain and process with quality - Competing supply - Mostly bycatch species
- Niche markets - Great product if high quality, need more consumption
21
(Total Retained)
69
(Total Catch)
$7
Arrowtooth Flounder
- Low quality meat - Halibut bycatch limits harvest potential
- Huge biomass in Alaska - Harvesting more AF is good for halibut - Meal/oil/engawa focus
81 661 $26
Fish Heads
- Limited market, size/species dependent - Processing costs for higher value products - Freezing capacity
- Large available supply - Pet food producers - Asia/Africa as frozen or dried product - Meal/oil production, particularly salmon
10 1,002 $6
Crab Shells - Shipping costs - Competing with low cost Asian shrimp shells
- Specialized chitin products/markets - Product of U.S.A.
N/A 11 N/A
Herring Fillets
- Processing costs and seasonality of fishery - Sac roe fishery produces softer meat - Competing supply
- Significant potential supply (i.e. males) - Regional demand for herring fillets on West Coast
Several thousand
lbs. $10 N/A
Crab Tails - Supply limited to king crab - Added processing costs
- High crab prices creates better market for tails N/A 0.3 N/A
Internal Organs
- Limited markets - Synthetic enzyme reproduction
- Livers for oil - Large available supply - Cod milt
N/A 699 N/A
Lowest Dogfish - No directed fishery - Toxins/mercury
- Potential substitute for shark products from irresponsible fisheries
0.3 3.0 N/A
Future Research Suggestions
In addition to research suggestions specific to product/species, this project identified several topics/issues which
could benefit from further research, including:
• Comprehensive yield database and raw material analysis
• Development of a directory of potential buyers
• Assessment of marketing Alaska seafood produced by foreign, value-added processors

Analyses of Specialty Alaska Seafood Products McDowell Group, Inc. Page 5
Introduction & Methodology
Study Approach
This project summarizes available research and supply chain information about Alaska specialty products and
low value species. It is intended to serve as a reference document for ASMI, industry, buyers, and economic
development professionals.
The report consists of nine chapters summarizing information about selected Alaska seafood products, as well
as a chapter discussing common challenges and future research needs. The specialty products and species
covered in this report where chosen based on their potential for increased production and/or value. The project
began in late 2016 and ended in April 2017.
Methodology
A primary goal of this project was to compile relevant information from throughout the supply chain and
amongst many disparate data sources into a single document for a range of Alaska specialty products and low
value species.
McDowell Group interviewed a broad range of people for this project, including harvesters, processors, buyers,
fishery managers, and independent researchers. Interviews were supplemented with production volume/value
statistics from fishery management agencies. Trade data and wholesale market data was also utilized whenever
possible. The study team reviewed specialized research publications and incorporated the findings about the
feasibility of product/market development into the document.
Analyses of Specialty Alaska Seafood Products McDowell Group, Inc. Page 6
Fish Heads
Key Takeaways
• Alaska’s fisheries produce approximately one billion pounds of fish heads each year, but only about one
percent are sold to wholesale buyers as fish heads. Most fish heads are used in fishmeal and/or oil
production, or ground up and either discharged as waste or sold to pet food manufacturers.
• Fish heads likely account for the majority of waste created by Alaska fisheries. Increasing fish head
utilization, for use in any product form, may represent the largest opportunity to turn waste into
revenue.
Production Volume and Value
Fish heads are a versatile by-product available nearly year-round. They are high in nutrition and rich flavor and
many consumers around the world use dried and frozen heads in soups or simply cook them for consumption.
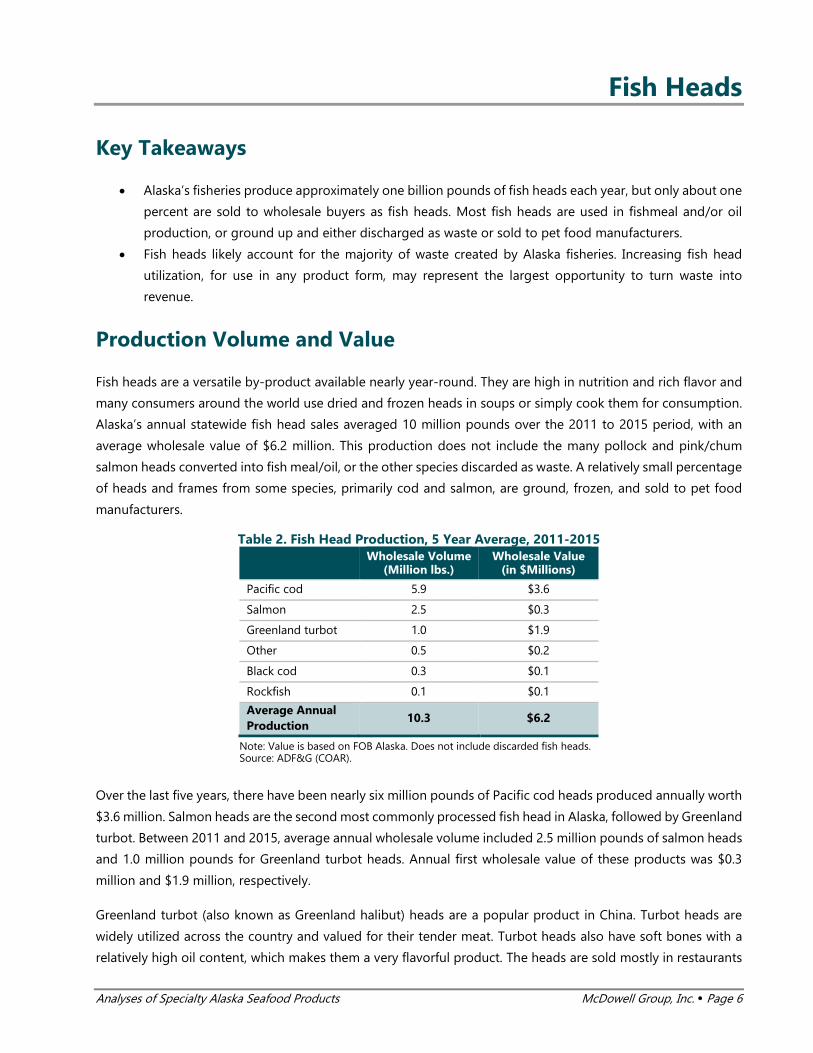
Alaska’s annual statewide fish head sales averaged 10 million pounds over the 2011 to 2015 period, with an
average wholesale value of $6.2 million. This production does not include the many pollock and pink/chum
salmon heads converted into fish meal/oil, or the other species discarded as waste. A relatively small percentage
of heads and frames from some species, primarily cod and salmon, are ground, frozen, and sold to pet food
manufacturers.
Table 2. Fish Head Production, 5 Year Average, 2011-2015 Wholesale Volume
(Million lbs.) Wholesale Value
(in $Millions)
Pacific cod 5.9 $3.6
Salmon 2.5 $0.3
Greenland turbot 1.0 $1.9
Other 0.5 $0.2
Black cod 0.3 $0.1
Rockfish 0.1 $0.1
Average Annual Production
10.3 $6.2
Note: Value is based on FOB Alaska. Does not include discarded fish heads. Source: ADF&G (COAR).
Over the last five years, there have been nearly six million pounds of Pacific cod heads produced annually worth
$3.6 million. Salmon heads are the second most commonly processed fish head in Alaska, followed by Greenland
turbot. Between 2011 and 2015, average annual wholesale volume included 2.5 million pounds of salmon heads
and 1.0 million pounds for Greenland turbot heads. Annual first wholesale value of these products was $0.3
million and $1.9 million, respectively.
Greenland turbot (also known as Greenland halibut) heads are a popular product in China. Turbot heads are
widely utilized across the country and valued for their tender meat. Turbot heads also have soft bones with a
relatively high oil content, which makes them a very flavorful product. The heads are sold mostly in restaurants
Analyses of Specialty Alaska Seafood Products McDowell Group, Inc. Page 7
and some higher-end supermarkets. They are often prepared by cooking in a wok with spices or as
protein/flavor source in soups.
Production Practices
As fish moves through the processing line, it is headed and gutted, with head and entrails discarded. Depending
on the freezer capacity and the types of fish heads that have markets, additional processing is required to make
fish heads a saleable product. After a vigorous rinse and gill removal, the heads are placed into a plate freezer.
General cod head production does not have a size requirement, although larger sizes are preferred. Korean
buyers require the gills be removed and the residual backbone chopped by a specialized mini-cleaver. Most
processors retain Greenland turbot heads for additional value from Chinese markets, as they fetch a higher price
than most other Alaska fish heads. Retained salmon heads generally come from fish larger than 10 pounds,
which is problematic as most salmon caught in Alaska are smaller than 10 pounds. Only Chinook average over
10 pounds, though some coho and chum salmon do exceed 10 pounds.
Heads are used for a variety of products fit for human consumption, as well as animal feed and fertilizer. Pet
food material usually goes through a grinding and drying process and is either frozen or chilled as raw material
for pet food manufacturers.
In processing facilities that lack a meal and oil plant, heads are usually discarded with other by-products due to
constraints from limited freezer capacity and/or or insufficient market prices to support processing and
transportation of heads. Processing facilities with meal plants convert heads, frames, and other fish parts into
fish meal, as well as oil in many cases. On average, a shoreside plant without fish meal technology could discard
over 25 percent of its round weight volume, totaling hundreds of millions of pounds statewide. A large portion
of this waste consists of fish heads.
Seasonal Availability & Suppliers
Fish heads are available year-round but there is seasonal variability by species. Groundfish (Pollock, Pacific cod,
flatfish, Atka mackerel and rockfish) are available nearly year-round. Halibut and black cod heads typically are
available for a nine-month fishing season from March through November, but most of the fishing occurs in the
first half of the season.
Salmon heads are abundant during the peak summer and fall harvest seasons. There is fishing for king salmon
in the winter and spring, but the supply is low. Pink and chum salmon heads have relatively high oil content and
are caught in larger volumes than coho and Chinook, so they are readily used for fish oil extraction in places
with necessary production facilities.
See table on following page.

Analyses of Specialty Alaska Seafood Products McDowell Group, Inc. Page 8
Table 3. Fish Head Seasonal Availability by Key Species Spring Summer Fall Winter
Atka mackerel
Black cod
Chum salmon
Coho salmon
Flatfish
Halibut
King salmon
Pacific cod
Pink salmon
Pollock
Rockfish
Sockeye salmon
Source: North Pacific Seafoods.
There are several at-sea catcher processors that fish nearly year-round for groundfish. Since there is limited
freezer capacity onboard, these vessels typically grind fish heads and discard them at sea. Some larger catcher-
processors have on-board fish meal plants to capture additional value; virtually all these boats utilize pollock as
the primary raw material.
Resource Potential of Fish Heads
Across the state, over 36 percent of seafood volume harvested was sold in first wholesale as head and gut
(H&G). The average round weight harvest of key species in the last five years (2011-2015) was 5.6 billion pounds.
Approximately 0.2 percent (10.3 million lbs.) was processed and sold as whole fish heads.1 Over 1 billion pounds
of fish heads are potentially available for value-added products (see Table 4).
Table 4. Potential Production of Fish Heads, in Million lbs., 2011-2015 Total Harvest (Million lbs.)
Major Species Head Yield% 2011 2012 2013 2014 2015
Avg. Harvest Volume
Avg. Potential
Heads Available
Pollock 17% 2,826.1 2,888.5 3,020.6 3,180.9 3,286.6 3,040.5 516.9
Cod 18% 673.1 725.1 703.0 736.8 707.9 709.2 127.7
Flatfish 19% 720.7 707.0 729.9 713.3 542.0 682.6 129.7
Pink salmon 18% 390.5 246.3 678.6 324.5 631.5 454.3 81.8
Sockeye salmon 18% 239.2 211.6 178.4 241.8 288.0 231.8 41.7
Rockfish 26% 113.1 122.3 131.9 143.0 151.4 132.3 34.4
Chum salmon 15% 111.4 150.7 150.1 92.4 129.0 126.7 19.0
Atka mackerel 19% 117.8 108.1 53.9 70.5 120.1 94.1 17.9
1 McDowell Group estimates based on SAFE, ADFG (COAR) data.

Analyses of Specialty Alaska Seafood Products McDowell Group, Inc. Page 9
Other 19% 81.2 83.1 100.9 98.6 100.5 92.9 17.6
Black cod 24% 30.2 32.2 32.0 27.0 25.8 29.4 7.1
Coho salmon 17% 20.0 17.9 33.7 41.8 22.7 27.2 4.6
Halibut 16% 30.5 23.4 22.0 15.3 15.5 21.3 3.4
King salmon 16% 5.6 5.7 3.8 5.3 5.5 5.2 0.8
Total 19% 5,359.4 5,322.0 5,838.8 5,691.3 6,026.5 5,647.6 1,001.8
Note: Flatfish includes sole species, flounder species, and Greenland turbot. Source: ADFG (COAR), NMFS SAFE, and McDowell Group estimates.
Major Production Areas
Most salmon species are available across the state, but only during summer and fall months. Groundfish are
typically available year-round, but with the highest concentration is in Western and Central Alaska.
Table 5. Fish Head Availability by Key Region
West (Bristol
Bay, Bering Sea, Aleutian Chain)
Central (Kodiak, Cook Inlet, Prince William Sound)
Southeast (Yakutat to Ketchikan)
Atka mackerel
Black cod
Chum salmon
Coho salmon
Flatfish
Halibut
King salmon
Pacific Cod
Pink salmon
Pollock
Rockfish
Sockeye salmon
Source: North Pacific Seafoods.
Fish Head Utilization
Fish heads from Alaska commercial fisheries are generally handled in one of four ways: processed in fish meal/oil
plants, sold to pet food manufacturers, sold in fish head export markets, or ground up and discharged.
Pollock accounted for 54 percent of Alaska’s total commercial seafood harvest volume in 2014/2015. Most
pollock heads are used as raw material for fishmeal and fish oil, but smaller shoreside plants and at-sea
processing vessels do not have meal/oil capabilities and therefore discard the heads and viscera. For pollock
byproducts, meal/oil is currently the most profitable product form and producers have invested substantially in
meal/oil plants. It is unlikely that other fish head markets will offer the scale of demand and prices needed to
shift production away from meal/oil in the near future.
Alaska’s harvest of non-pollock fish species totals between two and three billion pounds per year - leaving a
significant supply of heads for potential use. Most of Alaska’s largest ports have fishmeal and/or oil plants;
however, many do not. Fish head buyers might find supplies from many fisheries around the state, but especially

Analyses of Specialty Alaska Seafood Products McDowell Group, Inc. Page 10
those areas where fish heads are currently being ground and discharged. Please refer to the fish meal/oil profile
for more information about meal/oil production in Alaska.
Fish heads and other fish parts left over after primary processing can also be used to create frozen blocks of
fish paste or chunks for use in pet food, other animal feeds, or organic fertilizers. High-end pet food products
are an appealing market, as consumers and manufacturers recognize the benefits of ingredients derived from
Alaska seafood. The pet food market is large, but secures most of its protein from terrestrial sources. The top
seven pet food companies in the United States have combined revenues of $38 billion.2 Most of these sales
come from dog and cat food. The dog treat market is estimated at $8 billion.3 Alaska fish heads and other fish
meat products can be a marketable ingredient for pet food manufacturers. A list of pet food manufacturers is
provided at the end of this profile.
Production Opportunities and Challenges
The Alaska seafood industry discharges substantial volumes of seafood waste and fish heads account for a large
portion of fish waste. This represents a potential opportunity for both buyers and suppliers. Outside of fish head
and fish oil markets, there are other promising markets, which are not well developed, such as collagen,
peptides/nutraceuticals, food additives, fertilizers, and animal food hydrolysates. Alaska’s vast source of fish
waste means these products could be produced in mass quantities.
While Alaska’s marketing cache and abundant, sustainable seafood resources provide opportunities, there are
challenges facing product development ventures. Production costs, storage capacity, and transportation costs
all plague specialty products like fish heads because of the relatively low values. Both fishmeal and pet food
production represent industrial-scale ways to extract value from a resource that would otherwise be dumped
back into the ocean. For most of the resource, however, processors cannot currently generate enough revenue
for fish heads to cover the costs of additional labor, machinery, freezer capacity, transportation, and marketing.
A key challenge is Alaska’s relatively remote location. Most of Alaska’s fishing ports are not accessible by road
and are located far from larger population centers. This means most product must be shipped as frozen product
over long distances via barge or container ship, which adds cost. This is especially important to consider for
products that have low yields or lower value as a finished product. Energy and labor costs can also be significant
hurdles to development. Finally, there can be production constraints. Many fisheries are seasonal and
production volumes can vary widely from day to day. Freezing, processing, storage, and labor must be allocated
within each plant to maximize the daily value of production. In some cases, this means that there is not enough
capacity available to pack/freeze fish heads or run them through secondary processing lines on site.
While there are fundamental challenges associated with increasing fish head utilization and production values,
several suppliers of Alaskan product have demonstrated that profitable utilization of the resource is possible.
2 http://www.petfoodindustry.com/articles/6054-top-10-us-based-pet-food-companies?v=preview 3 Personal communication with industry contact.
Analyses of Specialty Alaska Seafood Products McDowell Group, Inc. Page 11
These suppliers (listed at the end of this profile) will be in the best position to address production challenges
unique to specific areas or fisheries.
Markets and Uses
Fish heads that are not discarded or transformed into other products are usually sold into wholesale markets as
a frozen or dried product. Primary processors sell fish heads in large quantities to local seafood
traders/distributors. Frozen heads are typically sent to Asian countries, such as Korea and China, where they are
sold as whole, IQF or individually wrapped heads. Consumers boil them in soups or cook them and pick out the
meat. Dried heads and frames are often sent to Southern Europe and Asia as “stock fish” for soups. The heads
create rich, flavorful broth, resulting from the oily nature of the head meat.
Southern European countries such as Italy, Spain, and Portugal have traditionally used cod heads to make soup,
but the most common destination for Alaska fish heads is Asia, where they also use heads as soup stock. Cod
head prices and demand are the highest in Korea. Korean traders/distributors also buy farmed salmon, as well
as black cod and Greenland turbot heads. Heads are sold frozen in retail outlets and by street vendors, who
prepare them by steaming or pan-frying. Elderly and low-income residents in China and Hong Kong purchase
fish heads as a low-cost protein resource.
Drying cod heads is a cost-effective stabilization or preservation method that Norway and Iceland have used
for centuries. In modern times, the heads and bones are dried over racks and sold into Spain, Portugal, Italy,
Nigeria and other East African countries.4 Dried frames and heads are sold in markets as a dehydrated soup
stock called “okporoko” in Africa. The Nigerian market imports dried heads for approximately $3 per kilo.5 (Entire
dried fish are called “stock fish” and are sold around the world in traditional markets for soup.)
In Nordic countries, the cod tongue, which consists of the entire bottom jaw muscle, is cut out and pan-fried.6
The texture and flavor of the cod tongue is like a mild-flavored fish or scallop. Frozen cod tongue from Iceland
is currently priced at $8 per kilo in wholesale markets.7
Product Value and Shipping Costs
The price of Alaska fish heads depends on the species, processor, and other product specifications.
4 http://www.dryfish.no/books/Engelsk.pdf 5 http://nsgl.gso.uri.edu/aku/akuy12002.pdf 6 https://nutsvilleinnorway.wordpress.com/2012/02/11/cod-tongue-a-norwegian-delicacy/ 7 https://www.alibaba.com/product-detail/Cod-Tongues_50000661501.html

Analyses of Specialty Alaska Seafood Products McDowell Group, Inc. Page 12
Table 6 below provides an approximate range of average prices from recent years. Current market prices may
differ from these ranges due to numerous factors. As mentioned earlier, the volume of fish heads sold represents
a small fraction of the available supply. Many processors may also be able to deliver heads from species not
listed below.
Table 6. First Wholesale Price Range of Frozen Alaska Fish Heads, FOB Alaska, 2011-2015 Species Price/kg. Range
Cod (mix of frozen/dried) $1.00 - $2.00
Salmon $0.20 - $0.40
Greenland Turbot $3.75 - $4.50
Halibut $0.70 - $1.60
Black Cod $0.85 - $1.15
Note: Prices do not reflect the cost of freight to move product out of Alaska ports. Source: ADF&G (COAR), approximated by McDowell Group.
Shipping costs are a critical aspect of fish head market development. A list of approximate shipping costs is the
Appendix (page 100). Prices shown in Table 6 do not include shipping-related costs necessary to move product
out of Alaska.
Potential Value of Alaska Fish Heads
Selling fish heads into global markets could add approximately $100 million to the first wholesale value of
Alaska seafood, assuming five-year average harvest volumes, full utilization of the species listed below, and
sales prices roughly equivalent to those seen over the past five years (2011-2015, see Table 7). Currently, only
turbot heads are fully utilized. Anecdotal information suggests the vast majority of heads from cod, sockeye,
coho, Chinook, black cod, and halibut are discarded (though cheeks from larger halibut and black cod collars
are often retained and fetch premium prices). The potential increase in cod value is particularly attractive.
However, whether markets could absorb the additional supply at recent price levels is unknown, as is the
potential for market acceptance of smaller head sizes (from cod and sockeye).
Table 7. Potential Value of Selling All Fish Heads from Selected Alaska Species
Species Potential Head Value ($Millions)
Actual Head Value ($Millions)
Total Species Value ($Millions)
Pct. Potential Increase
Cod $83.0 $4.1 $465.9 17%
Salmon1 $9.5 $0.4 $746.4 1%
Black Cod $4.9 $0.2 $110.1 4%
Halibut $2.6 $0.2 $143.3 2%
Greenland Turbot $1.9 $1.9 $9.6 -
Total $101.9 $6.7 $1,475.3 6% 1 Does not include pink or chum salmon, which is commonly used to make fish oil and meal. Note: Prices used to estimate potential value approximately reflect 5-year average price from 2011-2015. Source: McDowell Group estimates.
Market Opportunities
Alaska has a year-round supply of fish heads from a variety of species. However, the state’s most abundant
species are also found in Norway and Iceland, countries that are at the forefront of resource utilization. With

Analyses of Specialty Alaska Seafood Products McDowell Group, Inc. Page 13
growing demand for fish heads in Asia and East African countries, Alaska suppliers may find an opportunity to
supplement Nordic fish head sales in global markets.8
Exploring niche markets for tongues or finding North American chefs looking to utilize fish heads could generate
more sales. Some buyers may be interested in using Alaska fish heads for collagen, oil, or peptide production.
Finally, pet food/treat manufacturers could be a good fit for Alaska fish heads and frames.
A discussion of established fish head markets for human consumption is provided below.
Frozen Fish Heads
Frozen fish heads are sold in markets all over the world. Alaska processors are already well-equipped to handle
shipments of frozen fish heads in cartons alongside other products. However, transportation costs and
competing supply would likely exceed the benefit of accessing markets in Europe. The greatest potential is likely
in Korea, China, and other Asian markets with large populations, such as the Philippines, Indonesia, Thailand,
and Vietnam.9
Dried Fish Heads
Dried fish heads are currently produced in Norway, Scotland, and Iceland, which have similar climates to Alaska.
The process takes several weeks to dry and operations require large open spaces to air dry the product to
industry standards.10 There is a grading scale for dried fish heads. Higher quality products typically go to Spain
and lower-grade products are sent to Asia and Africa.
Cod and Pollock Tongues
Cod tongues are a delicacy in Northern Europe and Canada.11 The tongue and lower jaw is cut out of the fish
and shipped frozen. There are no size requirements, which allows for the use of smaller sized cod. In fact, some
recipes prefer small tongues, such as pollock. Pollock and cod tongues could be extracted and sold frozen as
additional ready-to-eat delicacy. Alaska suppliers may consider the possibility of selling head-on frozen product
to secondary processors along North America’s northeastern seaboard, where declining cod harvests have
resulted in a greater dependence on imported product from Europe and Alaska.
Under-utilized Species
The domestic seafood market is predominantly designed for convenient preparation and standardized fish
products such as shrimp, fish sticks, and fillets. However, within the last few years, consumption of less common
species and unique seafood products has increased. High profile chefs have showcased other species (“trash
fish”) in their dishes to attract attention to what Americans discard and to demonstrate delicious creativity in
8 http://www.fao.org/news/story/en/item/214442/icode/ 9 http://www.angsarap.net/2012/10/29/sinigang-na-ulo-fish-head-in-tamarind-broth/ 10 http://www.dryfish.no/books/Engelsk.pdf 11 http://eatyourworld.com/destinations/canada/newfoundland_and_labrador/photos/cod_tongues

Analyses of Specialty Alaska Seafood Products McDowell Group, Inc. Page 14
uncommon seafood dishes.12 Increased interest in exploring ethnic meal choices and in sustainable food
sourcing make the domestic market worth exploring as well.13,14 Pho is one example of a popular ethnic recipe
which could be enhanced through using fish heads.
Market Challenges
Low market prices and high operating/transportation
costs have deterred further development of many fish
products from Alaska. Creating a profitable seafood
product in Alaska generally requires markets meet a
scale that allows for container-load volumes to
minimize the impact of transportation costs and
obtain economies of scale within production facilities.
These challenges make it more difficult to grow
markets organically by starting with small volumes.
Buyers and suppliers might partner with others in the
area to combine shipments wherever possible.
Trident Seafoods produced dried cod at its Akutan
plant in the 1980s but halted operations when it became evident that market conditions did not support
diverting floor space and labor from the higher-value fillet line.15 Producers of species abundantly available in
Alaska, such as yellowfin sole and salmon, have struggled to gain market share abroad due to low prices from
competing supply and consumer preference in size.
Salmon head production is challenged by the cost of production during Alaska’s busy summer season and
competition from salmon farms. Buyers prefer the gill removed by hand and rinsed, which is labor-intensive and
creates additional labor cost for producers. Further, the Korean market prefers a 10-pound round fish, which
eliminates much of Alaska’s supply for cod or salmon heads.
Cod heads are a notable challenge for Alaska processors. In the rest of the world, cod heads have a variety of
end markets, including dried cod heads in Nigeria, whole/frozen heads in Korea, and cod tongue products in
Northern Europe. However, transportation costs often eliminate the potential profit margin for buyers and
Alaska suppliers. In addition, producers may be leery about supplying a volatile market. Cod head prices shift
enough to discourage producers from suppling labor and production towards the product line, using the
necessary freezing capacity, and incurring international freight charges.
12 http://civileats.com/2015/06/10/chefs-please-stop-calling-it-trash-fish/ 13 http://www.npr.org/sections/thesalt/2014/03/07/286881659/why-we-should-quit-tossing-fish-heads-and-eat-em-up-instead-yum 14 http://modernfarmer.com/2014/07/fishheads-rolly-polly-delicious/ 15 http://www.afdf.org/wp-content/uploads/promise_profits_white_fish.pdf
Analyses of Specialty Alaska Seafood Products McDowell Group, Inc. Page 15
List of Potential Buyers
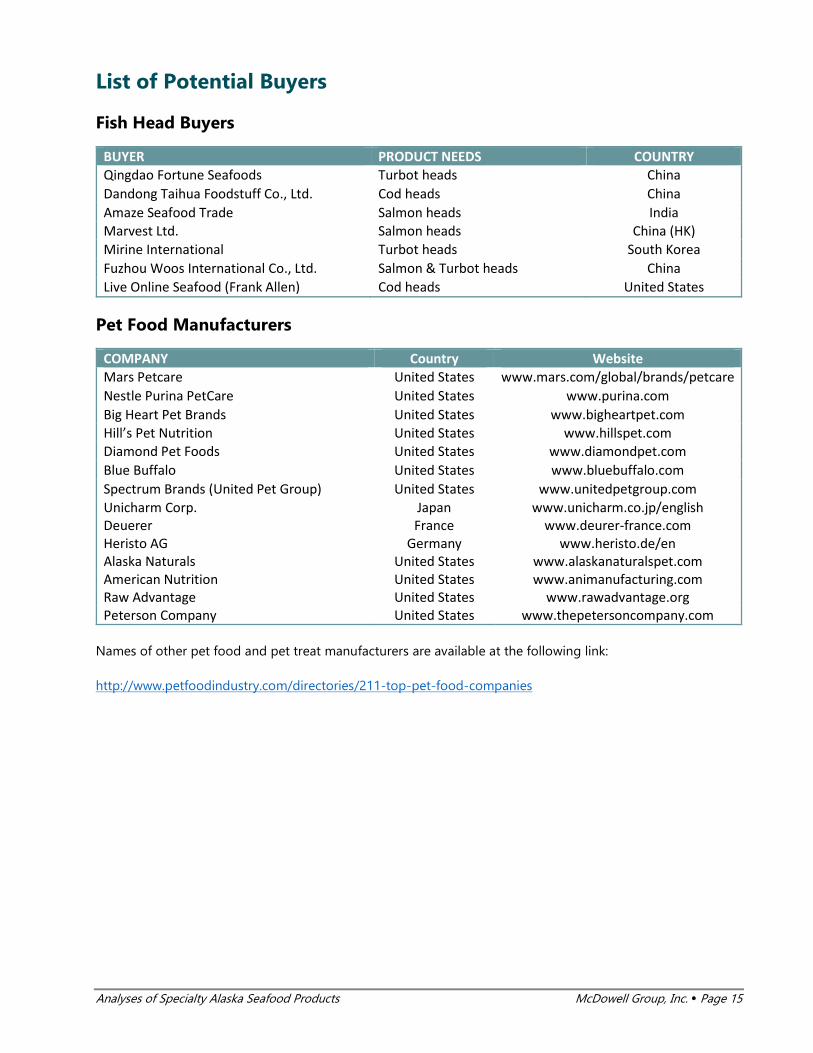
Fish Head Buyers
BUYER PRODUCT NEEDS COUNTRY Qingdao Fortune Seafoods Turbot heads China Dandong Taihua Foodstuff Co., Ltd. Cod heads China Amaze Seafood Trade Salmon heads India Marvest Ltd. Salmon heads China (HK) Mirine International Turbot heads South Korea Fuzhou Woos International Co., Ltd. Salmon & Turbot heads China Live Online Seafood (Frank Allen) Cod heads United States
Pet Food Manufacturers
COMPANY Country Website Mars Petcare United States www.mars.com/global/brands/petcare Nestle Purina PetCare United States www.purina.com Big Heart Pet Brands United States www.bigheartpet.com Hill’s Pet Nutrition United States www.hillspet.com Diamond Pet Foods United States www.diamondpet.com Blue Buffalo United States www.bluebuffalo.com Spectrum Brands (United Pet Group) United States www.unitedpetgroup.com Unicharm Corp. Japan www.unicharm.co.jp/english Deuerer France www.deurer-france.com Heristo AG Germany www.heristo.de/en Alaska Naturals United States www.alaskanaturalspet.com American Nutrition United States www.animanufacturing.com Raw Advantage United States www.rawadvantage.org Peterson Company United States www.thepetersoncompany.com
Names of other pet food and pet treat manufacturers are available at the following link:
http://www.petfoodindustry.com/directories/211-top-pet-food-companies

Analyses of Specialty Alaska Seafood Products McDowell Group, Inc. Page 16
Internal Organs
Key Takeaways
• Internal organs are usually discharged or used as raw material for fish meal/oil production.
• Cod and pollock livers are especially high in valuable omega-3 fatty acids. Niche markets also exist for
cod milt and stomachs.
Production Volume
Alaska’s fisheries produce approximately 700 million pounds of internal fish organs per year.16 Not surprisingly,
pollock accounts for the majority of internal organ production, followed by cod, flatfish, and the rockfish & Atka
mackerel complex. Salmon organs yield relatively little production, compared to their overall harvest volume.
Halibut and Black cod yield 5 to 8 million pounds of internal organs, combined. Fish organs, along with fish
heads, comprise the vast majority of discharged seafood waste in Alaska.
Estimated Production of Internal Organs of Selected Alaska Species, in Million lbs., 2011-2016
2011 2012 2013 2014 2015 2016P 2011-2015 Avg.
Internal Organ
Yield Pct.
Pollock* 409.6 418.8 437.9 461.1 476.4 488.5 440.8 ~15%
Cod* 100.8 108.8 105.4 110.5 106.2 101.1 106.3 ~15%
Sole/Flounder/etc. 101.0 99.2 102.2 99.9 75.9 79.6 95.6 ~14%
Rockfish & Atka Mackerel 27.7 27.6 22.3 25.6 32.6 33.4 27.2 ~12%
Salmon* 20.4 16.6 29.2 18.3 29.1 14.7 22.7 2-3%
Halibut & Black Cod 8.3 7.4 7.0 5.6 5.6 5.1 6.8 11-12%
Total 667.7 678.4 703.9 720.9 725.8 722.5 699.4 -
*Does not include roe. Note: 2016 estimates are based on preliminary harvest data. Source: McDowell Group estimates.
It is not possible to get more detailed
information about how much of each type
of organ is available from Alaska’s
fisheries. This would require a more
comprehensive yield guide than currently
exists. Developing such a guide would
make for a useful research project -
particularly if each fish part was analyzed
16 Including gills, hearts, livers, stomachs, intestines, some gonads, swim bladders, kidneys, and other internal viscera/parts.
Image Credit: Oceanclassrooms.com.
Analyses of Specialty Alaska Seafood Products McDowell Group, Inc. Page 17
for nutritional and proximate (e.g. water, protein, fats, etc.) content.
Markets and Uses for Internal Organs from Alaska Fish
Aside from roe and milt (to a much lesser extent), there is virtually no market for internal fish organs. The vast
majority of internal organs derived from Alaska fish are either transformed into fish meal/oil or ground up and
discharged as gurry. Fish meal/oil markets are covered extensively in a separate chapter; however, there are a
few non-roe organ markets and uses worth mentioning.
Milt Markets & Uses
Markets for milt, the male fish gonad, are less common than those for roe, but do exist for some species, namely
cod and salmon to a lesser extent. The Japanese word for cod milt is shirako, which translates to “white children”
in English. Cod milt is an oddity in the United States, but is well respected in Japanese and Korean cultures.
Shirako is often used in miso soups, sushi, or prepared tempura-style (breaded). Some chefs use it as a toast or
cracker topping, similar to roe. Cod milt is uncommon in the U.S., but it certainly has a mystique and is
occasionally referenced as one of the weirdest but tastiest things foodies report eating. One chowhound.com
review calls it a “seminal dining experience.” U.S. food writers are unanimous in their praise for the taste of cod
milt preparations, and equally quick to point out the difficulty of marketing fish semen on a wider basis.
Nonetheless, it is a valuable niche product. At the right time of year (around February), processors can fetch a
nice price for fresh cod milt if they are willing to airship product to Asia or niche buyers in the U.S. Edmonds,
WA-based Tatoosh Seafoods sells frozen cod milt for about $1.20 per pound.17 That may sound good for
something that would otherwise be headed for the outflow pipe, but it takes a lot of cod milt to add up to
something. At $1.20 per pound, it would take about 555 three-pound, male cod to produce $100 worth of cod
milt. For further context, consider the value of cod milt relative to the flesh. A three-pound cod would produce
two loins of approximately eight ounces, worth about $3.25 in wholesale markets. Milt from the same fish would
be worth approximately $0.18, if it was the right time of year.
Livers
Fish livers are prized for their high oil content. This makes them excellent sources of raw material for
supplement-grade fish oil products. Fish oil markets are discussed in greater detail in a separate chapter,
beginning on page 19. Lipid (i.e. oil) content from Alaska fish livers vary widely by species. Peter Bechtel and
Alexandra Oliveira published a useful analysis of Alaska fish livers in the Journal of Food Science in 2006 (link).
17 http://www.seafoodnews.com/Story/961959/Alaska-Fish-Processors-Chase-Japanese-Market-For-an-Unusual-Product-Cod-Milt

Analyses of Specialty Alaska Seafood Products McDowell Group, Inc. Page 18
Stomachs & Enzymes
Fish stomachs and intestinal tracts can be used to isolate potentially valuable enzymes, with unique properties.
The problem, from a business standpoint, is that these compounds can often be synthetically copied in a lab
after the fact, without the need for much, if any, additional raw material.
Niche markets for cod stomachs exist in Europe.

Analyses of Specialty Alaska Seafood Products McDowell Group, Inc. Page 19
Fishmeal and Fish Oil
Key Takeaways
• Alaska fisheries have the volume to produce more fishmeal and fish oil. However, increasing production
significantly may not be feasible given current technology and product value.
• The market for pet food/treats represents an intriguing growth opportunity. Alaska seafood is a highly
marketable ingredient and processors can supply pet food manufacturers with several product forms
made from waste streams: frozen/ground blocks, hydrolysates, or meals/powders. However, these
products generally sell for very low prices, barely enough to cover the cost of shipping the frozen
product. Raising the value of these minimally processed products by 10-20 cents/lb. or more could
convert a significant volume of Alaska seafood waste into saleable product.
• There may be significant opportunity to expand the value of fish oil by directing the material into higher
value markets/uses. Alaska processors burn over 70 percent of fish oil production as a diesel fuel
supplement, and most of the unburned whitefish oil is sold as lower value product to animal feed
manufacturers. Most fish oil is burned by at-sea processors, which allows ships to cut down on refueling
trips and remain at sea longer.
• The market for fish oil supplements is growing rapidly, from annual sales of $130 million in 2002 to
$1.15 billion in 2014.18 The retail value of encapsulated fish oil products is on the order of $50,000/MT
or more – far higher than the $1,169/MT average value of pollock oil in 2015. Producing refined fish oil
for human consumption holds potential to increase the value of Alaska’s fish oil production several fold
(oil was worth $34 million in first wholesale terms in 2014). However, it is not clear 1) how much more
wholesale value could be added, 2) whether the market could handle a large influx of fish oil supplement
supply, and 3) how much it would cost Alaska processors to meet the requirements of fish oil
supplement manufacturers and retailers.
Fishmeal and Fish Oil Production
The vast majority of Alaska fish meal/oil production utilizes pollock (81% of meal and 95% of oil by volume in
2015). Salmon is the next largest raw material species, and production is generally growing – particularly for
salmon meal. Alaska produces approximately 60,000 to 80,000 MT of fishmeal and 20,000 to 30,000 MT of fish
oil per year (not including fish oil burned as fuel, which is a significant volume – see next section).19
Fishmeal and oil production facilities are present in most large Alaska ports and large catcher-processors. The
process requires specialized equipment to cook, filter, dry, grind, and press raw material (see Figure 1).
18https://www.washingtonpost.com/business/economy/claims-that-fish-oil-boosts-health-linger-despite-science-saying-the-opposite/2015/07/08/db7567d2-1848-11e5-bd7f-4611a60dd8e5_story.html?utm_term=.fa500f805692 19 Data shown in Table 8 does not include meal/oil produced at the Kodiak Fishmeal Facility, which is considered a secondary producer that combines raw material from several Kodiak processors.
Analyses of Specialty Alaska Seafood Products McDowell Group, Inc. Page 20
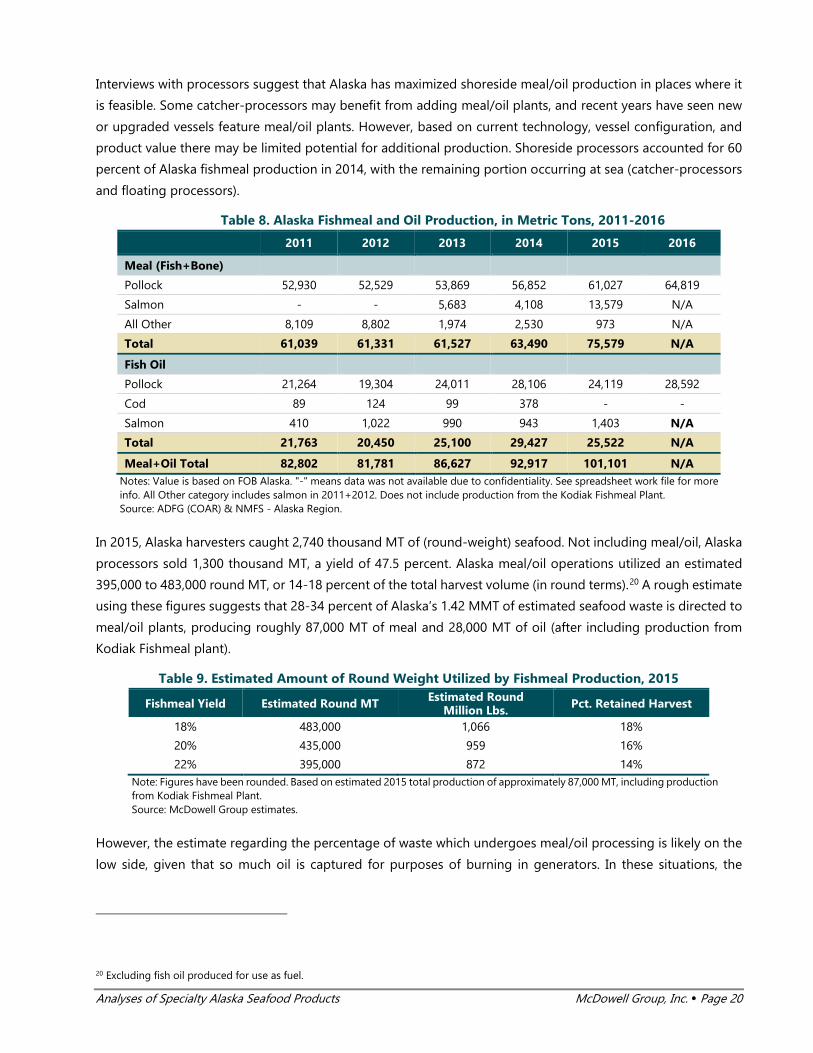
Interviews with processors suggest that Alaska has maximized shoreside meal/oil production in places where it
is feasible. Some catcher-processors may benefit from adding meal/oil plants, and recent years have seen new
or upgraded vessels feature meal/oil plants. However, based on current technology, vessel configuration, and
product value there may be limited potential for additional production. Shoreside processors accounted for 60
percent of Alaska fishmeal production in 2014, with the remaining portion occurring at sea (catcher-processors
and floating processors).
Table 8. Alaska Fishmeal and Oil Production, in Metric Tons, 2011-2016 2011 2012 2013 2014 2015 2016
Meal (Fish+Bone)
Pollock 52,930 52,529 53,869 56,852 61,027 64,819
Salmon - - 5,683 4,108 13,579 N/A
All Other 8,109 8,802 1,974 2,530 973 N/A
Total 61,039 61,331 61,527 63,490 75,579 N/A
Fish Oil
Pollock 21,264 19,304 24,011 28,106 24,119 28,592
Cod 89 124 99 378 - -
Salmon 410 1,022 990 943 1,403 N/A
Total 21,763 20,450 25,100 29,427 25,522 N/A
Meal+Oil Total 82,802 81,781 86,627 92,917 101,101 N/A Notes: Value is based on FOB Alaska. "-" means data was not available due to confidentiality. See spreadsheet work file for more info. All Other category includes salmon in 2011+2012. Does not include production from the Kodiak Fishmeal Plant. Source: ADFG (COAR) & NMFS - Alaska Region.
In 2015, Alaska harvesters caught 2,740 thousand MT of (round-weight) seafood. Not including meal/oil, Alaska
processors sold 1,300 thousand MT, a yield of 47.5 percent. Alaska meal/oil operations utilized an estimated
395,000 to 483,000 round MT, or 14-18 percent of the total harvest volume (in round terms).20 A rough estimate
using these figures suggests that 28-34 percent of Alaska’s 1.42 MMT of estimated seafood waste is directed to
meal/oil plants, producing roughly 87,000 MT of meal and 28,000 MT of oil (after including production from
Kodiak Fishmeal plant).
Table 9. Estimated Amount of Round Weight Utilized by Fishmeal Production, 2015
Fishmeal Yield Estimated Round MT Estimated Round Million Lbs. Pct. Retained Harvest
18% 483,000 1,066 18%
20% 435,000 959 16%
22% 395,000 872 14% Note: Figures have been rounded. Based on estimated 2015 total production of approximately 87,000 MT, including production from Kodiak Fishmeal Plant. Source: McDowell Group estimates.
However, the estimate regarding the percentage of waste which undergoes meal/oil processing is likely on the
low side, given that so much oil is captured for purposes of burning in generators. In these situations, the
20 Excluding fish oil produced for use as fuel.

Analyses of Specialty Alaska Seafood Products McDowell Group, Inc. Page 21
remaining material may be converted to meal, sold as a hydrolysate, or discarded. More research is needed to
compile actual data regarding the volume and nature of seafood waste. The figures in this section are rough
estimates using disappearance calculations from ex-vessel and first wholesale data (as well as data supplied by
Kodiak Fishmeal Company).
Fish Oil as Fuel
Most fish oil produced in Alaska is not sold, but is rather blended with diesel fuel and burned in diesel generators
powering shoreside plants and large fishing/processing vessels. The vast majority of this fuel oil comes from
pollock. Processors reported total pollock oil production of 90,813 MT to ADF&G (COAR) in 2015; however,
NMFS records show only 24,119 MT of oil were produced for sale (27 percent of total production). This
relationship may even be understated, as COAR figures tend to be underreported for federal fisheries.
Figure 1. Composition of Fish Oil Production in Alaska, in Metric Tons, 2015
Source: McDowell Group estimates, based on ADF&G and NMFS fish oil production data.
Fish oil is approximately 75 percent as efficient as low-sulfur #2 diesel (though if varies slightly depending on
generator load and RPMs).21 Therefore, it takes 100 gallons of fish oil to generate the same power/performance
as 75 gallons of diesel. According to a study commissioned for the Alaska Industrial Development and Export
Authority (AIDEA), fish oil used as fuel rarely has to be processed further, making it a convenient way to obtain
better fuel efficiency.
Alaska pollock producers made approximately 17.8 million gallons of pollock fish oil in 2015 not intended for
sale (but to be burned as boiler fuel). This amount of fish oil offsets approximately 13.4 million gallons of diesel
fuel.
Fish oil burned as fuel has very real value. Diesel costs in Dutch Harbor ranged from $3.00-$3.50/gallon in 2015
(data link). Therefore, offsetting 13.4 million gallons of diesel fuel saved operators approximately $44 million (at
21 ftp://ftp.aidea.org/BiomassEnergy/DemonstratingUseofFishOilasFuel.pdf
For Fuel66,700
73%
For Sale24,119
27%

Analyses of Specialty Alaska Seafood Products McDowell Group, Inc. Page 22
$3.25/gallon). The fuel value of fish oil depends on the price of diesel. Table 10 shows the value/MT of fish oil
used as fuel at varying diesel prices.
The value of fish oil used as fuel compared to the market value of pollock fish oil suggests processors should
be selling as much oil as possible (as opposed to using it as fuel) so long as diesel prices remain under
$5.00/gallon. At $3.00/gallon, pollock fish oil producers gave up approximately $450 per MT by burning the oil
as fuel.
However, industry interviews suggest that some at-sea processors often burn fish oil because they lack the
storage space necessary to hold oil. Also, burning fish oil as it is produced allows vessels to remain at sea for
longer periods of time and maximize fishing time. Shoreside processors may burn fish oil depending on the
plant configuration, storage limitations, lack of markets, or other constraints.
Table 10. Value/MT of Alaska Pollock Fish Oil Used as Fuel Depending on Diesel Prices
Diesel Price/Gallon Fish Oil as Fuel Value/MT
$2.50/gallon $582
$3.00/gallon $699
$3.50/gallon $815
$4.00/gallon $932
$4.50/gallon $1,048
$5.00/gallon $1,164 Source: McDowell Group estimates.
Fishmeal and Fish Oil Value
Fishmeal and fish oil generates approximately $120 to $150 million per year for Alaska processors (excluding
production value stemming from the Kodiak Fishmeal Plant). The majority of the value is created by fishmeal,
but fish oil is more valuable product on a per ton basis and generally part of the fishmeal production process.
Pollock meal tends to be more valuable than salmon meal, whereas salmon oil is usually two to three times
more valuable than fish oil made from pollock. This is likely because a larger percentage of salmon oil is currently
produced for human consumption, and even lower grade salmon oil fetches a higher value from pet food
producers compared to pollock oil. Fish oil derived from pollock is generally used in lower value animal feed
production or other less valuable uses (compared to salmon). However, several Alaska processors have recently
begun to further refine whitefish oil for human consumption and this trend is expected to continue.
See table on following page.

Analyses of Specialty Alaska Seafood Products McDowell Group, Inc. Page 23
Table 11. Alaska Fishmeal and Oil First Wholesale Value, in $000s, 2011-2015 2011 2012 2013 2014 2015
Meal (Fish+Bone)
Pollock 85,142 87,287 100,956 101,985 110,560
Salmon - - 5,683 4,108 13,579
All Other 12,949 7,946 4,169 3,913 1,693
Total 98,090 95,233 110,808 110,006 125,832
Fish Oil
Pollock 24,256 22,056 28,406 31,165 28,195
Cod - - - - -
Salmon 1,203 2,540 3,196 2,866 4,408
Total 25,459 24,596 31,602 34,031 32,603
Meal+Oil Total 123,550 119,829 142,411 144,037 158,435 Notes: Value is based on FOB Alaska. "-" means data was not available due to confidentiality. See spreadsheet work file for more info. All Other category includes salmon in 2011+2012. Does not include production from the Kodiak Fishmeal Plant. Source: ADFG (COAR) & NMFS - Alaska Region.
Table 12. Alaska Fishmeal and Oil First Wholesale Value per Metric Ton, 2011-2015 2011 2012 2013 2014 2015
Meal (Fish+Bone)
Pollock 1,609 1,662 1,874 1,794 1,812
Salmon - - 1,671 1,558 925
All Other 1,597 903 2,112 1,547 1,740
Total 1,609 1,662 5,657 4,899 4,476
Fish Oil
Pollock 1,141 1,143 1,183 1,109 1,169
Cod - - - 1,394 1,749
Salmon 2,938 2,486 3,227 3,038 3,143
Total 1,170 1,203 1,259 1,156 1,277 Notes: Value is based on FOB Alaska. "-" means data was not available due to confidentiality. See spreadsheet work file for more info. All Other category includes salmon in 2011+2012. Does not include production from the Kodiak Fishmeal Plant. Source: ADFG (COAR) & NMFS - Alaska Region.
Retail vs. Wholesale Fish Oil Estimates
Information about retail Costco prices and estimates about Costco markups was used to estimate the wholesale
value of fish oil products, both from Alaska and generic varieties. According to Wikipedia and several other
online sources, Costco Kirkland Signature products have a 15 percent markup.
There is a considerable difference in price for Alaska salmon oil (Pure Alaska Omega brand) versus generic
Alaska fish oil (Kirkland Signature brand). While the fact that Pure Alaska Omega is a manufacturer brand could
partly explain the higher price, salmon oil is still clearly more valuable than other oil products. The data below
suggest the wholesale value of Alaska fish oil is extremely high; however, some additional explanation is
required. It is important to note the figures below reflect estimated gross wholesale value. The estimated
wholesale value for supplement products includes the following costs: processing, shipping, marketing,
regulatory, administrative, or research. The potential to convert roughly 90,000 MT of fish oil to human grade

Analyses of Specialty Alaska Seafood Products McDowell Group, Inc. Page 24
product at $50,000-$75,000/MT is tantalizing. Selling 90,000 MT of Alaska fish oil for $50,000 to $75,000 would
roughly double the first wholesale value of all Alaska seafood; however, there are supply/demand forces to
consider even outside the obvious production challenges in Alaska. Significant increases in supply almost always
result in lower prices. It is unlikely that the supplement fish oil market could quickly absorb such a large increase
in supply. Still, the difference in fish oil value is an interesting finding.
REGULAR KIRKLAND SIGNATURE FISH OIL (1000MG/PILL – 400CT.) – UNIT PRICE: $11.49
• Product net weight in grams: 400g
• Retail Cost per 100g: $2.87
• Estimated Costco Markup: 15%
• Estimated Wholesale Value per 100g: $2.44
• Daily Servings per Bottle: 200
• Cost per Daily Serving: $0.06
• Species Used: Anchovy and Sardines
REGULAR KIRKLAND SIGNATURE FISH OIL (1200MG/PILL – 180CT.) – UNIT PRICE: $16.99
• Product net weight in grams: 216g
• Retail Cost per 100g: $7.87
• Estimated Costco Markup: 15%
• Estimated Wholesale Value per 100g: $6.69
• Daily Servings per Bottle: 180
• Cost per Daily Serving: $0.09
• Species Used: Anchovy and Sardines
PURE ALASKA OMEGA SALMON OIL (1000MG/PILL – 180CT.) – UNIT PRICE: $16.99
• Product net weight in grams: 180g
• Retail Cost per 100g: $9.44
• Estimated Costco Markup: 20%
• Estimated Wholesale Value per 100g: $7.55
• Estimated Wholesale Value per MT: $75,511
• Daily Servings per Bottle: 90
• Cost per Daily Serving: $0.19
• Species Used: Alaska Salmon
KIRKLAND SIGNATURE ALASKA FISH OIL (1400MG/PILL – 180CT.) – UNIT PRICE: $16.99
• Product net weight in grams: 322g
• Retail Cost per 100g: $6.21
• Estimated Costco Markup: 15%
• Estimated Wholesale Value per 100g: $5.28
• Estimated Wholesale Value per MT: $52,769
• Daily Servings per Bottle: 230
• Cost per Daily Serving: $0.09
• Species Used: Alaska pollock, cod, and salmon

Analyses of Specialty Alaska Seafood Products McDowell Group, Inc. Page 25
Specific information regarding encapsulation costs could not be found, though anecdotal reports suggest fish
oil is often encapsulated in Canada. The wholesale values above are likely on the high side, as they include all
costs outside of the retail markup.
Bone Meal: Fertilizers and Soil Remediation
Alaska processors also produce bone meal products derived from leftover ash after fishmeal processing. Since
Alaska fishmeal generally involves using heads and frames, there is a substantial bone (i.e. ash) content in the
raw material. Fishmeal buyers prefer to minimize the amount of ash, generally less than 20 percent.
NMFS pollock fishmeal statistics aggregate fishmeal and bone meal into one figure for publication. Based on
COAR data, pollock bone meal accounts for an estimated 14 percent of total pollock meal production by volume.
Based on COAR data, bone meal products derived from pollock are much less valuable than whitefish fishmeal.
Bone meal was quoted at roughly $100-$300/MT in recent years, while fishmeal was valued at $1,800-
$1,875/MT.
Contextual Information
Fishmeal and oil are important products for pollock producers. Meal/oil accounted for 10.1 percent of first
wholesale pollock value in 2015. The relative importance of meal/oil has grown in recent years.
Table 13. Alaska Fishmeal and Oil, Pct. of Production and Value, 2011-2015 2011 2012 2013 2014 2015
Total FW Production (MT)
Pollock 513,750 510,890 546,410 580,200 580,710
Salmon 244,226 207,924 324,970 232,926 340,617
Total 1,216,594 1,191,141 1,317,253 1,279,596 1,350,551
Total FW Value ($M)
Pollock 1,424 1,468 1,335 1,407 1,378
Salmon 1,421 1,287 1,801 1,393 1,451
Total 4,588 4,505 4,563 4,277 4,255
MEAL - Pct. of Volume
Pollock 10.3% 10.3% 9.9% 9.8% 10.5%
Salmon - - 1.7% 1.8% 4.0%
Total 5.0% 5.1% 4.7% 5.0% 5.6%
MEAL - Pct. of Value
Pollock 6.0% 5.9% 7.6% 7.2% 8.0%
Salmon 0.1% 0.2% 0.2% 0.2% 0.3%
Total 2.1% 2.1% 2.4% 2.6% 3.0%
OIL - Pct. of Volume
Pollock 4.1% 3.8% 4.4% 4.8% 4.2%
Salmon 0.2% 0.5% 0.3% 0.4% 0.4%
Total 1.8% 1.7% 1.9% 2.3% 1.9%
OIL - Pct. of Value
Pollock 1.7% 1.5% 2.1% 2.2% 2.0%

Analyses of Specialty Alaska Seafood Products McDowell Group, Inc. Page 26
Salmon 0.1% 0.2% 0.2% 0.2% 0.3%
Total 0.6% 0.5% 0.7% 0.8% 0.8%
MEAL+OIL - Pct. of Volume
Pollock 14.4% 14.1% 14.3% 14.6% 14.7%
Salmon - - 2.1% 2.2% 4.4%
Total 6.8% 6.9% 6.6% 7.3% 7.5%
MEAL+OIL - Pct. of Value
Pollock 7.7% 7.4% 9.7% 9.5% 10.1%
Salmon 0.2% 0.4% 0.4% 0.4% 0.6%
Total 2.7% 2.7% 3.1% 3.4% 3.7% Notes: Value is based on FOB Alaska. "-" means data was not available due to confidentiality. See spreadsheet work file for more info. All Other category includes salmon in 2011+2012. Does not include production from the Kodiak Fishmeal Plant. Source: ADFG (COAR) & NMFS - Alaska Region.
Seasonal Availability & Suppliers
Fishmeal and oil are shelf-stable products which do not require refrigeration and as such are available year-
round. Production timing is a function of wild fishery seasons. Fish paste is available as a frozen product,
generally during or shortly after fishery seasons, so availability and timing is dependent upon the species/area
and storage capacity for the product.
The Alaska Seafood Suppliers Directory (link), hosted by the Alaska Seafood Marketing Institute, contains
contact information for Alaska fishmeal and fish oil suppliers.
Technical Information
Figure 2. Fishmeal and Oil Production Process
Source: IFFO.

Analyses of Specialty Alaska Seafood Products McDowell Group, Inc. Page 27
Supply Chain
Figure 3. Alaska Fishmeal & Pet Food Paste Supply Chain
Uses and Supply Chain for Alaska Fishmeal
1. On-site boiler/generator fuel
2. Aquaculture Feed Manufacturers -> Aquaculture Users
3. Fish Oil Refiners -> Retailers
4. At least two Alaska processors produces fish oil for retail (Trident for Costco’s Kirkland Brand and AGS),
some others may also produce oil for store/other branded products.
The supply chain for human grade fish oil supplements is complex and adds a tremendous amount of value.
Commodity grade whitefish oil can sell for $1,100-$1,200/MT while similar grade salmon oil is worth 40-50
percent more. However, the retail value of fish oil can exceed $80,000/MT. Unlike other seafood products which
lose a considerable amount of weight as it travels from raw material to retail product, oil (once produced) does
not lose much weight as finished product.
See following page for fish oil supply chain diagram.
AK Producers
Pet Food
Retail
Aquaculture Feed
Aquaculture Users
Animal Feed
Feed Sales
Fertilizer(Bonemeal)
Retail & Online

Analyses of Specialty Alaska Seafood Products McDowell Group, Inc. Page 28
Supply Chain for Human Grade Fish Oil
Source: Anthony Bimbo (link).
Markets and Uses for Fishmeal and Fish Oil
Based on interviews with industry members, a large portion of Alaska’s pollock fishmeal is sold to Asian farmed
eel producers. Some Alaska whitefish meal producers also sell fishmeal to farmed turtle producers in Asia. The
binding properties of pollock fishmeal creates a product that can be formed into balls which work well for
feeding eels. It is likely that Alaska whitefish meal is also used in other aquaculture feeds or those used to feed
pigs/chickens.
Salmon meal and other less refined salmon by-products are often sold to pet food manufacturers, though may
also be sold to other animal feed manufacturers as well. Salmon meal generally sells at a discount to pollock
meal, probably due to the fact that salmon meal often contains a higher percentage of ash and some products
have a lower protein content.
Fish bones have been shown to have beneficial properties for remediating and fertilizing soil. A July 2011 New
York Times article chronicled the unique ability of pollock bone meal to bind to toxic lead contamination within
soil and create a new compound which is safe for humans even if consumed. A project in a West Oakland

Analyses of Specialty Alaska Seafood Products McDowell Group, Inc. Page 29
neighborhood remediated soil in a six-block area at a cost of $4 million. Lead contamination is a widespread
problem in urban areas, as well as some federal lands.
Figure 4 summarizes the use of fishmeal worldwide. Aquaculture uses the majority of fishmeal, and the
composition of aquaculture users is diverse.
Figure 4. Global Fishmeal Use by Sector, 2010
Source: IFFO Statistical Yearbook, 2016 (via Seafish).
Most fish oil is also consumed by aquaculture producers who mix it into feeds, especially for species such as
salmon which require feeds with higher oil content. Interestingly, the volume of refined fish oil, generally in the
form of liquid omega 3 products, has increased substantially. Twenty years ago, the majority of fish oil was
converted into “hardened edible” products that were used almost entirely in margarines and shortenings. See
Figure 5 for fish oil use by sector.
Figure 5. Global Fish Oil Use by Sector, 2010
Source: IFFO Statistical Yearbook, 2016 (via Seafish).
Aquaculture73%
Pig20%
Chicken5%
Other2%
Crustaceans (mostly Shrimp)
29%
Marine Fish23%
Salmon & Trout24%
Eels5%
Cyprinids (incl. carp)5%
Tilapias7%
Other Freshwater
(incl. catfish)
7%
Aquaculture71%
Refined Edible24%
Industrial3%
Hardened Edible
2%
Analyses of Specialty Alaska Seafood Products McDowell Group, Inc. Page 30
Pet Food Markets
Scott Lehouiller from the Peterson Company (a pet food manufacturer) provided informative comments
pertaining to selling Alaska seafood into pet food markets:
• Pet food manufacturers require low cost protein sources. Sourcing product from responsible fisheries
or those with positive social/marketing aspects can also add value.
• Peru, Chile, and Norway currently supply a significant volume of meal to U.S. pet food manufacturers.
These large scale producers convert raw material to meal in order to eliminate moisture and make the
product shelf stable so it can be shipped without refrigeration (which adds significant cost for ocean
freight), also then you’re paying less to essentially ship water.
• Some producers will grind and freeze raw material into blocks. While this product is cheaper, it also
contains lower percentages of protein and buyers essentially pay a lot of shipping costs to transport
water.
• Ash content of 16-17 percent or more can be problematic. Higher ash content leaves less room for
protein for pet food manufacturers. Salmon meal is a good material for pet food in one regard, because
of the higher omega-3 content of the oil in the meal, however ash levels in Alaska salmon tend to range
from 20-23 percent (based on specifications from the Kodiak Fishmeal Company). Norsildmel, a Chilean
Salmon Meal producer, sells a product with 15 percent maximum ash (link).
o However, other Alaska seafood industry members have said that a lot of Alaska salmon meal
does go to pet food markets. It is likely that these buyers value the marketability and are willing
to accept more ash in the meal in order to leverage the branding attributes of Alaska salmon.
Alaska industry contacts report that ground/frozen raw material can fetch prices of 22-27 cents/lb. delivered to
the U.S. Midwest (where many pet food manufacturers operate). Alaska producers selling minimally processed
frozen products may have better luck selling to pet food manufacturers in the Pacific Northwest, as doing so
could decrease shipping costs somewhat (perhaps 2-6 cents/lb.).
Given the price of shipping frozen blocks/totes is around 20-30 cent/lb., Alaska producers would likely need to
receive CIF prices of 40 cents/lb. or better to stimulate a significant volume of sales. This might not sound like
much, but retail prices of dry dog food generally range from $0.45 to $2.00 per pound (though some
organic/boutique brands can $5.00). So adding 20 cents/lb., or $4.00 to a 20 lb. bag is a significant cost for pet
food producers.
In general, Alaska producers would be well served to understand the protein content of potential product forms,
as that will drive value in the pet food market. It is also important to understand shipping costs and price
differences for various product forms: unground/frozen, ground/frozen, frozen paste (concentrates/etc.), or
dried meal.
The Pet Food Institute (www.petfoodinstitute.org) is good place to find pet food manufacturers, who may be
interested in buying raw materials from Alaska producers. The group has a large list of members.
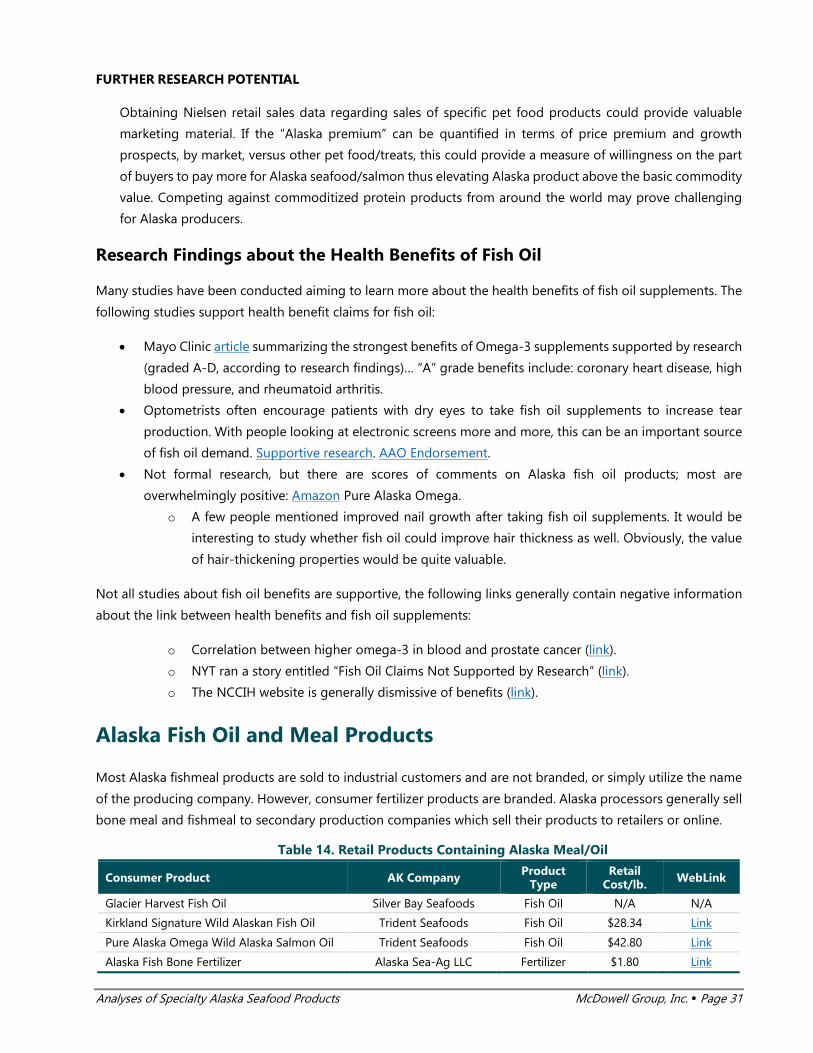
Analyses of Specialty Alaska Seafood Products McDowell Group, Inc. Page 31
FURTHER RESEARCH POTENTIAL
Obtaining Nielsen retail sales data regarding sales of specific pet food products could provide valuable
marketing material. If the “Alaska premium” can be quantified in terms of price premium and growth
prospects, by market, versus other pet food/treats, this could provide a measure of willingness on the part
of buyers to pay more for Alaska seafood/salmon thus elevating Alaska product above the basic commodity
value. Competing against commoditized protein products from around the world may prove challenging
for Alaska producers.
Research Findings about the Health Benefits of Fish Oil
Many studies have been conducted aiming to learn more about the health benefits of fish oil supplements. The
following studies support health benefit claims for fish oil:
• Mayo Clinic article summarizing the strongest benefits of Omega-3 supplements supported by research
(graded A-D, according to research findings)… “A” grade benefits include: coronary heart disease, high
blood pressure, and rheumatoid arthritis.
• Optometrists often encourage patients with dry eyes to take fish oil supplements to increase tear
production. With people looking at electronic screens more and more, this can be an important source
of fish oil demand. Supportive research. AAO Endorsement.
• Not formal research, but there are scores of comments on Alaska fish oil products; most are
overwhelmingly positive: Amazon Pure Alaska Omega.
o A few people mentioned improved nail growth after taking fish oil supplements. It would be
interesting to study whether fish oil could improve hair thickness as well. Obviously, the value
of hair-thickening properties would be quite valuable.
Not all studies about fish oil benefits are supportive, the following links generally contain negative information
about the link between health benefits and fish oil supplements:
o Correlation between higher omega-3 in blood and prostate cancer (link).
o NYT ran a story entitled “Fish Oil Claims Not Supported by Research” (link).
o The NCCIH website is generally dismissive of benefits (link).
Alaska Fish Oil and Meal Products
Most Alaska fishmeal products are sold to industrial customers and are not branded, or simply utilize the name
of the producing company. However, consumer fertilizer products are branded. Alaska processors generally sell
bone meal and fishmeal to secondary production companies which sell their products to retailers or online.
Table 14. Retail Products Containing Alaska Meal/Oil
Consumer Product AK Company Product Type
Retail Cost/lb. WebLink
Glacier Harvest Fish Oil Silver Bay Seafoods Fish Oil N/A N/A
Kirkland Signature Wild Alaskan Fish Oil Trident Seafoods Fish Oil $28.34 Link
Pure Alaska Omega Wild Alaska Salmon Oil Trident Seafoods Fish Oil $42.80 Link
Alaska Fish Bone Fertilizer Alaska Sea-Ag LLC Fertilizer $1.80 Link
Analyses of Specialty Alaska Seafood Products McDowell Group, Inc. Page 32
Competing Fishmeal and Fish Oil Supply
• Algae generally contain higher ratios of LC Omega 3’s. Using a 30 percent EPA/DHA equivalence, algae
O3 oil production was 5,000 MT in 2011, and is projected to be 30,000 MT by 2017 (source).
• KRILL: Antarctic krill biomass estimated to be 200-400 million metric tons. Managed by CCAMLR who
have set a TAC of 5 million MT with a “trigger” level of 620,000 MT. Current catches are around 200,000
MT/year. Aker Biomarine has obtained MSC certification.
• GM Oil Seeds: Monsanto sells an “Omega-3-Enhanced Soybean Oil” (source). Large biotech firms are
working on finding a plant-based Omega-3 source for the aquaculture industry. Fish oil is a critical
limiting factor for aquaculture. “If you look back only 15 years ago, we were using 100% fish oil in
salmon feed. Today almost 70% of fish oil is being replaced by vegetable derived oils in Europe such as
rapeseed oil and poultry oil in Americas/Asia” according to a Alex Obach, managing director of Skretting
Aquaculture Research in this article.
• GM free feed vs. GMO feed is also an issue. Using GM free feed produces a premium product for
aquaculture producers. Still, it seems if a plant-based Omega-3 oil can be brought to market at a lower
price than fish oil, it could stimulate a large increase in aquaculture production.
• This link provides a good summary of competing fishmeal and oil production.
Opportunities
Fish oil has a significant range of value, depending on the market product is sold into. From $1,100-$1,200/MT
for industrial feed use (even lower for biodiesel) to perhaps over $50,000 for human supplements. However,
industry members we spoke with did not feel that the industry would be converting significant volumes of fish
oil to supplement-grade quality any time soon. Despite the pessimism, demand for fish oil supplements is
growing (from $130 million in 2002 to $1.15 billion in 2014, according to Euromonitor via this Washington Post
article). Selling more Alaska fish oil to the fish oil nutraceutical supplement market would likely add more value
to the state’s seafood resource, but would create additional costs that may require further study.
The pet food industry is extremely competitive and many manufacturers use ingredient quality and sourcing as
key marketing points. Quantifying the premium value of using Alaska seafood may provide encourage buyers
to use Alaska fishmeal or hydrolysate/paste products, and justify a higher value for Alaska products.
Alaska’s seafood industry creates vast quantities of waste which could be transformed into meal and oil.
However, conventional meal and oil processing methods are not capable of achieving full resource utilization
profitably. Advancing meal/oil processing techniques to deal with smaller or more volatile waste streams could
unlock a significant volume of additional meal/oil production in Alaska.
Challenges
Meal and oil production requires large volumes of fish and ideally entering the plant each day in consistent
volumes. Unfortunately, wild fishery harvests are inherently variable, especially for salmon. Meal and oil plants
are also expensive. Producers noted meal/oil plants typically cost between $25-$35 million. Due to the size of
the investment, annual production must be significant to make new meal/oil plants feasible.
Analyses of Specialty Alaska Seafood Products McDowell Group, Inc. Page 33
One industry veteran interviewed for this project was very clear that Alaska meal/oil production is at or near its
maximum now. He did not believe there is much additional supply sitting out there that would be feasible, at
least for meal/oil. He also noted that feasibility, cost and product value, varies greatly depending on the place
and the product. “Everyone wants to do human grade fish oil, but doesn’t understand the complexity of getting
into that market,” the contact added.
There is not a standard type of equipment or meal/oil process used across Alaska. The variation in equipment
and species makes it inherently hard to do generic marketing because different processors are likely to have
different markets.
Alaska’s remote location and spread out activities makes it difficult to add value to fish oil products. Whereas if
all or most of Alaska’s production centered around a specific area or port, processors could focus more intently
on producing high quality, human-grade oil.
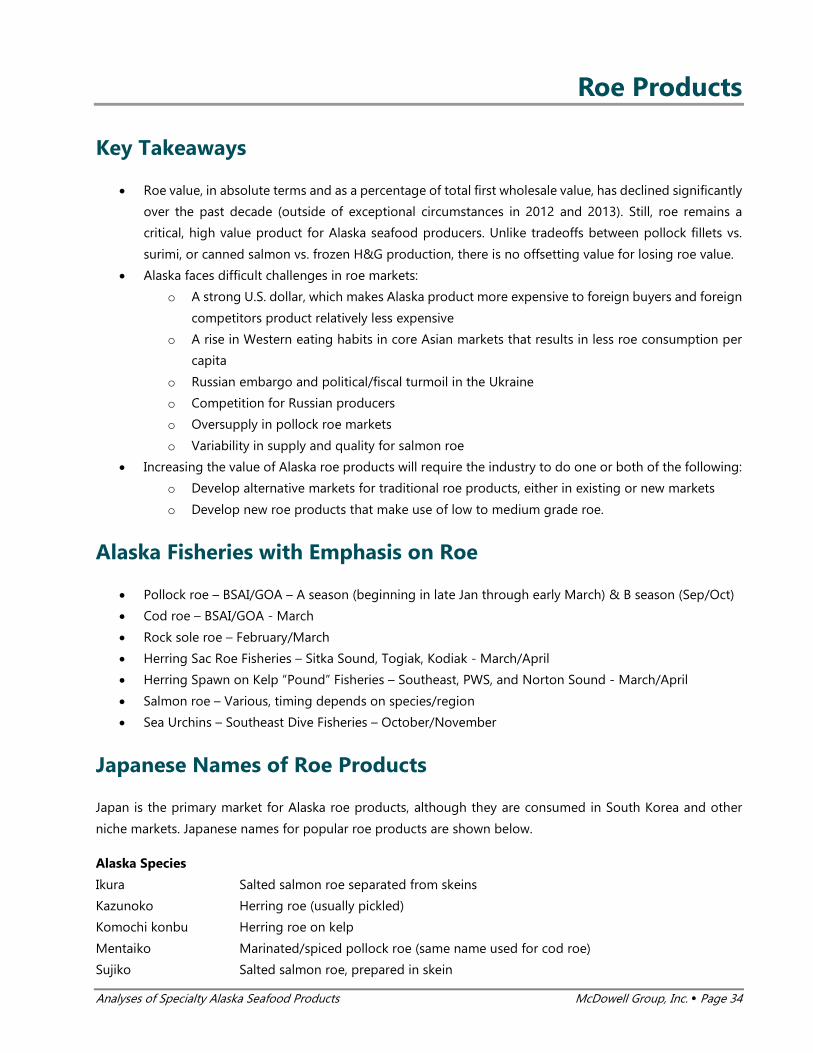
Analyses of Specialty Alaska Seafood Products McDowell Group, Inc. Page 34
Roe Products
Key Takeaways
• Roe value, in absolute terms and as a percentage of total first wholesale value, has declined significantly
over the past decade (outside of exceptional circumstances in 2012 and 2013). Still, roe remains a
critical, high value product for Alaska seafood producers. Unlike tradeoffs between pollock fillets vs.
surimi, or canned salmon vs. frozen H&G production, there is no offsetting value for losing roe value.
• Alaska faces difficult challenges in roe markets:
o A strong U.S. dollar, which makes Alaska product more expensive to foreign buyers and foreign
competitors product relatively less expensive
o A rise in Western eating habits in core Asian markets that results in less roe consumption per
capita
o Russian embargo and political/fiscal turmoil in the Ukraine
o Competition for Russian producers
o Oversupply in pollock roe markets
o Variability in supply and quality for salmon roe
• Increasing the value of Alaska roe products will require the industry to do one or both of the following:
o Develop alternative markets for traditional roe products, either in existing or new markets
o Develop new roe products that make use of low to medium grade roe.
Alaska Fisheries with Emphasis on Roe
• Pollock roe – BSAI/GOA – A season (beginning in late Jan through early March) & B season (Sep/Oct)
• Cod roe – BSAI/GOA - March
• Rock sole roe – February/March
• Herring Sac Roe Fisheries – Sitka Sound, Togiak, Kodiak - March/April
• Herring Spawn on Kelp “Pound” Fisheries – Southeast, PWS, and Norton Sound - March/April
• Salmon roe – Various, timing depends on species/region
• Sea Urchins – Southeast Dive Fisheries – October/November
Japanese Names of Roe Products
Japan is the primary market for Alaska roe products, although they are consumed in South Korea and other
niche markets. Japanese names for popular roe products are shown below.
Alaska Species
Ikura Salted salmon roe separated from skeins
Kazunoko Herring roe (usually pickled)
Komochi konbu Herring roe on kelp
Mentaiko Marinated/spiced pollock roe (same name used for cod roe)
Sujiko Salted salmon roe, prepared in skein

Analyses of Specialty Alaska Seafood Products McDowell Group, Inc. Page 35
Tarako Salted pollock roe (same name used for cod roe)
Uni Sea urchin roe
Non-Alaska Species
Ebiko Shrimp roe
Karasumi Mullet roe
Masago Capelin roe
Tobiko Flying fish roe
Alaska Roe Production & Value
The following tables show production volume and first wholesale value for Alaska roe products.
Table 15. Alaska Pollock Roe Production and Value, 2005-2016
Year RW Harvest (MT)
Roe Volume (MT)
FW Roe Value ($Millions)
Roe Pct. of Value
FW Value/MT
Roe Yield
FW Value in JPY/KG
2005 1,545,500 26,130 354.8 26.7% 13,578 1.69% 1,426
2006 1,561,800 29,970 291.5 22.4% 9,726 1.92% 1,022
2007 1,409,700 30,470 262.0 20.5% 8,599 2.16% 1,014
2008 1,044,400 20,790 241.9 17.6% 11,635 1.99% 1,405
2009 856,800 18,490 162.9 15.3% 8,810 2.16% 945
2010 888,400 16,450 98.0 8.9% 5,957 1.85% 550
2011 1,281,900 19,290 152.9 10.7% 7,926 1.50% 715
2012 1,310,200 18,160 169.2 11.5% 9,317 1.39% 770
2013 1,370,100 16,120 115.6 8.7% 7,171 1.18% 562
2014 1,442,900 24,120 148.2 10.5% 6,144 1.67% 572
2015 1,490,800 21,870 103.6 7.7% 4,737 1.47% 484
2016 1,528,196 14,785 N/A N/A N/A 0.97% N/A Note: 2016 data is preliminary. Source: NMFS Economic SAFE Reports.
Table 16. Alaska Cod Roe Production and Value, 2011-2016
Year RW Harvest (MT)
Roe Volume (MT)
FW Value ($Millions)
FW Value/MT
FW Value in JPY/KG
2011 305,300 3,170 $4.9 $1,546 162
2012 328,900 3,860 $7.1 $1,839 193
2013 318,900 4,380 $9.1 $2,078 218
2014 334,200 5,250 $11.7 $2,229 234
2015 321,100 3,710 $6.3 $1,698 178
2016 286,898 2,860 N/A $1,546 N/A Note: Data was unavailable prior to 2011. 2016 data is preliminary. Source: NMFS Economic SAFE Report (2015).
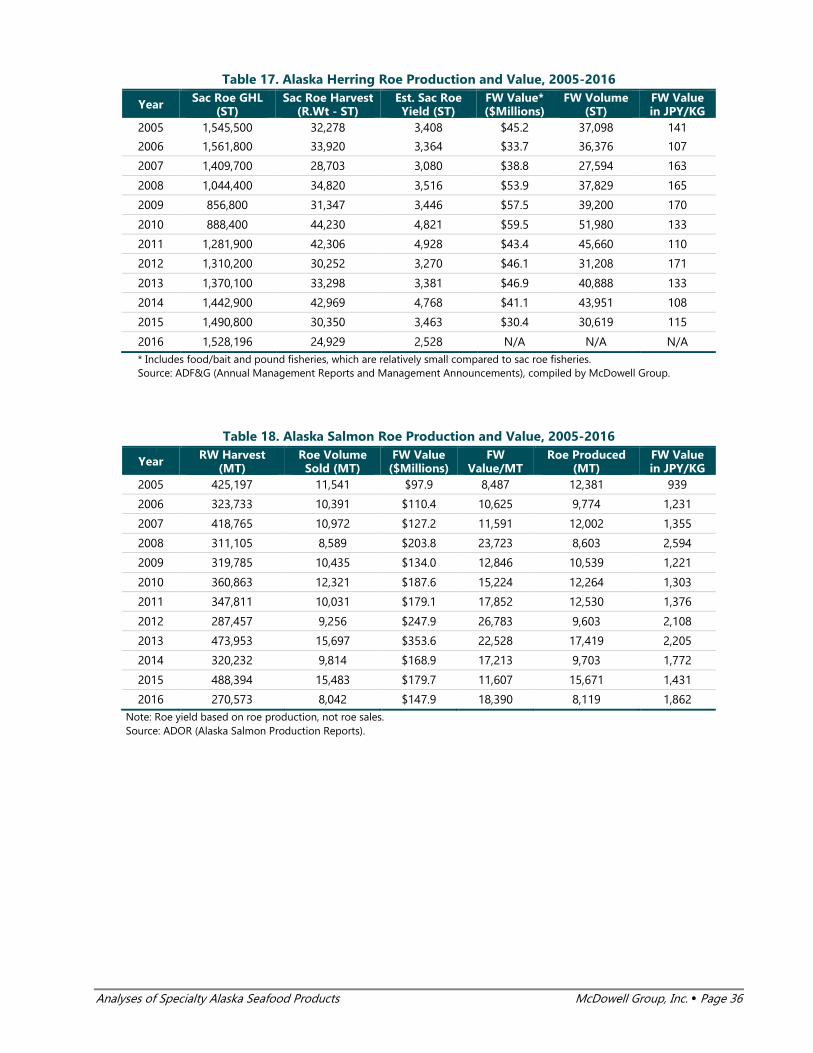
Analyses of Specialty Alaska Seafood Products McDowell Group, Inc. Page 36
Table 17. Alaska Herring Roe Production and Value, 2005-2016
Year Sac Roe GHL (ST)
Sac Roe Harvest (R.Wt - ST)
Est. Sac Roe Yield (ST)
FW Value* ($Millions)
FW Volume (ST)
FW Value in JPY/KG
2005 1,545,500 32,278 3,408 $45.2 37,098 141
2006 1,561,800 33,920 3,364 $33.7 36,376 107
2007 1,409,700 28,703 3,080 $38.8 27,594 163
2008 1,044,400 34,820 3,516 $53.9 37,829 165
2009 856,800 31,347 3,446 $57.5 39,200 170
2010 888,400 44,230 4,821 $59.5 51,980 133
2011 1,281,900 42,306 4,928 $43.4 45,660 110
2012 1,310,200 30,252 3,270 $46.1 31,208 171
2013 1,370,100 33,298 3,381 $46.9 40,888 133
2014 1,442,900 42,969 4,768 $41.1 43,951 108
2015 1,490,800 30,350 3,463 $30.4 30,619 115
2016 1,528,196 24,929 2,528 N/A N/A N/A * Includes food/bait and pound fisheries, which are relatively small compared to sac roe fisheries. Source: ADF&G (Annual Management Reports and Management Announcements), compiled by McDowell Group.
Table 18. Alaska Salmon Roe Production and Value, 2005-2016
Year RW Harvest (MT)
Roe Volume Sold (MT)
FW Value ($Millions)
FW Value/MT
Roe Produced (MT)
FW Value in JPY/KG
2005 425,197 11,541 $97.9 8,487 12,381 939
2006 323,733 10,391 $110.4 10,625 9,774 1,231
2007 418,765 10,972 $127.2 11,591 12,002 1,355
2008 311,105 8,589 $203.8 23,723 8,603 2,594
2009 319,785 10,435 $134.0 12,846 10,539 1,221
2010 360,863 12,321 $187.6 15,224 12,264 1,303
2011 347,811 10,031 $179.1 17,852 12,530 1,376
2012 287,457 9,256 $247.9 26,783 9,603 2,108
2013 473,953 15,697 $353.6 22,528 17,419 2,205
2014 320,232 9,814 $168.9 17,213 9,703 1,772
2015 488,394 15,483 $179.7 11,607 15,671 1,431
2016 270,573 8,042 $147.9 18,390 8,119 1,862 Note: Roe yield based on roe production, not roe sales. Source: ADOR (Alaska Salmon Production Reports).

Analyses of Specialty Alaska Seafood Products McDowell Group, Inc. Page 37
Table 19. Alaska Pink Salmon Roe Production and Value, 2005-2016
Year RW Harvest (MT)
Roe Volume Sold (MT)
FW Value ($Millions)
FW Value/MT Roe Yield FW Value
in JPY/KG 2005 247,689 7,018 $53.1 $7,564 3.0% 837
2006 121,907 4,520 $41.2 $9,125 3.1% 1,057
2007 224,734 6,482 $71.4 $11,014 3.0% 1,287
2008 131,129 4,040 $92.3 $22,850 3.2% 2,499
2009 139,887 5,146 $53.3 $10,365 3.5% 985
2010 180,415 6,586 $96.1 $14,594 3.7% 1,249
2011 177,122 5,067 $79.9 $15,760 4.0% 1,215
2012 111,739 3,799 $93.5 $24,616 3.4% 1,937
2013 307,791 10,057 $209.4 $20,820 3.7% 2,038
2014 147,176 5,245 $81.1 $15,462 3.6% 1,592
2015 286,462 9,307 $83.9 $9,019 2.9% 1,112
2016 72,680 2,051 $34.8 $16,962 2.6% 1,718 Note: Roe yield based on roe production, not roe sales. Source: ADOR (Alaska Salmon Production Reports).
Table 20. Alaska Chum Salmon Roe Production and Value, 2005-2016
Year RW Harvest (MT)
Roe Volume Sold (MT)
FW Value ($Millions)
FW Value/MT Roe Yield FW Value
in JPY/KG 2005 40,135 1,568 $21.2 $13,539 4.7% 1,498
2006 76,403 3,275 $50.6 $15,459 4.5% 1,791
2007 54,122 2,012 $35.2 $17,508 4.9% 2,047
2008 63,720 2,228 $75.3 $33,815 3.4% 3,698
2009 53,282 2,413 $48.5 $20,094 5.0% 1,909
2010 57,724 2,790 $58.1 $20,823 4.9% 1,782
2011 50,519 2,153 $62.2 $28,874 4.8% 2,226
2012 68,357 3,125 $116.6 $37,293 5.0% 2,935
2013 68,067 3,214 $103.1 $32,077 5.3% 3,139
2014 41,930 1,859 $50.9 $27,384 3.7% 2,819
2015 58,519 3,009 $68.4 $22,714 6.5% 2,800
2016 53,698 2,462 $71.8 $29,155 4.7% 2,952 Note: Roe yield based on roe production, not roe sales. Source: ADOR (Alaska Salmon Production Reports).
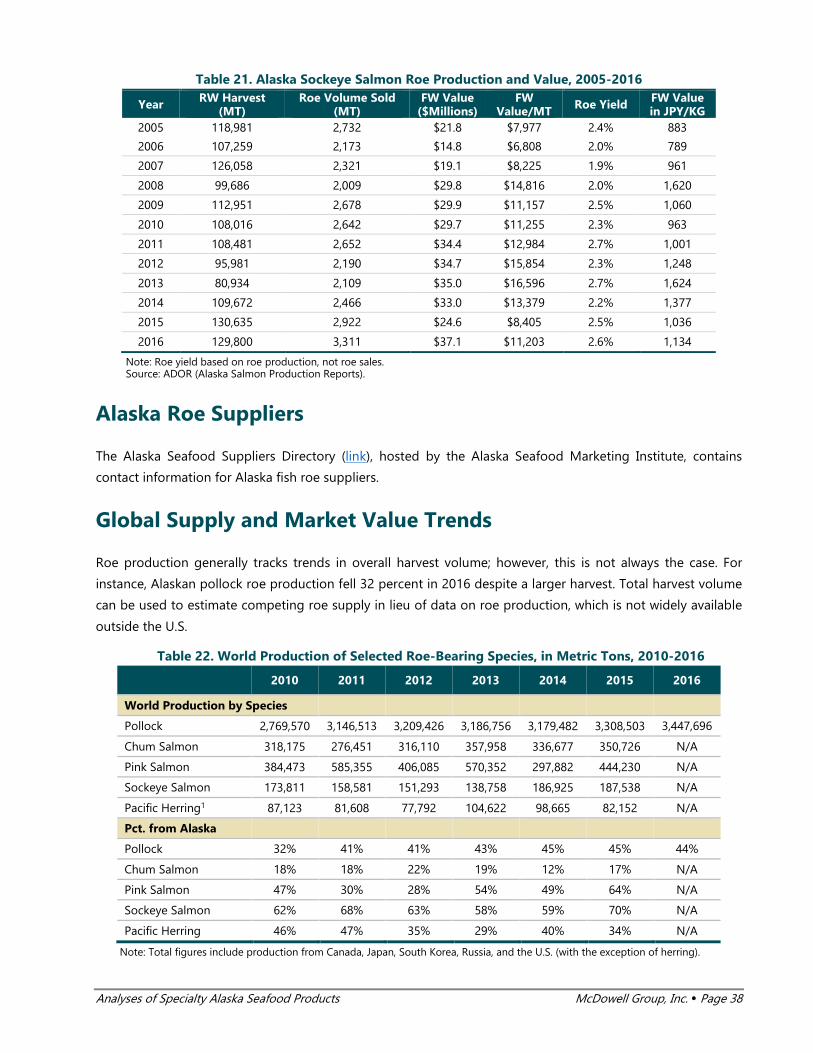
Analyses of Specialty Alaska Seafood Products McDowell Group, Inc. Page 38
Table 21. Alaska Sockeye Salmon Roe Production and Value, 2005-2016
Year RW Harvest (MT)
Roe Volume Sold (MT)
FW Value ($Millions)
FW Value/MT Roe Yield FW Value
in JPY/KG 2005 118,981 2,732 $21.8 $7,977 2.4% 883
2006 107,259 2,173 $14.8 $6,808 2.0% 789
2007 126,058 2,321 $19.1 $8,225 1.9% 961
2008 99,686 2,009 $29.8 $14,816 2.0% 1,620
2009 112,951 2,678 $29.9 $11,157 2.5% 1,060
2010 108,016 2,642 $29.7 $11,255 2.3% 963
2011 108,481 2,652 $34.4 $12,984 2.7% 1,001
2012 95,981 2,190 $34.7 $15,854 2.3% 1,248
2013 80,934 2,109 $35.0 $16,596 2.7% 1,624
2014 109,672 2,466 $33.0 $13,379 2.2% 1,377
2015 130,635 2,922 $24.6 $8,405 2.5% 1,036
2016 129,800 3,311 $37.1 $11,203 2.6% 1,134
Note: Roe yield based on roe production, not roe sales. Source: ADOR (Alaska Salmon Production Reports).
Alaska Roe Suppliers
The Alaska Seafood Suppliers Directory (link), hosted by the Alaska Seafood Marketing Institute, contains
contact information for Alaska fish roe suppliers.
Global Supply and Market Value Trends
Roe production generally tracks trends in overall harvest volume; however, this is not always the case. For
instance, Alaskan pollock roe production fell 32 percent in 2016 despite a larger harvest. Total harvest volume
can be used to estimate competing roe supply in lieu of data on roe production, which is not widely available
outside the U.S.
Table 22. World Production of Selected Roe-Bearing Species, in Metric Tons, 2010-2016
2010 2011 2012 2013 2014 2015 2016
World Production by Species
Pollock 2,769,570 3,146,513 3,209,426 3,186,756 3,179,482 3,308,503 3,447,696
Chum Salmon 318,175 276,451 316,110 357,958 336,677 350,726 N/A
Pink Salmon 384,473 585,355 406,085 570,352 297,882 444,230 N/A
Sockeye Salmon 173,811 158,581 151,293 138,758 186,925 187,538 N/A
Pacific Herring1 87,123 81,608 77,792 104,622 98,665 82,152 N/A
Pct. from Alaska
Pollock 32% 41% 41% 43% 45% 45% 44%
Chum Salmon 18% 18% 22% 19% 12% 17% N/A
Pink Salmon 47% 30% 28% 54% 49% 64% N/A
Sockeye Salmon 62% 68% 63% 58% 59% 70% N/A
Pacific Herring 46% 47% 35% 29% 40% 34% N/A
Note: Total figures include production from Canada, Japan, South Korea, Russia, and the U.S. (with the exception of herring).

Analyses of Specialty Alaska Seafood Products McDowell Group, Inc. Page 39
1 Does not include Russian harvest because the amount roe produced/exported from the fishery to Asian markets appears to be limited, relative to Russia’s large Pacific herring harvest. Source: FAO (2010-2015) and McDowell Group estimates (Pollock 2016).
Trade data can be used to estimate supply for pollock roe markets. Most pollock roe is imported by Japan and
South Korea. Import data on pollock roe (obtained from Global Trade Atlas) from the U.S. and Russia into these
markets provides information about roe market supply and value.
Table 23. Frozen Pollock Roe Imports by Japan and South Korea from U.S. and Russia, 2006-2016 Japan Imports South Korea Imports Total
Year MT Pct. U.S. $/MT MT Pct. U.S. $/MT MT Pct. U.S. $/MT
2006 43,772 68% $9,735 7,293 25% $6,979 51,065 62% $9,342
2007 38,251 68% $9,081 7,085 40% $6,707 45,336 64% $8,710
2008 41,958 53% $12,198 4,368 27% $7,323 46,326 50% $11,738
2009 34,007 53% $9,462 7,786 25% $6,204 41,793 47% $8,855
2010 38,747 35% $8,201 6,923 23% $6,853 45,670 33% $7,997
2011 38,256 38% $9,309 10,073 22% $8,234 48,329 35% $9,085
2012 40,439 38% $11,907 12,333 20% $8,115 52,772 33% $11,020
2013 34,166 39% $9,010 15,263 22% $5,749 49,429 34% $8,003
2014 42,836 42% $7,400 15,069 20% $4,985 57,905 36% $6,771
2015 40,398 46% $5,637 15,157 19% $4,131 55,555 39% $5,226
2016 34,767 41% $7,013 14,605 16% $4,096 49,372 34% $6,150
Source: Global Trade Atlas.
Frozen pollock roe exports to Japan have fluctuated since 2006, but have generally been flat on average.
Meanwhile, South Korea has become a larger importer of frozen pollock roe over the past decade. South Korea
is an important location for cold storage and pollock roe auctions, but import statistics do not reliably indicate
the supply of roe being sold into the Korean market. A significant volume of pollock roe is first exported to
South Korea before going on to Japan; however, that supply is not typically included in Korean import statistics.
Despite increasing Korean demand, the market generally buys lower priced, lower grade pollock roe.
Alaska’s position as the primary pollock roe exporter to Japan has also changed over the past decade. Russia
now exports more pollock roe to Japan and South Korea. Based on industry interviews, competing with Russian
pollock roe producers is increasingly difficult due to a weak Russian ruble, lower operating costs, and differences
in fishery management structure which generally provide for larger harvests of high quality pollock roe. With
no foreseeable decline in pollock roe production, the need to find alternative pollock roe markets is critical.
Low Grade Roe Production Volume
The study team attempted to quantify the volume of low quality roe production in Alaska, but was not able to
compile enough responses from processors to produce a reliable figure. However, interviews revealed several
interesting points:

Analyses of Specialty Alaska Seafood Products McDowell Group, Inc. Page 40
• Roe quality is largely subjective and highly influenced by market supply. In years where supply is
plentiful, buyers are more discerning about quality attributes as compared to years with less supply.
Inventory positions also play a role in demand and quality grading temperament.
• This factor suggests that demand for Alaska roe products is somewhat inelastic, where the volume
demanded is relatively static but price adjusts significantly depending on supply. Intuitively, this makes
sense as there are few markets capable of consuming large volumes of Alaska roe products outside of
Japan, Korea, and Eastern Europe (which is mostly closed due to the Russian embargo). So in years of
large supply, primary buyers negotiate for lower prices on higher grades and leave the rest. The situation
can be reversed in years of tight supply, however.
• Pollock egg maturation varies by stock/area. This impacts the supply of high-medium quality roe. If
fishing is good during the right time, larger supplies of high quality roe will be available. Pollock roe
yield is also influenced by fish size. Smaller fish – which has been more predominant in recent years –
tend to produce less roe.
• Not surprisingly, pollock roe processed at-sea tends to be of higher quality than pollock roe produced
in shoreside plants. At-sea processors generally obtain higher average pollock roe prices. This means
shoreside processors have more downside exposure to oversupplied pollock roe markets.
• Salmon roe quality and yield can vary significantly by area, species, and year, making a quantification
of off grade roe across all producers virtually impossible. Salmon processors consistently pointed to
poor PWS pink roe quality in 2015, however. Pink roe prices declined after the 2014 Russian embargo
closed a significant pink roe market, but low pink roe prices the following year were also a reflection of
poorer quality. In contrast, pink roe quality and yield was quite good in 2013 and processors obtained
high prices.
• Russian pollock producers are in a better competitive position to obtain premium roe prices. Due to
differences in fishery management structure the Russian pollock fleet can be more selective about
harvesting stocks with mature roe. A lower cost structure also allows Russian producers to be profitable
while only selling high quality roe and discarding the rest.
• Obtaining information about herring roe quality is difficult because almost all Alaska herring roe is sold
with the skein still in the fish. Some fish are cut open and sampled to estimate roe yield.
Importance of Alaska Roe Products
Roe products are a very important part of Alaska’s seafood industry. Salmon and pollock roe generally command
high prices and unlike meat products, there is no product form trade off (e.g. salmon processors can produce
canned salmon or frozen products but not both from the same fish). Roe tends to be a high margin product for
processors who are in turn able to use roe revenue to pay higher fish prices or fund other operational
investments. In many years, roe products account for over 10 percent of total first wholesale value; however,
that percentage has been trending down since the mid-2000s (aside from a bump in 2012 and 2013). This is a
critical point, because roe prices have a significant bearing on processor profitability – which drives ex-vessel
pricing.

Analyses of Specialty Alaska Seafood Products McDowell Group, Inc. Page 41
Figure 6. First Wholesale Value of Key Alaska Roe Products, 2005-2015
Note: Includes salmon, pollock, herring, and cod roe only. Source: McDowell Group estimates, based on ADF&G and NMFS data.
Data for 2016 is not yet available but will likely show another sharp drop in roe value. Pollock roe production
was down 32 percent and pink harvests declined 75 percent in 2016. An increase in roe prices for these species
will slightly offset the lost production volume, but regardless 2016 will likely be the worst roe season in recent
memory.
Pollock accounts for more roe value than any other single species, averaging $138 million in first wholesale
value between 2011 and 2015. Collectively, salmon roe is more valuable with an average value of $226 million.
Pink and chum make up 84 percent of salmon roe value. Pollock, pink salmon, and chum salmon accounted for
79 percent of total Alaska roe value between 2011 and 2015.
Figure 7. Average First Wholesale Roe Value by Species, in $Millions, 2011-2015 Average
Notes: Does not include all Alaska roe products (such as rock sole or urchin roe). Herring value
includes a relatively small amount of food/bait production. Source: McDowell Group estimates, based on ADF&G and NMFS data.
4.0%
6.0%
8.0%
10.0%
12.0%
14.0%
16.0%
$0
$100
$200
$300
$400
$500
$600
2005 2006 2007 2008 2009 2010 2011 2012 2013 2014 2015
Firs
t W
ho
lesa
le V
alu
e ($
Mill
ion
s)
FW Value of Key Roe Products ($Millions) Pct. of Total FW Value
Pollock$137.9
33%
Pink$109.6
27%
Chum$80.219%
Other Salmon$36.1
9%
Herring$41.610%
Cod$7.82%

Analyses of Specialty Alaska Seafood Products McDowell Group, Inc. Page 42
Roe Quality: Specifications and Ramifications
• Salmon ikura is graded according to a #1, #2, or #3 quality scale. Sujiko is graded into #1 or #2 groups.
• Salmon ikura is sold frozen, usually in 500g, 1 kg, or 14 kg containers/trays, but can also be sold in pails
or in block form.
• Sujiko is graded into #1 or #2 quality categories. It is frozen and usually packed in containers/trays, but
is also shipped in pails or frozen blocks.
• Green salmon roe is typically sold in frozen blocks to secondary processors.
• Pollock roe has many grades, some companies offer over twenty quality grades but there are some
general Japanese names which apply to various types of roe conditions:
o Mako: Mature eggs. Highest quality roe consisting of a whole matched pair of roe masses
without any defects (or very small defects).
o Gamko: Immature eggs.
o Mizuko: Overripe eggs.
o Kireko: Eggs with broken skeins.
o Barako: Eggs that have broken loose from the skeins
• Roe grading is also influenced by the volume of roe produced and the quality of the year’s production
from Alaska and competitors. In a year with low production, buyers are worried more about accessing
supply and may be more willing to give favorable grades (up to a point) than in a year where supply of
quality roe is plentiful and they can afford to be choosier.
• The spread between low/high quality roe varies depending on the year, and the volume of high quality
roe available. For salmon ikura, the typical spread is approximately 1,250 yen/kg (or $5/lb.). The spread
between low and high quality pollock roe is generally about 750 yen/kg (or $3/lb.). Price spreads for
low/high quality roe are highly dependent upon the supply of roe at various quality grades.
Trends in Japanese Wholesale Markets
The Tsukiji Wholesale Fish Market is Japan’s largest fish market and publishes monthly data on the volume and
value of products sold at the market. McDowell Group has worked with ASMI’s Japan office to translate and
compile the data.
Wholesale prices of Alaska roe prices declined significantly between 2012 and 2016 in U.S. dollar terms.
However, much of the decline is due to the changing value of the Japanese yen. For example, the average price
of ikura sold at the Tsukiji Wholesale market declined 27.4 percent during the five-year period when
denominated in U.S. dollars, but only fell 1.7 percent in yen terms.
It is unlikely that the wholesale value of pollock and herring roe products sold into Japan will increase
substantially in the near future, barring a resurgence in demand. Pollock roe supply has increased with rising
harvest volumes and herring demand has steadily declined over the past decade. In fact, the volume of herring
roe sold at the Tsukiji market was lower in 2016 than at any year since at least 2005. Lower herring roe volumes
resulted in slightly higher prices in 2016, but the total sales value of herring roe still declined. Prices of herring
roe on kelp increased in 2016 at the Tsukiji market, but the market for Komochi konbu is significantly smaller
than herring roe from sac roe fisheries (kazunoko).

Analyses of Specialty Alaska Seafood Products McDowell Group, Inc. Page 43
Table 24. Sales Volume, Value, and Average Prices of Selected Roe Products at Japan’s Tsukiji Wholesale Fish Market, 2010-2016
2010 2011 2012 2013 2014 2015 2016
Sales (in Metric Tons)
Sujiko 967 749 610 503 479 690 706
Ikura 2,619 2,184 1,865 1,629 1,733 1,728 1,705
Pollock Roe – Not Marinated 2,174 1,915 2,091 2,025 1,805 1,694 1,415
Pollock Roe - Marinated 2,455 2,218 2,308 2,394 2,209 2,232 2,188
Kazunoko 1,044 1,128 1,069 1,102 1,096 1,087 883
Komochi konbu 431 516 277 193 252 281 242
Yen/KG
Sujiko 1,868 2,086 2,573 3,224 3,007 2,382 2,200
Ikura 3,055 4,044 5,009 5,006 4,598 4,586 4,923
Pollock Roe – Not Marinated 1,655 1,568 1,380 1,370 1,422 1,423 1,480
Pollock Roe - Marinated 1,580 1,625 1,562 1,509 1,546 1,486 1,481
Kazunoko 2,410 2,026 2,163 2,093 1,941 2,032 2,241
Komochi konbu 1,901 1,957 2,794 4,134 2,921 2,766 3,149
$USD/MT
Sujiko 21,648 26,422 32,246 32,739 27,752 19,674 20,194
Ikura 35,317 50,913 62,325 50,854 42,710 37,844 45,219
Pollock Roe – Not Marinated 18,906 19,691 17,246 13,999 13,399 11,754 13,581
Pollock Roe - Marinated 18,038 20,419 19,518 15,412 14,576 12,272 13,616
Kazunoko 28,699 25,945 26,362 20,762 16,925 16,714 20,046
Komochi konbu 22,044 24,747 34,908 41,789 27,366 22,791 29,090
Source: Tokyo Metropolitan Government, compiled by McDowell Group and ASMI Japan Office.
The March 2011 tsunami, which devastated parts of Eastern Japan, likely explains at least part of the spike in
salmon roe prices from 2011 to 2013. The tsunami destroyed many salmon roe inventories, salmon fishing boats,
and chum salmon hatchery operations. Prices retreated after 2013 as production facilities were rebuilt. A weaker
yen and the Russian embargo also were contributing factors to lower salmon roe values in ensuing years.
Addressing Roe Market Challenges
Roe consumption in Japan, Alaska’s primary roe market, is steadily declining. The industry also sells substantial
amounts of roe into the Korean market. Increasing roe values requires expanding consumption, either in its
primary markets (Japan/Korea) or by developing new markets or uses.
• CHALLENGE: Supply is outstripping demand for Alaska roe products, particularly in the case of pollock.
• SOLUTION: Increase consumption of key roe products, particularly pollock roe which has a more
consistent supply than salmon roe products.
Roe markets for pollock, salmon, and cod generally demand stable quantities each year, but Alaska’s wild
fisheries often produce volatile swings in production. Roe prices can go very high when supply is low. However,

Analyses of Specialty Alaska Seafood Products McDowell Group, Inc. Page 44
when supply is plentiful prices fall precipitously as there is not a lot of demand which can tapped into simply by
lowering prices.
• CHALLENGE: Rigid demand with no alternative market when supply spikes and prices fall.
• SOLUTION: Find alternative markets/products, such as roe-based oil or sport bait, that can provide an
outlet for years which produce large quantities of roe and/or low quality roe.
Not all roe is appropriate for sale into roe markets. It could be immature, over-mature, discolored, have soft
membranes (leading to breakage), or other defects. Further, lower quality roe can drag down the value of higher
quality roe and damage consumer perception if they consume products using waste grade roe. Roe quality is
driven by many factors. Many fisheries target fish outside of spawning periods, so the roe will be immature.
Sometimes fish are caught at the right time but for some reason the roe is not high quality, as was the case
during 2015 in the Prince William Sound pink salmon fishery. The fishery produced an enormous pink harvest
but most of the eggs had thinner than normal membranes causing eggs to break leading to poor yields and
poor prices on product that was sold. In cases where the roe is not saleable, some plants send the waste grade
material to the fish meal/oil plant. However, this can be problematic as roe membranes tend to “gum up” screens
the meal/oil equipment.
• CHALLENGE: Utilization of “waste grade” roe.
• SOLUTION: Develop uses and markets for low quality roe, such as roe-based oil (with a custom process
designed to solve the gumming problem) or other products.
The study team interviewed several industry members in an attempt to understand how much low grade roe is
produced for various species. Unfortunately, without full access to confidential information it is not possible to
estimate. Quantifying past waste volumes may not be very useful in any case, as the volume of low quality roe
can vary significantly from year to year.
Alternative Product Possibility: Roe-based Fish Oil
Roe-based fish oil generally has superior attributes to conventional human-grade fish oils and would likely
command a higher value in the fish oil market hierarchy. Fish oil derived from roe has higher percentage DHA
omega-3 fatty acid compared to conventional fish oil products. Oil derived from roe is also a phospholipid form
of DHA which some studies have shown is more bioavailable in the body and improves brain development over
triglyceride DHA (found in conventional fish oils).22 The only known materials to produce phospholipid binding
DHA are krill, squid skin, and fish roes. Further, salmon roe lipids are high in Phosphatidylcholine (PC) and there
is evidence that PC supplements may help stimulate growth of new brain cells and neural connections. Salmon
roes are also very high in astaxanthin, a powerful antioxidant offering numerous health benefits.23
22 https://www.ncbi.nlm.nih.gov/pubmed/24470588 23 http://www.uofmhealth.org/health-library/hn-10011674

Analyses of Specialty Alaska Seafood Products McDowell Group, Inc. Page 45
Krill oil is a growing market segment that is expected to double in value by 2022.24 The appeal of krill oil is
primarily the presence of phospholipid DHA and some consumers say it does not produce “fishy burps” as is
occasionally experienced with other fish oil capsules. However, krill is a key food source for many fish and marine
mammals. MSC certified the Antarctic krill fishery in 2015, but some
consumers may still be wary about sustainability claims given that so
much marine life is dependent upon abundant krill stocks. By
comparison, processing low grade fish roe represents an efficient use
of a resource which might otherwise go to waste.
Norwegian producers have recently begun marketing a roe-based oil
using immature roe from the country’s large Atlantic herring fishery.
This is an effort to utilize a raw material that has no current market in
established roe markets.
As discussed in this report’s fishmeal and fish oil chapter, estimating a
first wholesale value for human grade fish oil supplements is difficult. However, it is important to understand
what the potential value of roe oil could be, even if only based on an approximate estimate.
Potential wholesale value can be inferred by examining the retail value of krill oil and herring roe oil, which
typically ranges from $50,000-$75,000/mt ($23.67-$34.02/lb.). Production would face a myriad of other costs,
but it is still instructive to calculate a potential wholesale value per unit of raw material (metric tons). Table 25
estimates the wholesale value of low grade roe used in a high-end fish oil product, assuming an oil yield of 15
percent.
Table 25. Estimated Wholesale Value of Alaska Roe Oil Wholesale Value/MT of Human
Grade Roe Oil Product Wholesale Value/MT of Roe
Used for Oil Production1 Wholesale Value of 1,000
MT of Roe ($Millions) $10,000 $1,500 $1.50
$20,000 $3,000 $3.00
$30,000 $4,500 $4.50
$40,000 $6,000 $6.00
$50,000 $7,500 $7.50 1 Wholesale value/MT of human grade roe oil * 15 percent oil recovery rate. Source: McDowell Group estimates.
The potential wholesale value of fish oil derived from salmon roe could be worth as much as $50,000/MT, but
how does that compare to the value of roe sold into roe markets? Salmon roe would likely yield approximately
15-18 kilograms of oil for every metric ton of roe used in production.25 The wholesale value of roe used for oil
production would therefore be the wholesale value of roe oil multiplied by a conservative yield of 15 percent.
Due to the low yield, the relative value of roe used to produce oil would be much lower than the wholesale
value of the oil product. It is possible that additional products could be produced from the leftover material,
24 http://www.nutraceuticalsworld.com/contents/view_breaking-news/2016-11-10/growth-predicted-for-the-global-krill-oil-market 25 Based on personal communication with industry contacts.

Analyses of Specialty Alaska Seafood Products McDowell Group, Inc. Page 46
but that would require further research. It is estimated that waste grade roe could be worth $1,500 to $7,500/MT.
This is a significant amount if the roe used for oil comes from roes which are otherwise discarded, but is
substantially lower than medium to high grade salmon roe. Further, there are hurdles at a plant level. Ideally,
most salmon roe is retained and sold to roe markets leaving relatively little low quality roe available for roe oil
production. This amount will vary significantly from year to year, but these factors make it difficult to justify
creating a new roe oil product based on an unknown level of supply. However, if low quality salmon roe can be
aggregated from multiple processors it makes the prospects for investment and product development more
favorable. Branding and marketing a singular Alaska salmon roe oil product may be easier than putting forth
multiple products in smaller volumes. While a cooperative structure may be the most efficient development
option, creating an equitable framework that properly allocates costs and benefits among the entity’s owners
might be challenging.
Historically, processors put considerable focus on products with longer shelf-stable periods. Extending the time
over which Alaska salmon products can be sold is important because it can smooth out variations in harvest
volume. Roe oil is shelf stable for several years and provides the opportunity to smooth out variations in raw
material supply.
What is the relative value of producing a roe-based oil product from Alaska salmon? Alaska processors typically
sell 8,000 to 16,000 metric tons of salmon roe each year. In addition, there may be several thousand metric tons
of waste grade roe available which could be used to produce oil. Therefore, it could be estimated that perhaps
as much as 5,000 metric tons of salmon roe could be available for oil production in a large year. The total
wholesale value of such a volume could be worth $7.5 to $37.5 million. This is a substantial sum, but represents
only a fraction salmon roe sold into roe markets, which averaged $220 million per year between 2012-2016.
Available research and interviews with industry suggests salmon roe provides the best raw material for
producing high quality roe oil. However, salmon harvests, roe yield, and roe quality varies tremendously by
region, species, and year. If a valuable roe oil product can be made using pollock, cod, or other species, the
volume of raw material could be significantly increased.
Other Roe Products
In addition to current roe products and roe oil, there are other products which could be created from Alaska
fish roe. Industry and academic institutions in Alaska are continually investigating new roe products, and the
Symphony of Seafood – a competition highlighting new Alaska seafood products – introduced a new category
called “Beyond the Egg” this past year specifically focused on new roe products.
Other potential roe products include, but are not limited to:
• Sport bait – typically uses cured salmon roe for sale in bait and sporting goods stores in the Pacific
Northwest. For example, Cabela’s sells a 7 ounce package of cured salmon roe bait produced by Pro-
Cure for $11.99 per package. Anecdotal reports suggest some Alaska processors already sell salmon
roe to bait manufacturers.
• Bottarga – Salted/cured roe sack of Italian origin. Historically, bottarga is produced using grey mullet
or bluefin tuna, but some have attempted using pollock, cod, and salmon roe. The product is typically
Analyses of Specialty Alaska Seafood Products McDowell Group, Inc. Page 47
grated and used as a topping on pasta or cooked vegetables. Karasumi (salted and dry-cured mullet
roe) is a similar product used in Japan and East Asia, although it is softer than Mediterranean bottarga.
Sport bait and bottarga are high value products, but the market is relatively small. In each case, a little raw
material goes a long way. While using Alaska roes in a bottarga-like product is still in the experimental phase,
bait manufacturers have used Alaska salmon roe for years and it is unlikely that much could be done to expand
this market channel.
Increasing Roe Consumption and Value
It may be possible to increase the value derived from Alaska roe by producing alternative products from low
grade roe; however, the costs of creating new products such as roe oil are substantial, leaving less potential for
increasing profits. By comparison, increasing the average price of Alaska roe products by 10 percent could create
over $40 million of additional first wholesale value with minimal capital expenses. While increasing resource
utilization and product development in Alaska’s seafood industry is an important long term goal that should be
supported to the greatest extent possible, it should not come at the expense of increasing the value of existing
production.
As the supply of marketable quality roe produced in Alaska’s fisheries cannot be easily increased, the only way
to add value is to increase demand. To increase demand, the product requires broader, more frequent
consumption by more consumers. Secondary roe processors in Japan and Korea have had some success
introducing updated formulations, but as eating habits in these countries continue to trend toward Western
tastes increasing the number of consumers regularly eating traditional Japanese/Korean foods will be
challenging.
Broader eating habits in core market areas present opportunities for increasing the number of consumers
seeking out roe products. Sushi, Chinese, and Korean-inspired recipes have become commonplace in North
America, and increasing the utilization of roe in Asian dishes, as well as pasta preparations, could be the next
hot food trend. The health benefits of eating roe are an additional selling point.
However, increasing roe consumption in new markets faces several challenges, including retail
penetration/availability, food service incentives, and consumer awareness/education. The typical North
American consumer is likely unaware of how to use roe in home cooking preparations and would be hard
pressed to find any Alaska roe products sold at mainstream grocery stores. In instances where products like
“salmon caviar” are available in North America, they are often sold in relatively large quantities (~1 lb.) or contain
smaller amounts at high prices (North American online specialty retailers often sell tinned or jarred salmon
caviar for $50 or more per pound). Prices are high, relative to what consumers might pay in Japan, Korea, or
Eastern Europe because the product occupies such a narrow niche in the North American market.
Convincing conventional restaurants to utilize roe without a significant consumer education/marketing effort
could be met with resistance. Restaurants are not willing to add cost to dishes unless it is likely to have a
significant benefit to the business’s bottom line, and the ability to increase pricing on dishes with a high-priced
ingredient like roe is uncertain at best.
Analyses of Specialty Alaska Seafood Products McDowell Group, Inc. Page 48
While there are challenges regarding the North American supply chain, there is undoubtedly a growing “foodie”
sub-culture that seeks out authentic dishes. In fact, this group will likely represent the majority of U.S. consumers
in a few years, as 47 percent of American restaurant patrons consider themselves to be “foodies” including 68
percent of consumer age 25-34.26 This segment is very interested in learning more about international dishes
and the story about where their food comes from. It is likely that U.S. “foodies” would try a variety of roe
products and preparations, if they were aware of the benefits/story and presented with the opportunity. ASMI
and industry could play a substantial role in this endeavor.
Increasing utilization of Alaska roe products in North American sushi restaurants/stands may be the most direct
method for increasing consumption in alternative markets. Sushi chefs already utilize a variety of roe products
and would likely find it easier to source product than restaurants with less experience using roe. Finding ways
to increase the use of pollock and herring roe as a supplement in sushi preparations could be a way to increase
demand.
STRATEGY FOR MARKETING ROE PRODUCTS IN THE U.S.
A potential marketing campaign centered on introducing roe products to U.S. retail consumers is presented
below:
1. Identify retail partner(s) in markets with “foodie” customers who are highly motivated to offer customers
something different than their competitors. Stress that this is a unique, high value product producing a high
margin per unit of dedicated store space. Ideally, the retail partner would have in-store restaurants (e.g. HyVee)
which could feature roe products in a variety of food preparations on-site and/or offer in-store demonstrations
of simpler uses. Negotiate for ability to track sales performance, this is critical to future promotions and
scalability.
2. Work with partner chefs to develop a several dishes featuring Alaska roe products likely to appeal to the
target audience, or utilize existing recipes/dishes.
3. Identify species and product forms to be used in the promotion, and how they may need to be
processed/packed for a retail setting with a focus on creating accessible unit volumes and price points. Offerings
should be small enough that consumers will likely not let product go to waste or spoil.27
4. Create a marketing strategy that highlights the history of roe in ethnic dishes, the Alaska story, and health
benefits. Create print media content for local and retailer publications, perhaps work with a food writer to place
a story in a regional newspaper. Create in-store signage/assets (Roe: what, why, recipe, and ingredient list).
Produce brief video explaining dish history and Alaska origin stories for the chain’s seafood counter (or other)
monitors.
26 http://www.mintel.com/press-centre/food-and-drink/half-of-american-restaurant-goers-consider-themselves-foodies 27 This is a crucial point, as many consumers are less likely to purchase something that they did not fully utilize as opposed to something they liked but could have even used more. Better to leave them wanting more than feeling guilty about buying too much.

Analyses of Specialty Alaska Seafood Products McDowell Group, Inc. Page 49
5. Create an efficient social media strategy to encourage new roe consumers to share their dishes and connect
with info about Alaska, ASMI, and recipe ideas. Perhaps incentivize Facebook/Twitter shares with defined
hashtags by offering prizes (such as store gift cards or Alaska Seafood swag).
6. Work with Alaska processor(s) and retailers’ distributors to arrange for product. May need to offer training
materials or assistance to retail staff.
7. Gather qualitative feedback from retail partners about event. Analyze sales performance. If the event leads to
permanent store placement, repeat.
Analyses of Specialty Alaska Seafood Products McDowell Group, Inc. Page 50
Specialty Crab Products
Key Takeaways
• Utilizing crab shells and tails could add an estimated $9.3 million in first wholesale value, based on full
utilization of chitin production and king crab tails.28
• Crab shells contain chitin, a versatile polymer that has anti-bacterial and anti-fungal properties. Chitin
is a material used in biomedical, agricultural, and food service industries in an assortment of products
including technical fabrics, sponges, and fertilizers.
• King crab tails contain sweet, rich meat similar to leg/claw sections. Removing it by hand is costly but
due to current high prices ($15/lb. in 2016) for the tail meat, processors are now extracting the meat.
The greatest challenge is the limited, highly-seasonal supply. The largest markets for tail meat are
secondary processors that use the tail meat as a lower-cost ingredient for value-added products such
as crab cakes, soups/bisques, or other preparations.
This chapter focuses on specialty crab products and does not address markets or production for frozen crab
sections. For more information on traditional crab production and markets, please see: Wholesale Market
Profiles for Alaskan Groundfish and Crab Fisheries.
Production Volume and Value
Total Alaska crab harvests averaged 88.9 million pounds worth $269 million in ex-vessel value from state and
federal fisheries over the last five years (2011-2015). Crab is one of the highest valued seafood species in Alaska.
Frozen sections of red king crab often fetch over $15/lb., while opilio and snow crab usually sells for over $5/lb.
at the first wholesale level.
Four primary species of crab are commercially-harvested in Alaska, including snow (opilio), tanner (bairdi), king,
and Dungeness. Most of the harvest is concentrated in the Bering Sea, with smaller fisheries occurring from
Norton Sound to Southeast. Crab are harvested using pot gear. Only males above a species-specific size
threshold may be retained.
Snow and tanner crab are distributed primarily in the Bering Sea, accounting for 79 percent of the total crab
harvest in the last five years (2011-2015). Tanners typically weigh 2 to 4 pounds each. Snow crab average 1 to 2
pounds.29
King crab are the largest crab species, typically between 6 to 10 pounds, and are distributed primarily in the
Bering Sea. Red king crab are historically the most commercially important shellfish in Alaska and are found in
28 https://www.afsc.noaa.gov/News/pdfs/Wholesale_Market_Profiles_for_Alaskan_Groundfish_and_Crab_Fisheries.pdf 29 http://www.adfg.alaska.gov/index.cfm?adfg=tannercrab.main
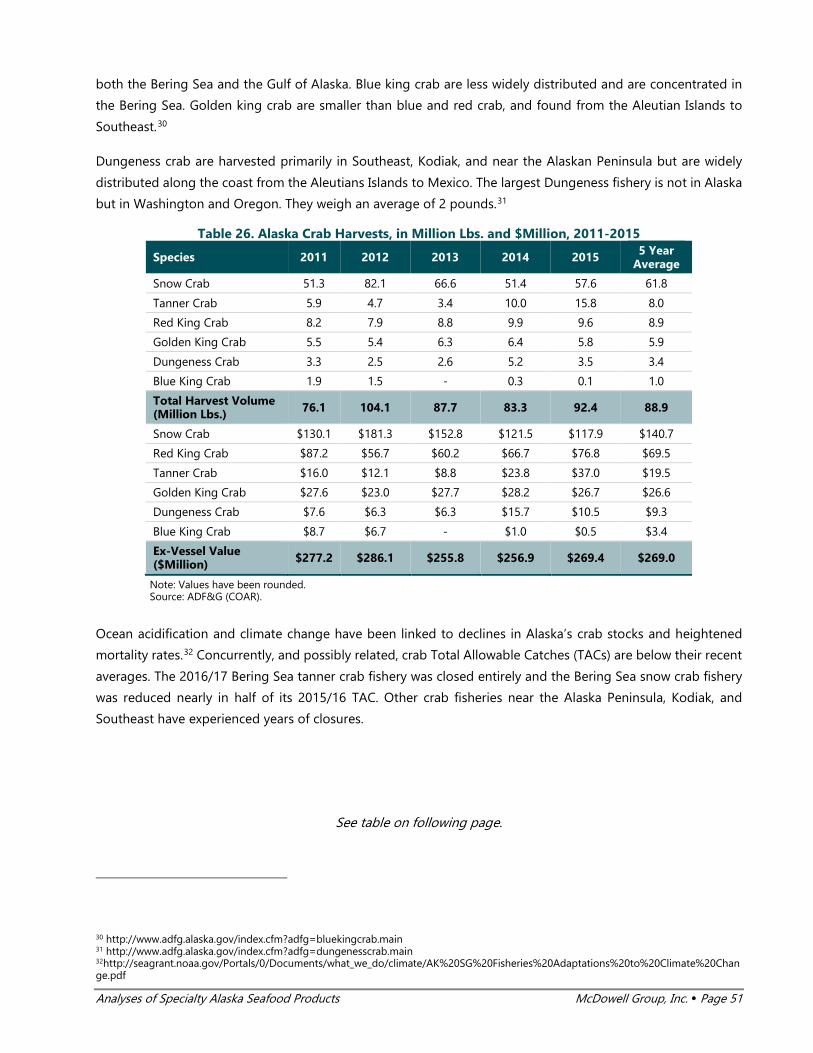
Analyses of Specialty Alaska Seafood Products McDowell Group, Inc. Page 51
both the Bering Sea and the Gulf of Alaska. Blue king crab are less widely distributed and are concentrated in
the Bering Sea. Golden king crab are smaller than blue and red crab, and found from the Aleutian Islands to
Southeast.30
Dungeness crab are harvested primarily in Southeast, Kodiak, and near the Alaskan Peninsula but are widely
distributed along the coast from the Aleutians Islands to Mexico. The largest Dungeness fishery is not in Alaska
but in Washington and Oregon. They weigh an average of 2 pounds.31
Table 26. Alaska Crab Harvests, in Million Lbs. and $Million, 2011-2015
Species 2011 2012 2013 2014 2015 5 Year Average
Snow Crab 51.3 82.1 66.6 51.4 57.6 61.8
Tanner Crab 5.9 4.7 3.4 10.0 15.8 8.0
Red King Crab 8.2 7.9 8.8 9.9 9.6 8.9
Golden King Crab 5.5 5.4 6.3 6.4 5.8 5.9
Dungeness Crab 3.3 2.5 2.6 5.2 3.5 3.4
Blue King Crab 1.9 1.5 - 0.3 0.1 1.0
Total Harvest Volume (Million Lbs.) 76.1 104.1 87.7 83.3 92.4 88.9
Snow Crab $130.1 $181.3 $152.8 $121.5 $117.9 $140.7
Red King Crab $87.2 $56.7 $60.2 $66.7 $76.8 $69.5
Tanner Crab $16.0 $12.1 $8.8 $23.8 $37.0 $19.5
Golden King Crab $27.6 $23.0 $27.7 $28.2 $26.7 $26.6
Dungeness Crab $7.6 $6.3 $6.3 $15.7 $10.5 $9.3
Blue King Crab $8.7 $6.7 - $1.0 $0.5 $3.4
Ex-Vessel Value ($Million) $277.2 $286.1 $255.8 $256.9 $269.4 $269.0
Note: Values have been rounded. Source: ADF&G (COAR).
Ocean acidification and climate change have been linked to declines in Alaska’s crab stocks and heightened
mortality rates.32 Concurrently, and possibly related, crab Total Allowable Catches (TACs) are below their recent
averages. The 2016/17 Bering Sea tanner crab fishery was closed entirely and the Bering Sea snow crab fishery
was reduced nearly in half of its 2015/16 TAC. Other crab fisheries near the Alaska Peninsula, Kodiak, and
Southeast have experienced years of closures.
See table on following page.
30 http://www.adfg.alaska.gov/index.cfm?adfg=bluekingcrab.main 31 http://www.adfg.alaska.gov/index.cfm?adfg=dungenesscrab.main 32http://seagrant.noaa.gov/Portals/0/Documents/what_we_do/climate/AK%20SG%20Fisheries%20Adaptations%20to%20Climate%20Change.pdf

Analyses of Specialty Alaska Seafood Products McDowell Group, Inc. Page 52
Table 27. Total Allowable Catch in Selected Bering Sea Crab Fisheries, 2016/2017
Fishery 2015/16 TAC (Million lbs.)
2016/17 TAC (Million lbs.)
Percent Change
Bristol Bay Red King Crab 9.97 8.47 -15%
Aleutian Island Golden King Crab 6.29 5.55 -12%
St. Matthew Blue King Crab 0.41 Closed -100%
Bering Sea Snow Crab 40.61 21.57 -47%
Bering Sea Tanner Crab 19.67 Closed -100%
Total Crab TAC 76.95 35.59 -54%
Source: ADF&G and NMFS.
In the last five years (2011-2015), an annual average of 61.8 million pounds of crab were processed, worth
$387.3 million in first wholesale value.
Table 28. Production of Alaska Crab Species, in Million Lbs. and $Million, 2011-2015
Species 2011 2012 2013 2014 2015 5 Year Average
Snow Crab 35.6 59.0 47.5 37.3 39.2 43.7
Tanner Crab 3.9 3.1 1.9 6.9 11.4 5.4
Red King Crab 6.0 5.3 6.5 7.1 6.9 6.4
Golden King Crab 4.2 3.3 4.2 3.4 3.4 3.7
Dungeness Crab 2.2 1.6 0.9 3.3 2.2 2.0
Blue King Crab 1.2 1.1 - 0.2 0.1 0.5
Production Volume (Million Lbs.) 53.1 73.4 61.0 58.2 63.2 61.8
Snow Crab $190.2 $278.5 $236.1 $194.7 $170.3 $214.0
Red King Crab $106.2 $78.1 $81.9 $81.9 $93.3 $88.3
Tanner Crab $25.5 $19.1 $11.7 $38.5 $53.3 $29.6
Golden King Crab $45.7 $29.7 $36.4 $32.8 $34.3 $35.8
Dungeness Crab $11.8 $9.1 $4.5 $23.4 $15.5 $12.9
Blue King Crab $17.0 $13.9 $0.0 $2.0 $0.7 $6.7
First Wholesale Value ($Million) $396.5 $428.4 $370.6 $373.4 $367.5 $387.3
Note: Values have been rounded. Source: ADF&G (COAR).
Crab are delivered alive to shoreside facilities where they are processed into sections, brine-frozen, and graded
by size. Larger crab sections are worth more per pound than smaller sections. Cooked crab sections constitute
52 to 60 percent of the round weight, depending on the species. The cooked meat yield is between 20 to 25
percent of round weight.33 While most smaller primary processors sell direct to retail markets, the majority of
crab is first sold to wholesale distributors for both domestic and international markets.
33 http://seafood.oregonstate.edu/.pdf%20Links/Recoveries-and-Yields-from-Pacific-Fish-and-Shellfish.pdf
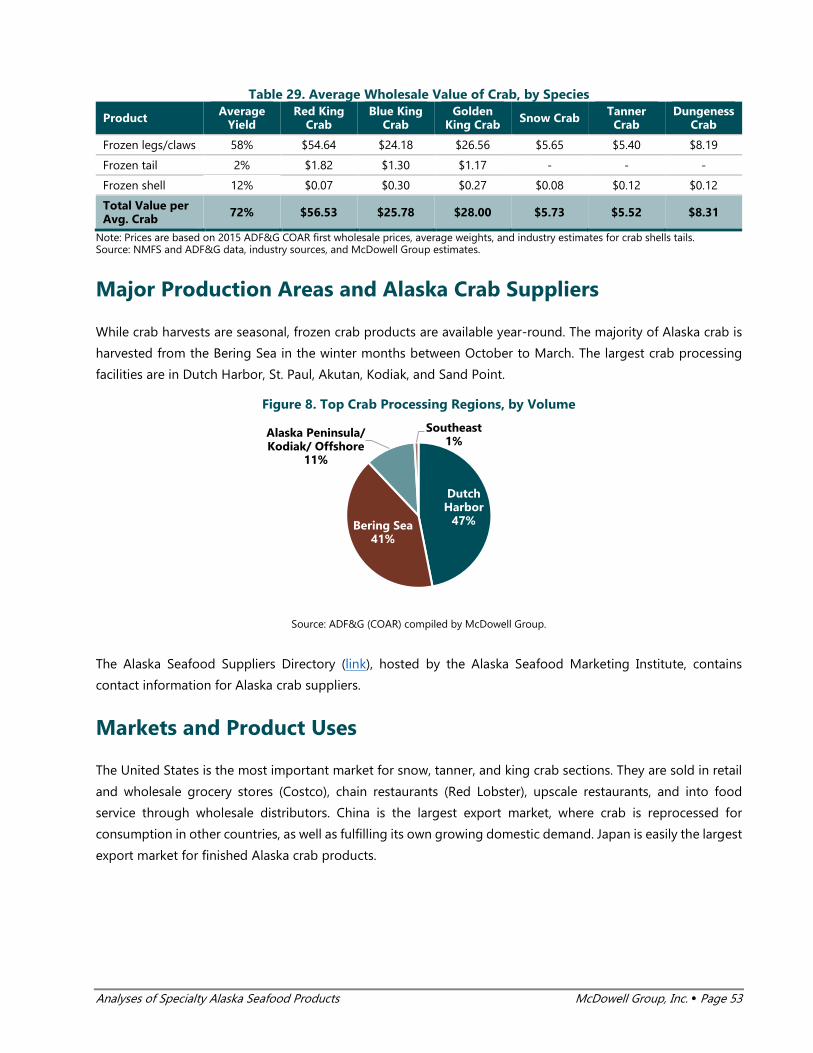
Analyses of Specialty Alaska Seafood Products McDowell Group, Inc. Page 53
Table 29. Average Wholesale Value of Crab, by Species
Product Average Yield
Red King Crab
Blue King Crab
Golden King Crab Snow Crab Tanner
Crab Dungeness
Crab
Frozen legs/claws 58% $54.64 $24.18 $26.56 $5.65 $5.40 $8.19
Frozen tail 2% $1.82 $1.30 $1.17 - - -
Frozen shell 12% $0.07 $0.30 $0.27 $0.08 $0.12 $0.12
Total Value per Avg. Crab 72% $56.53 $25.78 $28.00 $5.73 $5.52 $8.31
Note: Prices are based on 2015 ADF&G COAR first wholesale prices, average weights, and industry estimates for crab shells tails. Source: NMFS and ADF&G data, industry sources, and McDowell Group estimates.
Major Production Areas and Alaska Crab Suppliers
While crab harvests are seasonal, frozen crab products are available year-round. The majority of Alaska crab is
harvested from the Bering Sea in the winter months between October to March. The largest crab processing
facilities are in Dutch Harbor, St. Paul, Akutan, Kodiak, and Sand Point.
Figure 8. Top Crab Processing Regions, by Volume
Source: ADF&G (COAR) compiled by McDowell Group.
The Alaska Seafood Suppliers Directory (link), hosted by the Alaska Seafood Marketing Institute, contains
contact information for Alaska crab suppliers.
Markets and Product Uses
The United States is the most important market for snow, tanner, and king crab sections. They are sold in retail
and wholesale grocery stores (Costco), chain restaurants (Red Lobster), upscale restaurants, and into food
service through wholesale distributors. China is the largest export market, where crab is reprocessed for
consumption in other countries, as well as fulfilling its own growing domestic demand. Japan is easily the largest
export market for finished Alaska crab products.
Dutch Harbor
47%Bering Sea41%
Alaska Peninsula/ Kodiak/ Offshore
11%
Southeast1%

Analyses of Specialty Alaska Seafood Products McDowell Group, Inc. Page 54
Potential Markets for Crab Shells
Crabs carry an inedible exoskeleton shell that contains chitin, which is one of the most abundant biodegradable
materials in the world. Chitin has anti-bacterial, anti-fungal, and anti-viral
properties and is insoluble in water.34 The amount of chitin present in the
shell is determined by the type and quality of the shell.
Chitin is worth approximately $3-6 per kilo and chitosan, a refined derivative
of chitin, is worth approximately $15-20 per kilo.35 Chitin/chitosan prices
have ranged from $10 to $3,000 per pound, depending on the quality grade.
Chitin from Alaska crab shells has the potential to be one of the most
lucrative by-products due to its high demand in a diverse set of industries.36
Uses for chitin and chitosan products include, but are not limited to:
• Blood clotting products in the medical field37
• Craft brewing fining agent38
• Pool water clarifier39
• Food preservation40
• Textile treatment41
• Antibacterial fabric component42
• Weight loss supplement43
• Agricultural fungicide treatment44
New uses for chitin-based products are being discovered which could
enhance the value of raw material.
34 http://www.sumanfoodconsultants.com/pdf/pdf_chitosan_abstract_ensymm.pdf 35 http://www.sumanfoodconsultants.com/pdf/pdf_chitosan_abstract_ensymm.pdf 36 https://www.adn.com/business-economy/2016/06/24/wringing-profit-from-crab-shells-starts-with-tidal-grow/ 37http://www.globalindustrial.com/p/safety/first-aid/bandages-dressings/hemostatic-gauze-pad-8-x-8-pad-0711gzp?infoParam.campaignId=T9F&gclid=CMOb6Oi47dICFZJffgodHiEDmg 38 http://tidalvisionusa.com/fining-agent/ 39 http://tidalvisionusa.com/crystal-clarity/ 40 http://waset.org/publications/6320/a-review-on-application-of-chitosan-as-a-natural-antimicrobial 41 http://www.teonline.com/knowledge-centre/chitin-chitosan.html 42 https://www.adn.com/business-economy/2016/06/24/wringing-profit-from-crab-shells-starts-with-tidal-grow/ 43 http://www.xtend-life.com/information/ingredients/chitin 44 http://o2yscorp.com/o1-ys/
Overview of Chitin and Chitosan Extraction Process
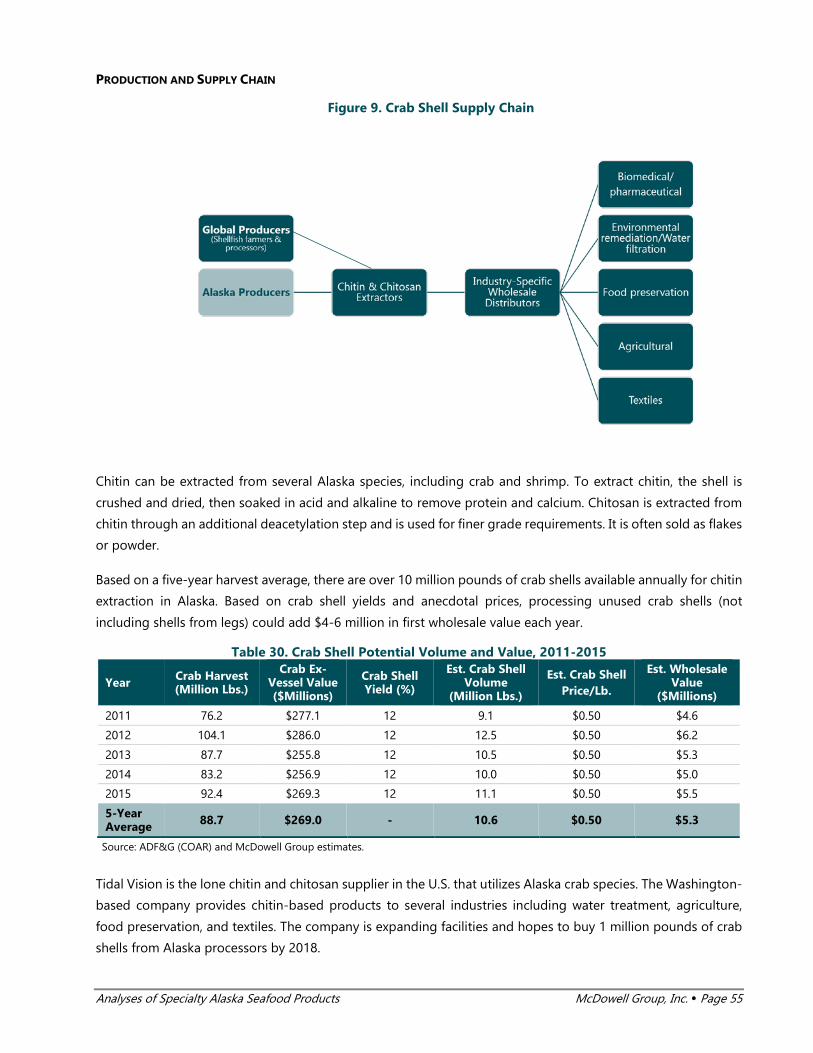
Analyses of Specialty Alaska Seafood Products McDowell Group, Inc. Page 55
PRODUCTION AND SUPPLY CHAIN
Figure 9. Crab Shell Supply Chain
Chitin can be extracted from several Alaska species, including crab and shrimp. To extract chitin, the shell is
crushed and dried, then soaked in acid and alkaline to remove protein and calcium. Chitosan is extracted from
chitin through an additional deacetylation step and is used for finer grade requirements. It is often sold as flakes
or powder.
Based on a five-year harvest average, there are over 10 million pounds of crab shells available annually for chitin
extraction in Alaska. Based on crab shell yields and anecdotal prices, processing unused crab shells (not
including shells from legs) could add $4-6 million in first wholesale value each year.
Table 30. Crab Shell Potential Volume and Value, 2011-2015
Year Crab Harvest (Million Lbs.)
Crab Ex-Vessel Value ($Millions)
Crab Shell Yield (%)
Est. Crab Shell Volume
(Million Lbs.)
Est. Crab Shell Price/Lb.
Est. Wholesale Value
($Millions)
2011 76.2 $277.1 12 9.1 $0.50 $4.6
2012 104.1 $286.0 12 12.5 $0.50 $6.2
2013 87.7 $255.8 12 10.5 $0.50 $5.3
2014 83.2 $256.9 12 10.0 $0.50 $5.0
2015 92.4 $269.3 12 11.1 $0.50 $5.5
5-Year Average 88.7 $269.0 - 10.6 $0.50 $5.3
Source: ADF&G (COAR) and McDowell Group estimates.
Tidal Vision is the lone chitin and chitosan supplier in the U.S. that utilizes Alaska crab species. The Washington-
based company provides chitin-based products to several industries including water treatment, agriculture,
food preservation, and textiles. The company is expanding facilities and hopes to buy 1 million pounds of crab
shells from Alaska processors by 2018.
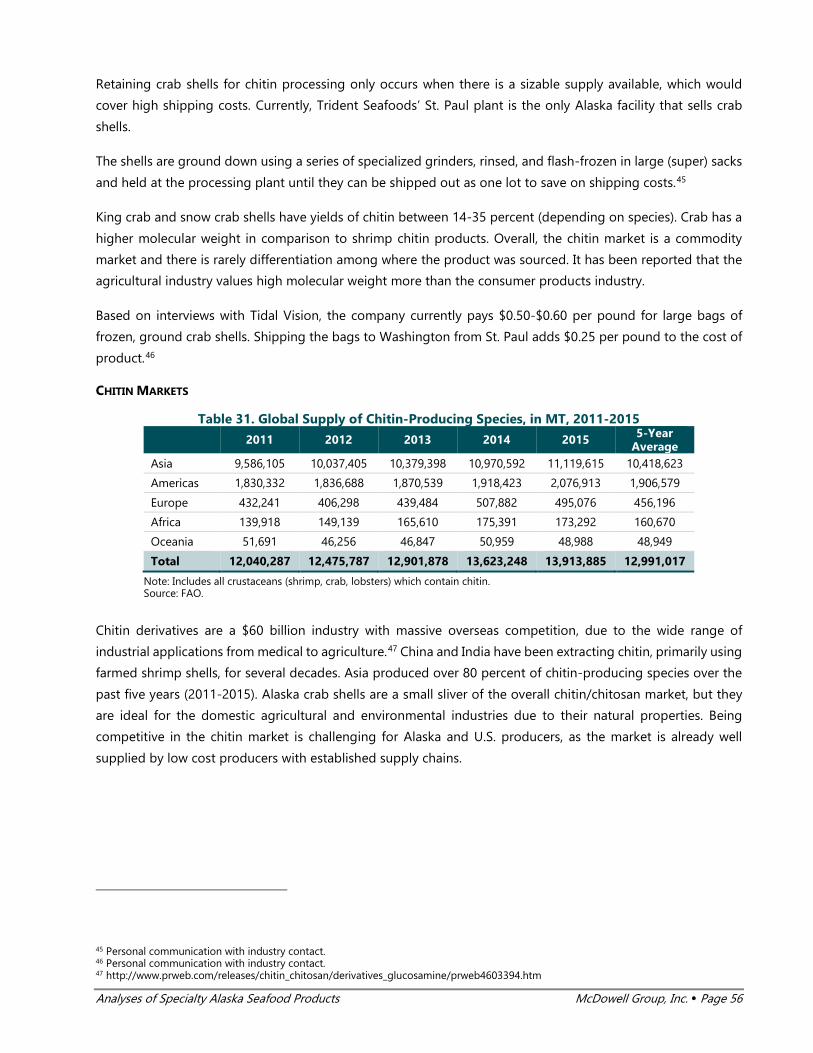
Analyses of Specialty Alaska Seafood Products McDowell Group, Inc. Page 56
Retaining crab shells for chitin processing only occurs when there is a sizable supply available, which would
cover high shipping costs. Currently, Trident Seafoods’ St. Paul plant is the only Alaska facility that sells crab
shells.
The shells are ground down using a series of specialized grinders, rinsed, and flash-frozen in large (super) sacks
and held at the processing plant until they can be shipped out as one lot to save on shipping costs.45
King crab and snow crab shells have yields of chitin between 14-35 percent (depending on species). Crab has a
higher molecular weight in comparison to shrimp chitin products. Overall, the chitin market is a commodity
market and there is rarely differentiation among where the product was sourced. It has been reported that the
agricultural industry values high molecular weight more than the consumer products industry.
Based on interviews with Tidal Vision, the company currently pays $0.50-$0.60 per pound for large bags of
frozen, ground crab shells. Shipping the bags to Washington from St. Paul adds $0.25 per pound to the cost of
product.46
CHITIN MARKETS
Table 31. Global Supply of Chitin-Producing Species, in MT, 2011-2015
2011 2012 2013 2014 2015 5-Year
Average Asia 9,586,105 10,037,405 10,379,398 10,970,592 11,119,615 10,418,623
Americas 1,830,332 1,836,688 1,870,539 1,918,423 2,076,913 1,906,579
Europe 432,241 406,298 439,484 507,882 495,076 456,196
Africa 139,918 149,139 165,610 175,391 173,292 160,670
Oceania 51,691 46,256 46,847 50,959 48,988 48,949
Total 12,040,287 12,475,787 12,901,878 13,623,248 13,913,885 12,991,017
Note: Includes all crustaceans (shrimp, crab, lobsters) which contain chitin. Source: FAO.
Chitin derivatives are a $60 billion industry with massive overseas competition, due to the wide range of
industrial applications from medical to agriculture.47 China and India have been extracting chitin, primarily using
farmed shrimp shells, for several decades. Asia produced over 80 percent of chitin-producing species over the
past five years (2011-2015). Alaska crab shells are a small sliver of the overall chitin/chitosan market, but they
are ideal for the domestic agricultural and environmental industries due to their natural properties. Being
competitive in the chitin market is challenging for Alaska and U.S. producers, as the market is already well
supplied by low cost producers with established supply chains.
45 Personal communication with industry contact. 46 Personal communication with industry contact. 47 http://www.prweb.com/releases/chitin_chitosan/derivatives_glucosamine/prweb4603394.htm

Analyses of Specialty Alaska Seafood Products McDowell Group, Inc. Page 57
One of the largest challenges for the domestic market is to dispel the belief that chitin products still contain
allergens. The process of extracting chitin removes the shellfish allergen, making it hypoallergenic.48 However,
chitin producers are required by law to display that their product is produced in a facility that handles shellfish.
This is a larger issue for food preservation products.
KEY CHITIN/CHITOSAN COMPANIES
• Some of the major buyers of chitin and chitosan products:
o Tidal Vision, USA: Environmentally-friendly chitin and chitosan producer that sources crab
shells from Alaska. Only current buyer of Alaska crab shells. Plans to scale up production.
o GTC Bio Corporation, China: Likely the largest and most diverse chitin and chitosan product
supplier for all industries.49
o Heppe Medical Chitosan GmbH, Germany: medical products derived from chitin and
chitosan.50
o JRW Bioremediation, USA: environmentally friendly products to remediate contaminated soil
that includes a chitin buffering agent for excavations and mine drainage.51
o Dungeness Environmental, USA: chitosan-based water purification polymers for construction
and industrial markets.52
Potential Markets for Crab Tails
There is limited data available on crab tail prices, export volume, and
demand. This analysis is based largely on discussions with industry
insiders.
King crabs have a section of meat lining the shell (referred to as the
“tail”) that is processed by hand and contains edible meat. In recent
years, demand for all crab products has increased, leading to a sharp
price increase for crab tails. More processing companies have recently
begun to extract crab tails now that there are industry reports of crab
tails priced at $15 per pound.
48 Hypoallergenic means it is unlikely to cause an allergic reaction. 49 http://www.bestchitosan.com/e_products/ 50 https://www.gmp-chitosan.com/en/company.html 51 https://www.environmental-expert.com/products/chitorem-chitin-complex-inherent-buffering-agent-191130 52 https://www.environmental-expert.com/companies/dungeness-environmental-37790
King crab tail meat pulled from tail. Source: ideasinfood.com.

Analyses of Specialty Alaska Seafood Products McDowell Group, Inc. Page 58
PRODUCTION AND SUPPLY CHAIN
Figure 10. Crab Tail Meat Supply Chain
Only king crab have a tail section large enough to process and it had not been commercially utilized until five
to six years ago.
In the last five years, there have been 15.8 million pounds of king crab harvested per year in Alaska. Crab tail
yield, based on interviews with industry experts, is approximately 2 percent of king crab round weight. Prices
have been reported as low as $3 per pound before growing popularity pushed prices up to $15 per pound in
2016, but the latter is the peak and industry is assuming the price will decline due to markets resisting crab tails
at that price point. Assuming a wholesale price of $13/lb. and full crab tail utilization, the potential first wholesale
value of selling king crab tails is approximately $4 million.
In the past, it has been hard to maintain a supply of crab tails for two reasons: processors do not think it is
lucrative to pull and freeze crab tails, and the demand is inconsistent. Crab tails are picked at St. Paul, Akutan,
and Kodiak when it is available.
Table 32. King Crab Tail Volume and Potential Value, 2011-2015
King Crab Harvest
(Million Lbs.)
Crab Ex-Vessel Value ($Millions)
Crab Tail Yield (%)
Crab Tail Volume
(Million Lbs.)
Crab Tail Price/Lb.
Est. Wholesale
Value ($Millions)
2011 15.6 $123.5 2% 0.3 $13 $4.1
2012 14.8 $86.3 2% 0.3 $13 $3.9
2013 15.1 $87.8 2% 0.3 $13 $3.9
2014 16.6 $95.9 2% 0.3 $13 $4.3
2015 15.6 $104.0 2% 0.3 $13 $4.0
Average 15.6 $99.5 - 0.3 $13.0 $4.0
Source: ADF&G (COAR) and McDowell Group estimates.
Processors typically cook the tail meat, pack it into blocks that are frozen in a plate freezer, and ship it. Most
crab is frozen in a brine, which is preferred in the U.S. market because it gives the crab a salty taste and makes
the meat easier to remove.

Analyses of Specialty Alaska Seafood Products McDowell Group, Inc. Page 59
MARKETS
There is limited information on end markets for crab tail meat, but it is a highly versatile product that freezes
well and is an economical substitute for crab leg meat in dishes. Alaska processors sell 100 percent of crab tail
meat into the U.S. market.
Crab tails are distributed as a gourmet seafood product and it is used as a lower cost ingredient in popular crab
meat dishes such as soups/chowders, crab cakes, and as a topping for salads. It has been used as a surimi
ingredient.53
Pickled Willy’s in Kodiak has a specialty crab tail product priced at $29 for 2 to 3 oz.54
Market Opportunities for Additional Crab Products
Other specialty products from crab have been developed in Asia, including crab miso from crab blood, snow
crab paste in Korea, and minced crab product for value-added products like crab cakes.
53 Personal communication with industry contact. 54 Pickled Willy’s in Kodiak has a specialty crab tail product priced at $29 per 2-3 oz. container.
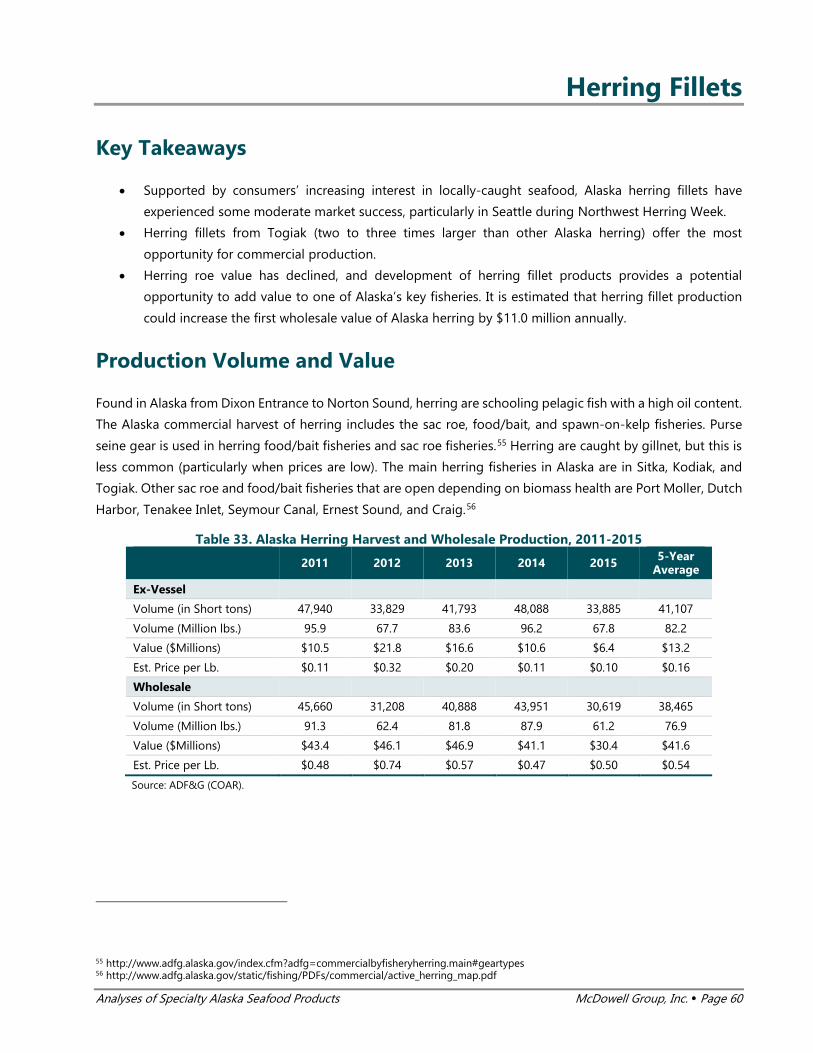
Analyses of Specialty Alaska Seafood Products McDowell Group, Inc. Page 60
Herring Fillets
Key Takeaways
• Supported by consumers’ increasing interest in locally-caught seafood, Alaska herring fillets have
experienced some moderate market success, particularly in Seattle during Northwest Herring Week.
• Herring fillets from Togiak (two to three times larger than other Alaska herring) offer the most
opportunity for commercial production.
• Herring roe value has declined, and development of herring fillet products provides a potential
opportunity to add value to one of Alaska’s key fisheries. It is estimated that herring fillet production
could increase the first wholesale value of Alaska herring by $11.0 million annually.
Production Volume and Value
Found in Alaska from Dixon Entrance to Norton Sound, herring are schooling pelagic fish with a high oil content.
The Alaska commercial harvest of herring includes the sac roe, food/bait, and spawn-on-kelp fisheries. Purse
seine gear is used in herring food/bait fisheries and sac roe fisheries.55 Herring are caught by gillnet, but this is
less common (particularly when prices are low). The main herring fisheries in Alaska are in Sitka, Kodiak, and
Togiak. Other sac roe and food/bait fisheries that are open depending on biomass health are Port Moller, Dutch
Harbor, Tenakee Inlet, Seymour Canal, Ernest Sound, and Craig.56
Table 33. Alaska Herring Harvest and Wholesale Production, 2011-2015 2011 2012 2013 2014 2015 5-Year
Average
Ex-Vessel
Volume (in Short tons) 47,940 33,829 41,793 48,088 33,885 41,107
Volume (Million lbs.) 95.9 67.7 83.6 96.2 67.8 82.2
Value ($Millions) $10.5 $21.8 $16.6 $10.6 $6.4 $13.2
Est. Price per Lb. $0.11 $0.32 $0.20 $0.11 $0.10 $0.16
Wholesale
Volume (in Short tons) 45,660 31,208 40,888 43,951 30,619 38,465
Volume (Million lbs.) 91.3 62.4 81.8 87.9 61.2 76.9
Value ($Millions) $43.4 $46.1 $46.9 $41.1 $30.4 $41.6
Est. Price per Lb. $0.48 $0.74 $0.57 $0.47 $0.50 $0.54
Source: ADF&G (COAR).
55 http://www.adfg.alaska.gov/index.cfm?adfg=commercialbyfisheryherring.main#geartypes 56 http://www.adfg.alaska.gov/static/fishing/PDFs/commercial/active_herring_map.pdf

Analyses of Specialty Alaska Seafood Products McDowell Group, Inc. Page 61
In the last five years (2011-2015), an annual average of 41,107 short tons (82.2 million lbs.) of herring were
harvested in Alaska worth an average of $13.2 million and $41.6 million at the ex-vessel and wholesale levels,
respectively.57
Most herring caught in Alaska are targeted for their roe. This means the males essentially have no value;
however, processors typically do not sort herring by sex prior to sale. The majority of product is sold as a frozen
whole fish, ocean run product. Later, secondary processors in Asia sort the fish by sex and “pop” the female roe
sacks for processing. Males are often ground into fishmeal, sold as bait, or discarded. Historically, herring roe
was a highly valuable export product. In recent years, prices for herring roe have fallen considerably and much
of the value has disappeared.
Togiak herring are the only herring in Alaska large enough to develop products like herring fillets. Herring in
Togiak are 2-3 times as large as herring in the Gulf of Alaska: Togiak herring are between 400-450 grams in
round weight and herring in the Gulf of Alaska are between 120-130 grams.58 Herring fillets (primarily from
Togiak) are between 80-100 grams, and the recovery weight is 40 percent from round weight.59 The Togiak sac
roe herring fishery is usually the largest in Alaska by volume; 21,594 short tons were harvested in 2015, nearly
64 percent of the total Alaska harvest.60
In 2015, four buyers in Togiak purchased herring from 24 vessels. In the last decade, processors have utilized
cooperative fleets for the purse seine fishery to maximize efficiency under current market conditions and
biomass estimates.61
Figure 11. Togiak Sac Roe Herring Fishery Volume and Value, 1995-2015
Note: Values are nominal. Volume figures are denominated in short tons. Source: ADF&G.
57 Tons refers to short tons (2,000 pounds), not metric tons (MT). 58 Personal communication with industry contact. 59 Personal communication with industry contact. 60 https://www.adfg.alaska.gov/static/applications/dcfnewsrelease/535393070.pdf 61 http://www.adfg.alaska.gov/FedAidPDFs/FMR16-13.pdf
$0
$5
$10
$15
$20
$25
0
5,000
10,000
15,000
20,000
25,000
30,000
35,000
1995
1996
1997
1998
1999
2000
2001
2002
2003
2004
2005
2006
2007
2008
2009
2010
2011
2012
2013
2014
2015
Ex-V
esse
l Val
ue ($
Mill
ions
)
GHL
and
Har
vest
(t)
GHL (t) Harvest (t) Ex-Vessel Value ($Millions)

Analyses of Specialty Alaska Seafood Products McDowell Group, Inc. Page 62
Alaska Supply, Seasonality, and Suppliers
Herring harvests in Alaska are highly seasonal. Commercial harvest of herring take place in the spring when the
fish begin to school near shore prior to spawning. Due to State of Alaska budget cuts, the 2017 Togiak herring
GHL was based on previous years’ biomass estimates and a cautionary decrease of 10 percent, instead of a
current stock assessment.62
Table 34. 2015 Commercial Herring Seasons by Major Production Area
Area 2015
Harvest (t) 2015
GHL (t) Value
($Millions) Season
Sitka 8,756 8,712 $2.2 Mid-March
Kodiak 357 3,190 $0.04 Mid-April
Togiak 21,594 29,013 $1.1 Late April to Mid-May
Source: ADF&G.
The Alaska Seafood Suppliers Directory (link), hosted by the Alaska Seafood Marketing Institute, contains
contact information for Alaska herring suppliers.
Nutritional profile
Pacific herring typically have less oil content than Atlantic herring. While oil content varies with the spawning
cycle, the average Togiak herring fillet has a 10 percent oil content.63 Sac roe herring have less oil content than
the food and bait herring. A 100-gram herring consists of 2.3 g ash and 72 g water.64
Table 35. Pacific Herring Nutrition Amount per
100g portion
Calories 195
Protein 16 g
Total Fat 14 g
Saturated Fat 3.3 g
Carbohydrate 0 g
Sugar 0 g
Fiber 0 g
Cholesterol 77 mg
Source: Nutritionvalue.org.
62 https://www.undercurrentnews.com/2016/10/12/alaska-herring-quota-reduced-amid-budget-cut/ 63 Personal communication with industry contact. 64 https://www.nutritionvalue.org/Fish,_raw,_Pacific,_herring_nutritional_value.html

Analyses of Specialty Alaska Seafood Products McDowell Group, Inc. Page 63
Supply Chain
Sac roe herring are typically transported from Alaska in 15 lb. bags. Due to the cost of shipping and processing,
herring are frozen whole and shipped to Seattle, China, or Japan, where they are distributed to secondary
processors, roe producers, or bait manufacturers. Not all Alaska processors sex-sort, which is more commonly
used when roe prices are high.
Figure 12. Alaska Herring Supply Chain
Secondary processing, which includes roe-popping, occurs in China if prices are low, and Japan, if prices are
high. Ultimately, roe product is sent to Japan, where it is graded by quality and distributed among domestic
markets for traditional gifts, global sushi suppliers, and grocery stores. The accompanying fillets are sold as
inexpensive staples in Japan and China.
Shipping costs vary, but the average price per pound can be $0.20 or more from Bristol Bay to Seattle, more
than the 2015 ex-vessel value $0.06 per pound for the sac roe fishery.65,66
Herring Fillet Production
Estimates for herring fillet prices range from $1.00 to $3.00 per pound at the first wholesale level. It is estimated
that fillet production in Togiak could bring an additional $14.5 million in first wholesale value. This is built on
the assumption that all males (half of the harvest) would be filleted with a yield of 40 percent and sold for $1.50
per pound (FOB Bristol Bay).
See table on following page.
65 http://www.adfg.alaska.gov/index.cfm?adfg=commercialbyfisheryherring.herringcatch_statewide 66 Personal communication with industry contact.

Analyses of Specialty Alaska Seafood Products McDowell Group, Inc. Page 64
Table 36. Potential Additional First Wholesale Value from Togiak Herring Fillets
Togiak Herring Harvest* 21,956 t
Primary Product Frozen Whole Fish
Recovery Rate 40% of Males
Est. Wholesale Price Per Lb. $1.50
Wholesale Volume 4,391 t
Est. Wholesale Value $14.5 million
Notes: Togiak harvest volume is based on a 10-year average. Assumes only males are filleted. Source: ADF&G, McDowell Group Estimates.
Ocean Beauty Seafoods and the Alaska Seafood Marketing Institute purchased a herring fillet machine from an
Eastern Canadian seafood producer several years ago. The machine is operating in Togiak as a small,
experimental fillet line. It was originally purchased to fillet herring prior to canning. Current production of Alaska
herring fillets is relatively small, with several thousand pounds being produced to support market development
efforts.
Due to high oil content, herring fillets do not freeze well. Herring fillets are often cured, a process which firms
and shrinks the flesh. Shipping and processing costs are major hurdles to developing a fillet production line. In
addition to high shipping costs, investing in a fillet machine can cost upwards of $150,000 alone.
Herring Fillet Markets
The largest markets for herring are in Scandinavian and Northern and Eastern European countries, including
Poland, Russia, Germany, and Norway, where it is a traditional mainstay.67 Demand for herring fillet products is
highest during the holiday season (November-January).68 In Europe, herring fillets are commonly sold in a lightly
brined vacuum pack. Europeans typically consume herring fillets after thawing frozen product, which reduces
the firmness of the meat.
North Americans do not have the same taste preferences and herring is typically sold as pickled product in jars
or in tins as kippered or smoked product. Most of the herring consumed in the U.S. comes from Northeast
states or is imported from Canada. In the last five years (2010-2014), the U.S. imported an annual average of
21,287 MT, with 66 percent sourced from eastern Canada (see Table 37). Regionally, the Northeast and Midwest
are the largest markets for kippered/smoked and pickled herring. The Midwest also has a small market for fresh
herring fillets from Lake Superior fish.69 Niche herring markets also exist on the West Coast.
Table 37. U.S. Herring Imports, in MT and $Millions, 2010-2014
Region 2010 2011 2012 2013 2014 5 Year Average
Canada 17,381 14,878 13,546 12,838 11,906 14,110
67 http://www.foodandwine.com/recipes/herring-under-fur-coat 68 Personal communication with industry contact. 69 http://www.olsenfish.com/

Analyses of Specialty Alaska Seafood Products McDowell Group, Inc. Page 65
Germany 1,202 1,362 2,072 2,866 986 1,698
Norway 3,543 2,026 669 668 557 1,493
Poland 524 547 407 732 741 590
Other 4,229 2,633 2,891 2,589 4,642 3,397
Total 26,880 21,446 19,584 19,693 18,831 21,287
Canada $32.7 $35.0 $36.0 $37.0 $36.4 $35.4
Germany $5.8 $6.9 $7.8 $5.4 $5.4 $6.3
Norway $11.3 $6.1 $1.6 $1.5 $1.3 $4.4
Poland $1.6 $1.9 $1.5 $2.8 $3.0 $2.2
Other $19.4 $14.0 $10.3 $10.0 $12.6 $13.2
Total $70.7 $63.9 $57.1 $56.8 $58.8 $61.5
Note: Number may not sum due to rounding. Source: NMFS trade data.
Northwest Herring Week is a weeklong promotion in Seattle where participating grocers and restaurants create
herring dishes using Togiak herring.70 With a nod to its iconic fishing history, Seattle’s restaurant scene has
recreated traditional herring dishes with a modern twist. Togiak herring is sent in IQF fillets to Seattle restaurants
for $3.50/lb. One of the participating restaurants, Old Ballard Liquor Co., sells several herring products by the
pound: $5.00 for frozen, $7.00 for salted, $9.00 for pickled. Promoters of Herring Week have plans to expand to
the greater Pacific Northwest.
Herring fillets are also consumed in Japan, where pickled and fresh herring are used as sushi toppings.71 Herring
is called nishin in Japan. Fillets are also used in noodle soups (e.g. Nishin soba recipe). Like other small pelagic
fish, herring are grilled whole in Japan (often with the entrails remaining in the fish). Alaska herring fillets have
been sold to Japanese buyers in 15 lb. boxes in small batches.
ASMI’s Role
• Alaska is a minor herring producer, compared to other regions. Promoting Alaskan herring in the U.S.
market (particularly the West Coast) likely provides the best potential, as the attributes of Alaska
seafood resonate well with U.S. consumers and the fish has a historic aura in West Coast cities.
• The biggest challenges for fillet production in Alaska is competing with low prices of Canadian suppliers.
In addition, the softer flesh quality of Alaska herring, high transportation costs, and the lack of
infrastructure in Alaska to handle herring fillet production are major obstacles.
• Companies that use Canadian herring in their product line are not aware of the supply, size grades, and
the quality of Alaska herring.72 ASMI’s role could be to bring awareness to major distributors on the
West Coast.
70 https://nwherringweek.com/ 71 http://www.oprah.com/own-anna-kristina-grocery-bag/bo-sushi-with-herring 72 Personal communication with industry contact.

Analyses of Specialty Alaska Seafood Products McDowell Group, Inc. Page 66
Competing Supply
Over five years (2010-2014), herring harvests averaged 2.9 million MT (6.5 billion lbs.) globally, with
approximately one-fifth (22 percent) attributed to Chilean herring that is used in fish oil reduction. Major Atlantic
herring producers have seen a decline in TACs in the last few years, resulting in a slight price increase for herring
markets in Europe. European countries, as a block, are the largest herring producers in the world.
Table 38. World Herring Production, in MT, 2010-2014
Region 2010 2011 2012 2013 2014 5-Year Average
Chile 750,750 887,272 848,466 236,968 543,278 653,347
Norway 923,741 633,103 610,713 507,465 407,424 616,489
Russia 430,771 450,464 487,740 476,191 440,568 457,147
Iceland 254,476 198,463 115,181 157,537 157,895 176,710
Canada 159,411 142,219 123,379 140,134 137,787 140,586
USA 114,520 125,015 122,203 134,865 139,420 127,205
Alaska 47,156 39,455 27,841 34,396 39,576 37,685
Denmark 77,445 85,934 125,117 141,028 135,580 113,021
Finland 92,757 98,002 117,866 122,318 131,116 112,412
United Kingdom 66,891 61,570 90,419 93,570 97,683 82,027
Other 414,477 382,938 432,074 554,250 462,486 449,245
Total 3,285,239 3,064,980 3,073,158 2,564,326 2,653,237 2,965,873
Source: FAO, ADF&G (COAR).
In North America, Canada and the U.S. produce similar quantities of herring. Most herring caught in Canada
and the U.S. is harvested from the Atlantic Ocean during the winter months, long before herring begin to spawn.
However, both countries have fisheries for Pacific Herring that primarily focus on roe products. East Coast
producers (in Canada and the U.S.) produce both fresh and frozen herring fillets. Eastern Canadian producers
(Barry Group) offer a brined fillet product that is shipped in a drum to secondary processors for $1.00/lb.73,74
73 Personal communication with industry contact. 74 http://www.barrygroupinc.com/pdf/Herring.pdf

Analyses of Specialty Alaska Seafood Products McDowell Group, Inc. Page 67
Arrowtooth Flounder
Key Takeaways
• Arrowtooth flounder is one of the most abundant groundfish in Alaska, with the largest biomass of any
groundfish species in the Gulf of Alaska.
• Arrowtooth flesh often contains an enzyme that is activated when the fish experiences even low levels
of heat resulting in extremely soft, poor flesh quality. Low value fillets are practically a by-product of
processing engawa, a thin strip of outer frill meat from flatfish highly valued by sushi chefs. However,
because the fish is generically marketed as “flounder” poor consumer experiences with Arrowtooth
lowers demand for other Alaska flatfish, such as sole and plaice.
• Arrowtooth flounder oil is an untapped opportunity. Its oil has been described as translucent, high
quality oil that could make an attractive source for nutraceutical or cosmetic products.
• For every metric ton of age-6+ (exploitable) Pacific halibut in Alaska waters in 2016, there was an
estimated 10.7 metric tons of Arrowtooth flounder. In 2000, there was only 3.1 metric tons of
Arrowtooth flounder per ton of exploitable halibut. The ratio of Arrowtooth-to-halibut has increased
250 percent since 1996.
• Arrowtooth’s large population likely suppresses Pacific halibut populations in numbers and fish growth
rate due to competition for habitat and food. A concerted effort by industry and fishery managers to
significantly increase Arrowtooth harvests, while minimizing halibut bycatch mortality, could raise
Arrowtooth value and provide better growth prospects for halibut populations.
Arrowtooth Flounder Harvest, TACs, and Biomass Estimates
A large biomass of Arrowtooth flounder exists in the Gulf of Alaska and Bering Sea. TACs are typically set well
below the Acceptable Biological Catch (ABC) for several reasons. In the Bering Sea, the 2 million metric ton limit
on all groundfish harvests limits the amount of TAC allocated to Arrowtooth. Harvests are generally well below
the TAC in both regions due to the relatively high rate of halibut bycatch, as well as the species’ low value.
Improvements to fishery management and operational practices have increased the percentage of biomass
harvested in recent years.
Table 39. BSAI and GOA Arrowtooth Flounder TAC and Biomass, 2006-2016
Year Catch (MT)
TAC (MT)
ABC (MT)
Biomass (MT)
Pct. TAC of Biomass
2006 41,014 51,000 313,844 3,028,997 1.7%
2007 37,281 63,000 342,008 3,097,355 2.0%
2008 51,177 118,000 470,470 3,146,778 3.7%
2009 53,851 118,000 377,512 3,173,005 3.7%
2010 61,896 118,000 371,882 3,145,910 3.8%
2011 61,056 86,600 366,150 3,074,914 2.8%
2012 52,598 146,000 362,882 3,017,642 4.8%
2013 49,887 138,300 362,451 2,999,852 4.6%
2014 60,593 135,400 301,957 3,018,362 4.5%
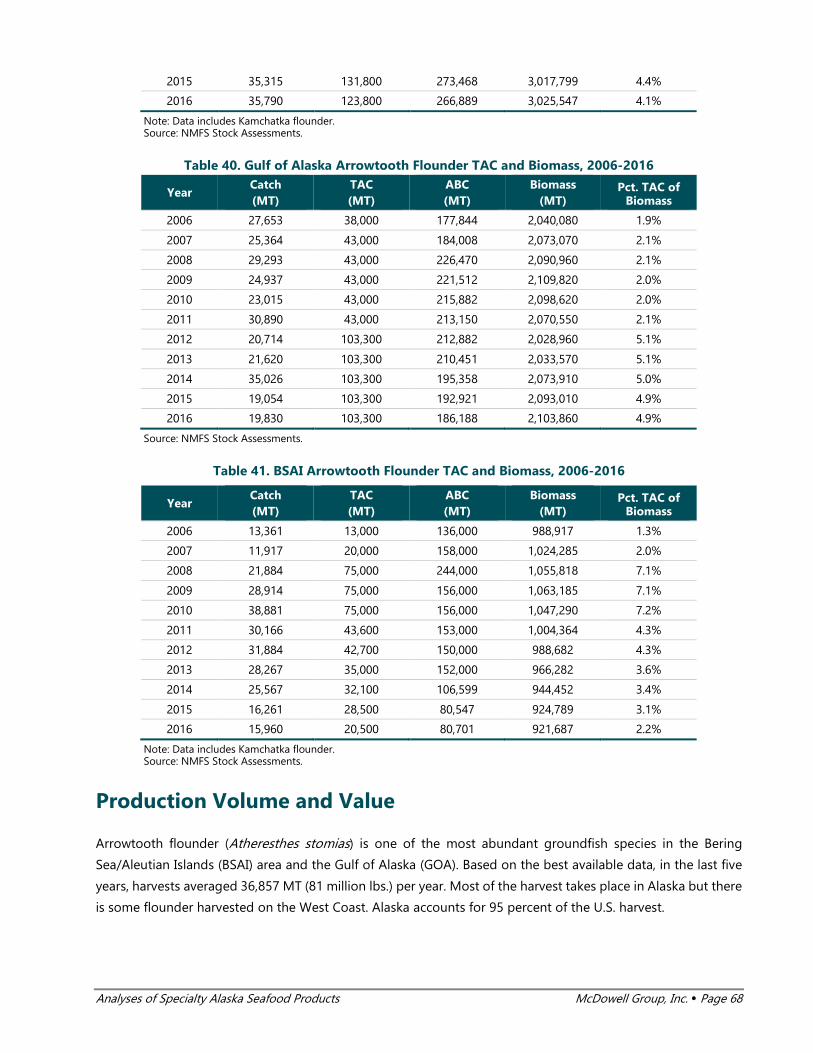
Analyses of Specialty Alaska Seafood Products McDowell Group, Inc. Page 68
2015 35,315 131,800 273,468 3,017,799 4.4%
2016 35,790 123,800 266,889 3,025,547 4.1%
Note: Data includes Kamchatka flounder. Source: NMFS Stock Assessments.
Table 40. Gulf of Alaska Arrowtooth Flounder TAC and Biomass, 2006-2016
Year Catch (MT)
TAC (MT)
ABC (MT)
Biomass (MT)
Pct. TAC of Biomass
2006 27,653 38,000 177,844 2,040,080 1.9%
2007 25,364 43,000 184,008 2,073,070 2.1%
2008 29,293 43,000 226,470 2,090,960 2.1%
2009 24,937 43,000 221,512 2,109,820 2.0%
2010 23,015 43,000 215,882 2,098,620 2.0%
2011 30,890 43,000 213,150 2,070,550 2.1%
2012 20,714 103,300 212,882 2,028,960 5.1%
2013 21,620 103,300 210,451 2,033,570 5.1%
2014 35,026 103,300 195,358 2,073,910 5.0%
2015 19,054 103,300 192,921 2,093,010 4.9%
2016 19,830 103,300 186,188 2,103,860 4.9%
Source: NMFS Stock Assessments.
Table 41. BSAI Arrowtooth Flounder TAC and Biomass, 2006-2016
Year Catch (MT)
TAC (MT)
ABC (MT)
Biomass (MT)
Pct. TAC of Biomass
2006 13,361 13,000 136,000 988,917 1.3%
2007 11,917 20,000 158,000 1,024,285 2.0%
2008 21,884 75,000 244,000 1,055,818 7.1%
2009 28,914 75,000 156,000 1,063,185 7.1%
2010 38,881 75,000 156,000 1,047,290 7.2%
2011 30,166 43,600 153,000 1,004,364 4.3%
2012 31,884 42,700 150,000 988,682 4.3%
2013 28,267 35,000 152,000 966,282 3.6%
2014 25,567 32,100 106,599 944,452 3.4%
2015 16,261 28,500 80,547 924,789 3.1%
2016 15,960 20,500 80,701 921,687 2.2%
Note: Data includes Kamchatka flounder. Source: NMFS Stock Assessments.
Production Volume and Value
Arrowtooth flounder (Atheresthes stomias) is one of the most abundant groundfish species in the Bering
Sea/Aleutian Islands (BSAI) area and the Gulf of Alaska (GOA). Based on the best available data, in the last five
years, harvests averaged 36,857 MT (81 million lbs.) per year. Most of the harvest takes place in Alaska but there
is some flounder harvested on the West Coast. Alaska accounts for 95 percent of the U.S. harvest.

Analyses of Specialty Alaska Seafood Products McDowell Group, Inc. Page 69
Table 42. Alaska and U.S. Arrowtooth Flounder Harvest, in Metric Tons, 2011-2015
2011 2012 2013 2014 2015 5 Year Average
BSAI Catch 20,133 22,378 20,537 19,105 11,267 18,684
GOA Catch 30,950 20,573 21,619 36,290 19,054 25,697
Total Alaska Catch 51,083 42,951 42,156 55,395 30,321 44,381
Total Alaska Retained Harvest 40,247 34,908 33,013 49,583 26,534 36,857
West Coast Harvest 2,237 2,182 1,963 1,214 1,331 1,785
Total U.S. Harvest 42,484 37,090 34,976 50,797 27,865 38,642
Pct. Alaska of Total Harvest 95% 94% 94% 98% 95% 95%
Note: Alaska Catch includes entire catch with both discards and retained arrowtooth flounder catch. Source: NMFS FAKR Catch Reports, NMFS FAKR Groundfish Retained and Discarded, NMFS Landings.
The Amendment 80 fleet harvests most of the Arrowtooth flounder in the Bering Sea and the Gulf of Alaska as
part of a portfolio of target species. Other trawl catcher vessels also harvest significant volumes of Arrowtooth
flounder in the Gulf of Alaska.
In the last five years, an average of 17,047 MT (47 million lbs.) were processed, worth $26.3 million in first
wholesale value. Fishermen receive between $.05 to $.07 per pound for Arrowtooth delivered shoreside, or
$164/MT.75 Processed Arrowtooth (typically headed/gutted and tail removed) averaged $1,453 per metric ton
between 2011-2015.
Table 43. Alaska Arrowtooth Flounder Production Volume and First Wholesale Value, 2011-2015
2011 2012 2013 2014 2015 5 Year Avg.
Processed Volume (Million lbs.) 47.0 40.4 24.7 46.5 29.4 37.6
Processed Volume (MT) 21,335 18,308 11,195 21,070 13,325 17,047
First Wholesale Value ($Millions) $31.3 $31.2 $13.5 $32.5 $17.9 $26.3
First Wholesale Value ($/MT) $1,467 $1,704 $1,204 $1,543 $1,346 $1,453
Source: ADFG (COAR).
The Arrowtooth flounder TAC-to-biomass ratio is one of the lowest of all groundfish species, approximately 4
percent in 2015. In contrast, the ratio for Pacific cod and pollock was 14 and 13 percent, respectively, in 2015.76
Arrowtooth flounder is the most abundant groundfish species in the Gulf of Alaska and has a substantial
biomass in the Bering Sea, but TACs do not reflect the species’s abundance for several reasons:
• In the BSAI, the total groundfish TACs are capped at 2 million MT per year, regardless of the size of the
collective biomass of BSAI commercial groundfish species. If current Arrowtooth TACs were to increase,
75 ADFG (COAR) Reports 76 NMFS SAFE

Analyses of Specialty Alaska Seafood Products McDowell Group, Inc. Page 70
other species’ TACs would have to decrease.77 As Arrowtooth flounder are one of the lowest value
Alaska species, the species’s TAC is usually set well below its Acceptable Biological Catch (ABC).
• Arrowtooth flounder catch is also limited by low Kamchatka flounder TACs, which is harvested with
Arrowtooth flounder. Kamchatka flounder is less abundant (for 2015, 6,500 MT TAC in BSAI).78
• Halibut bycatch caps severely limit harvests of Arrowtooth flounder. Both Arrowtooth and Pacific halibut
are relatively large flatfish species that can inhabit the same territory, and are often similar in size
(although older halibut can grow much larger). Halibut excluder devices generally are not effective when
fishermen target Arrowtooth. Therefore, it is challenging to get even close to harvesting the GOA TAC
of 103,300 metric tons, for instance, given that the GOA trawl halibut bycatch limit is 1,706 metric tons.
If the halibut bycatch limit is exceeded, the Arrowtooth trawl fishery is closed for the year by regulation.
• Traditional fishing grounds for Arrowtooth flounder have shifted in recent years and fishermen face a
tradeoff of spending additional time searching for new locations of Arrowtooth or targeting a more
valuable species.
Although Arrowtooth flounder closely resemble smaller halibut, there is a critical difference in meat quality that
results in the former being one of Alaska’s most valuable species and Arrowtooth being one of the lowest.
Halibut meat has a dense, white texture that lends itself well to a variety of preparations, especially frying.
Arrowtooth flounder carry a myxosporean parasite that release a proteolytic enzyme which softens the fish’s
flesh upon landing. Not all Arrowtooth carry the meat-softening parasite, but most do. The only way to
counteract the enzyme is to treat the fish with an additive that partially offsets the enzymatic process, or to keep
the fish just above freezing and then cooking quickly under high heat (such as frying). Unfortunately, both
practices do not completely fix the enzyme problem, and makes harvest and processing much more costly.
Kamchatka flounder is a similar to Arrowtooth flounder, and in fact was treated as Arrowtooth by federal fishery
managers until it was broken out as a distinct species in the Bering Sea flatfish complex several years ago.
Kamchatka flounder has the same enzyme issue as Arrowtooth flounder.
Processing Methods and Alaska Products
Arrowtooth flounder is usually processed onboard as frozen headed/gutted product with the tail removed, or
“HGT.” It has priority onboard catcher-processors to process as soon as possible to limit the enzymatic
breakdown of the flesh. The two factors that greatly reduce the enzymatic breakdown are maintained cold
temperatures and rapid processing to freezing time.
All processing is done through an automated system. Removing the tail is a common market preference for
several flatfish, including Arrowtooth flounder, Greenland turbot, and Kamchatka flounder. The average yield
77 Personal communication with industry contact. 78 NMFS SAFE

Analyses of Specialty Alaska Seafood Products McDowell Group, Inc. Page 71
for H&G is 74 percent.79 A typical Arrowtooth flounder weighs approximately 17 pounds.80 Processors typically
have six size grades, ranging from 400 to 3,000 grams.81
Table 44. Arrowtooth Flounder Yield Rates Avg. Percent from
Round Weight
Gutted only 90
H&G 74
Kirimi 48
Skinless fillet 34
Skinless, boneless fillet 25
Surimi 11
Frill (Engawa) 1-2
Source: Crapo (2004) and the Canadian Utilization of Fish Discards Program (1996).
Major Production Areas
Arrowtooth flounder is abundant in the North Pacific, with the highest concentration harvested in the Central
Gulf of Alaska. In 2015, the TAC was over 103,300 MT (227 million lbs.) for the Gulf of Alaska and 22,000 MT
(48.5 million lbs.) for the Bering Sea and Aleutian Islands.82
Arrowtooth flounder quality is the best near the Aleutian Island Chain; however, the availability of Arrowtooth
in this area has been limited by unknown environmental circumstances or possibly overfishing.83
Seasonal Availability and Suppliers
The Amendment 80 fleet, the primary harvesters of Arrowtooth flounder, operate in the Bering Sea and Gulf of
Alaska nearly year-round.
Interested buyers can easily locate Alaska Arrowtooth flounder suppliers by using the Alaska Seafood Suppliers
Directory (link), hosted by the Alaska Seafood Marketing Institute.
Supply Chain and Markets
Arrowtooth flounder is generally exported to China as frozen whole fish, H&G or HGT product for reprocessing.
It is then re-exported as frozen fillets or breaded/frozen product to Europe, the U.S., and other markets as a low
cost flounder or whitefish product. Finished Arrowtooth fillet product is commonly marketed simply as
79 http://seafood.oregonstate.edu/.pdf%20Links/Recoveries-and-Yields-from-Pacific-Fish-and-Shellfish.pdf 80 http://www.iquiqueus.com/fresh-catch/primary-species/arrowtooth-flounder/ 81 Personal communication with industry contact. 82 http://www.npfmc.org/wp-content/PDFdocuments/resources/SpeciesProfiles2015.pdf 83 Personal communication with industry contact.

Analyses of Specialty Alaska Seafood Products McDowell Group, Inc. Page 72
“flounder.” This has caused consumer confusion and disappointment in some cases, as fillets containing the
flesh-softening enzyme are typically much lower quality than other flounder species.
Figure 13. Arrowtooth Flounder Supply Chain
Frill meat (engawa) is connective muscle that runs along the outer fins and is sliced from under the fin and
packed in frozen shatterpack blocks. Frill yield is estimated at 1-2 percent from round weight.84 Engawa is a low
yield, high value product that has been reportedly sold at $22 per kilo for vacuum sealed product.85 Chinese
reprocessors separate engawa and sell frozen product to distributors that supply sushi restaurants, mostly in
Japan. Larger engawa strips receive higher prices. Engawa is the major profit driver for Chinese Arrowtooth
buyers. However, Chinese processors must utilize the rest of the fish in some manner to cover costs, so this
typically means freezing the fillets and selling them at a low price as generic “flounder.” Unfortunately, poor
quality Arrowtooth fillets give frozen fillets from other flatfish species (e.g. sole) a bad reputation with
consumers, affecting the value for other Alaska sole products.
Arrowtooth flounder is also used as a raw material by Japanese and Korean processors in surimi seafood
products. Utilizing Arrowtooth in surimi products allows producers to work around the effects of the fish’s flesh-
softening enzymatic process.
Table 45. Top Export Destinations of Alaska Flounder, in Metric Tons, 2011-2015
2011 2012 2013 2014 2015 Average Volume
5-Year Average
Value ($Millions)
China 10,110 7,428 10,677 16,317 9,239 10,754 $19.4
Japan 3,955 1,547 1,938 2,550 1,399 2,278 $4.1
South Korea 1,372 3,078 1,216 922 1,218 1,561 $2.7
Russia 383 74 183 177 0 163 $0.3
84 http://www.dfo-mpo.gc.ca/Library/197343.pdf 85 Personal communication with industry contact.

Analyses of Specialty Alaska Seafood Products McDowell Group, Inc. Page 73
Other 5,722 678 412 274 223 1,462 $2.3
Total 21,542 12,805 14,426 20,240 12,079 16,218 $28.8
Note: Data pertains to exports of “Flatfish NSPF Frozen” from Districts 30 and 31. These exports include a variety of flatfish species, primarily caught in Alaska, but are believed to be comprised mostly of Arrowtooth flounder based on industry interviews. Source: NMFS Trade Data.
Global Supply
• Arrowtooth flounder are found in the North Pacific Ocean and are harvested by the U.S., Russia, and
Canada. The U.S. makes up the majority of global harvests (94 percent, on average between 2010-2014).
Table 46. Global Production of Arrowtooth Flounder, in Metric Tons, 2010-2014 2010 2011 2012 2013 2014 5 Year
Average U.S. 49,555 42,592 37,187 34,956 50,811 43,020
Canada 25 7 18 3 11,821 2,375
Russia 376 303 298 394 437 362
Total 49,956 42,902 37,503 35,353 63,069 45,757
Note: Include Kamchatka flounder production. Source: FAO Global Capture Production.
Arrowtooth Flounder Impact on Pacific Halibut
There is considerable evidence that growing Arrowtooth flounder populations are having an adverse impact on
Pacific halibut stocks in Alaska. Before examining data supporting this claim, it is instructive to understand
economic differences of the two species.
Arrowtooth flounder is one of the lowest value species caught in Alaska’s commercial fisheries, both in terms of
pricing and total first wholesale value. The average first wholesale value per round metric ton of harvested
Arrowtooth was $508 in 2015, and the fish accounted for 0.4 percent of Alaska’s total first wholesale value. By
contrast, Pacific halibut is one of the state’s most valuable species. The average first wholesale value per round
metric ton of harvested halibut was $12,650 in 2015. Halibut accounted for 3.1 percent of total first wholesale
value in 2015 and only six other species had a higher first wholesale value than halibut, despite historically low
halibut TACs. In 2005, the peak of halibut harvests in recent decades, the fish accounted for 6.2 percent of total
first wholesale value. The halibut fishery has lost approximately $100 million in annual value over the past 10
years, principally due to lower harvests (driven by smaller TACs/population).
Pacific Halibut Arrowtooth Flounder
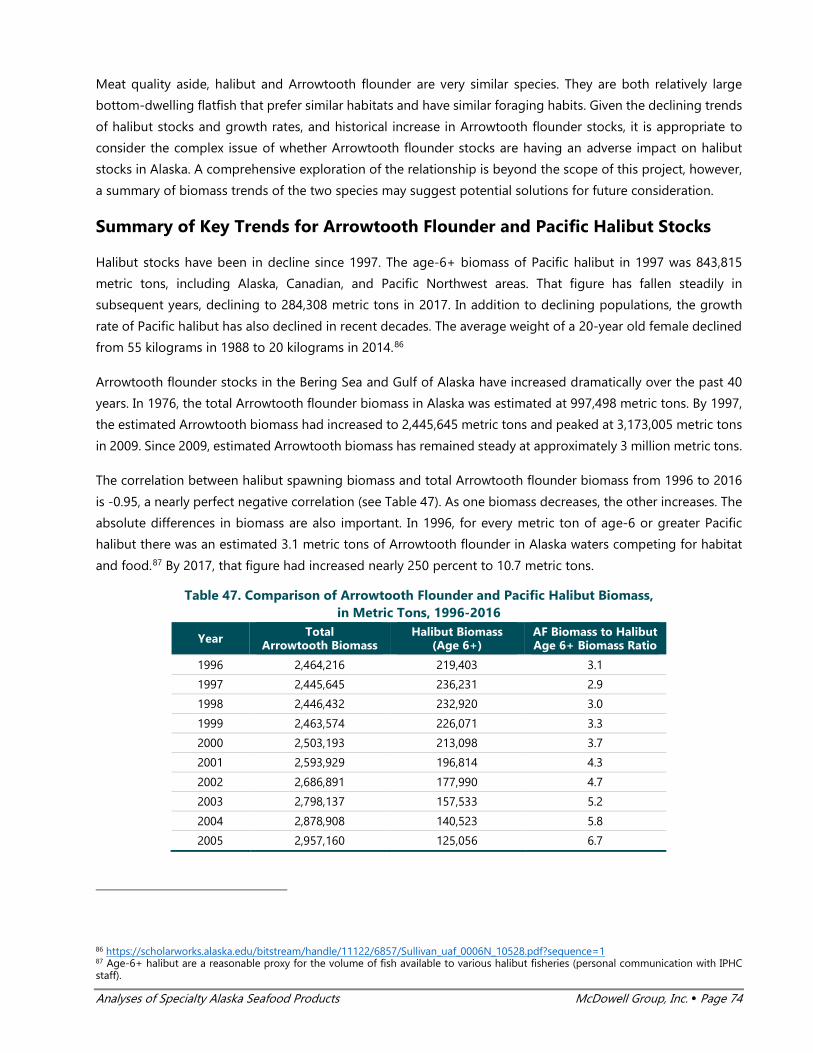
Analyses of Specialty Alaska Seafood Products McDowell Group, Inc. Page 74
Meat quality aside, halibut and Arrowtooth flounder are very similar species. They are both relatively large
bottom-dwelling flatfish that prefer similar habitats and have similar foraging habits. Given the declining trends
of halibut stocks and growth rates, and historical increase in Arrowtooth flounder stocks, it is appropriate to
consider the complex issue of whether Arrowtooth flounder stocks are having an adverse impact on halibut
stocks in Alaska. A comprehensive exploration of the relationship is beyond the scope of this project, however,
a summary of biomass trends of the two species may suggest potential solutions for future consideration.
Summary of Key Trends for Arrowtooth Flounder and Pacific Halibut Stocks
Halibut stocks have been in decline since 1997. The age-6+ biomass of Pacific halibut in 1997 was 843,815
metric tons, including Alaska, Canadian, and Pacific Northwest areas. That figure has fallen steadily in
subsequent years, declining to 284,308 metric tons in 2017. In addition to declining populations, the growth
rate of Pacific halibut has also declined in recent decades. The average weight of a 20-year old female declined
from 55 kilograms in 1988 to 20 kilograms in 2014.86
Arrowtooth flounder stocks in the Bering Sea and Gulf of Alaska have increased dramatically over the past 40
years. In 1976, the total Arrowtooth flounder biomass in Alaska was estimated at 997,498 metric tons. By 1997,
the estimated Arrowtooth biomass had increased to 2,445,645 metric tons and peaked at 3,173,005 metric tons
in 2009. Since 2009, estimated Arrowtooth biomass has remained steady at approximately 3 million metric tons.
The correlation between halibut spawning biomass and total Arrowtooth flounder biomass from 1996 to 2016
is -0.95, a nearly perfect negative correlation (see Table 47). As one biomass decreases, the other increases. The
absolute differences in biomass are also important. In 1996, for every metric ton of age-6 or greater Pacific
halibut there was an estimated 3.1 metric tons of Arrowtooth flounder in Alaska waters competing for habitat
and food.87 By 2017, that figure had increased nearly 250 percent to 10.7 metric tons.
Table 47. Comparison of Arrowtooth Flounder and Pacific Halibut Biomass, in Metric Tons, 1996-2016
Year Total Arrowtooth Biomass
Halibut Biomass (Age 6+)
AF Biomass to Halibut Age 6+ Biomass Ratio
1996 2,464,216 219,403 3.1
1997 2,445,645 236,231 2.9
1998 2,446,432 232,920 3.0
1999 2,463,574 226,071 3.3
2000 2,503,193 213,098 3.7
2001 2,593,929 196,814 4.3
2002 2,686,891 177,990 4.7
2003 2,798,137 157,533 5.2
2004 2,878,908 140,523 5.8
2005 2,957,160 125,056 6.7
86 https://scholarworks.alaska.edu/bitstream/handle/11122/6857/Sullivan_uaf_0006N_10528.pdf?sequence=1 87 Age-6+ halibut are a reasonable proxy for the volume of fish available to various halibut fisheries (personal communication with IPHC staff).

Analyses of Specialty Alaska Seafood Products McDowell Group, Inc. Page 75
2006 3,028,997 112,310 7.2
2007 3,097,355 102,784 7.5
2008 3,146,778 96,162 7.9
2009 3,173,005 87,861 8.7
2010 3,145,910 84,459 8.9
2011 3,074,914 83,234 9.1
2012 3,017,642 84,005 8.8
2013 2,999,852 87,044 8.2
2014 3,018,362 90,764 8.7
2015 3,017,799 94,937 9.2
2016 3,025,547 99,337 9.8
Correlation -0.95
Note: Arrowtooth biomass refers to estimates of age (+1) Arrowtooth flounder and Kamchatka flounder in the BSAI and GOA. Halibut biomass figures pertain the CW short model for all regions managed by the International Pacific Halibut Commission (most of the halibut biomass is in Alaska waters). Halibut figures are converted from net weight to round weight basis using a 0.72 conversion factor. Source: McDowell Group computations based on NMFS and IPHC.
Is it possible that decades of selectively fishing pressure favoring halibut has resulted in an imbalance in halibut
and Arrowtooth stocks to a point where Arrowtooth became so numerous that the species began to
outcompete halibut for habitat and forage. A recent thesis paper by Jane Sullivan, a recent University of Alaska
Fairbanks graduate, considered a range of factors impacting halibut growth. The study supports the notion that
competition from Arrowtooth has had an adverse impact on halibut growth, but found a weaker correlation
when examining biomass trends of the two species over a longer period. Prior to 1996, there were periods where
the biomass of each species trended in the same direction.
However, the complexity of the issue requires more than regression analysis. With ample food and space, the
presence of Arrowtooth is likely not a significant factor in halibut population growth. Further the average size
of each fish matters a great deal. Smaller Arrowtooth provide a food source for larger halibut, and vice versa. It
is possible that the size of Arrowtooth populations in the 1970s, 1980s, and early 1990s was simply not large
enough to have much impact on halibut. As the two species approach a limit on environmental carrying capacity,
the effects of competition and predation would likely be more severe.
Because of Arrowtooth flounder’s low value and large numbers, the fish is essentially a nuisance species.
Arrowtooth consume small halibut and eat food which might otherwise be consumed by halibut and other,
more valuable bottom-dwelling species. In addition, Arrowtooth consume significant volumes of pollock and
maybe a limiting factor for other commercial species as well.88
Halibut bycatch and allocation battles garner a lot of attention, but the scale of Arrowtooth biomass in relation
to halibut receives less focus. Arrowtooth is not one of the top species for trawl companies and it’s considered
a trash fish by commercial and sport fishermen. It may be more constructive for fishery groups to focus less on
88 https://seagrant.uaf.edu/map/gap/fish/publications/knoth2006.pdf

Analyses of Specialty Alaska Seafood Products McDowell Group, Inc. Page 76
allocation, and more on finding ways to help the trawl fleet catch more Arrowtooth (while still minimizing halibut
mortality).
Further research on the topic may be warranted, if fishery managers wish to better understand how Arrowtooth
impact halibut stocks and where these interactions are most intense. Subsequent analysis would be needed to
investigate the role overlapping abundance plays for each species and investigate how foraging and inter-
species predation affects population and/or fish growth. Specifically, it would be helpful to know how important
young Arrowtooth are as a food source to mature halibut.
Potential Solutions for Increasing Halibut and Arrowtooth Value
Although additional research would likely provide valuable information about the nature and scale of
Arrowtooth effects on halibut, available data strongly suggests that Arrowtooth abundance is a negative factor
for halibut populations and growth rates.
As halibut are a high value species and Arrowtooth are not, the optimal (value-maximizing) strategy would be
to harvest more Arrowtooth flounder, thereby reducing competitive pressure on halibut in the hopes that
halibut stocks will rebound. This approach faces two major challenges:
• Halibut and Arrowtooth flounder often inhabit the same territory and can be equal in size, so
Arrowtooth fishing typically results in a relatively high rate of halibut bycatch. Removing Arrowtooth is
important, but it must be done without doing more harm to the much smaller halibut population.
• Arrowtooth are a very low value species and the economics of harvesting them at current harvest levels
is not particularly attractive. Even for those boats that do catch Arrowtooth, it is often not the target
species or is done during periods when more valuable species are not available.
Halibut are a notoriously tough species, able to survive extreme changes in depth during landing and relatively
long periods out of water. Fishery managers and companies have recently studied the practice of “deck sorting”
where flatfish trawl vessels sort the harvest upon landing and return halibut to the water as quickly as possible.
Data from deck sorting experiments suggests the practice does result in lower halibut mortality, though more
study may be required to create a more accurate picture of mortality and the role different handling factors
play in mortality rates.
Though it is well beyond the scope of this study to examine in detail specific fishing and/or management
strategies to increase Arrowtooth values while insuring (or enhancing) halibut values, the following strategies
might be possibilities:
1. Establish deck sorting protocols for trawl vessels that prioritize halibut survival. Allow vessels with deck
sorting and monitoring capabilities (DSM, see below) to factor improved halibut mortality into their
bycatch limits. Require DSM vessels to also use gear modifications which exclude the harvest of large
halibut. Use existing research to quantify the impact of halibut size on mortality and trawl tow
length/time on mortality rates. Consider incentivizing deck sorting and monitoring for trawl fleet by
creating a separate halibut bycatch limit for those vessels that deck sort and those that do not.
2. Remove Arrowtooth flounder from the 2 million metric ton groundfish harvest cap in the Bering Sea.

Analyses of Specialty Alaska Seafood Products McDowell Group, Inc. Page 77
3. Increase Arrowtooth flounder TACs in the Gulf of Alaska and Bering Sea to a specified volume greater
than the overfishing limit (OFL), for example set TACs at 20 percent above OFL until the biomass reaches
a predetermined target.
4. Initiate a strategy for fleet/harvest optimization, with consideration of the following components:
a. Extend Arrowtooth access to additional vessels/companies capable of following DSM protocols
b. Require the use of electronic video monitoring (EM) and vessel design that ensures video
recording of all retained species, the number of halibut returned to the water, and the time
expended during deck sorting. Using EM is more efficient, particularly on smaller vessels, and
reduces the number of paid observers required to monitor the fishery.
c. Revisit fishery management regulations that encourage industry to utilize Arrowtooth flounder
in at-sea and onshore fishmeal and oil production. It is likely that meal/oil production will be a
major component in making Arrowtooth harvest profitable, as increasing the harvest volume
would likely result in lower prices (potentially below-even levels) for H&G or meat products.
5. Fund research aimed at maximizing the value of Arrowtooth fish oil and market development for
Arrowtooth fish oil. Again, it is very likely that efficiently processing Arrowtooth flounder into meal/oil
and engawa will be a key part of any strategy to profitably harvest more Arrowtooth. Fishmeal is a
highly-commoditized product, but preliminary research on Arrowtooth oil suggests that refined
product may be suitable for higher-value markets.
Potential Value of a Meal/Oil/Engawa Fishery for Arrowtooth Flounder
Substantially increasing Arrowtooth flounder harvests would likely have a beneficial long-term impact on halibut
stocks and the value of the halibut fishery, but it could also directly increase the value of Alaska seafood
resources in the near term. The analysis below provides a hypothetical first wholesale value which may be
realized from increasing Arrowtooth flounder harvests only (not including the potential for increased halibut
value).
Assuming Arrowtooth harvests could be increased to 300,000 metric tons and based on certain assumptions
about product yield, product mix, and pricing, it is estimated that the Arrowtooth flounder fishery could produce
$254 million in first wholesale value. This equates to a first wholesale value per round metric ton of $847. Much
of the estimated value comes from processing and retaining engawa (55 percent of the estimated first wholesale
value).
Table 48. Potential First Wholesale Value from Increasing Arrowtooth Flounder Harvests and Meal/Oil/Engawa Production
New Harvest Level (in MT) 300,000
First Wholesale Value by Product, (in $Millions)
Engawa (assumes 1.75% yield and $12/lb. value) $139
Fishmeal (assumes 18% yield and $1,800/MT value) $97
Fish oil (assumes 5% yield and $1,200/MT value) $18
Total First Wholesale Value $254
Average Actual First Wholesale Value (2011-2015) $25.3
First Wholesale Value per Round MT $847
Source: McDowell Group estimates.
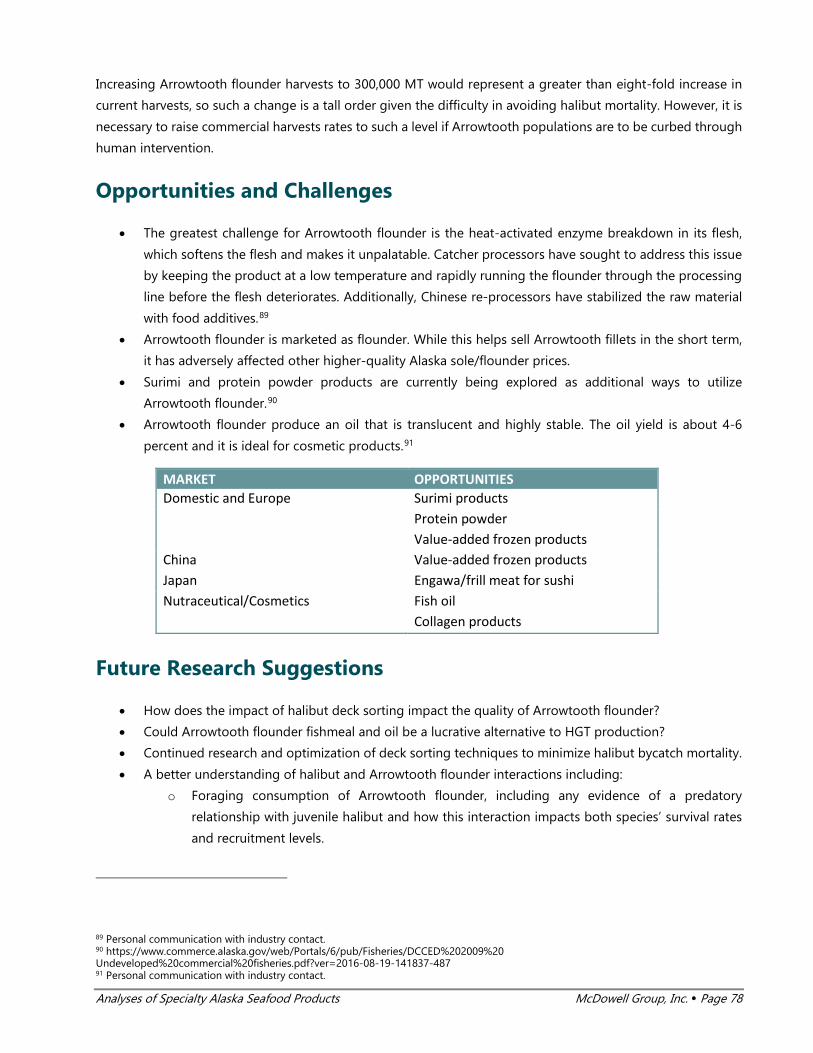
Analyses of Specialty Alaska Seafood Products McDowell Group, Inc. Page 78
Increasing Arrowtooth flounder harvests to 300,000 MT would represent a greater than eight-fold increase in
current harvests, so such a change is a tall order given the difficulty in avoiding halibut mortality. However, it is
necessary to raise commercial harvests rates to such a level if Arrowtooth populations are to be curbed through
human intervention.
Opportunities and Challenges
• The greatest challenge for Arrowtooth flounder is the heat-activated enzyme breakdown in its flesh,
which softens the flesh and makes it unpalatable. Catcher processors have sought to address this issue
by keeping the product at a low temperature and rapidly running the flounder through the processing
line before the flesh deteriorates. Additionally, Chinese re-processors have stabilized the raw material
with food additives.89
• Arrowtooth flounder is marketed as flounder. While this helps sell Arrowtooth fillets in the short term,
it has adversely affected other higher-quality Alaska sole/flounder prices.
• Surimi and protein powder products are currently being explored as additional ways to utilize
Arrowtooth flounder.90
• Arrowtooth flounder produce an oil that is translucent and highly stable. The oil yield is about 4-6
percent and it is ideal for cosmetic products.91
MARKET OPPORTUNITIES Domestic and Europe Surimi products Protein powder Value-added frozen products
China Value-added frozen products
Japan Engawa/frill meat for sushi Nutraceutical/Cosmetics Fish oil
Collagen products
Future Research Suggestions
• How does the impact of halibut deck sorting impact the quality of Arrowtooth flounder?
• Could Arrowtooth flounder fishmeal and oil be a lucrative alternative to HGT production?
• Continued research and optimization of deck sorting techniques to minimize halibut bycatch mortality.
• A better understanding of halibut and Arrowtooth flounder interactions including:
o Foraging consumption of Arrowtooth flounder, including any evidence of a predatory
relationship with juvenile halibut and how this interaction impacts both species’ survival rates
and recruitment levels.
89 Personal communication with industry contact. 90 https://www.commerce.alaska.gov/web/Portals/6/pub/Fisheries/DCCED%202009%20 Undeveloped%20commercial%20fisheries.pdf?ver=2016-08-19-141837-487 91 Personal communication with industry contact.

Analyses of Specialty Alaska Seafood Products McDowell Group, Inc. Page 79
o Evidence that Arrowtooth flounder are overtaking productive halibut grounds and the
possibility of crowding out halibut through competition for resources.
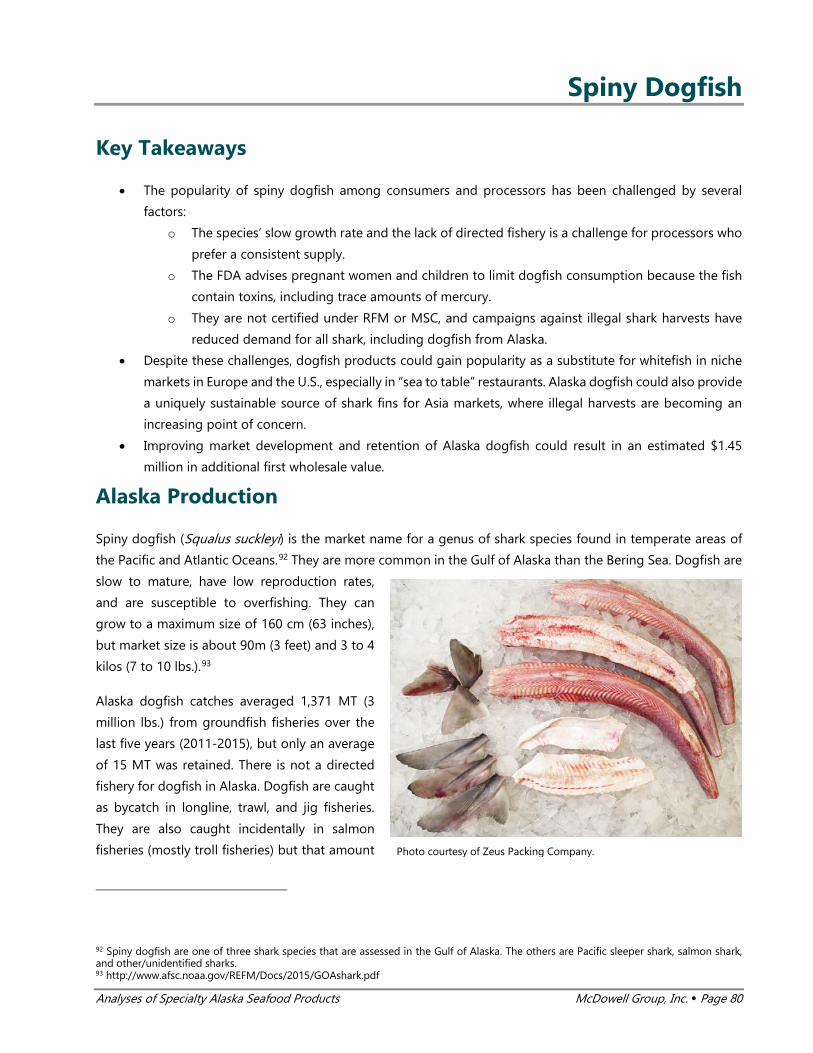
Analyses of Specialty Alaska Seafood Products McDowell Group, Inc. Page 80
Spiny Dogfish
Key Takeaways
• The popularity of spiny dogfish among consumers and processors has been challenged by several
factors:
o The species’ slow growth rate and the lack of directed fishery is a challenge for processors who
prefer a consistent supply.
o The FDA advises pregnant women and children to limit dogfish consumption because the fish
contain toxins, including trace amounts of mercury.
o They are not certified under RFM or MSC, and campaigns against illegal shark harvests have
reduced demand for all shark, including dogfish from Alaska.
• Despite these challenges, dogfish products could gain popularity as a substitute for whitefish in niche
markets in Europe and the U.S., especially in “sea to table” restaurants. Alaska dogfish could also provide
a uniquely sustainable source of shark fins for Asia markets, where illegal harvests are becoming an
increasing point of concern.
• Improving market development and retention of Alaska dogfish could result in an estimated $1.45
million in additional first wholesale value.
Alaska Production
Spiny dogfish (Squalus suckleyi) is the market name for a genus of shark species found in temperate areas of
the Pacific and Atlantic Oceans.92 They are more common in the Gulf of Alaska than the Bering Sea. Dogfish are
slow to mature, have low reproduction rates,
and are susceptible to overfishing. They can
grow to a maximum size of 160 cm (63 inches),
but market size is about 90m (3 feet) and 3 to 4
kilos (7 to 10 lbs.).93
Alaska dogfish catches averaged 1,371 MT (3
million lbs.) from groundfish fisheries over the
last five years (2011-2015), but only an average
of 15 MT was retained. There is not a directed
fishery for dogfish in Alaska. Dogfish are caught
as bycatch in longline, trawl, and jig fisheries.
They are also caught incidentally in salmon
fisheries (mostly troll fisheries) but that amount
92 Spiny dogfish are one of three shark species that are assessed in the Gulf of Alaska. The others are Pacific sleeper shark, salmon shark, and other/unidentified sharks. 93 http://www.afsc.noaa.gov/REFM/Docs/2015/GOAshark.pdf
Photo courtesy of Zeus Packing Company.

Analyses of Specialty Alaska Seafood Products McDowell Group, Inc. Page 81
is unknown as there is no data on dogfish bycatch in state salmon fisheries. Reliable biomass estimates,
spawning biomass, or stock status information are not available.
Table 49. Alaska Dogfish Harvest, in Metric Tons, 2011-2015
2011 2012 2013 2014 2015 5-Year Average
BSAI Shark (Dogfish) Catch 107 96 117 137 107 113
GOA Shark (Dogfish) Catch 522 661 2,170 1,526 1,414 1,259
Total Alaska Catch 629 757 2,287 1,663 1,521 1,371
Total Alaska Retained Harvest 17 14 14 14 18 15
East Coast Retained Harvest 9,701 10,290 7,224 9,992 8,407 9,123
West Coast Retained Harvest 561 150 149 205 202 253
Total U.S. Retained Harvest 10,279 10,454 7,386 10,212 8,626 9,392
Pct. Alaska of Total U.S. Harvest 0.2% 0.1% 0.2% 0.1% 0.2% 0.2%
Potential Alaska Share of Total Harvest 6% 7% 31% 16% 18% 16%
Note: Includes several species of shark, but the most frequently harvested is the spiny dogfish. Does not include incidental bycatch in Alaska salmon fisheries. Source: NMFS FAKR Catch Reports, NMFS FAKR Groundfish Retained and Discarded, NMFS Landings.
Trawl-caught dogfish are worth $0.09 to $0.11 per pound in ex-vessel terms.94 Longline dogfish are closer to
$0.15 per pound.95 Wholesale prices are between $0.60 to $1.00 per pound for edible portions, which have a
recovery rate of 36 percent. Fins, which have a 4 percent yield, can fetch relatively high prices in Asian export
markets.
Finning (stripping shark fins without retaining the whole fish) at sea is not allowed in Alaska fisheries; fishermen
must transfer the whole fish in a transaction. Finning is a disturbing practice where live, finless sharks are
discarded at sea and left to starve on the sea floor or get consumed by other fish. Finning is illegal in most
countries; however, the international waters are unregulated and as such there is no enforcement mechanism
to prevent the practice in these areas. Environmental groups have increased public awareness of the practice in
recent years.
Processing Challenges
Shark species lack a urinary tract and excrete waste through their skin. Dogfish must be gutted, bled, and chilled
as soon as it is brought onboard or it will develop an ammonia smell.96 Processing spiny dogfish is done by
hand and is labor-intensive. Their fins, guts, and skin are removed, leaving a skinless fillet that can be shipped
fresh or frozen. Not only does this make value-added production costly, it also limits fishing trip length before
the skin quality begins to deteriorate. As dogfish is a not a target species, it is often easier for both fishermen
and processors to avoid dealing with dogfish lest it interfere with business operations focused on other species.
94 Personal communication with industry contact. 95 Gaspar, J. (2011). Policy and Market Analysis of World Dogfish Fisheries and an Evaluation of the Feasibility of a Dogfish Fishery in Waters of Alaska, USA (Doctoral Thesis). 96 http://www.seafoodsource.com/seafoodhandbook/finfish/dogfish

Analyses of Specialty Alaska Seafood Products McDowell Group, Inc. Page 82
Often the dogfish that is delivered to shoreside plants is ground into fish meal. Not all processors in Alaska
accept dogfish because it is a low value product and they are not equipped to process it.
Seasonal Availability and Suppliers
Dogfish are incidentally caught year-round, but a high concentration are caught during halibut and sablefish
longlining, which runs from March to November. They are also harvested in salmon fisheries, which occur from
June to September.
The Alaska Seafood Suppliers Directory (link), hosted by the Alaska Seafood Marketing Institute, contains
contact information for Alaska dogfish suppliers.
Major Production Areas
Dogfish are concentrated in the Gulf of Alaska and are caught in high numbers near Yakutat and Kodiak.
Between 2001 to 2008, a small set gillnet fishery for dogfish occurred in Yakutat. Harvests were sporadic and
the fishery has not reopened in recent years.
Nutritional Profile
Dogfish meat has a sweet, mild flavor and a higher oil content than
other sharks and they are a good source of selenium and vitamins B6
and B12. The Food and Drug Administration advises pregnant women
and children not to eat shark due to its elevated mercury content.97
Supply Chain
The primary market for dogfish is Europe. Most dogfish is processed
immediately and transshipped to wholesale distributors who supply to
European and Asian markets.
See figure on following page.
97 http://www.seagrant.umaine.edu/maine-seafood-guide/dogfish
Spiny Dogfish Nutrition Profile
Amount per 100g portion
Calories 130
Fat Calories 41
Total Fat 4.5 g
Saturated Fat 0.9 g
Sodium 79 mg
Protein 20.9 g
Omega-3 0.9 g
Cholesterol 51 mg
Source: Seafoodsource.com.

Analyses of Specialty Alaska Seafood Products McDowell Group, Inc. Page 83
Figure 14. Dogfish Supply Chain
Global Supply
From 2010-2014, global dogfish harvests averaged 25,937 MT. The U.S. is the largest producer, accounting for
36 percent of global harvests, followed by New Zealand with 21 percent.
The East Coast region supplies 98 percent of U.S. dogfish exports, but according to industry reports, Atlantic
dogfish supply was down in the last few years and distributors have had more difficultly filling orders for dogfish
products, including fins and fillets.98
Table 50. Global Production of Dogfish, in Metric Tons, 2010-2014 2010 2011 2012 2013 2014 5-Year
Average
USA 6,696 10,940 10,971 7,396 10,959 9,392
Alaska N/A 17 14 14 14 15
New Zealand 4,725 3,820 6,574 5,502 6,524 5,429
Libya 7,300 4,400 5,100 5,100 3,550 5,090
Indonesia 710 1,497 1,782 2,499 2,675 1,833
Other 6,512 3,948 3,773 2,500 4,233 4,193
Total 25,943 24,605 28,200 22,997 27,941 25,937
Note: For Alaska, sharks were grouped together as “other species” until 2011. Source: FAO Global Capture Production, NMFS FAKR Region (Retained Harvest), and NMFS (OST).
Markets and Uses
Most dogfish meat is consumed in Europe and Asia. Fins are sold primarily in Asia for their alleged
pharmaceutical qualities.99 Several European countries use dogfish in a variety of ways. The fish is most often
98 Personal communication with industry contact. 99 http://capecodfishermen.org/images/documents/Campaign_Materials/Dogfish/2015_Seafood_Expo_Notes.pdf

Analyses of Specialty Alaska Seafood Products McDowell Group, Inc. Page 84
sautéed in France, smoked in Germany, or fried in the U.K. European buyers typically pay higher prices for
dogfish than Asian buyers.
Consumption of dogfish has been negatively impacted by media campaigns discouraging consumption of any
shark species. The campaigns have spurred a greater decline in dogfish consumption in Europe than in Asia.
Exports of dogfish averaged 3,531 MT a year from 2011-2015, with the East Coast supplying 98 percent of U.S.
exports. Alaska exports of dogfish varied widely in the same time period, but averaged 60.7 MT.
Table 51. Exports of U.S. Dogfish by Region, in Metric Tons, 2011-2015
U.S. Region Export Destination 2011 2012 2013 2014 2015 Average
Volume 5-Year
Average
Alaska Europe 0 0 86 29 71 37 $216,333
Other 0 22 57 15 26 24 $21,153
Total Alaska Exports 0 22 143 43 96 61 $237,486
East Coast
Europe 3,315 2,331 2,649 2,695 2,710 2,740 $11,249,933
China 478 367 247 343 507 388 $1,464,706
Thailand 0.0 100 161 339 239 210 $611,225
Other 174 164 114 211 101 111 $464,788
Total East Coast Exports 3,967 2,962 3,171 3,588 3,557 3,449 $13,790,651
West Coast (& Other)
Canada 3 16 9 3 4 7 $16,710
Other 1 44 20 0 10 15 $41,694
Total Other U.S. Exports 4 61 29 3 14 22 $58,404
Total U.S. Exports 3,971 3,044 3,342 3,633 3,667 3,531 $14,086,542
Notes: Districts 30 and 31 are designated as Alaska product ports. Totals may not sum due to rounding. Source: NMFS Trade Data.
In the U.S., dogfish is sometimes substituted in restaurant dishes such as fish tacos, fish sandwiches, and fish
and chips.100 Institutions like schools and prisons have used Atlantic dogfish in meals.
In China and other Asian countries, dogfish is substituted for more expensive shark species. Thailand uses it in
shark fin soup. Hong Kong eats the fin and tail. Several Asian countries have cracked down on illegal shark
imports. Asian demand for Alaska dogfish might increase because it is a sustainable option for other shark
species, since Alaska has a reputation for responsibly managed fisheries.
100 http://www.npr.org/sections/thesalt/2017/01/07/508538671/would-you-eat-this-fish-a-shark-called-dogfish-makes-a-tasty-taco
Analyses of Specialty Alaska Seafood Products McDowell Group, Inc. Page 85
Opportunities and Challenges
Challenges
Marketing spiny dogfish from Alaska poses several challenges:
• They are not sustainably certified by either MSC or RFM
• Dogfish and other sharks are known to contain high levels of contaminants/toxins
• Dogfish do not have a directed fishery, creating inconsistent supply
• Dogfish flesh is susceptible to spoilage and expensive to process
Dogfish values are limited by negative consumer perceptions. Dogfish are grouped in with all sharks, which are
characterized by environmental groups as non-sustainable. Alaska dogfish are not certified by MSC or RFM.
However, British Columbia and the Atlantic dogfish fisheries are currently MSC certified.
Spiny dogfish can have high levels of contaminants dioxin and PCBs. Shipments from the East Coast have been
denied entry on occasion into the Eurozone, which has traditionally been the primary market for dogfish meat.
Dogfish from both the Atlantic and Pacific Oceans are known to contain relatively high levels of mercury and
public health agencies generally discourage consumption by pregnant women and children.101,102
Due to their biology, dogfish are not a high-volume fishery and consistent supply is a challenge. Processing is
labor-intensive and additional training is needed for handling dogfish, which require different cuts for back,
bellies, fins, and a unique skinning technique.
Opportunities
Alaska dogfish needs to be differentiated from other shark species using eco-labeling and marketing to inform
consumers. It is a highly versatile fish that has potential to be a great fish and chips substitute and a niche “sea
to table” product in the restaurant industry in both Europe and the U.S.
101 http://www.seafish.org/industry-support/legislation/contaminants/dioxins-and-pcbs 102 http://seafood.edf.org/shark 103 http://capecodfishermen.org/item/pbs-newshour-features-dogfish
MARKET OPPORTUNITIES Europe Fish and chips, sustainably marketed under the
Alaska Seafood brand. U.S. Domestic Market Sea to table and “eat local” movements103
Collaboration with East Coast for marketing promotions
Asia Sustainably sourced shark fin products Nutraceuticals Collagen as a cosmetic anti-aging treatment

Analyses of Specialty Alaska Seafood Products McDowell Group, Inc. Page 86
In Asia, there has been a crackdown in illegal shark product imports. Alaska’s sustainably harvested dogfish
could potentially see premium prices with the lowered global supply for shark products, including shark fins.
There has recently been less dogfish harvested on the East Coast, partially owing to lowered harvest and to low
market prices. There is potential to collaborate with the East Coast on supplying the European market.
Due to its high lipid content, dogfish cartilage could be used for gelatin products and dogfish collagen could
be used in cosmetic skin aging treatments.
Potential for Additional First Wholesale Value
The average dogfish is approximately 3 pounds, and is worth $0.30 in ex-vessel value and $1.44 in wholesale
value, based on typical recovery yield of edible portions and fins.
Approximately 3 million pounds of dogfish are harvested in Alaska each year and the small amount retained is
usually processed into fish meal. If this volume could be diverted to fins and edible products, there would be
an additional $1.45 million in first wholesale value, assuming fins could be sold for $3/lb and edible portions
could be sold for $1/lb. The value of processing retained dogfish harvests into fish meal is negligible, by
comparison. However, processing Alaska dogfish into fins and edible portions would have higher processing
costs and could pose challenges for fishermen.
Table 52. Potential Dogfish Value
Dogfish Harvest
Total Dogfish Harvest (in Lbs.) 3,023,388
Ex-Vessel Price/Lb. $0.10
Ex-Vessel Value $302,339
Product Yields Edible Portions
36% Fins 4%
Wholesale Volume (in Lbs.) 1,088,420 120,936
Wholesale Price/Lb. $1.00 $3.00
Wholesale Value $1,088,420 $362,807
Total Additional Value $1,451,227
Note: Values are based on industry estimates, pounds landed are a 5-year average of harvests, and recovery rates are based from Crapo (2004). Source: McDowell Group estimates.

Analyses of Specialty Alaska Seafood Products McDowell Group, Inc. Page 87
Skates
Key Takeaways
• Skates are harvested in substantial quantities in Alaska (generally over 60 million lbs. per year), but most
of the harvest is not retained.
o Skates secrete urea through their skin after the fish expires, which can negatively affect meat
quality for both skates and any other fish present in the same fish hold. Not all catcher-
processors are equipped to process skate wings. As a result, many catcher-vessels and some
catcher-processors do not retain skates.
• Skates are an underutilized species in Alaska that are popular in restaurants and as a frozen retail
product in Europe. The species may have potential in the U.S. as a higher-end, domestic, sustainable
restaurant menu item.
• Due to their unique physiology, skates have nutraceutical benefits that is the subject of increasing
research.
Production Volume and Value
Skates are cartilaginous fish with large pectoral wings. The typical Alaska skate is 3 feet long and between 20 to
30 pounds, although average size varies by species.
In the last five years (2011-2015), Alaska harvests of skates averaged 33,085 MT (68.7 million lbs.) with
approximately one-third retained for processing. Over 80 percent of the harvest is attributable to big skates and
longnose skates. The remainder of the harvest consists of 12 other species.104
Table 53. Current Skate Harvest, in Metric Tons, 2011-2015
2011 2012 2013 2014 2015 5-Year Average
BSAI Skate Catch 23,154 24,824 27,024 27,511 28,117 26,126
GOA Skate Catch 4,687 4,124 6,179 5,199 4,968 5,031
Big Skate 2,305 1,998 2,520 1,673 1,515 2,002
Longnose Skate 1,031 925 1,780 1,585 1,671 1,398
Other Skate 1,351 1,201 1,879 1,941 1,782 1,631
Total Alaska Catch 27,841 28,948 33,203 32,710 33,085 31,157
Total Alaska Retained Harvest 8,251 9,700 10,170 9,480 9,060 9,332
West Coast Harvest 1,081 1,188 1,029 1,181 1,021 1,100
East Coast Harvest 16,384 16,523 13,999 15,192 14,493 15,318
Total U.S. Harvest 25,716 27,410 25,197 25,853 24,574 25,750
Pct. Alaska of Total Harvest 24% 26% 29% 27% 27% 27%
104 http://access.afsc.noaa.gov/pubs/posters/pdfs/pRace01_skates-of-Ak.pdf

Analyses of Specialty Alaska Seafood Products McDowell Group, Inc. Page 88
Potential Alaska Share of Total Harvest 52% 51% 57% 56% 57% 55%
Note: Alaska Catch includes entire catch with both discards and retained skate catch. Source: NMFS Alaska Region Catch Reports, NMFS Alaska Groundfish Retained and Discarded Data, NMFS Landings.
Skates are distributed throughout the Gulf of Alaska and the Bering Sea, with a higher concentration of
marketable species (big and longnose) in the Gulf of Alaska. There is not currently a directed fishery for skates
in Alaska. They are caught incidentally in the longline fisheries for cod, halibut, and sablefish, as well as
groundfish trawl fisheries.
Approximately 73 percent of the Alaska skate catch was discarded at sea in 2015.105 While both discards and
retained species count towards a species’ TAC, skate retention rates could improve if market conditions
improved for Alaska producers.
Big and longnose skates receive higher prices due to firmer meat and thicker wings, followed by Alaska, Aleutian,
and Bering skate species. Skates found at lower depths typically have softer flesh. Some processors refuse to
buy small skates which lack a viable market.
Table 54. Alaska Skate Production Volume and Value, 2011-2015
2011 2012 2013 2014 2015 5-Year Average
Big skate 363 272 181 91 91 181
Longnose skate 272 227 408 272 318 318
Other skates 1,497 1,950 2,223 2,177 1,905 1,950
Total Volume (MT) 2,132 2,449 2,858 2,586 2,313 2,449
Big skate $1.7 $1.7 $1.1 $0.4 $0.4 $1.1
Longnose skate $1.4 $1.6 $2.4 $1.3 $2.0 $1.7
Other skates $3.4 $5.1 $5.4 $3.7 $3.3 $4.2
Total Value ($Millions) $6.5 $8.3 $8.9 $5.4 $5.7 $7.0
Note: Skate wings are the primary product. Not all processors sort by skate species. Source: ADF&G (COAR) and McDowell Group estimates.
Skate wings, the most common finished product type sold, account for 23 percent of the fish’s round weight
and average approximately 5 pounds. Skate wings are frozen flat and stacked in 50 pound boxes.106 Skates are
typically processed after target species, such as halibut and cod, which reduces the quality of skates. Skate cheek
meat is also processed, similar to cheek meat from other species, such as halibut. Fishermen can earn around
$0.30 a pound for selling skates to Alaska processors.107
Skate livers, like shark livers, have high fat content and must be immediately frozen to maintain their consistency.
While they have market value in nutraceuticals, the requirements of immediate freezing and additional
processing deter extraction. Estimated liver yield is between 10 to 15 percent.
105 NMFS FAKR Catch Reports, 2015 106 Personal communication with industry contact. 107 Personal communication with industry contact.

Analyses of Specialty Alaska Seafood Products McDowell Group, Inc. Page 89
Seasonal Availability & Suppliers
Skates are available nearly year-round as bycatch in longline and trawl fisheries. Larger skates are typically
harvested in longline fisheries and smaller skates are caught in trawl fisheries. Halibut and sablefish are
harvested from March to November and Pacific cod is harvested nearly year-round.
The Alaska Seafood Suppliers Directory (link), hosted by the Alaska Seafood Marketing Institute, contains
contact information for Alaska skate suppliers. Suppliers can work with their fleets to retain skates and
coordinate with buyers on product specifications.
Nutritional Profile
Skate wings consist of mild-flavored, white meat with a stringy texture. Skates are low in fat and cholesterol,
and have slightly more protein than cod.108,109
Table 55. Skate Wing Nutrition
Supply Chain
Most of Alaska’s skates are sent to China for reprocessing and re-exported to Europe and the U.S. for frozen
value-added products, fish and chips restaurants, and high-end cuisine in France and Germany. From Alaska,
skate wings are flash-frozen and shipped in 50 pound boxes, typically worth about $1 per pound.110
Alaska skate wings sent to Asia for secondary processing are typically re-exported as value-added frozen fish
finger-sized slices.111 The U.S. East Coast directly ships larger skates to Europe, where it is a popular seafood
item. Small skates are sold as lobster bait.
108 http://www.seagrant.umaine.edu/maine-seafood-guide/skate 109 http://www.northernproducts.com/products/#sthash.Flt8MMQm.dpbs 110 Personal communication with industry contact. 111 Personal communication with industry contact.
Protein15%
Moisture83%
Lipids1%
Other1%
Amount per 100g portion
Calories 95
Fat 1 g
Sodium 90 mg
Protein 20 g
Source: Great Northern Products and Farrugia et. al (2015).

Analyses of Specialty Alaska Seafood Products McDowell Group, Inc. Page 90
Figure 15. Skate Supply Chain
Competing Supply
During the most recent five years with available data (2010-2015), global harvests of skates and rays averaged
469,099 MT (1 billion lbs.), with Asian countries accounting for the majority of global production. The U.S. share
of the global skate/ray harvest was approximately 6 percent over the five-year period. India is the world’s largest
producer of skates and rays, averaging 71,342 MT (154.2 million lbs.) between 2010-2014.
Table 56. Global Production of Skates and Rays, in Metric Tons, 2010-2014
2010 2011 2012 2013 2014 5 Year Average
Asia 218,092 244,688 263,917 254,501 261,983 248,636
India 60,313 70,994 75,681 71,342 71,342 69,934
Indonesia 44,478 48,430 56,403 56,067 61,772 53,430
Malaysia 20,621 19,106 22,148 23,607 24,664 22,029
Other 92,680 106,158 109,685 103,485 104,205 103,243
Americas 119,686 119,840 117,940 107,365 107,951 114,556
U.S. 29,234 27,375 27,931 25,537 26,236 27,263
Alaska Harvest 8,709 8,251 9,700 10,170 9,480 9,262
Mexico 27,455 22,272 21,929 30,010 26,975 25,728
Brazil 18,596 17,093 19,513 17,236 19,156 18,319
Other 44,401 53,100 48,567 34,582 35,584 43,247
Africa 67,498 61,182 67,105 73,640 63,688 66,623
Nigeria 21,625 18,491 19,032 19,324 20,238 19,742
Tanzania 5,383 6,132 8,756 8,465 7,846 7,316
Other 40,490 36,559 39,317 45,851 35,604 39,564
Europe 34,437 34,331 32,861 30,155 32,758 32,908
Spain 11,932 11,586 9,539 7,944 9,449 10,090
France 7,370 6,966 6,403 6,114 6,586 6,688

Analyses of Specialty Alaska Seafood Products McDowell Group, Inc. Page 91
Other 15,135 15,779 16,919 16,097 16,723 16,131
Oceania 7,755 6,204 6,240 6,012 5,664 6,375
New Zealand 2,608 2,344 2,266 2,754 2,688 2,532
Australia 3,659 3,411 3,081 2,691 2,504 3,069
Other 1,488 449 893 567 472 774
Total Skate and Ray Harvest 447,468 466,245 488,063 471,673 472,044 469,099
Note: Numbers include skate, ray, and some sharks. Source: FAO Global Capture Production, NMFS Alaska Region (Retained Harvest), and NMFS (OST).
Markets and Uses
Since 2012, Alaska has exported an estimated 1,957 MT (4.3 million lbs.) of skates each year worth $5 million,
primarily to South Korea, where it is a popular seafood product and may also be held in cold storage for re-
export to other markets.
In comparison, the East Coast has exported 2,292 MT (5 million lbs.) of skates worth $6.8 million, with 86 percent
of exports sent to European markets.
Table 57. Top Exports of U.S. Skates by Region, in Metric Tons, 2012-2015
U.S. Region Export Destination 2012 2013 2014 2015 Average
Volume
5-Year Average Value
($Millions)
Alaska
South Korea 1,638 1,718 1,841 2,121 1,830 $4.8
China 11 36 115 75 59 $0.1
Japan 6 27 114 82 57 $0.1
Other 19 0.7 0.5 23 11 $0.03
Total Alaska Exports 1,674 1,782 2,070 2,301 1,957 $5.0
East Coast
Europe 2,697 1,789 2,022 1,409 1,979 $6.3
China 394 120 72 96 170 $0.2
South Korea 97 22 0.6 24 36 $0.1
Other 209 47 109 62 107 $0.24
Total East Coast 3,396 1,977 2,204 1,591 2,292 $6.8
West Coast & Other
Canada 118 113 161 133 136 $0.4
South Korea 52 - 237 31 91 $0.3
Total West Coast & Other 170 113 399 164 227 $0.7
Total U.S. Exports 5,240 3,872 4,673 4,056 4,476 $12.5
Note: Districts 30 and 31 are designated as Alaska product ports. Source: NMFS monthly export data.
Skates are common in Europe and Asia both as high-end delicacies and as value-added products, depending
on the size, quality, and skate species. Skate wings sometimes function as a lower cost substitute for scallops or
monkfish.
Skate wings are popular in France where they are pan-sized to be buttered and sautéed. European grocery
stores source North Atlantic skates in the frozen aisle of the supermarkets, next to, for instance, Alaska pollock

Analyses of Specialty Alaska Seafood Products McDowell Group, Inc. Page 92
products. Skate dishes are also a high-end item in French and German restaurants on the East Coast, mirroring
European preferences.112
Skates are very popular in South Korea, where skate wings are consumed raw, sautéed, and fermented.113
Kinunot na Pagi is a Filipino dish that uses coconut milk and flaked skate wings.114 Grilled skate and stingray are
used in Malay, Chinese, and Singapore curry, sambal, and assam pedas (sour-spicy seasoning).115 Dried skate
preparations are also used in Asia. China and other Asian countries use skate cartilage for medicinal purposes.
Opportunities
MARKET OPPORTUNITIES Europe Frozen Value-Added Product Asia Frozen Skate Wing U.S. Domestic Market Niche high-end markets for local harvest
(Community-Supported Seafood Shares) Nutraceutical/Medical Collagen: Since skates are cartilaginous fish, there are
currently studies looking at using collagen from its skin as material for bone regeneration.116 Mucus: There are microbial properties, similar to shark, that have the potential to be a natural source of sterilization.117 Liver: There is a small developmental nutraceutical market for skate liver pills.118
Challenges
• Since there is not a directed fishery, skates are harvested only as bycatch and is not always retained nor
is there a steady supply available of any given species.
• High shipping costs and low skate prices do not justify an increase in Alaska skate production to
established markets.
112 Personal communication with industry contact. 113 https://seoulfoodyy.wordpress.com/2012/03/27/fermented-skate/ 114 http://www.pinoyhapagkainan.com/kinunot-na-pagi/ 115 Personal communication with industry contact. 116 http://link.springer.com/article/10.1007/s13770-014-0075-y 117 http://www.dtic.mil/dtic/tr/fulltext/u2/a600463.pdf 118 https://www.amazon.com/Blue-Fermented-Skate-Liver-120/dp/B004PAP9E8/ref=sr_1_fkmr0_3_a_it?ie=UTF8&qid=1481247319&sr=8-3-fkmr0&keywords=boodoo+ice+liver+oil

Analyses of Specialty Alaska Seafood Products McDowell Group, Inc. Page 93
Specialty Product Challenges and Opportunities
Alaska’s commercial fisheries produce significant volumes of seafood products, but rarely utilize and create
value from the entire fish. As one long-time product development advocate stated in a recent interview,
“Alaska’s seafood industry has a butcher shop mentality when it should have an oil refinery mentality.” However,
several significant challenges commonly hinder the viability of producing specialty seafood products in Alaska.
These general themes are explored in this chapter. Overcoming these core challenges and focusing on key
opportunities are critical for Alaska to increase utilization and value from its sustainable fishery resources.
Production Challenges
Production priority: Shoreside plants and processing vessels of all sizes in Alaska have capacity constraints.
Higher value products get priority access to processing resources, including capital investment, labor, and
freezer/storage space. Plant managers allocate processing resources according to product value in order to
maximize the production value of available resources.
Capacity limitations: Plants typically do not have freezing capacity to simply freeze unused raw material, or
buy larger volumes of “trash fish”, during peak harvest periods. Increasing resource utilization on the shoulder
seasons may be part of the answer, but most plants employ less labor during the shoulder season. In some
cases, the additional labor and freezing costs may exceed the value of specialty product production.
Economies of scale: Alaska’s seafood industry produces large volumes of unused or undervalued marine
resources. However, this production is spread over a vast area, and supply is inconsistent because many fisheries
are seasonal in nature. This makes it difficult to create a manufacturing process capable of efficiently
transforming lower-value marine resources into marketable products. In addition, Alaska’s fishing communities
are often not connected to the road system, so moving product from one community to another is costly.
Larger ports with enough volume to support a fish meal/oil plant generally have facilities already in place.
However, there is a still a significant volume of product which is located in smaller ports with more seasonal
production. Processing and marketing specialty products from these smaller facilities results in higher unit costs
of production.
Cost of production: Finally, operating costs in Alaska tend to be higher than most other places due to the cost
of labor, energy, and the remote nature of Alaska ports. Manufacturing process typically cost significantly more
in Alaska than in other countries or the Lower 48. Unless Alaska offers some particular access or production
advantage, it is generally more cost-effective to produce it elsewhere.
Marketing Challenges
Many specialty products are sold into markets that are unfamiliar to Alaska producers, such as pet food
manufacturing, specialty exports markets, or nutraceutical/pharmaceutical producers. Alaska seafood
processors primarily sell food products to seafood distributors or secondary seafood manufacturers. Only
recently has there been interest in specialty products sourced from Alaska’s waste. For example, Bering Select

Analyses of Specialty Alaska Seafood Products McDowell Group, Inc. Page 94
in Dutch Harbor began distilling oil from Pacific cod livers for the nutraceutical supplement market and Tidal
Vision began to source crab shells from St. Paul to supply the chitosan market in the U.S.
Developing sales relationships and hiring the expertise to market specialty products is an added cost for Alaska
seafood products, and one that carries no guarantee of return. For smaller companies, often the value and
volume of material in question does not justify the investment in human resources and other marketing assets.
A key marketing challenge is to bridge the gap between potential buyers who are unaware of Alaska’s under-
utilized specialty resources and Alaska producers who may not yet have awareness of or access to markets that
value those resources.
The Case for Cooperation & Aggregation
The costs and technical difficulties associated with producing and selling specialty products can be daunting for
individual firms. In general, most Alaska processors have increased resource utilization through investments and
modifications made within the company. Cooperatively handling raw material and waste in Alaska could create
economies of scale that could lower costs for individual firms and improve utilization rates. This can be done by
selling to a third party firm that has the resources to utilize the specialty product or by creating a cooperative.
The two models, by which Alaska processors might increase resource utilization, are discussed below.
Selling Raw Material to a Third-Party Firm
The industry as a whole could increase its resource utilization if smaller companies sold waste to larger
companies for specialty product manufacturing. This already occurs in Alaska, but the practice is not widespread.
Trident Seafoods, on occasion, collects salmon waste from smaller plants with its floating salmon oil processing
vessel then processes oil onsite. This keeps more waste out of the outflow pipe and creates a valuable product
at the same time. Typically, a floating processing vessel will travel to smaller ports where it will process onsite
the salmon waste into salmon oil.
As noted in this report, the unit value of supplement-grade Alaska salmon oil is very high. However, the fact
that Trident Seafoods or other large Alaska processors have not expanded salmon oil production by buying
larger volumes of salmon waste from competitors suggests that salmon oil demand has its limits. Expanding
production by leveraging salmon waste from smaller ports would likely require marketing efforts to expand
consumption of salmon oil or other products derived from the additional raw material.
In addition to demand limitations, the seasonal nature of salmon runs complicate the situation. Most small
salmon processors create waste at approximately the same time of year. Collecting and processing waste from
many ports would require those processors to freeze raw material, which is often not practical during periods
of heavy supply.
A principal consideration and challenge is the cost associated with collecting and transporting the waste product
to a centralized processing facility. Those costs, plus processing and distribution costs, could exceed the value
of low-end products.

Analyses of Specialty Alaska Seafood Products McDowell Group, Inc. Page 95
This model creates more value out of the resource, but currently has little impact on the ex-vessel value of
Alaska salmon. Unless a larger market for salmon by-products or other waste emerges, with competition from
multiple buyers, smaller processors will not receive much value from selling waste streams. Therefore, there is
very little additional first wholesale value which could be passed onto fishermen or retained by smaller
processors. Trident Seafoods has made significant investments in developing a salmon oil product and the
market for it. If other large processors actively pursue fish waste from smaller plants, a more competitive market
could be created for waste products, a market possibly capable of raising ex-vessel values. However, that distant
possibility will require much investment and product/market development by other large processors.
One such example where specialty product investments may have wider impacts is in Dutch Harbor. Clipper
Seafoods, one of the largest Pacific cod quota shareholders in the Bering Sea, recently began producing cod
liver oil. Clipper controls its own supply, but could easily source additional supply from other processors, if
needed.119
Raw material could also be purchased and consolidated by companies which are not part of the Alaska seafood
processing industry. For example, Juneau-based Tidal Vision buys salmon skins for manufacturing accessories
such belts and wallets. To support this kind of manufacturing, raw material may be frozen and shipped out for
processing elsewhere or processed locally (in the port of origin).
Creating a Specialty Product Cooperative
Companies can create efficiencies by forming a cooperative that aggregates raw material and benefits from
economies of scale in production and sales. This model also has precedent in Alaska; The Kodiak Fishmeal
Company (KFC) is jointly owned by a group processors with Kodiak plants. Beginning operations in 1995, the
facility transforms waste into marketable products without the need for fishmeal plants at each processing
facility.
Kodiak is a unique Alaska seafood port. It has landings nearly year-round and includes several shoreside
processing plants in close proximity. With the exception of Dutch Harbor, most other Alaska seafood ports have
fewer processors or more seasonal production. Still, KFC may be a model worth considering in other Alaska
ports, even if supply is only seasonal.
New cooperatives do not necessarily need to focus on fishmeal and fish oil as their primary products. The only
requirement is that the new entity be capable of profitably transforming fish waste in marketable product(s). In
addition to producing commodity-grade fishmeal and oil, this could include isolating collagen or other high-
value compounds, or providing feeds/fertilizer for a local farm. Further research and planning is necessary to
determine the best use of fish waste in each situation.
119 https://www.adn.com/business/article/pioneering-effort-sell-pacific-cod-liver-oil-not-what-your-grandma-ordered/2015/06/07/

Analyses of Specialty Alaska Seafood Products McDowell Group, Inc. Page 96
Quantifying Production of Specialty Products
Confidentiality regulations make it difficult to fully quantify the volume of raw material available for specialty
production, as well as the amount of finished products. Individual processing company production records are
proprietary information.
The inability to document available supply hinders specialty product marketing. Confidentiality measures also
make it difficult to verify production volumes and values for purposes of lending or economic development
projects.
To the extent possible, this report quantifies actual and potential supply of specialty products based on
production data reported to the state and/or by using product recovery rates and harvest volumes. Quantifying
supply and unit value is critical to developing markets for Alaska specialty seafood products.
Future Research Suggestions
This section describes potential general and species/product specific research opportunities that would further
inform efforts to add value to Alaska’s varied specialty seafood products.
Comprehensive Yield Database and Raw Material Analysis
A common data gap for this project was the lack of information on the specific yield of fish/shellfish parts. A
booklet published by Alaska Sea Grant entitled “Recoveries and Yields from Pacific Fish and Shellfish” is very
helpful in providing information about how much fillets, or headed/gutted fish weigh as a percentage of the
whole fish. However, in some cases it is useful to have a more detailed analysis. For example, how much does a
frame or a liver weigh, as a percentage of the whole fish?
Further, it would be instructive to conduct chemical analyses on each fish part. Proximate analyses are often
conducted on the entire fish, when in many cases the raw material in question contains only certain fish parts.
Therefore, it is important to know what prospective waste material a fishery provides, and the chemical and
nutritional nature of those parts.
Compiling this data will require multiple dissections of many fish and shellfish species, as well as a thorough
chemical analysis of each part. Although this is a large undertaking, the research would produce a
comprehensive reference database capable of providing technical data on every fish part. Once completed, the
data could be aggregated to match the waste stream of any processing operation.
Connecting with Buyers
This document provides a wealth of information about the types of markets specialty products are sold into;
however, developing extensive lists of specific buyers is often difficult and very time consuming. Alaska seafood
suppliers are, understandably, unwilling to share names and contact information for their buyers, lest they lose
business to another supplier. Finding buyers for specialty products without having product to sell can also be
challenging. For some products, the number of potential buyers is massive, for others it may consist of a few
specialty distributors.

Analyses of Specialty Alaska Seafood Products McDowell Group, Inc. Page 97
To better connect buyers and sellers, the Alaska Seafood Marketing Institute could host a Buyers Directory on
its website, similar to their Supplier Directory. This would provide potential buyers with a free, highly-visible
online space to advertise their demand for specific Alaska seafood products. This way, suppliers who have
product to sell could find interested buyers through the ASMI Buyers Directory. Buyers could be placed in the
directory by providing ASMI staff with contact information and indicating the types of products they are
interested in buying.
Further, Alaska seafood suppliers might utilize this report as a guide towards helping them locate potential
buyers. For example, a processor seeking to find markets for cod milt may consider contacting specialty seafood
distributors in large U.S. urban areas or Japanese importers who buy a wide range of species. Finding companies
who fit those descriptions can easily be found using online search tools.
Extending the Reach of the Alaska Seafood Brand
Many of Alaska’s seafood products function as a raw material for secondary seafood processors, often times
located in other countries. Alaska seafood is sometimes combined with product from other countries and as a
result loses its place of origin, and the ability to market based on positive attributes of the Alaska Seafood brand.
In these situations, Alaska seafood product is a pure commodity, interchangeable with similar products from
anywhere else, with none of the intrinsic value associated with the Alaska seafood brand.
In some cases, value can be added to species or products simply by creating informational materials that allow
processors or fishermen to improve the quality of their product, or become more efficient. One example is the
ASMI salmon color guide, which easily allows processing workers to grade salmon – even if they are unfamiliar
with the product.
Continuing to work with Alaska seafood suppliers and buyers to create informational tools is important,
improving the ability of everybody in the supply chain to produce and market Alaska seafood. Additional ideas
include:
• Video explaining how to properly retain, process, and store dogfish
• Updating existing ASMI processing guides with visual image prompts, as opposed to text (many
processing workers do not speak or read English)
• Bulletin summarizing improvements in packaging
• Checklist of what is needed to produce supplement-grade fish oil
Future Research Suggestions by Species and Product
Along with industry-wide research topics, further species-specific research opportunities could include the
following:
ARROWTOOTH FLOUNDER
• How does the impact of halibut deck sorting impact the quality of Arrowtooth flounder?
• Could Arrowtooth flounder fish meal and oil be a lucrative alternative to Head/Gut/Tail production?
• A better understanding of halibut and Arrowtooth flounder interactions including:
Analyses of Specialty Alaska Seafood Products McDowell Group, Inc. Page 98
o Foraging consumption of Arrowtooth flounder, including any evidence of a predatory
relationship with juvenile halibut and how this interaction impacts both species’ survival rates
and recruitment levels.
o Evidence that Arrowtooth flounder are overtaking productive halibut grounds and the
possibility of crowding out halibut through competition for resources.
o Potential correlation of size-at-age trends between the two species.
DOGFISH
• Could training in handling, transporting, and processing dogfish improve species’ value and retention?
• Is there additional value in selling cartilage to collagen manufacturers?
• What would the ex-vessel price need to be for fishermen to consider dogfish a worthwhile retained
catch?
• What shark fin sizes are preferred by various international markets?
HERRING
• Herring promotions targeting ethnic communities in the U.S., including Russian, Eastern European, and
Scandinavian.
• The costs of curing herring in Alaska and shipping drums to the domestic market.
• Identifying alternative funding sources for herring management.
SKATES
• Develop a “Best Practices” guide for retaining and processing skates.
FISHMEAL/OIL
• A study investigating how much Alaska seafood waste is discarded versus processed into specialty
products, and the trends of commercial seafood resource utilization.
• Producing refined fish oil for human consumption could increase the value of Alaska’s fish oil
production several fold (oil was worth $34 million in first wholesale terms in 2014); however, it is not
clear 1) how much more value could be added, 2) whether the market could handle a large influx of fish
oil supplement supply, or 3) how much it would costs companies to do so.
• Obtaining Nielsen retail sales data regarding sales of specific pet food products could provide valuable
marketing material. If the “Alaska premium” can be quantified in terms of price premium and growth
prospects, by market, versus other pet food/treats, this could provide a justification on the part of
buyers to pay more for Alaska seafood/salmon thus elevating Alaska product above the basic
commodity value. Competing against commoditized protein products from around the world may
prove challenging for Alaska producers.
• Study the impact of fish oil supplements on hair and nail growth/health. Some people report stronger
nails after taking fish oil supplements. Quantifying a beneficial impact on hair and/or nails could
increase demand for fish oil supplements.
FISH HEADS
• Head yield and oil content by species.

Analyses of Specialty Alaska Seafood Products McDowell Group, Inc. Page 99
• Proximate analysis for heads.
• Volume of heads discharged as processing waste.
ROE PRODUCTS
• Yield and nutritional composition of roe-based fish oil.
• Quantify success of 1) marketing new roe products in traditional markets and/or 2) marketing roe
products in new markets.
• Investigate methods to maximize omega-3 retention from roe oil, specifically how to utilize roe
membranes and prevent them from clogging up oil processing equipment.
INTERNAL ORGANS
• Yield by type of organ from each commercial species.

Analyses of Specialty Alaska Seafood Products McDowell Group, Inc. Page 100
Appendix
Table 58. Estimated Shipping Costs for Frozen Product
Origin Destination Mode Cost per 40’ Container
Cost per Pound1
Naknek Seattle Barge or Ocean Freight $10,100 $0.20
Naknek Qingdao, China Barge or Ocean Freight $12,780 $0.25
Dutch Harbor Qingdao, China Barge or Ocean Freight $5,500 $0.11
Dutch Harbor Busan, South Korea Barge or Ocean Freight $5,500 $0.11
Kodiak Seattle Barge or Ocean Freight $7,700 $0.15
Kodiak Qingdao, China Barge or Ocean Freight $7,800 $0.15
Kodiak Busan, South Korea Barge or Ocean Freight $7,800 $0.15
Kodiak Hamburg, Germany Barge or Ocean Freight $8,900 $0.18
Southcentral AK Seattle Barge or Ocean Freight $5,500 $0.11
Southeast AK Seattle Barge or Ocean Freight $6,000 $0.12
Southeast AK Qingdao, China Barge or Ocean Freight $6,600 $0.13
Southeast AK Hamburg, Germany Barge or Ocean Freight $7,800 $0.15
Seattle Qingdao, China Barge or Ocean Freight $3,400 $0.07
Seattle Busan, South Korea Barge or Ocean Freight $3,400 $0.07
Seattle Hamburg, Germany Barge or Ocean Freight $5,400 $0.11
Seattle Midwest U.S. Truck $6,000 $0.12
Seattle Southeast U.S. Truck $9,000 $0.18
Seattle Eastern U.S. Truck $8,500 $0.18 1 Estimated cost per pound assuming a full shipment weighing 23 MT per 40’ container. Source: Industry interviews.