analysing qualitative data - asme.org.uk qualitative paradigm acknowledges and accepts the existence...
TRANSCRIPT
ANALYSING
QUALITATIVE DATA
Dr Lesley Pugsley
ASME RME November 2015
The Qualitative Paradigm
Acknowledges and accepts the
existence of multiple versions of
reality, because reality is multi-
layered.
All accounts are partial

Aim of Qualitative Research
To form a map of the relevant
characteristics of a population
rather than a mirror of the
number of people with those
characteristics

Features of Qualitative Research -1
– People act intentionally and make meanings in and through their activities (Blumer 1969)
– People actively construct their social worlds- they are not ‘cultural dupes’ (Becker, 1970, Garfinkel, 1967)
– Situations are fluid, richly affected by context – ‘situated activities’

Features of Qualitative Research-2
–Events and individuals are unique and largely non- generalisable
–Social worlds should be studied in their natural states (Hammersley and Atkinson, 1997)
–There are multiple interpretations of and perspectives on single events
–Need to examine situations through the eyes of the participants
Qualitative research is
Interpretive
Meaning rather than frequency
–What, why & when
NOT
–How many

Qualitative Research
Must Be:
Rigorous
Reflexive
Triangulated or validated
Transparent

Data Analysis
Qualitative data are ‘sexy’
Qualitative Data are unstructured and
unwieldy
Researchers need to apply structure and
coherence - to ‘make sense’ of their data

Good qualitative analysis
Systematic
Accessible to others
Dynamic – open to change
Comprehensive
Allows between and cross case analysis
Grounded / iterative
Enables easy retrieval

Coding
Transcripts coded by a paragraph of speech
Unlike survey questionnaires when code is by question - not case (greater consistency)
Sort into categories
Continue to code & sort until no new categories are generated

Categorisng Data
Need to develop categories for coding
These can come from:
Theory
Intuition
Data
Coding Down
Where the research is designed to test
an hypothesis
Categories are derived from the
theoretical framework and then data
are sought to match the categories

Coding Up
Where the aim is to describe the data, code and classify it in order to identify themes or generate theory
This demands a constant interrogation of the data until no new thematic categories are generated
Theories are then sought from the extant literature to provide explanations

Open Coding
Data sorted into 1st level concepts
Date generated concepts or categories
Data sorted into different files
Indexing- Comprehensive data catalogue
Think widely – categories can be collated

Axial Coding
Shift is from a focus on the text
More directed approach - uses concepts and categories to re-read data to confirm:-
Accuracy of categories to data
Explore the relationships

Creating a coding List or TreeGrantley, M. (1999:14) Data from a London Educational Initiative Project
(I). And how did you decide what you wanted to do?
(GP). There were certain things that we were doing, one was fund holding, we are going inti this and we had the meetings, loads and loads of meetings.
(I). Did you have a plan of what education you wanted to do?
(GP). No it was basically the courses, as and when they came we chose which we wanted to do and which we didn’t want to do.
(I). What has the funding enabled you to do?
(GP). To do the courses and get paid at the same time.
Concepts List
o Decision making
o Fund Holding
oMeetings
o Courses
oGetting Paid
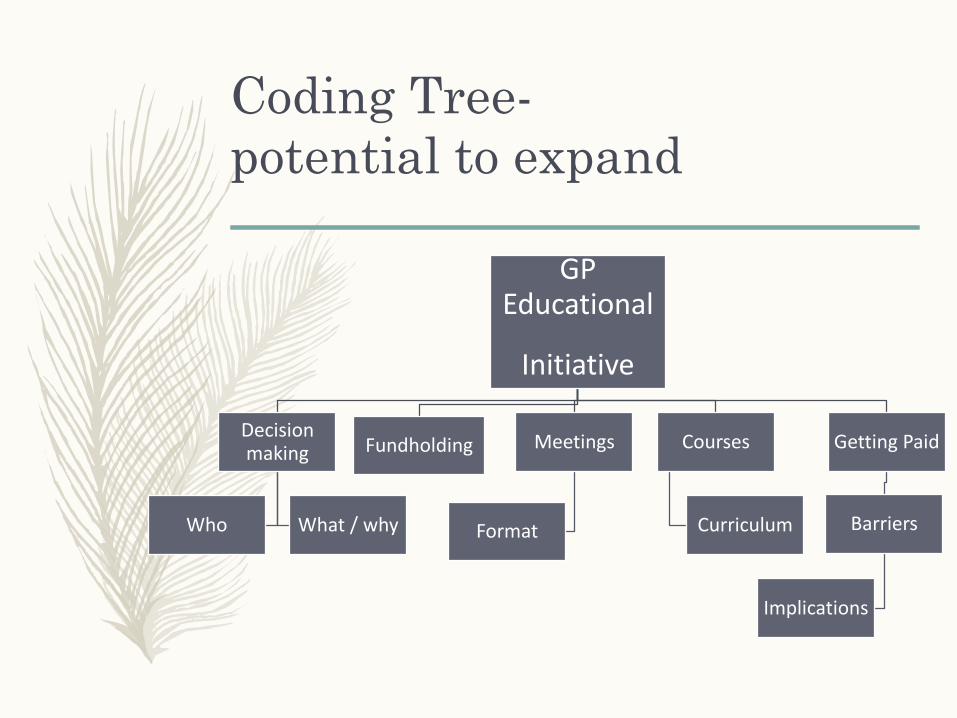
Coding Tree-
potential to expand
GP Educational
Initiative
Decision making
Who What / why
Fundholding Meetings
Format
Courses
Curriculum
Getting Paid
Barriers
Implications

Task
Working Individually :-
Read the handout – an extract from a
focus group transcript and code the data
into categories that are meaningful to you

Coding
1. Passing as normal
2. Symbols of disability
3. Stigma
4. Misunderstandings
5. Embarrassment
6. Aids for coping
7. Problems
8. Impact of problems
9. Coping strategies

Coding
Ann: The problem is that we all look, well, normal.
It’s not like were carrying white sticks or anything.
Passing as normal
Symbols of disability
Bertha: No and even if you are being guided you
could just be with a friend or something.
Passing as normal
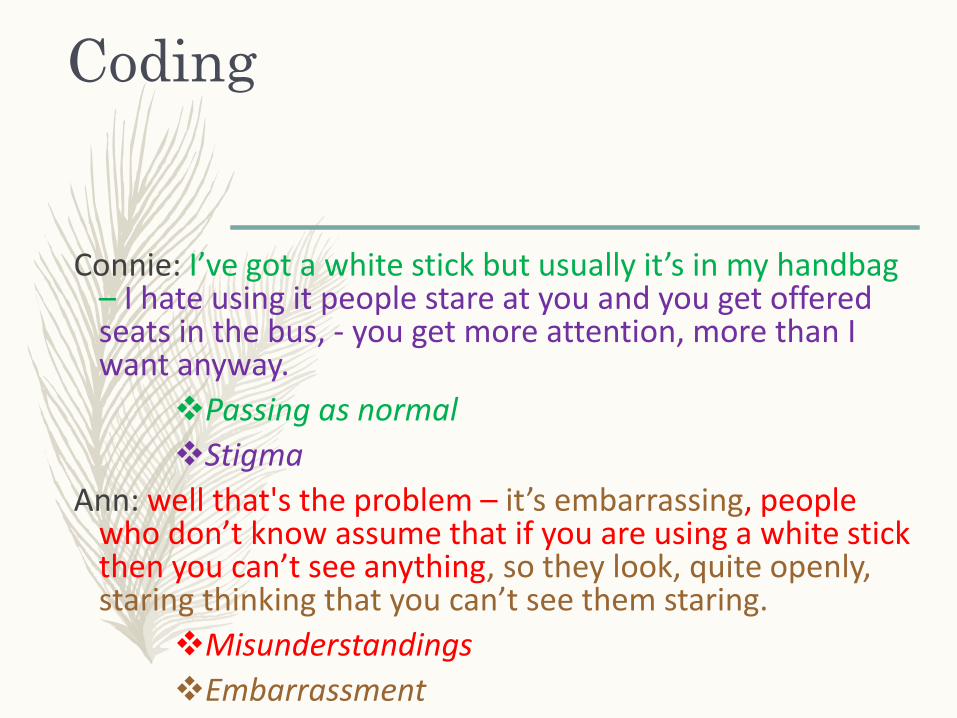
Coding
Connie: I’ve got a white stick but usually it’s in my handbag – I hate using it people stare at you and you get offered seats in the bus, - you get more attention, more than I want anyway.
Passing as normal
Stigma
Ann: well that's the problem – it’s embarrassing, people who don’t know assume that if you are using a white stick then you can’t see anything, so they look, quite openly, staring thinking that you can’t see them staring.
Misunderstandings
Embarrassment

Coding
Interviewer: So do you prefer looking ‘normal’?
Bertha: Well I feel pretty normal, mostly.
Connie: With the white stick, it’s meant for car drivers really so that they can see you if you jump in the road-but I do feel very conscious when I’m carrying it, people jump out of the way like you’ve got the plague or something
Passing as normal
Aids for coping,
Stigma
Embarrassment
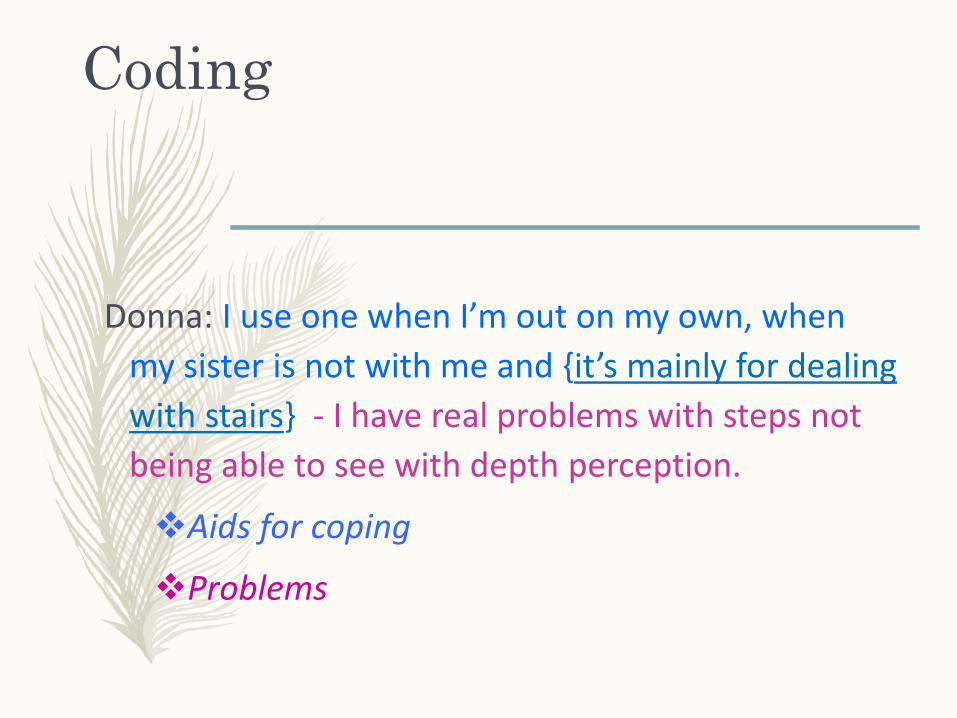
Coding
Donna: I use one when I’m out on my own, when
my sister is not with me and {it’s mainly for dealing
with stairs} - I have real problems with steps not
being able to see with depth perception.
Aids for coping
Problems
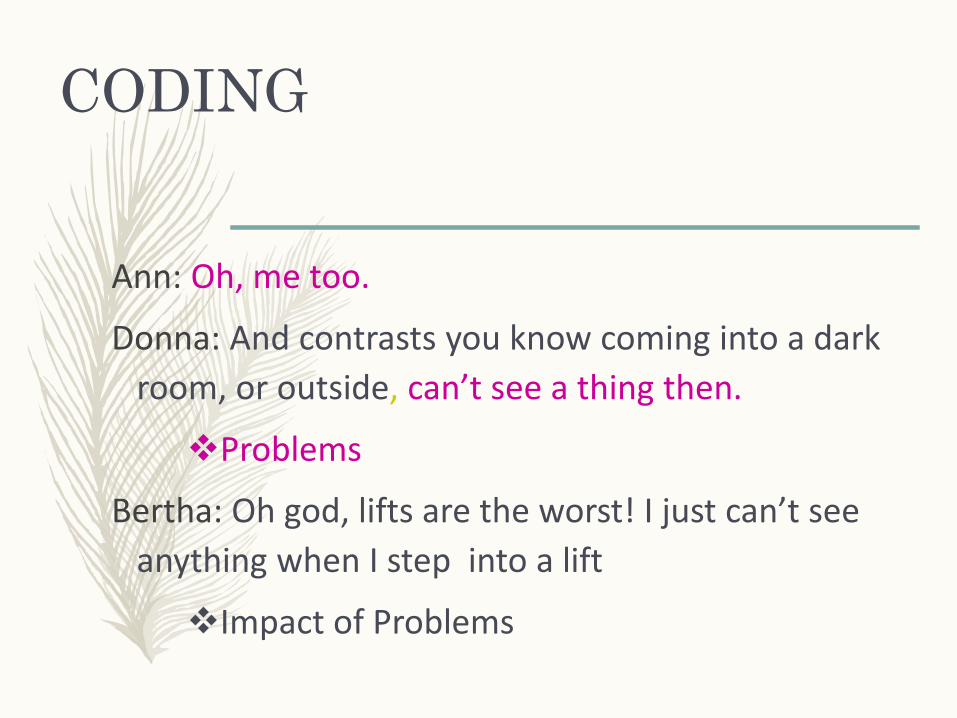
CODING
Ann: Oh, me too.
Donna: And contrasts you know coming into a dark
room, or outside, can’t see a thing then.
Problems
Bertha: Oh god, lifts are the worst! I just can’t see
anything when I step into a lift
Impact of Problems

Coding
Connie: Because it’s all dark! – I know you just have
to hope that someone else comes in to press the
buttons
Problems
Strategies for coping
Ann: That’s why I wear dark glasses outside – it
makes the contrast less.
Strategies for coping
Generating Categories
Inclusive rather than exclusive codes
– Interlink the units of data
– Try to assign two or more codes to each segment of data
Let codes emerge - read & re-read
– develop a systematic approach, Classify data & create typologies- link the codes
Change and refine the categories as you proceed.

Refining Categories
Be thorough - consider all the categories you can
Some will be discarded because they fail to resonate
with other data
Some will collapse together
The aim is to make links and determine patterns in
the data - and to identify contrasts and highlight
paradox.

KEY POINTS
There are no short cuts
Never let the data accumulate
Read & re-read and keep notes – analytic memos
-to track your thought process

KEY POINTS -2
– Merely describing / reporting what happened is
Journalism not Research
– The analytical concepts generated determine the
strength of the piece
– Data need to be integrated with established
theories and concepts with referenced literatures
to support & strengthen your case

Caveat:Do you really want to do
qualitative research?
Qualitative Research is not the easy option!
It is hard work - exhaustingly hard work.
“It is only suitable for people who care about it, take it
seriously and are prepared for commitment. It must be done
properly or not at all so unless you are fired with zeal, don’t
do it!” (Delamont, 2002:ix). Fieldwork in Educational Settings.
London: Routledge.
But - it is exhilarating, informative and addictive !