analysingvolvo)it)belgium) incident and$problem$management ...ceur-ws.org/vol-1052/paper6.pdf · 1!...
TRANSCRIPT
1
Analysing Volvo IT Belgium Incident-‐ and Problem Management Data Using Automated Business Process Discovery International Business Process Intelligence 2013 Competition

2
Author: John Hansen, ChangeGroup Partner Date: 1st July 2013 Address: ChangeGroup Flæsketorvet 68 DK-‐1711 Copenhagen K Denmark
3
Table of Contents Introduction .......................................................................................................................................... 3 Tools Used ......................................................................................................................................... 3 Approach ........................................................................................................................................... 4
Getting To Know The Process ........................................................................................................ 4 Issues To Be Solved ............................................................................................................................ 4 Push To Front – Issue ................................................................................................................... 4 Push To Front Issue -‐ Description .................................................................................... 4 Push To Front -‐ Analysis ........................................................................................................ 5 Push To Front -‐ Conclusion ................................................................................................... 8
Ping Pong Behaviour – Issue ..................................................................................................... 9 Ping Pong Behaviour – Description ................................................................................... 9 Ping Pong Behaviour – Analysis ...................................................................................... 10 Ping Pong Behaviour – Conclusion ................................................................................. 15
Wait User -‐ Issue .......................................................................................................................... 15 Process conformity per organisation -‐ Issue .................................................................. 19 Process conformity per organisation – Analysis ...................................................... 20
Appendix 1 – Business Process Using ChangeGroup Business Process ................... 23 Appendix 2 -‐ Table of Contents – Figures .............................................................................. 30
Introduction The purpose of this document is to answer the questions raised by Volvo IT Belgium in the International Business Process Intelligence 2013 competition. The scope of this analysis is the questions raised (described in the “Issues To Be Solved” section). Volvo IT Belgium has provided live data files with logged information from their incident management and problem management system VINST. Furthermore a manual for the VINST system and a description of the issues to solve has been provided.
Tools Used In order to solve the case the following tools has been user:
• Enterprise Archictect 9.1 (Sparx Systems) • Disco 1.3.0 (Fluxicon) • Excel (Microsoft Excel for Mac 2011) • Word (Microsoft Word for Mac 2011)

4
Approach The questions raised has been analysed and answered using the following approach:
1. Importing log files into Disco 2. Auto-‐generating As-‐Is processes using Disco 3. Getting to know the process – analysing As-‐Is processes in Disco, and
documenting the As-‐Is processes in BPMN using ChangeGroup Business Process approach to ensure traceability and familiarity with the process
4. Verifying that manual process discovery was not needed in order to answer the questions in scope
5. Performing business process mining and discovery using Disco analysis and Excel
Getting To Know The Process In order to getting to know the process automatic process discovery has been used (by using Disco). This excludes manual processes such as for example Event Management or “Updating the knowledgebase” during problem management. The identified process has been diagrammed using our team’s normal approach using BPMN notation – the reason for this and the business process documentation is outlined in Appendix1.
Issues To Be Solved
Push To Front – Issue
Push To Front Issue -‐ Description When an incident is raised, at first, the service desk captures it. If the incident can not be resolved by the 1st line support teams (mainly service desk) the incident is escalated to 2nd line and 3rd line support teams. The goal of the incident management process is to solve the incidents, or at least most of the incidents by the first level support (teams mainly in the Service Desk). If this strategy is followed the handling of incidents will be much more efficient.
5
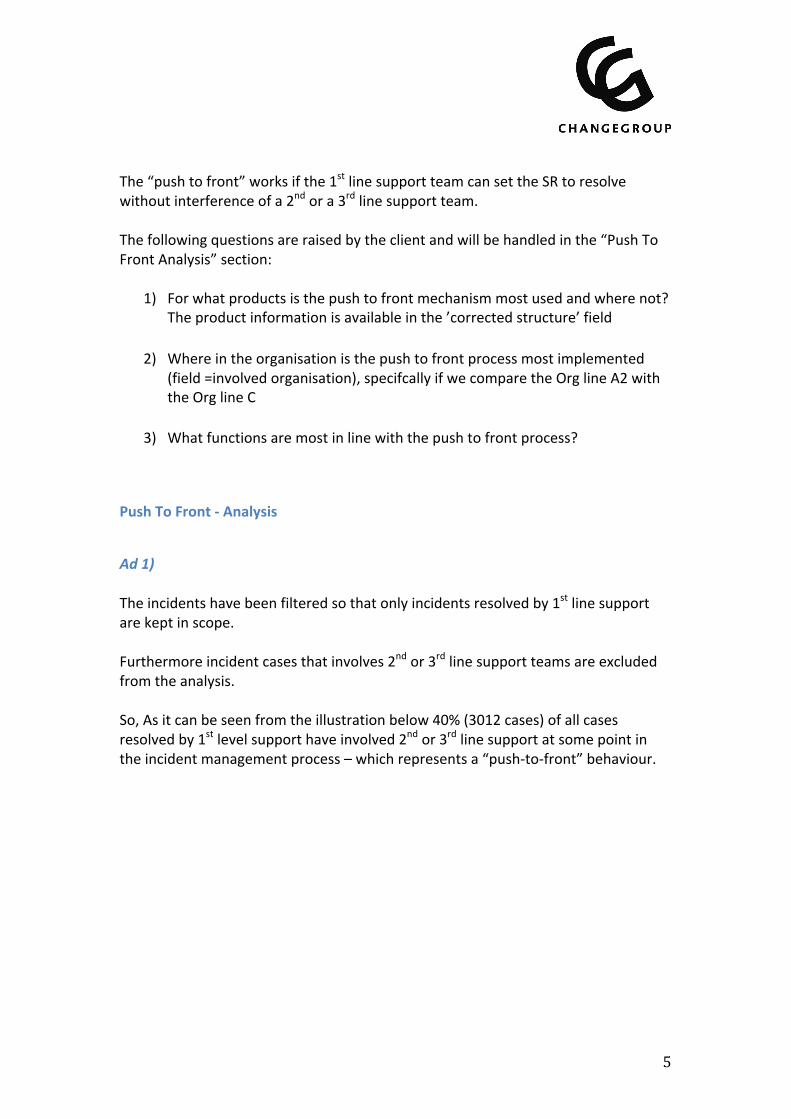
The “push to front” works if the 1st line support team can set the SR to resolve without interference of a 2nd or a 3rd line support team. The following questions are raised by the client and will be handled in the “Push To Front Analysis” section:
1) For what products is the push to front mechanism most used and where not? The product information is available in the ’corrected structure’ field
2) Where in the organisation is the push to front process most implemented (field =involved organisation), specifcally if we compare the Org line A2 with the Org line C
3) What functions are most in line with the push to front process?
Push To Front -‐ Analysis
Ad 1) The incidents have been filtered so that only incidents resolved by 1st line support are kept in scope. Furthermore incident cases that involves 2nd or 3rd line support teams are excluded from the analysis. So, As it can be seen from the illustration below 40% (3012 cases) of all cases resolved by 1st level support have involved 2nd or 3rd line support at some point in the incident management process – which represents a “push-‐to-‐front” behaviour.

6
Figure 1 -‐ 60% of All Cases Solved By 1st Line Support Does Not Involve 2nd Or 3rd Line Support
Product 424: PROD424 stands for 684 cases = 15,1 % of the cases where 2nd or 3rd line support is involved – and 9% of all cases. The top products being involved in “Push To Front” based on relative event frequency are outlined below:
Figure 2 -‐ "Push-‐to-‐front" Based on Relative Frequency of "Push-‐to-‐front" Related To Products
At first sight, it seems like especially PROD424 is involved in “Push To Front”. The Top products not being involved in “Push To Front” based on relative event frequency are outlined below.

7
Figure 3 -‐ Relative Frequency of Products Not Involved In "Push-‐to-‐front"
Ad 2) Based on the 40% cases that are pushed to front the following organizational units are most frequent involved (based on event frequency):
Figure 4 -‐ Organisational Units Most Involved In "Push To Front"
Comparing “Org line C” with “Org line A2” gives the following picture: Org Line A2 = Involved in 29,51% of the cases pushed to front, but in total of all involvement (no filter on data) shows that Org Line A2 is only involved in 19,09% of the time. Org Line C = Involved in 49,56% of the cases pushed to front, but in total of all involvement (no filter on data) shows that Org Line C is involved in 64,38% of the time.
8
Even though Org Line C is most represented in the “Push-‐To-‐Front” then relatively seen Org Line A2 is more likely to do “Push-‐To-‐Front”.
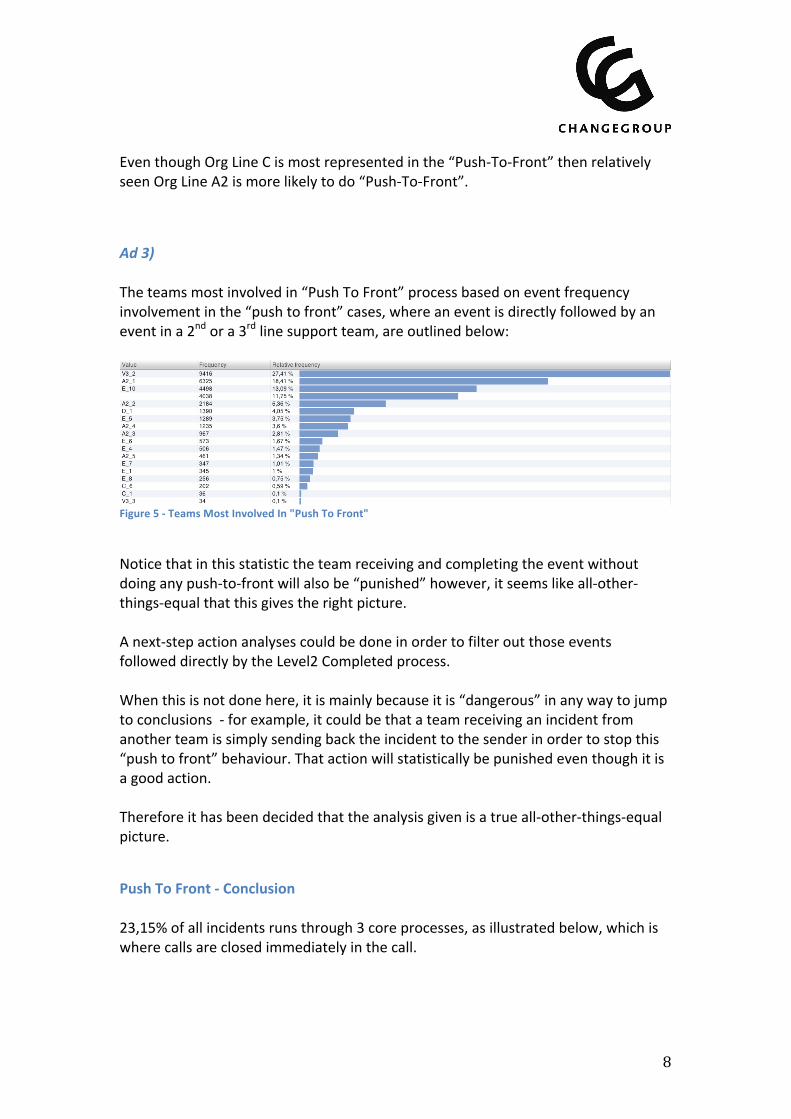
Ad 3) The teams most involved in “Push To Front” process based on event frequency involvement in the “push to front” cases, where an event is directly followed by an event in a 2nd or a 3rd line support team, are outlined below:
Figure 5 -‐ Teams Most Involved In "Push To Front"
Notice that in this statistic the team receiving and completing the event without doing any push-‐to-‐front will also be “punished” however, it seems like all-‐other-‐things-‐equal that this gives the right picture. A next-‐step action analyses could be done in order to filter out those events followed directly by the Level2 Completed process. When this is not done here, it is mainly because it is “dangerous” in any way to jump to conclusions -‐ for example, it could be that a team receiving an incident from another team is simply sending back the incident to the sender in order to stop this “push to front” behaviour. That action will statistically be punished even though it is a good action. Therefore it has been decided that the analysis given is a true all-‐other-‐things-‐equal picture.
Push To Front -‐ Conclusion 23,15% of all incidents runs through 3 core processes, as illustrated below, which is where calls are closed immediately in the call.

9
However, “Push To Front” is an issue. 40% (3012 cases) of all cases resolved by 1st level support have involved 2nd or 3rd line support at some point in the incident management process. Since those 40% cases bounces back to 1st line support it could indicate that the 2nd and 3rd line support are involved too early. It seems like PROD424 is much involved in “Push To Front”. However, there is not a clear pattern that a certain Product is more likely to involve “Push-‐To-‐Front”. Even though Org Line C is most represented in the “Push-‐To-‐Front” then relatively seen Org Line A2 is more likely to do “Push-‐To-‐Front”.
Ping Pong Behaviour – Issue
Ping Pong Behaviour – Description In an ideal world an incident is solved quick and with interference of not too many support teams. However, it occurs that support teams start to send incidents to each other again and again (ping pong) which off course is an unwanted situation. There is definitely a correlation between the ping pong behaviour and the total life time of an incident.
The following questions are raised by the client and will be handled in the “Ping Pong Behaviour Analysis” section:

10
1) What are the functions, organisation, support teams responsible for most of the “ping pong”?
2) What products are most affected by it?
Ping Pong Behaviour – Analysis In order to analyse the “ping pong behaviour” the following assumptions have been made:
1. Support Teams are identified by column “org:group” 2. Only Use Cases involving a sequence of events where more than 1 support
team is involved potentially have “ping pong” behaviour 3. Only Use Cases involving 6 or more events is potentially having “ping pong”
behaviour. With fewer than 6 events it is unlikely that more than two support teams are involved and therefore no “ping pong” behaviour applies.
4. Only when an event is of the type “Accepted – In Progress”, Accepted – Assigned”, or “Queued – Awaiting Assignment” it is a potential “ping pong” action. The reasoning behind is that if the event is from proves level2 “Completed” the support team handling the “Completed process is not, in that instance, participating in “ping pong” behaviour, but is actually handling the incident or problem.
5. Those organisation units most involved in events after filtering out cases and events as specified in bullet 1 – bullet 4 are most likely to be participation in “ping pong” behaviour.
6. Incidents reassigned to another person within the same team, is not considered “ping pong” but just a way of levelling the work load.
7. Problems (both open and closed) are not continued from Incidents regarding “ping pong” behaviour. Meaning if an Incident is not identified as “ping pong” behaviour, it does not become a “ping pong” behaviour based on the incident being transferred to Problem Management. When an incident is transferred to Problem Management the Incident Management process is ended.
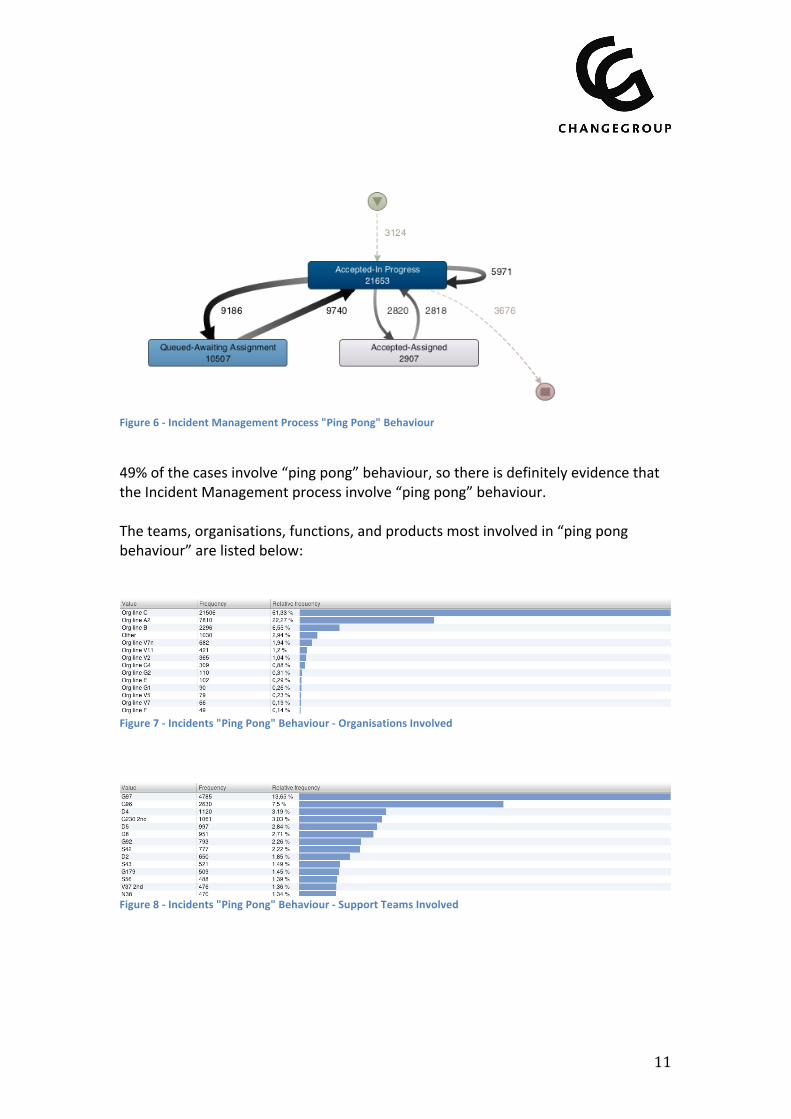
Ad 1) The process diagram below is the filtered Incidents process (filtered according to bullet 1 – bullet 4). The process diagram illustrates where the “ping pong” behaviour is involved. The “ping pong” behaviour is especially introduced by; queuing and reassigning the incident to another team or by assigning the incident to another Support Line.
11
Figure 6 -‐ Incident Management Process "Ping Pong" Behaviour
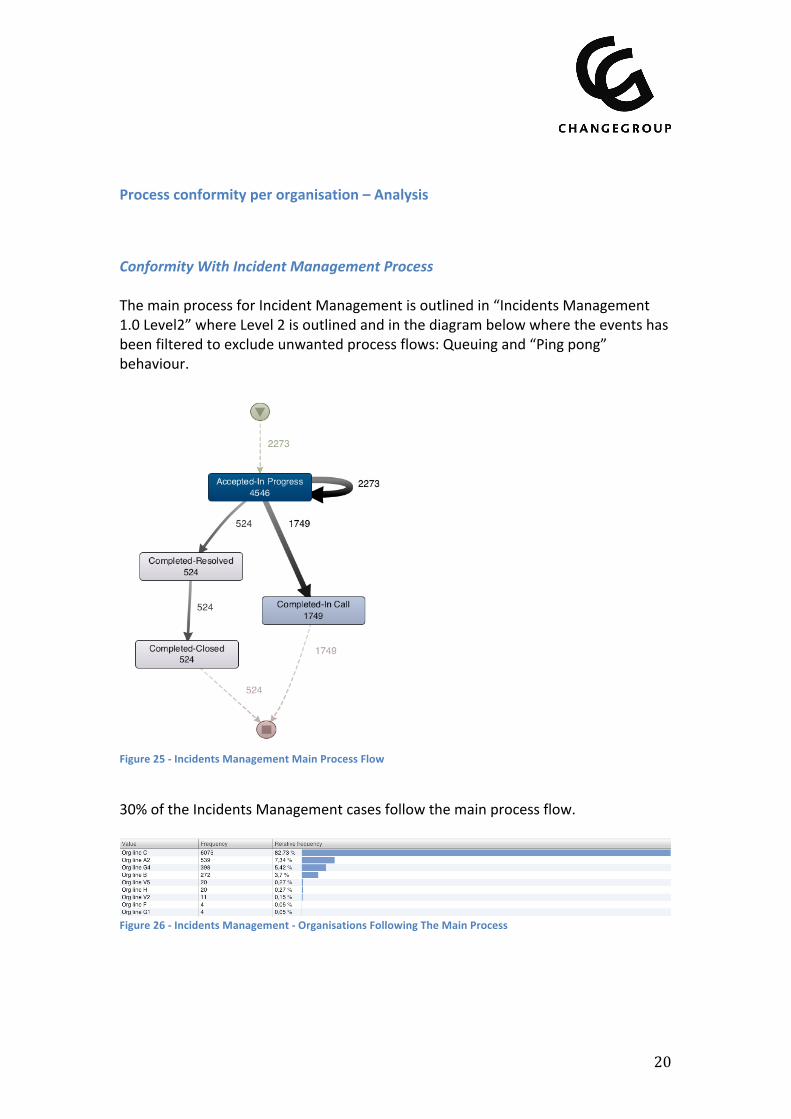
49% of the cases involve “ping pong” behaviour, so there is definitely evidence that the Incident Management process involve “ping pong” behaviour. The teams, organisations, functions, and products most involved in “ping pong behaviour” are listed below:
Figure 7 -‐ Incidents "Ping Pong" Behaviour -‐ Organisations Involved
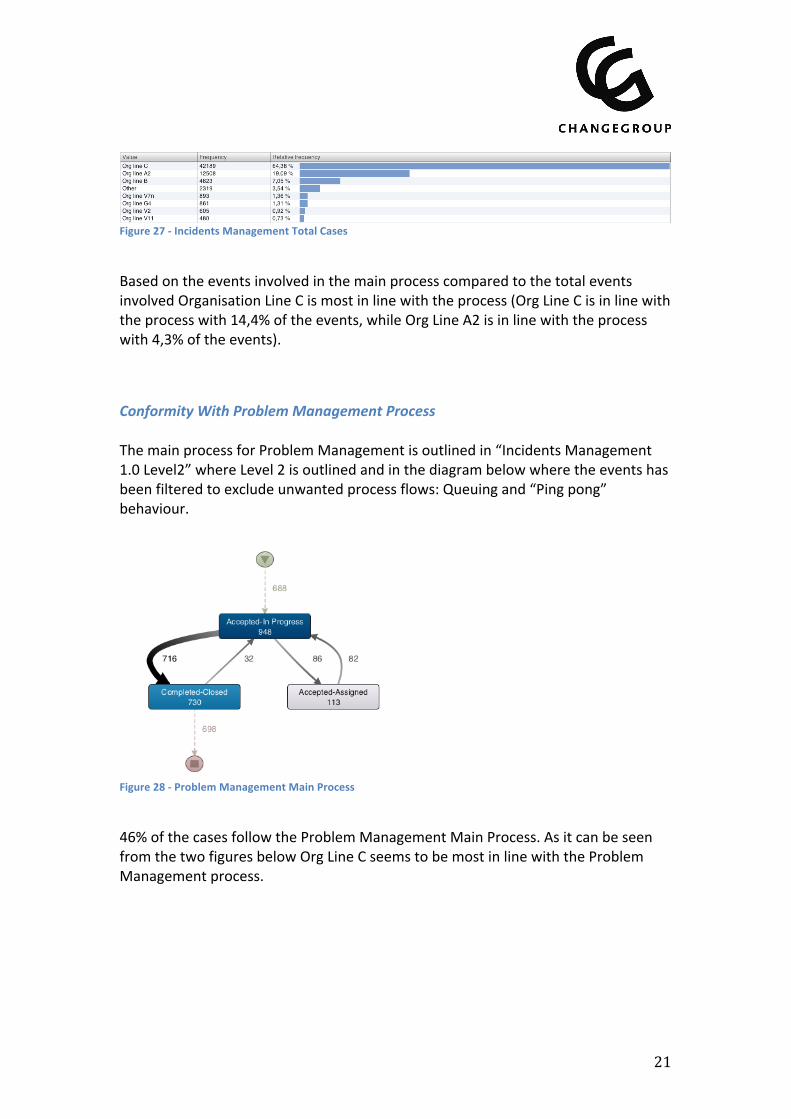
Figure 8 -‐ Incidents "Ping Pong" Behaviour -‐ Support Teams Involved

12
Figure 9 -‐ Incidents "Ping Pong" Behaviour -‐ Functions Involved
Another thing to consider is that sending an issue from one support level up to the next support level is not necessarily a bad thing (e.g. sending an Incident from Support Line 1 to Support Line 2, because escalation might be needed in order to close the Incident. However, that action will be punished in this analysis. It has been decided that this is not changing the observations and conclusions – basically because, as it can be seen from the figure below, the majority of Incidents involved in “ping pong” behaviour are low or medium Incidents. This tells that it is probably the easy Incidents that are “ping pong’ed” and those should really be closed right away by the Support Team receiving it . Furthermore, it seems like the Incidents that should or could be escalated (the high impact Incidents) are in fact not involved very much in “ping pong” behaviour.
Figure 10 -‐ "Ping Pong" Behaviour Related To Impact
Ad 1) – Open Problems Only 2% of the Open Problem cases involve “ping pong” behaviour. As illustrated in the figure below the “ping pong” process is basically around the process “Queued – Awaiting Assignment”.

13
The “ping pong” behaviour is so low in Open Problem that it does not seem to be an issue. Overall, it seems like the Open Problems are handled correct according to the intended process.
Figure 11 -‐ Open Problems -‐ "Ping Pong” Behaviour Process
Ad 1) – Closed Problems Total cases: 1487 6% of the cases involve “ping pong” behaviour Only 6% of the Closed Problem cases involve “ping pong” behaviour. As illustrated in the figure below the “ping pong” process is basically around the process “Queued – Awaiting Assignment” and “Accepted – Assigned”. The “ping pong” behaviour is so low in Closed Problem that it does not seem to be an issue. Overall, it seems like the Closed Problems are handled correct according to the intended process.

14
Figure 12 -‐ Closed Problems -‐ "Ping Pong" Behaviour Process
Ad 2) “Ping pong” Behaviour Divided On Products Since the “ping pong” behaviour is only an issue in the Incident Management process, the analysis on what products are most involved in “ping pong” behaviour is performed on Incidents only.
Figure 13 -‐ Total Divided On Products
Figure 14 -‐ "Ping Pong " Based On Products

15
Ping Pong Behaviour – Conclusion “Ping pong” behaviour is an issue in the Incident Management process. Incidents: 49% of the cases involve “ping pong” behaviour Open Problems: 2% of the cases involve ping pong behaviour Closed Problems: 6% of the cases involve ping pong behaviour Another interesting fact is that most of the incidents involved in “ping pong” behaviour are mostly low or medium impact cases (see figure below). This indicates that cases are not ping-‐pong’ed due to difficulties in solution but rather due to speeding up own KPI’s and solution times.
Figure 15 -‐ Incidents Involved In "Ping Pong" Behaviour Based On Impact
Wait User -‐ Issue Wait user -‐ Knowing that there is a lot of KPI’s measuring the total resolution time of an incident people tries to find workarounds that stop the clock from ticking. One way of doing this is manually giving an incident the substatus ’wait user’. Allthough there are guidelines not to use this substatus (unless someone is really waiting for an enduser of course), some people (action owners) are breaking this guideline.

16
The following questions are raised by the client and will be handled in the “Wait User Analysis” section:
1) Who is making most use of this substatus (action owner)?
2) What is the behaviour per support team, function, organisation etc?
3) (mis)-‐usage per location?
Assumption: Wait-‐User should only be used by system generated (by “Siebel”) issues, because those issues are just raised and waiting for user action and to be handled. 33% of the Incidents cases involve one or more events of “Accept – Wait User” where the event is not registered by the system (Siebel).
Figure 16 -‐ Incidents "Accept -‐ Wait User" Not Set By the System (Siebel)
An interesting observation is that the High impact cases are not frequently having Wait-‐User abuse (see figure below). This indicates that the Wait-‐User is indeed used as an abuse in order to stop the clock, because a real usage for “Wait-‐User” added from the action owner – for example asking for more background information – would probably be more relevant for High impact cases than for Low and Medium impact cases.

17
Figure 17 -‐ Incidents -‐ Cases With "Wait-‐User" Not Set By the System (Siebel). Distributed On Impact Level
Ad 1) In the figure below the usage and abuse of “Wait-‐User” is outlined based on Resource Country. From that overview it seems like Sweden, Poland, and India are most likely to abuse the “Wait-‐User” status. However, from looking at the table below the figure where the “wait-‐user” abuse is related to the relative involvement from the country it is obvious that Sweden is high on the list because Sweden is involved in many cases in the first place, and therefore are involved in many “Wait-‐user” abuses – but Thailand and India are actually doing more “wait-‐user” abuse relatively seen.
Figure 18 -‐ Wait-‐User Usage Based On Resource Country
Value Frequency Wait-‐User Frequence
Percentage Wait-‐User Compared To Own Total Events
South Africa 13 2 15%
THAILAND 104 12 12%
INDIA 7528 787 10%
Japan 534 43 8%
Belgium 3816 305 8%
China 1102 87 8%
POLAND 13018 1018 8%
Sweden 18905 1227 6%
USA 3973 225 6% RUSSIAN FEDERATION 216 11 5%
Korea 217 10 5%
Australia 139 6 4%
Canada 358 15 4%
Brazil 6036 225 4%
United Kingdom 198 7 4%

18
MALAYSIA 86 3 3%
France 1800 59 3%
Ad 2) “Wait-‐User” abuse based on team:
Figure 19 -‐ The 18 Teams Most Involved In "Wait-‐User" Incident Management Abuse Are Registered For 63,4% Of The Events
Figure 20 -‐ The 8 Functions Most Involved In "Wait-‐User" Incident Management Abuse Are Registered For 96,04% Of The Events
Figure 21 -‐ The Functions Most Involved In "Wait-‐User" Incident Management Abuse

19
Figure 22 -‐ Locations Most Involved In "Wait-‐User" Incidents Abuse
Figure 23 -‐ Organisations Most Involved In "Wait-‐User" Incidents Abuse
Figure 24 -‐ Products Most Involved In "Wait-‐User" Incidents Abuse
Process conformity per organisation -‐ Issue
The following question is raised by the client and will be handled in the “Process Conformity Analysis” section:
In general the Volvo IT organisation is spread in two organisations : Org line A2 and Org line C. It would be interesting to see how conform or how much in line every organisation is with the incident and problem management processes.
20
Process conformity per organisation – Analysis
Conformity With Incident Management Process The main process for Incident Management is outlined in “Incidents Management 1.0 Level2” where Level 2 is outlined and in the diagram below where the events has been filtered to exclude unwanted process flows: Queuing and “Ping pong” behaviour.
Figure 25 -‐ Incidents Management Main Process Flow
30% of the Incidents Management cases follow the main process flow.
Figure 26 -‐ Incidents Management -‐ Organisations Following The Main Process
21
Figure 27 -‐ Incidents Management Total Cases
Based on the events involved in the main process compared to the total events involved Organisation Line C is most in line with the process (Org Line C is in line with the process with 14,4% of the events, while Org Line A2 is in line with the process with 4,3% of the events).
Conformity With Problem Management Process The main process for Problem Management is outlined in “Incidents Management 1.0 Level2” where Level 2 is outlined and in the diagram below where the events has been filtered to exclude unwanted process flows: Queuing and “Ping pong” behaviour.
Figure 28 -‐ Problem Management Main Process
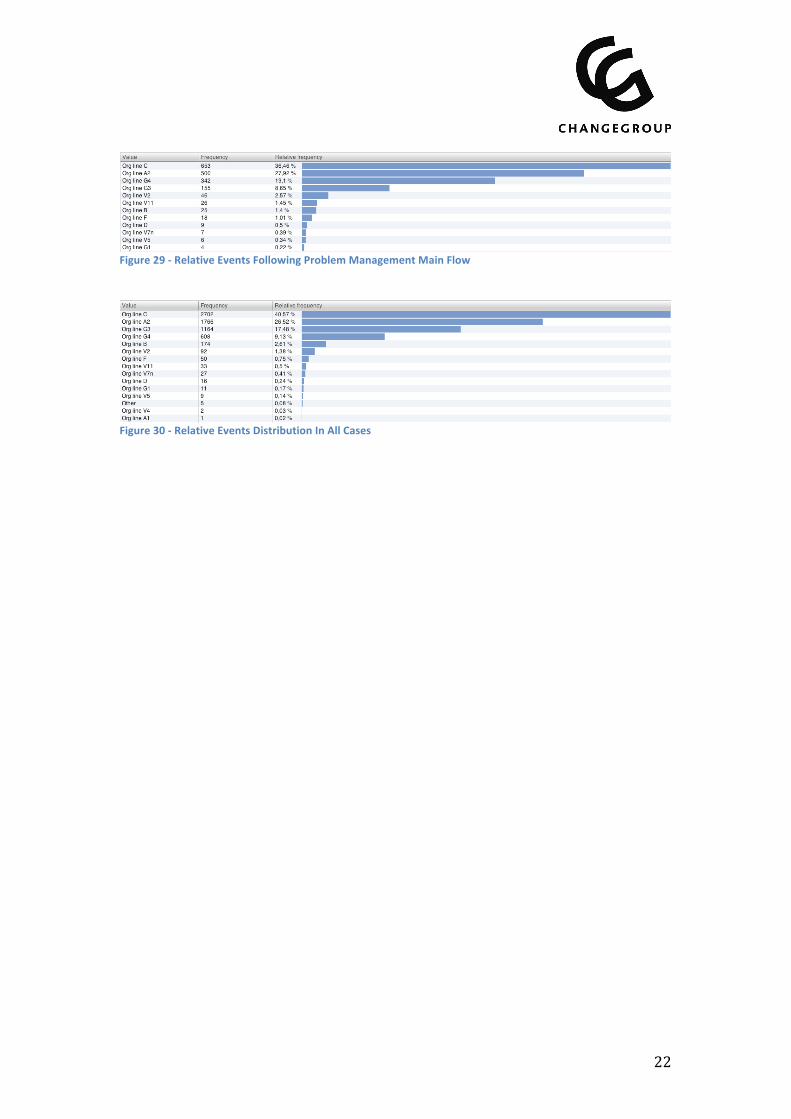
46% of the cases follow the Problem Management Main Process. As it can be seen from the two figures below Org Line C seems to be most in line with the Problem Management process.
22
Figure 29 -‐ Relative Events Following Problem Management Main Flow
Figure 30 -‐ Relative Events Distribution In All Cases
23
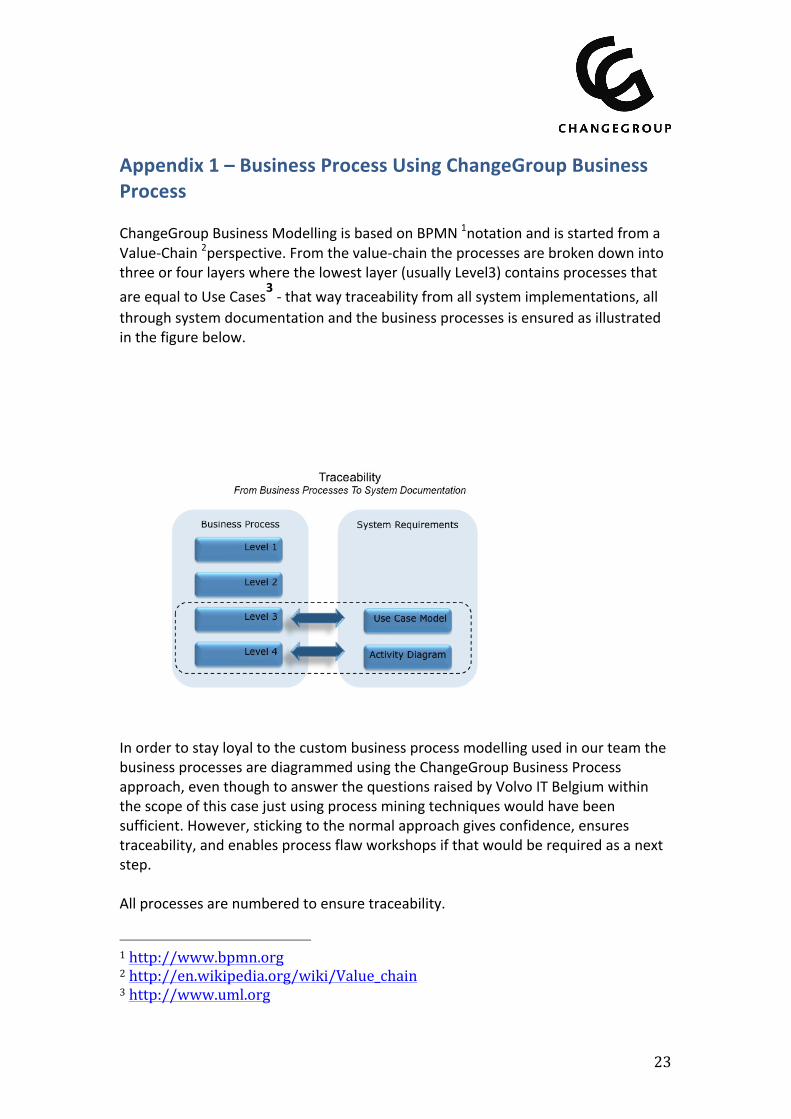
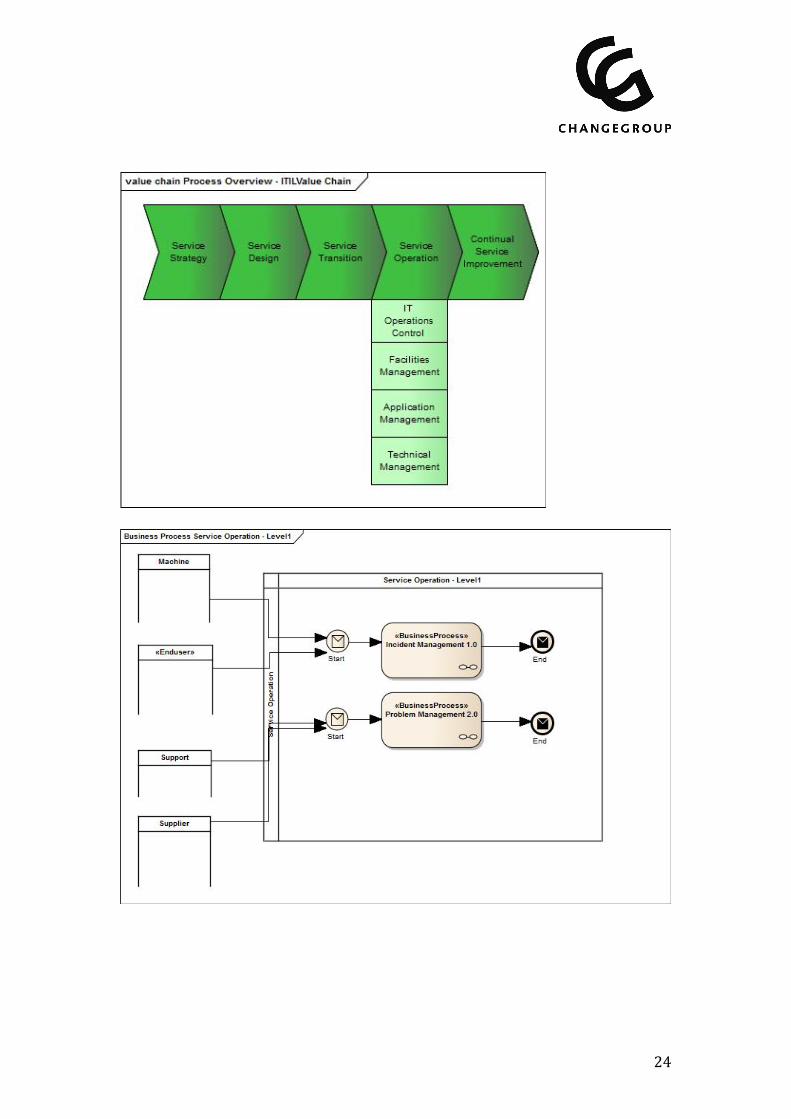
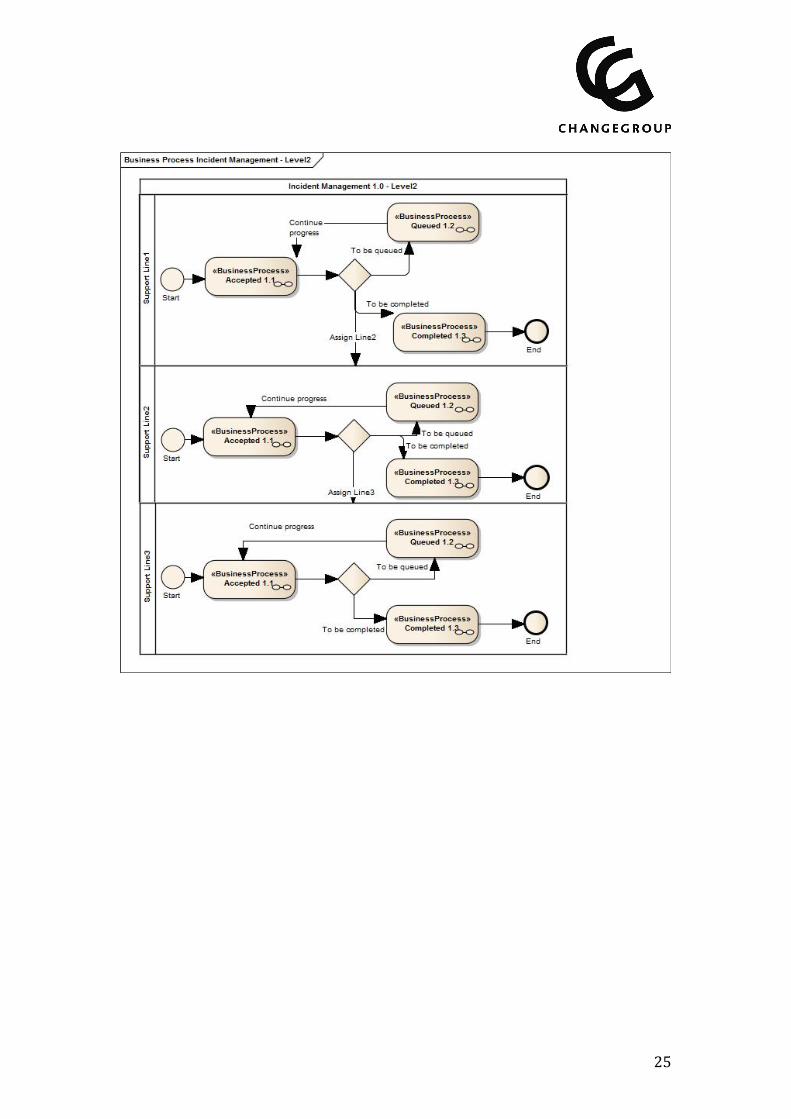
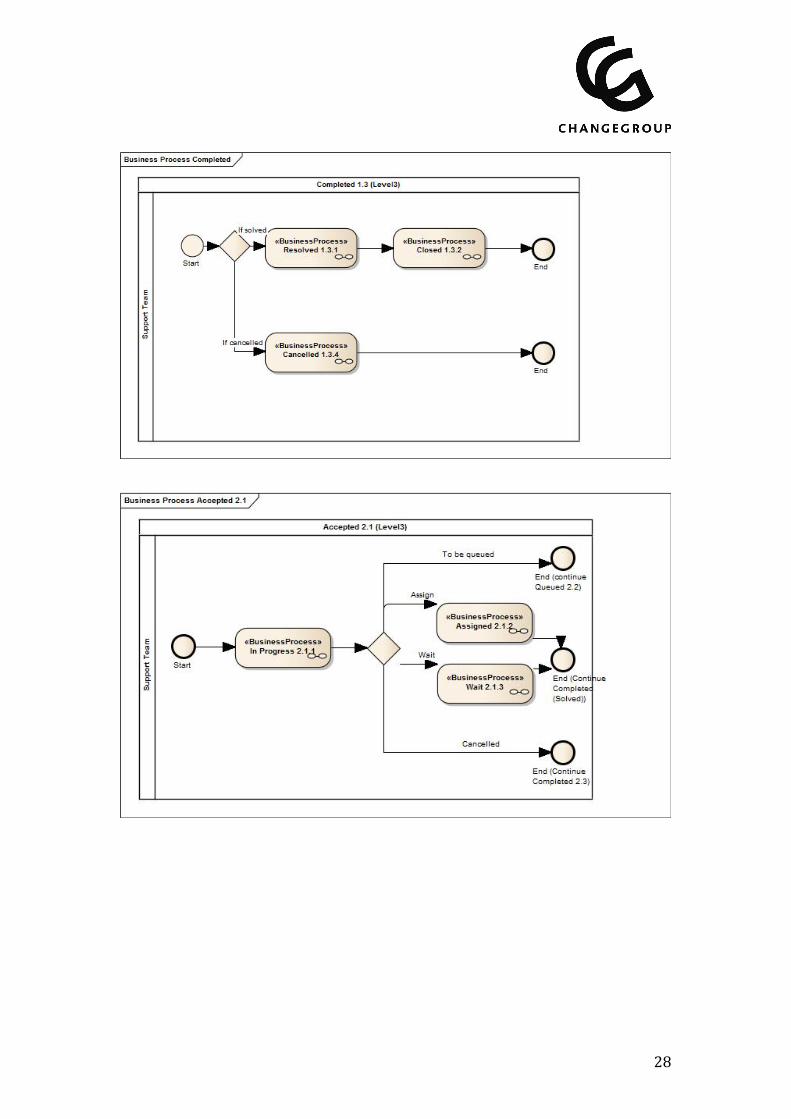
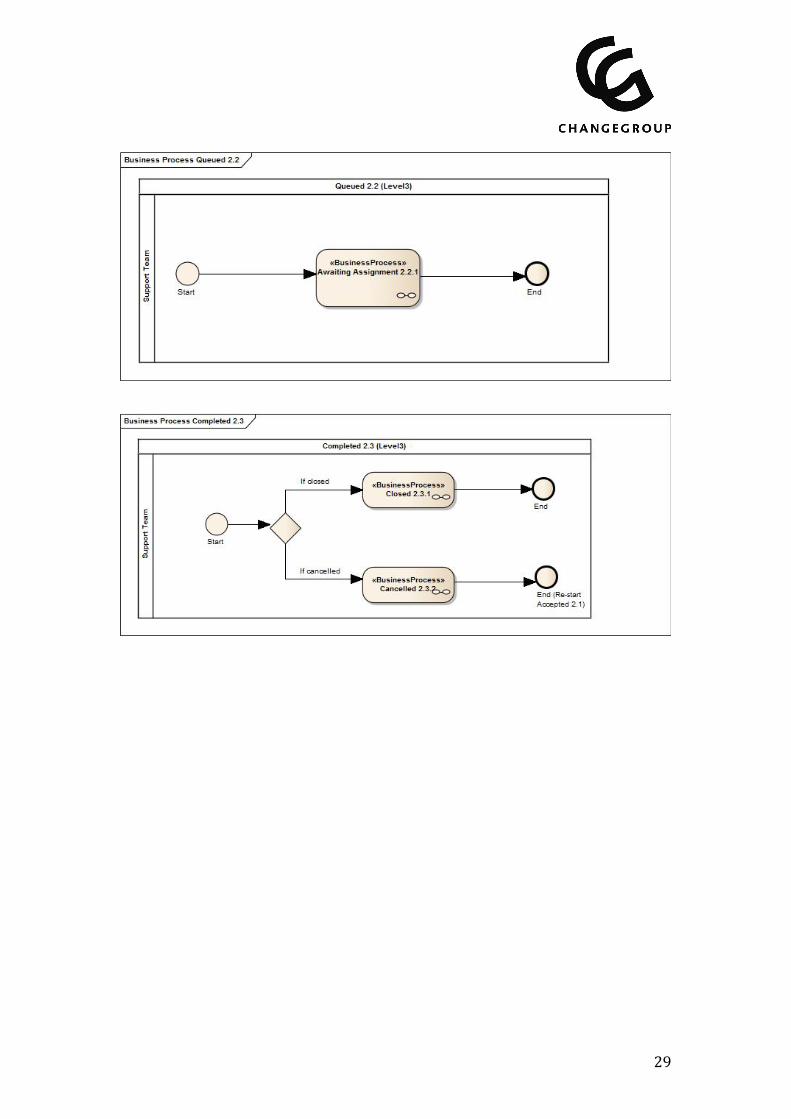
Appendix 1 – Business Process Using ChangeGroup Business Process ChangeGroup Business Modelling is based on BPMN 1notation and is started from a Value-‐Chain 2perspective. From the value-‐chain the processes are broken down into three or four layers where the lowest layer (usually Level3) contains processes that are equal to Use Cases3 -‐ that way traceability from all system implementations, all through system documentation and the business processes is ensured as illustrated in the figure below.
In order to stay loyal to the custom business process modelling used in our team the business processes are diagrammed using the ChangeGroup Business Process approach, even though to answer the questions raised by Volvo IT Belgium within the scope of this case just using process mining techniques would have been sufficient. However, sticking to the normal approach gives confidence, ensures traceability, and enables process flaw workshops if that would be required as a next step. All processes are numbered to ensure traceability.
1 http://www.bpmn.org 2 http://en.wikipedia.org/wiki/Value_chain 3 http://www.uml.org
24
25

26

27
28
29
30
Appendix 2 -‐ Table of Contents – Figures Figure 1 -‐ 60% of All Cases Solved By 1st Line Support Does Not Involve 2nd Or 3rd
Line Support .................................................................................................................................. 6 Figure 2 -‐ "Push-‐to-‐front" Based on Relative Frequency of "Push-‐to-‐front" Related To
Products ......................................................................................................................................... 6 Figure 3 -‐ Relative Frequency of Products Not Involved In "Push-‐to-‐front" .................... 7 Figure 4 -‐ Organisational Units Most Involved In "Push To Front" ...................................... 7 Figure 5 -‐ Teams Most Involved In "Push To Front" ................................................................. 8 Figure 6 -‐ Incident Management Process "Ping Pong" Behaviour .................................... 11 Figure 7 -‐ Incidents "Ping Pong" Behaviour -‐ Organisations Involved ............................. 11 Figure 8 -‐ Incidents "Ping Pong" Behaviour -‐ Support Teams Involved ........................... 11 Figure 9 -‐ Incidents "Ping Pong" Behaviour -‐ Functions Involved ..................................... 12 Figure 10 -‐ "Ping Pong" Behaviour Related To Impact .......................................................... 12 Figure 11 -‐ Open Problems -‐ "Ping Pong” Behaviour Process ............................................ 13 Figure 12 -‐ Closed Problems -‐ "Ping Pong" Behaviour Process .......................................... 14 Figure 13 -‐ Total Divided On Products ........................................................................................ 14 Figure 14 -‐ "Ping Pong " Based On Products ............................................................................ 14 Figure 15 -‐ Incidents Involved In "Ping Pong" Behaviour Based On Impact .................. 15 Figure 16 -‐ Incidents "Accept -‐ Wait User" Not Set By the System (Siebel) ................... 16 Figure 17 -‐ Incidents -‐ Cases With "Wait-‐User" Not Set By the System (Siebel).
Distributed On Impact Level ................................................................................................. 17 Figure 18 -‐ Wait-‐User Usage Based On Resource Country .................................................. 17 Figure 19 -‐ The 18 Teams Most Involved In "Wait-‐User" Incident Management Abuse
Are Registered For 63,4% Of The Events ......................................................................... 18 Figure 20 -‐ The 8 Functions Most Involved In "Wait-‐User" Incident Management
Abuse Are Registered For 96,04% Of The Events .......................................................... 18 Figure 21 -‐ The Functions Most Involved In "Wait-‐User" Incident Management Abuse
........................................................................................................................................................ 18 Figure 22 -‐ Locations Most Involved In "Wait-‐User" Incidents Abuse ............................. 19 Figure 23 -‐ Organisations Most Involved In "Wait-‐User" Incidents Abuse .................... 19 Figure 24 -‐ Products Most Involved In "Wait-‐User" Incidents Abuse .............................. 19 Figure 25 -‐ Incidents Management Main Process Flow ........................................................ 20 Figure 26 -‐ Incidents Management -‐ Organisations Following The Main Process ....... 20 Figure 27 -‐ Incidents Management Total Cases ...................................................................... 21 Figure 28 -‐ Problem Management Main Process .................................................................... 21 Figure 29 -‐ Relative Events Following Problem Management Main Flow ...................... 22 Figure 30 -‐ Relative Events Distribution In All Cases .............................................................. 22