analysis and hmm-based synthesis of hypo and...
TRANSCRIPT

Analysis and HMM-based Synthesis of Hypo and
Hyperarticulated Speech
Benjamin Picart∗, Thomas Drugman, Thierry Dutoit
TCTS Lab, Faculte Polytechnique (FPMs), University of Mons (UMons), Belgium
Abstract
Hypo and hyperarticulation refer to the production of speech with re-spectively a reduction and an increase of the articulatory efforts comparedto the neutral style. Produced consciously or not, these variations of articu-latory efforts depend upon the surrounding environment, the communicationcontext and the motivation of the speaker with regard to the listener. Thegoal of this work is to integrate hypo and hyperarticulation into speech syn-thesizers, such that they are more realistic by automatically adapting theirway of speaking to the contextual situation, like humans do. Based on ourpreliminary work, this paper provides a thorough and detailed study on theanalysis and synthesis of hypo and hyperarticulated speech. It is dividedinto three parts. In the first one, we focus on both acoustic and phoneticmodifications due to articulatory effort changes. The second part aims atdeveloping a HMM-based speech synthesizer allowing a continuous control ofthe degree of articulation. This requires to first tackle the issue of speakingstyle adaptation to derive hypo and hyperarticulated speech from the neu-tral synthesizer. Once this is done, an interpolation and extrapolation of theresulting models enables to finely tune the voice so that it is generated withthe desired articulatory efforts. Finally the third and last part focuses ona perceptual study of speech with a variable articulation degree, where it isanalyzed how intelligibility and various other voice dimensions are affected.
Keywords: Speech Synthesis, HTS, Speech Analysis, Expressive Speech,
∗Corresponding author. Tel. +32 65 374746. Fax +32 65 374729Email addresses: [email protected] (Benjamin Picart),
[email protected] (Thomas Drugman), [email protected](Thierry Dutoit)
Preprint submitted to Computer Speech and Language April 25, 2013
Speaking Style Adaptation, Voice Quality, Speech Intelligibility
1. Introduction
The “H and H” theory [Lindblom (1983)] proposes two degrees of artic-ulation of speech: hyperarticulated speech, for which speech clarity tendsto be maximized by increasing the articulation efforts to produce speech,and hypoarticulated speech, where the speech signal is produced with mini-mal articulation efforts. Therefore the degree of articulation (DoA) providesinformation on the motivation and personality of the speaker vs. the listen-ers [Beller (2009)]. Indeed, when talkers speak, they also listen [Cooke et al.(2012)]. Speakers can adopt a speaking style allowing them to be understoodmore easily in difficult communication situations. In this work, “hyperartic-ulated speech” (HPR) refers to the situation of a teacher or a speaker talkingin front of a large audience (important articulation efforts have to be madeto be understood by everybody). “Hypoarticulated speech” (HPO) refers tothe situation of a person talking in a narrow environment or very close tosomeone (few articulation efforts have to be made to be understood). “Neu-tral speech” (NEU) refers to the daily life situation of a person reading alouda text emotionless (e.g. no happiness, no anger, no excitement, etc) andwithout any specific articulation efforts to produce the speech, keeping onlythe sentence intonation: pitch rise for a question, flat pitch for an affirma-tive or negative sentence, etc. It is worth noting that these three modes ofexpressivity are emotionless, but can vary amongst speakers as reported in[Beller (2009)]. The influence of emotion on the DoA has been studied in[Beller (2007)] [Beller et al. (2008)] and is out of the scope of this work.
The DoA is characterized by modifications of the phonetic context, of thespeech rate and of the spectral dynamics (vocal tract rate of change). Thecommon measure of the DoA consists in defining formant targets for eachphone, taking coarticulation into account, and studying differences betweenreal observations and targets vs. the speech rate. Since defining formanttargets is not an easy task, Beller proposed in [Beller (2009)] a statisticalmeasure of the DoA by studying the joint evolution of the vocalic triangle(i.e. the shape formed by the vowels /a/, /i/ and /u/ in the F1 - F2 space)area and the speech rate. A recent study presented a computational modelof human speech production to provide a continuous adjustment accordingto environmental conditions [Nicolao et al. (2012)].
2
In direct connection with HPR speech, the “Lombard effect” [Lombard(1911)] refers to the speech changes due to the immersion of the speaker ina noisy environment. It is indeed known that a speaker tends to increasehis vocal efforts to be more easily understood while talking in a backgroundnoise [Summers et al. (1988)]. Various aspects of the Lombard effect werealready studied, including acoustic and articulatory characteristics [Garnieret al. (2006a)] [Garnier et al. (2006b)], features extracted from the glottalflow [Drugman and Dutoit (2010)], or changes of F0 and of the spectral tilt[Lu and Cooke (2009)], etc.
Some works have been done in the framework of concatenative speechsynthesis to enhance the speech intelligibility by means of Lombard or HPRspeech. For example, speech intelligibility improvement has been carried outfor a limited domain task in [Langner and Black (2005)] based on voice con-version techniques. For this, they recorded the CMU SIN database [Langnerand Black (2004)] containing two parallel corpora obtained respectively underclean and noisy conditions. Another example is the Loudmouth synthesizer[Patel et al. (2006)], which emulates human modifications (both acoustic andlinguistic) to speech in noise by manipulating word duration, fundamentalfrequency and intensity. In [Bonardo and Zovato (2007)], it is proposed totune dynamic range controllers (e.g. compressors and limiters) and someuser controls (e.g. speaking rate and loudness) to improve the intelligibilityof synthesized speech. Various methods allowing automatic modification ofspeech in order to achieve the same goal are investigated in [Anumanchipalliet al. (2010)] (e.g. boosting the signal amplitude in important frequencybands, modification of prosodic and spectral properties, etc). Another work[Cernak (2006)] introduced an additional measure evaluating intelligibilityfor the unit cost in unit selection based speech synthesis.
A new method for extracting or modifying mel cepstral coefficients basedon an intelligibility measure for speech in noise, the Glimpse proportion mea-sure, has been proposed in [Valentini-Botinhao et al. (2012a)] [Valentini-Botinhao et al. (2012b)]. Lombard speech synthesis in HMM-based speechsynthesis has also been performed in [Raitio et al. (2011)]. Nonetheless, con-trarily to the Lombard effect which is a reflex produced unconsciously due tothe noisy surrounding environment [Junqua (1993)], HPR speech is defined asthe voice produced with increased articulatory efforts compared to the NEUstyle. From a general point of view, these latter efforts might therefore alsoresult from a voluntary decision to enhance speech intelligibility to facilitatethe listener’s comprehension (like in the case of teaching). A similar case
3

happens when people hyperarticulate in front of interactive systems, hopingto correct their recognition errors [Oviatt et al. (1998)].
This article provide a detailed and complete study on the integration ofthe DoA in HMM-based speech synthesis, based on our preliminary workson the subject [Picart et al. (2010)] [Picart et al. (2011a)] [Picart et al.(2011b)] [Picart et al. (2012)]: NEU speech, HPO (or casual) and HPR(or clear) speech. HPO and HPR speech are of interest in many daily lifeapplications: expressive voice conversion (e.g. for embedded systems andvideo games), “reading speed” control for visually impaired people (i.e. fastspeech synthesizers, more easily produced using HPO speech), improvingintelligibility performance in adverse environments (e.g. GPS voice insidea moving car, train or flight information in stations or halls), adapting thedifficulty level when learning foreign languages with the student’s progresses(i.e. from HPR to HPO speech), etc. Note also that the ultimate goal ofour research is to be able to continuously control the DoA of an existingstandard neutral voice for which no HPO and HPR recordings are available.The results of this article are therefore necessary and essential to reach thisobjective.
For this, the article is divided into three main parts. Based on a databaserecorded specifically for this work (Section 2) and which contains three par-allel corpora (one for each DoA to be studied - NEU, HPO and HPR speech),the first part focuses on the analysis of the effects induced by the DoA on thespeech signal (Section 3). This is performed both at the acoustic (Section3.1) and phonetic (Section 3.2) levels, in order to have a better understandingof the specific characteristics governing HPO and HPR speech.
The second part is devoted to the integration of the DoA in the HMM-based speech synthesis framework (Section 4), which can be subdivided intothree tasks: i) training of a HMM-based speech synthesizer, using the wholedatabase described in Section 2, for each DoA considered in this work (NEU,HPO and HPR) in Section 4.1; ii) being able to produce HPO and HPRspeech directly from the NEU synthesizer, by studying the efficiency of speak-ing style adaptation as a function of the size of the adaptation database (Sec-tion 4.2); iii) implementing a continuous control (also called tuner) of theDoA, manually adjustable by the user, to obtain not only NEU, HPO andHPR speech, but also any intermediate, interpolated or extrapolated DoA ina continuous way (Section 4.3). Speaker adaptation [Yamagishi et al. (2009)]is a technique to transform a source speaker’s voice into a target speaker’svoice, by adapting the source HMM-based model (which is trained using the
4

source speech data) with a limited amount of target speech data. The sameidea lies for speaking style adaptation [Tachibana et al. (2003)] [Nose et al.(2009)].
The third part targets a perceptual multi-dimensional assessment of theDoA of the synthesizers (Section 5). We first evaluate the necessity of in-tegrating a variable DoA in a HMM-based speech synthesis system whenthis latter is embedded in adverse conditions, which happens very often indaily life applications: for example, GPS voice inside a moving car (additivenoise), train or flight information in stations or halls (reverberation), etc.The intelligibility of generated voice is studied as a function of the DoA, aswell as the type and level of degradation. Secondly, the effectiveness of syn-thesized speech with variable articulatory efforts is compared to the originalrecordings through 7 aspects: overall quality, comprehension, pleasantness,non-monotony, naturalness, fluidity and pronunciation. Finally, Section 6concludes this research work by summarizing its major accomplishments.
2. Database with various Degrees of Articulation
For the purpose of our research, a new French database was recorded.It consists of utterances produced by a single male speaker, aged 25 andnative French (Belgium) speaking. The database contains three separatesets, each set corresponding to one DoA (NEU, HPO and HPR). For eachset, the speaker was asked to pronounce the same 1359 phonetically balancedsentences (around 75, 50 and 100 minutes of NEU, HPO and HPR speechrespectively), as emotionless as possible. The speaker was placed inside asound-proof room, equipped with a screen displaying the sentences to bepronounced, and with an AKG C3000B microphone. The audio acquisitionsystem Motu 8pre was used outside this room, with a sampling rate of 44.1kHz. Finally, a headset was provided to the speaker for both HPO and HPRrecordings, in order to induce him to speak naturally while modifying hisDoA.
While recording HPR speech, the speaker was listening to a version ofhis voice modified by a “Cathedral” effect. This effect produces a lot ofreverberations (as in a real cathedral), forcing the speaker to talk slowerand as clearly as possible (more articulatory efforts to produce speech). The“Cathedral” environment was generated by the digital multi-effects processorBehringer Virtualizer DSP1000. On the other hand, while recording HPOspeech, the speaker was listening to an amplified version of his own voice.
5

This effect produces the impression of talking very close to someone in anarrow environment, allowing the speaker to talk faster and less clearly (lessarticulatory efforts to produce speech). The amplification effect was createdusing the Powerplay Pro-8 HA8000 amplifier. Proceeding that way allows usto create a “standard recording protocol” to obtain repeatable conditions ifrequired in the future.
Recordings were then resampled to 16 kHz and normalized in loudness.This is because we want our study to be independent of the level of energyof speech, and focus on the phonetic and prosodic modifications, as well asin the acoustic changes related to the vocal tract function and to the glottalproduction. Finally, utterances have been segmented such that they startand finish with a silence of about 200 ms.
3. Acoustic and Phonetic Features in Hypo and HyperarticulatedSpeech
One can expect important changes during the production of HPO andHPR speech, compared to NEU speech style. For example, [Oviatt et al.(1998)] provide, amongst others, a comprehensive analysis of acoustic, prosodic,and phonological adaptations to speech during human-computer error reso-lution. These modifications could be categorized in two main parts: acoustic(Section 3.1) and phonetic (Section 3.2) variations. The first part is relatedto the speech production using the vocal tract (Section 3.1.1) and the glot-tal excitation (Section 3.1.2), while the second part focuses on the changesinduced on the phonetic transcriptions. The latter section analyses respec-tively glottal stops (Section 3.2.1), phone variations (Section 3.2.2), phonedurations (Section 3.2.3), and the speech rate (Section 3.2.4) for each DoA.Note that all the results we report throughout this section were obtained byan analysis led on the entire original corpora (as described in Section 2).
3.1. Acoustic Analysis
Acoustic modifications in expressive speech have been extensively stud-ied in the literature [Klatt and Klatt (1990)], [Childers and Lee (1991)],[Keller (2005)]. Important changes related to the response of the vocal tract(also referred to as supralaryngeal structures in articulatory phonetics [Laver(1994)]) are expected in this study. Indeed, the articulatory strategy adoptedby the speaker may dramatically vary during the production of HPO andHPR speech. Although it is still not clear whether these modifications consist
6

of a reorganization of the articulatory movements, or of a reduction or an am-plification of the normal ones, speakers generally tend to consistently changetheir way of articulating. According to the “H and H” theory [Lindblom(1983)], speakers minimize their articulatory trajectories in HPO speech, re-sulting in a low intelligibility, while an opposite strategy is adopted in HPRspeech. As a consequence, vocal tract (or supralaryngeal) configurations maybe strongly affected. The resulting changes are studied in Section 3.1.1. Inaddition, the produced voice quality is also altered. Since voice quality vari-ations are mainly considered to be controlled by the glottal source [Drugmanet al. (2012)] [D’Alessandro (2006)] [Sodersten et al. (1995)], Section 3.1.2focuses on the modifications of glottal characteristics (also sometimes calledlaryngeal features [Laver (1994)]) with regard to the DoA.
3.1.1. Vocal Tract-based Modifications
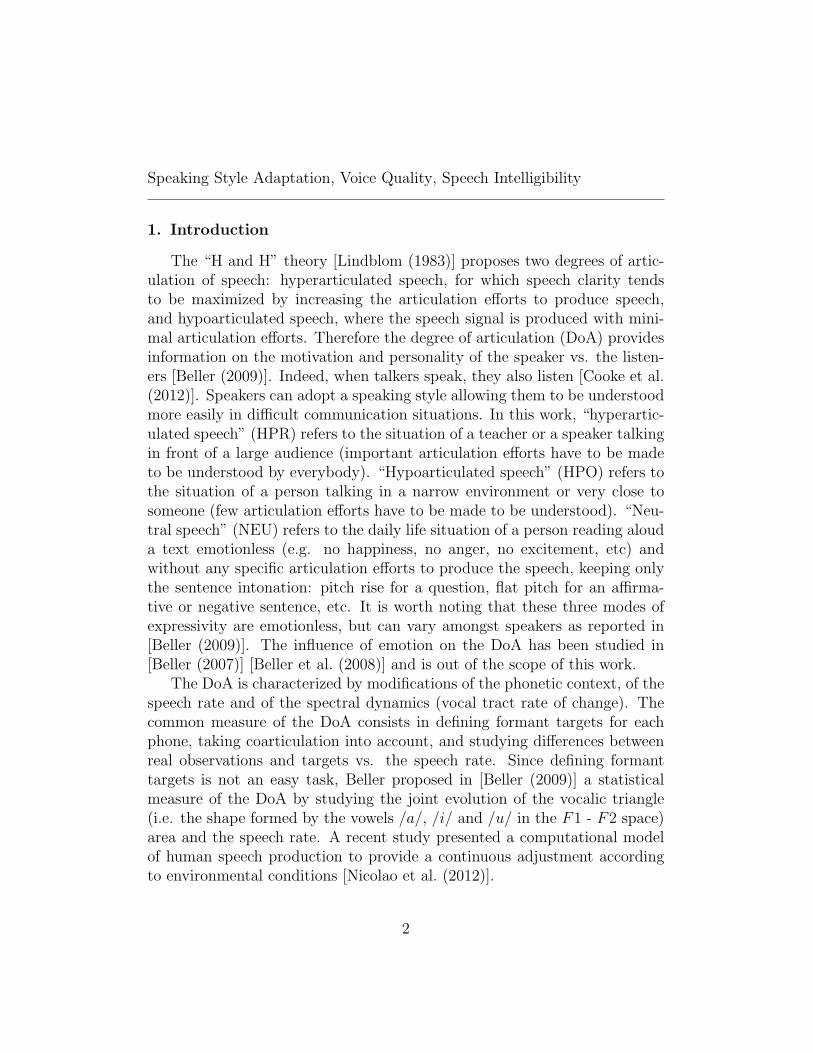
Beller analyzed in [Beller (2009)] the evolution of the vocalic triangle withthe DoA, providing interesting information about the variations of the vocaltract resonances. The vocalic triangle is the shape formed by the vowels /a/,/i/ and /u/ in the space constituted by the two first formant frequencies F1and F2 (here estimated via the Wavesurfer software [Sjolander and Beskow(2000)]). Figure 1 displays, for the original sentences, the evolution of thevocalic triangle with the DoA. Dispersion ellipses are also indicated on thisfigure for information. It is observed that dispersion can be high for the vowel/u/ (particularly for F2), while data are relatively well concentrated for vow-els /a/ and /i/. A significant reduction of the vocalic triangle area is clearlynoticed as speech becomes less articulated: from HPR (0.274 kHz2) to NEU(0.201 kHz2) to HPO speech (0.059 kHz2). As a consequence of this reduc-tion, acoustic targets become less separated in the vocalic space, confirmingthat articulatory trajectories are less marked during an HPO strategy. Thisexplains also partially the lowest intelligibility in HPO speech. The oppositetendency is observed for HPR speech, resulting from the increased articula-tory efforts produced by the speaker.
3.1.2. Glottal-based Modifications
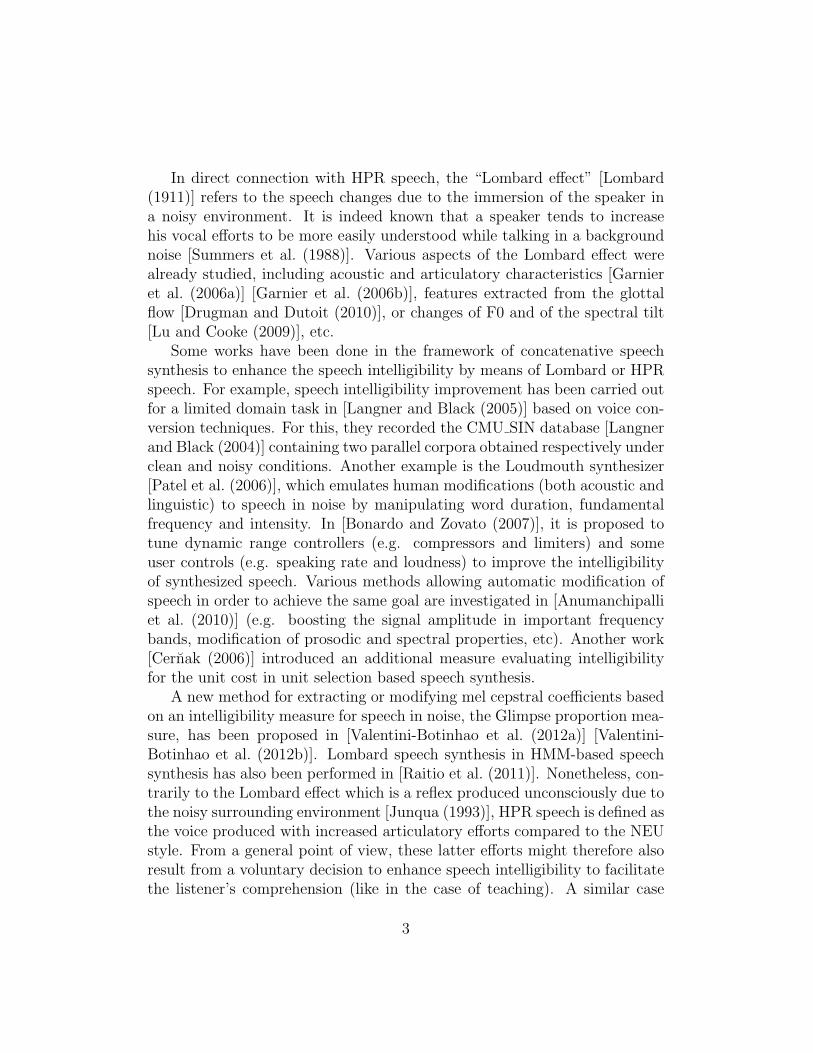
As the most important perceptual glottal feature, pitch histograms aredisplayed in Figure 2. It is clearly noted that the more speech is articulated,the higher the fundamental frequency on average and the more important itsdynamics range. Besides these prosodic modifications, we investigated how
7

600 800 1000 1200 1400 1600 1800 2000 2200100
200
300
400
500
600
700
800
F2 [Hz]
F1 [H
z]
HPRNEUHPO
/a/
/i//u/
Figure 1: Vocalic triangle estimated on the original recordings for each DoA, together withdispersion ellipses.
some characteristics of the glottal flow are affected. The interested reader isreferred to [Picart et al. (2010)] for more details about the following results.
The glottal source is estimated by the Complex Cepstrum-based Decom-position algorithm (CCD, [Drugman et al. (2011)]) as it was shown in [Drug-man et al. (2012)] to provide the best results of the glottal source estima-tion. This technique relies on the mixed-phase model of speech [Bozkurtand Dutoit (2003)]. According to this model, speech is composed of bothminimum-phase and maximum-phase components, where the latter contri-bution is only due to the glottal flow. The averaged magnitude spectrumof the glottal source for each DoA was computed using this technique, onthe original data contained in our database (Section 2), and our conclusiveobservations are the following:
• resulting spectra have a strong similarity with models of the glottalsource (such as the LF model [Fant et al. (1985)]), which corroboratesthe validity of these models and of the estimation process;
• a high DoA is characterized by a glottal flow containing more energyin the high frequencies, compared to the NEU case;
• the glottal formant frequency increases with the DoA, meaning that
8

the glottal open phase is more abrupt in HPR speech.
80 100 120 140 160 180 200 220 2400
0.005
0.01
0.015
0.02
0.025
0.03
0.035
0.04
0.045
0.05
Fundamental Frequency (Hz)
Prob
abili
ty
HPRNEUHPO
Figure 2: Pitch histograms for each DoA.
In some approaches, such as the Harmonic plus Noise Model (HNM,[Stylianou (2001)]) or the Deterministic plus Stochastic Model of residualsignal (DSM, [Drugman and Dutoit (2012)]) which will be used for synthesisin Section 4, the speech signal is considered to be modeled by a non-periodiccomponent beyond a given frequency. This maximum voiced frequency (Fm)demarcates the boundary between two distinct spectral bands, where respec-tively an harmonic and a stochastic modeling (related to the turbulences ofthe glottal airflow) are supposed to hold. From our experiments, it turns outthat:
• the more speech is articulated, the higher Fm, the stronger the har-monicity, and consequently the weaker the presence of noise in speech;
• the average values of Fm are 4215 Hz (HPR), 3950 Hz (NEU) and 3810Hz (HPO). Note that this confirms the choice of 4 kHz for the synthesisof NEU speech in [Pantazis and Stylianou (2008)] or [Drugman andDutoit (2012)].
3.2. Phonetic Analysis
In complement to the acoustic analysis of HPO and HPR speech in Sec-tion 3.1, we also investigate their phonetic modifications compared to NEU
9
style. In the following, glottal stops (Section 3.2.1), phone variations (Section3.2.2), phone durations (Section 3.2.3) and speech rates (Section 3.2.4) arestudied. These results are here reported for the whole database described inSection 2, although such phonetic changes are known to have a certain inter-speaker variability [Beller (2009)]. Note that the database was segmentedusing HMM forced alignment [Malfrere et al. (2003)] using the 36 standardFrench phones and the SAMPA phonetic alphabet.
3.2.1. Glottal Stops
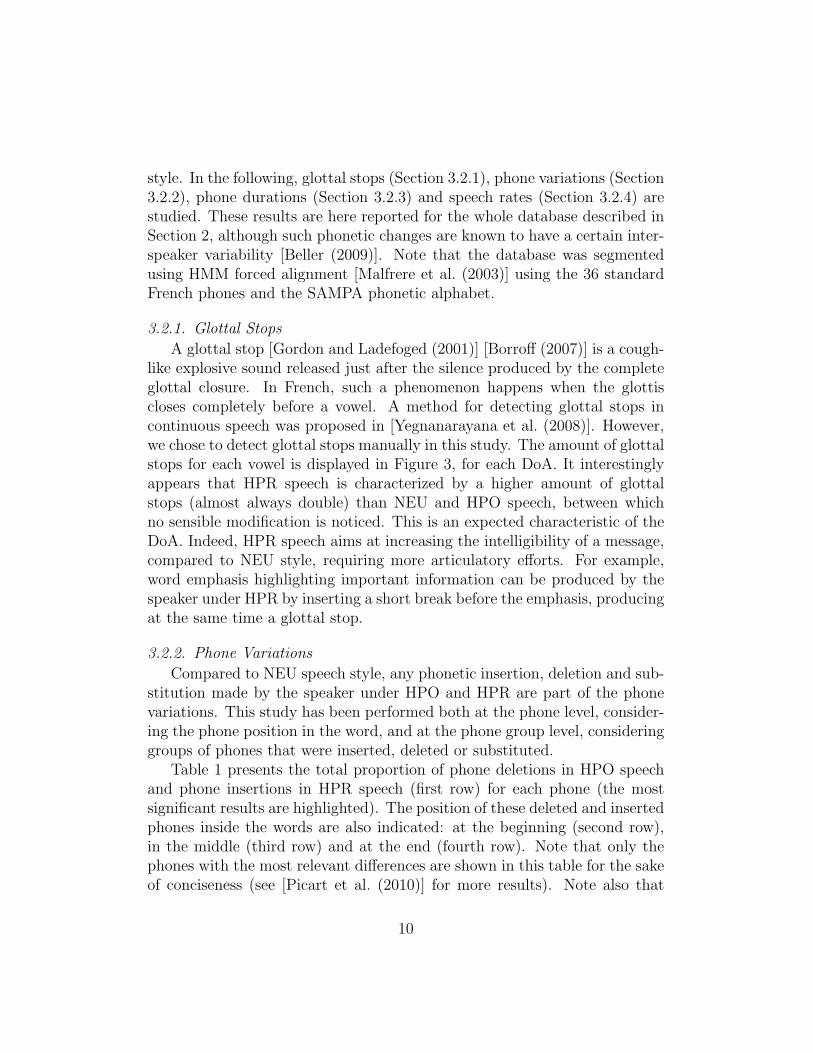
A glottal stop [Gordon and Ladefoged (2001)] [Borroff (2007)] is a cough-like explosive sound released just after the silence produced by the completeglottal closure. In French, such a phenomenon happens when the glottiscloses completely before a vowel. A method for detecting glottal stops incontinuous speech was proposed in [Yegnanarayana et al. (2008)]. However,we chose to detect glottal stops manually in this study. The amount of glottalstops for each vowel is displayed in Figure 3, for each DoA. It interestinglyappears that HPR speech is characterized by a higher amount of glottalstops (almost always double) than NEU and HPO speech, between whichno sensible modification is noticed. This is an expected characteristic of theDoA. Indeed, HPR speech aims at increasing the intelligibility of a message,compared to NEU style, requiring more articulatory efforts. For example,word emphasis highlighting important information can be produced by thespeaker under HPR by inserting a short break before the emphasis, producingat the same time a glottal stop.
3.2.2. Phone Variations
Compared to NEU speech style, any phonetic insertion, deletion and sub-stitution made by the speaker under HPO and HPR are part of the phonevariations. This study has been performed both at the phone level, consider-ing the phone position in the word, and at the phone group level, consideringgroups of phones that were inserted, deleted or substituted.
Table 1 presents the total proportion of phone deletions in HPO speechand phone insertions in HPR speech (first row) for each phone (the mostsignificant results are highlighted). The position of these deleted and insertedphones inside the words are also indicated: at the beginning (second row),in the middle (third row) and at the end (fourth row). Note that only thephones with the most relevant differences are shown in this table for the sakeof conciseness (see [Picart et al. (2010)] for more results). Note also that
10

i e E a O o u y 2 9 @ e~ a~ o~ 9~0
50
100
150
200
250
300
Vowels
Num
ber o
f Glo
ttal S
tops
HPRNEUHPO
Figure 3: Number of glottal stops for each vowel and each DoA.
since there is no significant deletion process in HPR, no significant insertionprocess in HPO and no significant substitution process in both cases, theyare not shown in Table 1.
Phone /z/ /Z/ /l/ /R/ /@/ / /
Tot 3.1 5.1 2.2 3.4 29.7 14.2Deletions Beg 0.0 4.95 0.26 0.03 11.49 14.2(HPO) Mid 0.94 0.15 0.44 1.62 2.85 0.0
End 2.16 0.0 1.50 1.75 15.39 0.0
Tot 4.0 0.6 0.1 0.2 40.0 26.5Insertions Beg 0.0 0.0 0.025 0.0 0.60 26.5
(HPR) Mid 0.41 0.15 0.025 0.04 1.68 0.0End 3.59 0.45 0.05 0.16 37.72 0.0
Table 1: Deleted and inserted phones percentage in HPO and HPR speech respectively,compared to NEU style, and their repartition inside the words: total (first row), beginning(second row), middle (third row), end (fourth row).
The most important variations concern breaks / / and Schwa /@/ dele-tions for HPO speech and insertions for HPR speech. Moreover, HPO speechcounts also other significant phone deletions, i.e. /R/, /l/, /Z/ and /z/.
Schwa, also called “mute e” or “unstable e”, is very important in French.It is the only vowel that can or cannot be pronounced (all other vowels
11
should be clearly pronounced), and several authors have focused on its usein French (see for example [Browman and Goldstein (1994)], [Adda-Deckeret al. (1999)]). Besides, it is widely used by French speakers to mark hes-itations. These conclusions with the phone Schwa are therefore probablyspecific to French and an extension of this phenomenon to other languageswould therefore require further study.
The analysis performed at the phone group level revealed similar tenden-cies. While no significant group insertions in HPR speech have been detected,frequent phone group deletions in HPO speech were found: e.g. /R@/, /l@/at the end of the words, “je suis” (which means “I am”) becoming “j’suis”or even “chui”, etc. However, no significant phone groups substitutions wereobserved in either cases.
3.2.3. Phone Durations
It is intuitively expected that the DoA influences phone durations, sinceHPO and HPR speech respectively target different intelligibility goals. Thiswill directly affect the speech rate (Section 3.2.4). Some studies confirm thatthought. Evidences for the Probabilistic Reduction Hypothesis are explainedin the approach exposed in [Jurafsky et al. (2001)]: word forms are reducedwhen they have a higher probability, and this should be interpreted as evi-dence that probabilistic relations between words are represented in the mindof the speaker. Similarly, [Baker and Bradlow (2009)] examines how thatprobability (lexical frequency and previous occurrence), speaking style, andprosody affect word duration, and how these factors interact between eachothers.
Phone duration variations between NEU, HPO and HPR speech werestudied in [Picart et al. (2010)]. Vowels and consonants were grouped ac-cording to broad phonetic classes. We showed in that study that durationsof front, central, back and nasal vowels are shorter during HPO and longerunder HPR speech on average. The same conclusion was also true for plosiveand fricative consonants. HPO speech contains shorter and fewer breaks,while HPR speech involves more of them, as long as those in NEU speech.We also interestingly noted a very high number of short-duration (around 30ms) semi-vowels and trill consonants in HPO speech.
3.2.4. Speech Rate
Speaking rate has been found to be related to many factors [Yuan et al.(2006)]. It is often defined as the average number of syllables uttered per
12

second (pauses excluded) in a whole sentence [Beller et al. (2006)] [Roekhautet al. (2010)]. Table 2 compares the speaking styles corresponding to eachDoA, following the previous definition.
Results HPR NEU HPO
Total speech time [s] 6076 (+ 40.2 %) 4335 2926 (- 32.5 %)Total syllable time [s] 5219 (+ 44.3 %) 3618 2486 (- 31.3 %)Total pausing time [s] 857 (+ 19.5 %) 717 440 (- 38.6 %)
Total number of syllables 19736 (+ 7.1 %) 18425 17373 (- 5.7 %)Total number of breaks 1213 (+ 43.4 %) 846 783 (- 7.4 %)Speech rate [syllable/s] 3.8 (- 25.5 %) 5.1 7.0 (+ 37.3 %)
Relative pausing time [%] 14.1 (- 14.5 %) 16.5 15.1 (- 8.5 %)
Table 2: Speech rates and related time information for NEU, HPO & HPR speech, togetherwith the positive or negative variation from the NEU style (in [%]).
As expected, HPR speech is characterized by a lower speech rate, a highernumber of breaks (thus a longer pausing time), more syllables (due to finalSchwa insertions in particular), resulting in an increase of the total speechtime. On the other side, HPO speech is characterized by a higher speechrate, a lower number of breaks (thus a shorter pausing time), less syllables(due to final Schwa and other phone groups deletions), resulting in a decreaseof the total speech time.
An interesting property can be noted: since both the total pausing timeand the total speech time vary in about the same proportion (increase inHPR speech and decrease in HPO speech), the relative pausing time (andconsequently the relative speaking time) percentage is almost independentof the speaking style. It seems that a speaker modifying his DoA controlsunconsciously the relative proportions of speech and pausing time.
4. Continuous Control of the Degree of Articulation in HMM-based Speech Synthesis
Only a few studies have been conducted on the synthesis of the DoA.Wouters made the first attempts within the context of concatenative speechsynthesis [Wouters (2001)], by modifying the spectral shape of acoustic unitsaccording to a predictive model of the acoustic-prosodic variations related
13

to the DoA. In this work, we focus on the synthesis of the DoA in the con-text of statistical parametric speech synthesis, using the HMM-based SpeechSynthesis System HTS [Zen et al. (2009)].
First of all, a specific HMM-based speech synthesizer is built for each DoA(NEU, HPO and HPR), using the databases described in Section 2. The effi-ciency of speaking style adaptation to produce NEU, HPO and HPR speechdirectly from the NEU synthesizer is then studied. Finally, the implementa-tion of a continuous control (tuner) of the DoA on this NEU synthesizer isdetailed, with the goal of obtaining any interpolated or extrapolated DoA ina continuous way.
4.1. Speaker-Independent Full Data Model Training
4.1.1. Method
Relying on the implementation of the HTS toolkit1 (version 2.1) publiclyavailable, a HMM-based speech synthesizer [Zen et al. (2009)] was built foreach DoA (NEU, HPO and HPR). Each database recorded as explained inSection 2 was used for training the corresponding synthesizer. A commonpractice when dealing with a database consists in keeping 90% of the datafor training the models and leaving the rest for testing (here for synthesis).Therefore, for each DoA, 1220 sentences sampled at 16 kHz were used forthe training (called the training set), leaving around 10% of the database forsynthesis (called the synthesis set).
The speech signal is modeled and vocoded by a source-filter approach.The filter is represented by the Mel Generalized Cepstral (MGC [Tokudaet al. (1994)]) coefficients (with α = 0.42, γ = 0 and order of MGC analysis =24), and the excitation signal is based upon the Deterministic plus Stochas-tic Model (DSM) of the residual signal proposed in [Drugman and Dutoit(2012)]. This model was shown to significantly increase the naturalness ofthe produced speech. More precisely, both deterministic and stochastic com-ponents of DSM were estimated on the training dataset for each DoA. Thespectral boundary between these two components was fixed as the averagedvalue of the maximum voiced frequency described in Section 3.1.2. Note alsothat our version of HTS used 75-dimensional MGC parameters (including ∆and ∆2), and each covariance matrix of the state output and state durationdistributions were diagonal.
1http://hts.sp.nitech.ac.jp/
14

HPR
NEU
HPO
Databases
Speech Signal
Labels
Spectral Parameters
Excitation Parameters
Spectral Parameters Extraction
Excitation Parameters Extraction
Spectral Parameters Extraction
Excitation Parameters Extraction
Spectral Parameters Extraction
Excitation Parameters Extraction
Spectral Parameters
Excitation Parameters
Spectral Parameters
Excitation Parameters
Speech Signal
Labels
Speech Signal
Labels
Training
Intra-speaker adaptation
(CMLLR)
Intra-speaker adaptation
(CMLLR)
HPR Adapted Model
NEU Full Data Model
HPO Adapted Model
Synthesizers
HPR NEU
NEU HPO
Continuous control of the
degree of articulation
TUNER
Training HPR
Full Data Model
Training HPO
Full Data Model
Figure 4: Standard training of the NEU, HPO and HPR full data models (Section 4.1.1),from the database containing 1220 training sentences for each DoA. Adaptation of the NEUfull data model using CMLLR transform with HPO and HPR speech data to produce HPOand HPR adapted models (Section 4.2.1). Implementation of a tuner, manually adjustableby the user, for a continuous control of the DoA (Section 4.3.1).
Since the three synthesizers implemented at this point are trained on theentire training sets, they will be referred to as full data models in the followingof this work. Figure 4 shows the general architecture of our system. At thispoint of the text, only the full data models training should be considered.The following evaluations are led on the synthesis set of the database.
4.1.2. Objective Evaluation
An objective evaluation is first conducted in order to assess the qualityof the full data models. Yamagishi proposed in [Yamagishi and Kobayashi(2007)] for this the use of the following three objective measures: the averageMel-Cepstral Distortion (MCD, expressed in decibel), the Root-Mean-SquareError (RMSE) of log F0 (RMSE lf0, expressed in cent), the RMSE of voweldurations (RMSE dur, expressed in terms of number of frames). These mea-sures reflect differences regarding three complementary aspects of speech.
15

The RMSE lf0 is obviously computed for regions where both the originalrecordings and the full data models are voiced, since log F0 is not observedin unvoiced regions. Cent is a logarithmic unit used for musical intervals (100cents correspond to a semitone, twelve semitones correspond to an octave,which means doubling of the frequency).
The MCD between the target and the estimated mel-cepstra coefficients(noted respectively mc
(t)d and mc
(e)d , and computed from the original and
synthesized versions of the same utterance) is expressed as:
MCD =10
ln(10)
√√√√225∑
d=1
(mc(t)d −mc
(e)d )2 (1)
Target and estimated frames should have a one-to-one correspondence inorder to compute an objective distance, which could either be for cepstrumor pitch with dedicated formulae for each of them (Equation 1 in the caseof cepstrum). This is obviously not the case when computing the objectivedistance on phone duration.
These objective measures are computed for all the vowels of the synthesisset of the database. The mean MCD, RMSE lf0 and RMSE dur, togetherwith their 95% confidence intervals, are shown in Table 3 for each DoA.We observe in this objective evaluation that the MCD increases from HPRto HPO speech, while RMSE lf0 and RMSE dur decrease with the DoA.Considering that HPR speech is characterized by longer phone durationsand HPO speech by shorter ones (Section 3.2.3):
• modeling the HPR speech cepstrum seems easier, as more speech dataare indirectly available to estimate reliably the corresponding modelscompared to the NEU style (which can be seen with the MCD). Onthe other hand, modeling HPO speech cepstrum seems more difficult,as less speech data are indirectly available. Note that 1 dB is usuallyaccepted as the difference limen for spectral transparency [Paliwal andAtal (1993)];
• each HPR phone therefore contains a higher number of frames, anderrors induced at the frame level by the HMM-based modeling couldthus have more impact on the synthesized speech quality, while eachHPO phone contains fewer frames, leading to the opposite conclusion.This explains the RMSE lf0 and RMSE dur results in Table 3.
16

Results HPR NEU HPO
Mean MCD ± CI 5.9 ± 0.1 6.3 ± 0.2 6.9 ± 0.1RMSE lf0 ± CI 213.1 ± 31.1 170 ± 23.5 112.3 ± 14.3RMSE dur ± CI 9 ± 0.6 6.8 ± 0.6 4.6 ± 0.4
Table 3: Objective evaluation results: average MCD [dB], RMSE lf0 [cent] and RMSE dur[number of frames] with their 95% confidence intervals (CI) for each DoA.
For comparison purpose, similar quantitative results were observed forspeaker dependent model [Yamagishi and Kobayashi (2007)], despite somedifferences in the training process and in the language used for training themodels (Japanese). Differences between the results reported in [Yamagishiand Kobayashi (2007)] and ours are rather minor, as we get slightly worse val-ues for the MCD, slightly better performance for RMSE lf0 and comparablevalues for RMSE dur.
It is also worth noticing that the vocalic space reduces from HPR (0.299kHz2) to NEU (0.201 kHz2) to HPO speech (0.063 kHz2). These numbersobtained on synthesized speech are to compare to those of Section 3.1.1 whichwere carried out on the original recordings. Interestingly, a high similaritycan be underlined which confirms a good reproduction of DoA changes byHMMs.
4.1.3. Subjective Evaluation
A subjective evaluation has then been performed in order to confirm theresults of the objective test. For this evaluation, participants were askedto listen to three sentences: A, the original sentence; B, the copy-synthesisversion of the original sentence using the DSM vocoder; C, the sentencesynthesized using DSM and whose parameters are generated by the statisticalmodels trained with HTS. Participants were given a 9-point discrete scaleand asked to score the distance, in terms of overall speech quality, of B withregards to both A and C. In other words, this score was allowed to vary from0 (i.e. B has the same quality as A) to 9 (i.e. B has the same quality as C).
The reason for using such a self-designed scale is to ease the listener’sability to evaluate the relative speech synthesis quality. Indeed, evaluatingthe perceptual position of B between the lower boundary A and the upperone C is more coherent than estimating its position knowing only one ofthese two boundaries. The latter case brings the problem of the extent untilwhich the score could be set by the listener, and the problem of inter-listener
17
variability concerning evaluations.The passage from A to C accounts for two possible sources of degradation:
vocoding (from A to B) and HMM-based statistical processing (from B toC). Since we can assume that the vocoding effect is almost the same for eachDoA, the distance of B with regards to A and C is informative about theeffectiveness of the statistical process. Indeed, the lower the score, the moreB is close to A than it is from C, and consequently the more dominant is thestatistical process among the degradation sources. In conclusion, the higherthe score, the better the steps of HMM modeling and generation have beenperformed.
The test consists of 15 triplets: 5 sentences per DoA randomly chosenamongst the synthesis set, 3 DoA, giving a total of 45 sentences. Beforestarting the test, the listener was provided with some reference sentencescovering most of the variations to help him familiarizing with the scale. Dur-ing the test, he was allowed to listen to the triplet of sentences as many timesas wanted (participants were nonetheless advised to listen to A and C beforelistening to B, in order to know the boundaries of the scale). However theywere not allowed to come back to previous sentences after validating theirdecisions.
26 people, mainly naive listeners, participated to this evaluation. Themean scores for each DoA, on the 9-point scale, are shown in Figure 5. It isobserved that the more speech is articulated, the higher the score and there-fore the lower the degradation due to the HMM process. It is worth notingthat these results corroborate the conclusions of the objective evaluation.The formant trajectories are enhanced in HPR speech and are less markedin HPO speech, compared to the standard NEU style. Due to the intrinsicstatistical modeling by HMMs, these trajectories are (over) smoothed, loos-ing the actual finest information characterizing the DoA. Among others, thisis particularly true for HPO speech.
4.2. Speaking Style Adaptation
One way to perform HMM-based speech synthesis is to train a full datamodel using a database containing specific data, as in Section 4.1 (in thiscase, the database contains speech sentences pronounced with different DoA).Compared to unit-selection speech synthesis, HMM-based speech synthesishas many advantages, mainly related to its inherent flexibility due to thestatistical modeling process [Zen et al. (2009)]. For example, voice adapta-tion techniques can be applied to change voice characteristics and prosodic
18

0,0
0,5
1,0
1,5
2,0
2,5
3,0
3,5
4,0
4,5
5,0
HPR NEU HPO
Sco
re
Figure 5: Subjective evaluation results: overall speech quality of the full data modelsdecreases with the DoA (mean score with its 95% confidence interval).
features of synthetic speech [Yamagishi et al. (2009)]. Yamagishi proposed in[Yamagishi and Kobayashi (2007)] the adaptation of a specific model, calledaverage-voice model, to a specific target speaker. The average-voice modelis computed once for all over a database containing many different speakers.This technique allows to provide high quality speech synthesis using a limitedamount of adaptation data [Yamagishi (2006)].
In this section, we focus on the adaptation of a specific source speaker,the NEU full data model trained in Section 4.1, such that the system is ableto generate HPO and HPR speech.
4.2.1. Method
This NEU full data HMM-based speech synthesizer was adapted using theConstrained Maximum Likelihood Linear Regression (CMLLR) transform[Digalakis et al. (1995)] [Gales (1998)] in the framework of Hidden SemiMarkov Model (HSMM) [Ferguson (1980)] with HPO and HPR speech data inorder to produce respectively a HPO and HPR HMM-based synthesizer. Thelinearly-transformed models were further optimized using MAP adaptation[Yamagishi et al. (2009)].
In HSMM-based speech synthesis [Zen et al. (2007)], state duration dis-tributions are modeled explicitly, allowing in this way a better representationof the temporal structure of human speech. HSMM has also the advantage ofincorporating state duration models explicitly in the expectation step of theExpectation-Maximization (EM) algorithm. Finally, HSMM is more conve-
19

nient during the adaptation process to simultaneously transform both stateoutput and state duration distributions.
MLLR adaptation is the most popular linear regression adaptation tech-nique. The mean vectors and covariance matrices of state output distribu-tions of the target speaker’s model are obtained by linearly transforming themean vectors and covariance matrices of state output distributions of thesource speaker’s model [Yamagishi and Kobayashi (2007)]. The same ideaholds for CMLLR. While MLLR is a model adaptation technique, CMLLR isa feature adaptation technique. In a model adaptation technique, a set of lin-ear transformations is estimated to shift the means and alter the covariancesin the source speaker’s model so that each state in the HMM system is morelikely to generate the adaptation data. In a feature adaptation technique,a set of linear transformations is estimated to modify the feature vectors inthe source speaker’s model so that each state in the HMM system is morelikely to generate the adaptation data.
The implementation of our synthesizers is summarized in Figure 4. Sincethe two synthesizers implemented in this section are created by adapting theNEU full data model using HPO and HPR data, they will be referred to asadapted models in the following of this work.
The efficiency of the adaptation process will be now assessed throughboth an objective and a subjective evaluation on the synthesis set of thedatabase, composed of sentences which were neither part of the training setnor of the adaptation set.
4.2.2. Objective Evaluation
The goal of this objective evaluation is to assess the quality of the adaptedsynthesized speech when the number of adaptation sentences increases. Forthis, we use the measures introduced in Section 4.1.2, namely the aver-age MCD, the RMSE lf0 and the RMSE dur. As an illustration, Figure6 presents the average MCD, computed for all the vowels of the synthesisset, between the adapted and the full data models.
Figure 6 clearly shows that the MCD decreases when more speech data areused for adaptation. The distance between the HPR full data and adaptedmodels is bigger than the gap between the HPO full data and adapted mod-els, which could be explained by the adaptation process itself. On one hand,the HPR speech spectrum is richer, more variable, complex and enhanced,compared to the NEU style. On the other hand, HPO speech spectrum issmoother and more flat than the NEU speech one. This difference could ex-
20

0 10 20 30 40 50 60 70 80 90 1002
2.5
3
3.5
4
4.5
5
Speech Time [minutes]
Mel
ceps
tral
dis
tort
ion
[dB
]
HPRHPO
Figure 6: Objective evaluation - Average mel-cepstral distortion [dB] computed betweenthe adapted and the full data models.
plain why the HPR spectrum is harder to adapt from the NEU style (leadingto a higher MCD) than the HPO spectrum. Note that the results in Figure 6were obtained using up to 1220 adaptation sentences for both HPO and HPRspeech. Nonetheless, since the speaking rate in HPR speech is known to bemuch slower than in HPO speech (almost the double - see Section 3.2.4), thisexplains why these curves do not cover the same total adaptation duration.
We also observed a decrease of RMSE lf0 and RMSE dur when the amountof speech data available for adaptation increases. They both were foundhigher for HPR speech than for HPO speech. However, while the MCD iscontinuously decreasing when more speech data are used for adaptation, itwas shown that RMSE lf0 and RMSE dur decrease until around 7 minutesof HPO speech or 13 minutes of HPR speech and saturate to specific valueswhen more speech data are used (the interested reader is referred to [Picartet al. (2011a)] for more details). It can be noted from Figure 6 that around7 minutes of HPO speech or 13 minutes of HPR speech are needed to adaptcepstra correctly, while it was shown in [Picart et al. (2011a)] that around 3minutes of HPO speech or 7 minutes of HPR speech are sufficient to adaptF0 and phone duration with a good quality.
Figure 6 also shows some imperfections of the adaptation process basedon HMM. Indeed, the curves are saturating towards non-zero values. Slightaudible differences could be heard between the HPO or HPR full data modelsand the models adapted from the NEU full data model using the entire HPO
21

or HPR training set. However, informal listening tests showed that theseslight differences cannot be said to give worse or better speech synthesisresults. As already stated, 1 dB is usually accepted as the difference limenfor spectral transparency [Paliwal and Atal (1993)].
For comparison purpose, the same kind of trends were observed for inter-speaker voice adaptation [Yamagishi and Kobayashi (2007)], despite somedifferences in the training process and in the number of training and adap-tation data.
4.2.3. Subjective Evaluation
A Comparison Category Rating (CCR) evaluation is now performed inorder to confirm the conclusions of the objective test. For this evaluation,listeners were asked to listen to two sentences: A, the sentence synthesizedby the full data model; B, the sentence synthesized by the adapted modelsusing 10, 20, 50, 100 or 1220 sentences. CCR values range on a gradual scalevarying from 1 (meaning that A and B are very dissimilar) to 5 (meaning theopposite). A score of 3 is given if the two versions are found to be slightly sim-ilar. Listeners were asked to score the overall speech quality of B comparedto A. The higher the CCR score, the more efficient the adaptation process.Unlike the objective evaluation, there is no need here to have a one-to-onecorrespondence between the target and the estimated frames. Therefore au-dio examples used for this evaluation were entirely generated (i.e. cepstrum,F0 and phone duration) by the full data and adapted HMM-based speechsynthesizers.
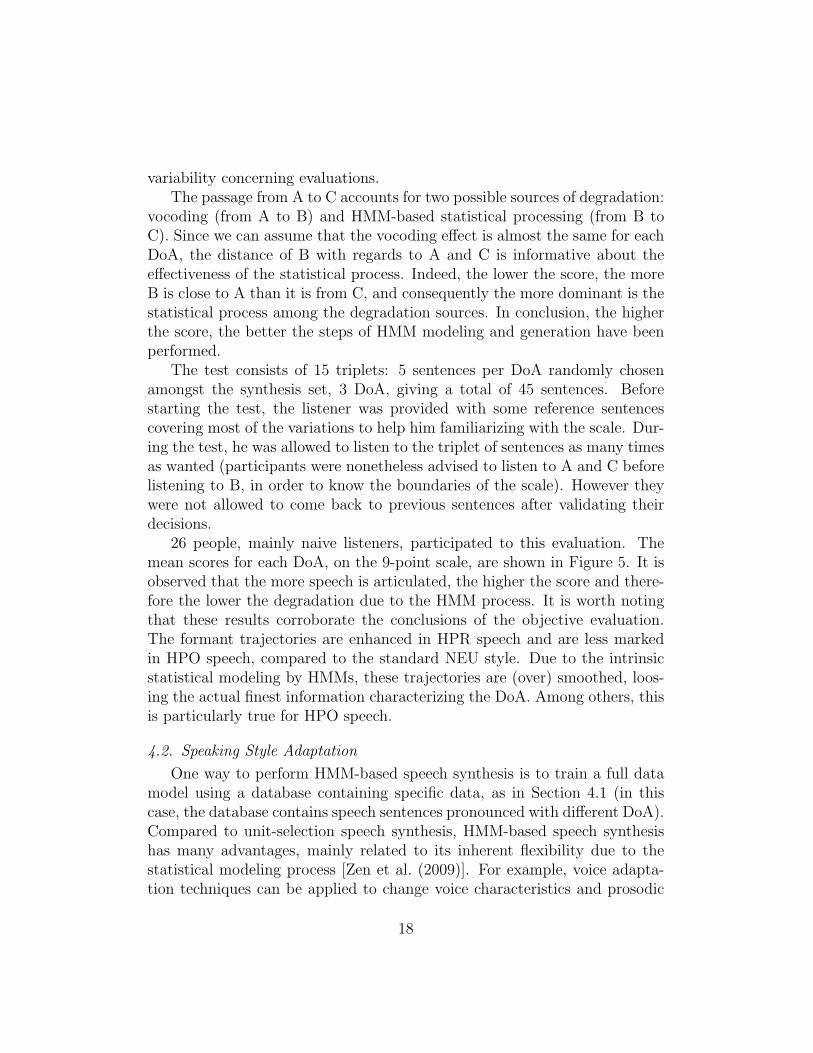
The test consists of 30 pairwise comparisons. The same experimentalprotocol as in Section 4.1.3 was applied. 26 people, mainly naive listeners,participated to this evaluation. Figure 7 displays the mean CCR scores forboth DoA. The same kind of tendency as in the objective evaluation can beseen, i.e. HTS is able to produce better adapted HPO speech than adaptedHPR speech. As expected, we also see that the speech synthesis qualityof the adapted models increases with the number of adaptation sentences,independently of the DoA. Nonetheless, a reasonably high-quality HMM-based speech synthesis can be achieved for both DoA with around 100 HPOor HPR adaptation sentences. It can be indeed seen from Figure 7 that thiscorresponds to CCR scores around 3.5, which means that the adapted voice,compared to the full data model, is perceived to have a quality between“slightly similar” and “similar”.
22
1,0
1,5
2,0
2,5
3,0
3,5
4,0
4,5
5,0
10 100 1000
CC
R S
core
Number of Adaptation Sentences
HPR
HPO
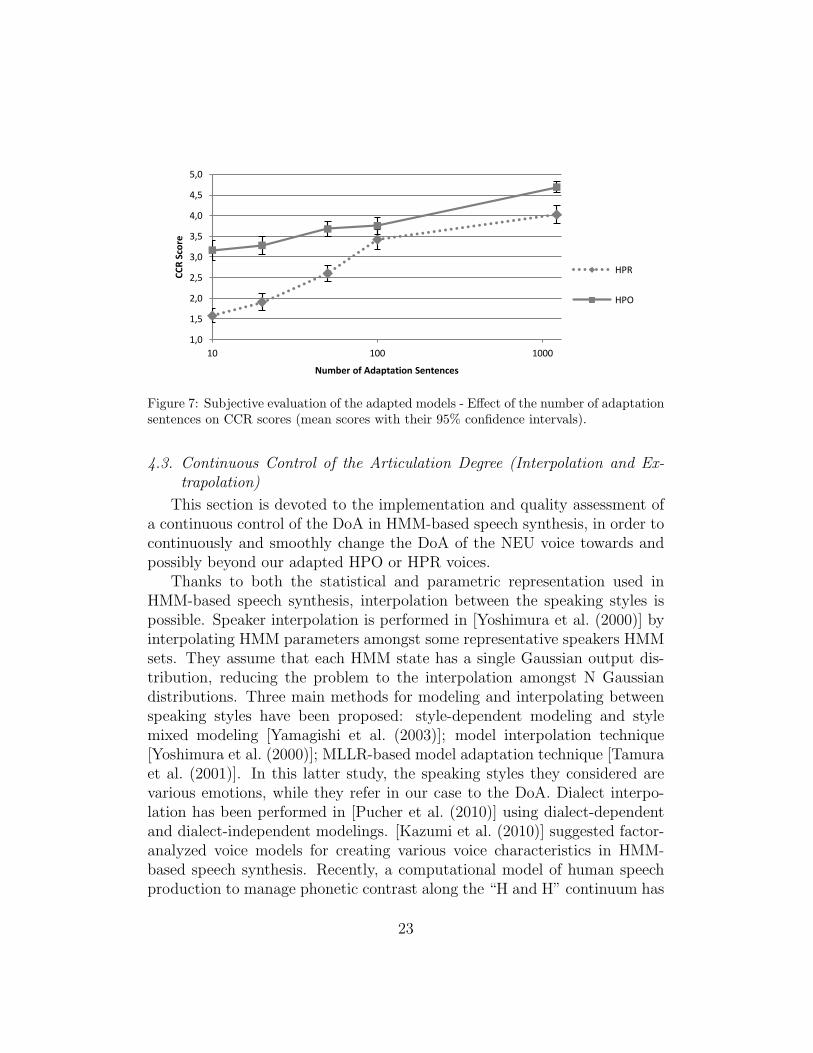
Figure 7: Subjective evaluation of the adapted models - Effect of the number of adaptationsentences on CCR scores (mean scores with their 95% confidence intervals).
4.3. Continuous Control of the Articulation Degree (Interpolation and Ex-trapolation)
This section is devoted to the implementation and quality assessment ofa continuous control of the DoA in HMM-based speech synthesis, in order tocontinuously and smoothly change the DoA of the NEU voice towards andpossibly beyond our adapted HPO or HPR voices.
Thanks to both the statistical and parametric representation used inHMM-based speech synthesis, interpolation between the speaking styles ispossible. Speaker interpolation is performed in [Yoshimura et al. (2000)] byinterpolating HMM parameters amongst some representative speakers HMMsets. They assume that each HMM state has a single Gaussian output dis-tribution, reducing the problem to the interpolation amongst N Gaussiandistributions. Three main methods for modeling and interpolating betweenspeaking styles have been proposed: style-dependent modeling and stylemixed modeling [Yamagishi et al. (2003)]; model interpolation technique[Yoshimura et al. (2000)]; MLLR-based model adaptation technique [Tamuraet al. (2001)]. In this latter study, the speaking styles they considered arevarious emotions, while they refer in our case to the DoA. Dialect interpo-lation has been performed in [Pucher et al. (2010)] using dialect-dependentand dialect-independent modelings. [Kazumi et al. (2010)] suggested factor-analyzed voice models for creating various voice characteristics in HMM-based speech synthesis. Recently, a computational model of human speechproduction to manage phonetic contrast along the “H and H” continuum has
23

been proposed and implemented in [Nicolao et al. (2012)], allowing speakingstyle modification in HMM-based speech synthesis according to the externalacoustic conditions.
4.3.1. Method
Our implementation for a continuous control of the DoA makes use of 3models: i) the NEU full data model; ii) the adapted HPO model; iii) theadapted HPR model, as it is illustrated in Figure 4. Both adapted modelswere obtained using the entire training HPO and HPR sets (1220 sentences)in order to obtain the finest quality for model interpolation and extrapolationand consequently for the resulting delivered speech synthesis.
Because decision trees of the NEU full data model are not modified duringthe adaptation process, there is a one-to-one correspondence between theprobability density functions (i.e. the leaf nodes of the decision trees) ofthe NEU full data model and the adapted HPO or HPR models. Thereforethe continuous control of the DoA is achieved by linearly interpolating orextrapolating the mean and the diagonal covariance matrices of each stateoutput and state duration probability density functions (mel-cepstrum, logF0 and duration distributions).
Since no reference speech data are available to evaluate objectively thequality of interpolation and extrapolation, only two subjective tests are con-ducted. The way listeners perceive the interpolation and extrapolation of theDoA is first assessed in Section 4.3.2. This evaluation is then complementedwith a Comparative Mean Opinion Score (CMOS) test in Section 4.3.3, toassess the quality of this interpolation and extrapolation.
4.3.2. Perception of the degree of articulation
For this evaluation, listeners were asked to listen to four sentences: thethree reference sentences A (HPO), B (NEU) and C (HPR) synthesized bythe full data models; the test sentence X, which could be either interpolatedbetween A and B or B and C, or extrapolated beyond A or C. Then theywere given a discrete scale, ranging from -1.5 to 1.5 by a 0.25 step. A, B andC were placed at -1, 0 and 1 respectively. Finally, participants were asked totell where X should be located on that scale, X being different from A, B orC.
The test consisted of 10 quadruplets. Five sentences per DoA were ran-domly chosen amongst the synthesis set of the database. 34 people, mainly
24

naive listeners, participated to this evaluation, under the same listening con-ditions as in Section 4.1.3.
-1,5
-1
-0,5
0
0,5
1
1,5
-1,5
-1,2
5
-1
-0,7
5
-0,5
-0,2
5
0
0,2
5
0,5
0,7
5
1
1,2
5
1,5
Pe
rce
ive
d
De
gre
e o
f A
rtic
ula
tio
n
Actual Degree of Articulation HPO HPR
Figure 8: Subjective evaluation - Perceived interpolation and extrapolation ratio as a func-tion of the actual interpolation and extrapolation ratio, together with its 95% confidenceinterval.
Figure 8 displays the evolution of the average perceived interpolation andextrapolation ratio, as a function of the actual ratio which is applied.
A good linear correspondence is achieved between the perceived and thereference DoA. As expected, this graph is monotonically increasing, showingthat listeners were able to perceive and recognize the continuous control of theDoA. Our interpolation and extrapolation method thus proved to be efficientby providing realistic DoA. However, due to the constraints imposed on thediscrete scale, i.e. the user was not allowed to select reference (-1, 0, 1) orextreme (lower than -1.5, higher than 1.5) values, we may have introduced asmall bias in the assessment of the perceived DoA. This bias leads the resultsto suffer from border effects. Indeed, as participants do not know in advancethe maximum variability during the test, they tend to naturally keep out ofthe border values composing the scale. Extending this scale one point furtheron both side of a discrete scale, or the use of a continuous scale also extendedbeyond the range of usual values, should give more accurate results.
4.3.3. Quality of the degree of articulation
In a second subjective test, participants were asked to score the overallspeech quality of X versus B (the NEU synthesis), leaving aside the difference
25

in DoA between X and B. For this, we used a CMOS test in order to assessthe quality of the interpolated and extrapolated speech synthesis. CMOSvalues range on a gradual scale varying from -3 (meaning that X is muchworse than B) to +3 (meaning the opposite). A score of 0 is given if thequality of both versions is found to be equivalent.
Table 4: Subjective evaluation (CMOS test) - Perceived synthesis quality of the test sen-tence X vs. the NEU sentence B (CMOS scores with their 95% confidence intervals).
HPR HPO
DoA Quality DoA Quality0.25 0.03 ± 0.40 - 0.25 - 0.29 ± 0.410.5 -0.09 ± 0.46 - 0.5 - 0.47 ± 0.370.75 0.15 ± 0.41 - 0.75 - 0.53 ± 0.371.25 -0.65 ± 0.49 - 1.25 - 0.35 ± 0.571.5 -1.06 ± 0.50 - 1.5 - 0.79 ± 0.57
Table 4 presents the averaged CMOS scores of the perceived synthesisquality for each DoA. The methods proposed in this work provides a high-quality rendering of the DoA. It can be observed that interpolated HPRspeech (with a DoA between 0 and 1) seems to have about the same qualityas NEU speech, while a slight degradation is observed for all other DoA (onthe CMOS scale, a score of -1 means “slightly worse”). Similarly to Section4.1, HTS provides a better rendering of HPR speech, compared to the HPOspeech case. Note also the large size of the 95% confidence intervals foreach DoA, and mainly when extrapolating. This could be explained by thedifficulty to compare speech quality alone, leaving aside the fact that theDoA of X and B could be different.
5. Perceptual Considerations of Hypo and Hyperarticulated Speech
This section is devoted to the effects leading to and induced by the per-ception of the DoA. As already mentioned in the introduction, increasingthe intelligibility of a synthesizer performing in adverse conditions has a lotof daily life applications. For this, [Erro et al. (2012)] proposed to improvethe intelligibility of speech by manipulating the parameters (spectral slopeand amplification of low-energy parts of the signal) of an harmonic speechmodel. Five energy reallocation strategies to increase speech intelligibility in
26

noisy conditions are compared in [Tang and Cooke (2010)]. Regarding theevaluation, the work presented in [Valentini-Botinhao et al. (2011)] interest-ingly investigated several objective measures to predict the intelligibility ofsynthetic speech.
The perceptual prevalence of phonetic, prosodic and filter information hasbeen studied in [Picart et al. (2011b)]. The internal mechanisms leading tothe perception of each DoA by listeners have been compared and quantified:impact of cepstral adaptation, of prosody, of phonetic transcription and ofthe complete adaptation technique. All these effects outperformed the base-line system, in which a straightforward phone-independent constant ratiowas applied to pitch and phone durations to sound like real HPO and HPRspeech. It was shown that adapting the cepstrum has a higher impact on therendering of the DoA than adapting the phonetic transcriptions. Moreover,adapting prosody alone, without cepstrum adaptation, highly degrades theperception of the DoA. We finally highlighted the importance of having aNatural Language Processor able to create automatically realistic HPO andHPR transcriptions.
As a complement to this latter study, the following sections focus onintelligibility (Section 5.2) and multi-dimension (Section 5.3) assessment ofthe speech synthesizers described in Section 5.1.
5.1. Method
Five HMM-based speech synthesizers are implemented following the sameprocedure as in Section 4.3. As a reminder, the NEU full data model wasadapted using the entire HPO and HPR training sets, in order to removethe effect of the number of adaptation sentences from our results. The fivesynthesizers are created using interpolation ratios ranging from -1 (HPO) to+1 (HPR), including 0 (NEU), with a 0.5 step: -0.5 and +0.5 correspond tomodels right between the NEU full data model and respectively, the adaptedHPO model, or the adapted HPR model. The intelligibility of these fivesynthesizers (-1, -0.5, 0, +0.5, +1) will be studied in Section 5.2, while ageneral assessment will be performed on the three major synthesizers (-1, 0,+1) in Section 5.3.
5.2. Semantically Unpredictable Sentences Test
In order to evaluate the intelligibility of a voice, the Semantically Un-predictable Sentences (SUS) test was performed on speech degraded alterna-tively by an additive or a convolutive noise. The advantage of such sentences
27
is that they are unpredictable, meaning that listeners cannot determine aword in the sentence by the meaning of the whole utterance or the contextwithin the sentence.
5.2.1. Building the SUS Corpus
The same corpus as the one built in [de Mareuil et al. (2006)] was used inour experiments. This corpus is part of the ELRA package (ELRA-E0023).Basically, 288 semantically unpredictable sentences were generated following4 syntactic structures containing 4 target words (nouns, verbs or adjectives,here written with a capital initial letter):
• adverb det. Noun1 Verb-t-pron. det. Noun2 Adjective?
• determiner Noun1 Adjective Verb determiner Noun2.
• det. Noun1 Verb1 determiner Noun2 qui (that) Verb2.
• determiner Noun1 Verb preposition determiner Noun2.
Structure 4 originally proposed by [Benoıt (1990)] was not kept, becauseit only contained 3 target words instead of 4. For more details about thegeneration of this corpus, the reader is referred to [de Mareuil et al. (2006)].
5.2.2. Procedure
Nineteen listeners, mainly naive, participated to this evaluation. Theywere asked to listen to 40 SUS, randomly chosen from the SUS corpus builtin the previous paragraph. The SUS were played one at a time. For each ofthem, listeners were asked to write down what they heard. During the test,they were allowed to listen to each SUS at most two times. They were ofcourse not allowed to come back to previous sentences after validating theirdecision.
The SUS were synthesized using the five synthesizers described in Section5.1. Two types of degradation were then applied to the synthesized SUS:additive noise and reverberation.
For simulating the noisy environment, a car noise was added to the origi-nal speech waveform at two Signal-to-Noise Ratios (SNRs): -5dB and -15dB.The car noise signal was taken from the Noisex-922 database, and was added
2http://www.speech.cs.cmu.edu/comp.speech/Section1/Data/noisex.html
28

so as to control the overall SNR without silence removal. Since the spec-tral energy of the car noise is mainly concentrated in the low frequencies(<400Hz), the formant structure of speech was only poorly altered, and voicesremained somehow understandable even for SNR values as low as -15dB.
When the speech signal s(n) is produced in a reverberant environment,the observation x(n) at the microphone is:
x(n) = h(n) ∗ s(n), (2)
where h(n) is the L-tap Room Impulse Response (RIR) of the acoustic chan-nel between the source and the microphone. RIRs are characterized by thevalue T60, defined as the time for the amplitude of the RIR to decay to -60dBof its initial value. In order to produce reverberant speech, a room measuring3x4x5 m with two levels of reverberation (T60 of 100 and 300ms) was sim-ulated using the source-image method [Allen and Berkley (1979)], and thesimulated impulse responses convolved with original speech signals.
The word level recognition accuracy is used as performance metric for theSUS test. In order to cope with orthographic mistakes, this accuracy wascomputed by counting manually the number of erroneous phonemes for eachword written by the listeners, in comparison with the correct word. The sameprocedure was also applied for the accuracies at the sentence level. However,they are not displayed on Figure 9 for the sake of conciseness, but can befound in [Picart et al. (2012)]. A strong correlation was noted between therecognition accuracy at the sentence and word levels.
5.2.3. Results
The mean recognition accuracies at the word level (for each DoA, foreach type and level of perturbation) are shown in Figure 9. The higher thescore, the better the synthesizer intelligibility as it leads to a higher wordrecognition.
Interestingly, it is observed that accuracy generally increases with DoA.For example, in the strongest reverberation, the word recognition rate in-creases from around 48% for HPO speech, to 83% in HPR (i.e. an absolutegain of 35%). It is also worth noting that in the presence of car noise, thereis no need to over-articulate: using values of 0.5 or 1 for the DoA leads toalmost exactly the same intelligibility performance. This conclusion howeverdoes not hold in a reverberant environment. Comparing the effect of theperturbation on the message understandability, it turns out that the most
29

40
50
60
70
80
90
100
-1 -0,5 0 0,5 1
Wo
rd R
eco
gnit
ion
Acc
ura
cy [
%]
Degree of Articulation
Car -5 dB Car -15 dB Reverb 100 ms Reverb 300 ms
Figure 9: SUS Test - Mean word recognition accuracies [%], together with their 95%confidence intervals.
reverberant condition clearly leads to the highest degradation. In HPR, in-creasing the level of noise from -5dB to -15dB SNR results in a reduction ofthe word recognition rate of around 7%. Finally, it is noticed that, on aver-age, the weakest reverberation is the less adverse condition, with recognitionrates ranging from 75% to 96% when increasing the DoA. These latter resultsare curiously observed to be about 9% better than in a car noise with -15dBSNR, whatever the DoA.
5.3. Absolute Category Rating Test
Finally, an Absolute Category Rating (ACR) test was conducted in orderto assess several dimensions of the generated speech. As in [de Mareuil et al.(2006)], the Mean Opinion Score (MOS) was complemented with six othercategories: comprehension, pleasantness, non-monotony, naturalness, fluidityand pronunciation.
5.3.1. Procedure
Seventeen listeners, mainly naive, participated to this evaluation. Theywere asked to listen to 18 meaningful sentences, randomly chosen amongstthe held-out set of the database (used neither for training nor for adaptation).The sentences were played one at a time. For each of them, listeners wereasked to rate according to the 7 aspects cited above (for the detailed questionslist, see [de Mareuil et al. (2006)]). Listeners were given 7 continuous scales(one for each question to answer) ranging from 1 to 5. These scales were
30

extended one point further on both sides (ranging therefore from 0 to 6)in order to prevent border effects. The sentences corresponded either to theoriginal speech or to the synthesized speech with a variable DoA (NEU, HPOor HPR). We used the same listening protocol as in Section 4.1.3.
5.3.2. Results
Results are shown in Figure 10. In all cases, original speech is preferred tosynthetic speech. The MOS test shows that original NEU speech is preferredto HPO and HPR speech, while synthetic NEU and HPR speech are almostequivalent, leaving synthetic HPO speech slightly below. The comprehensiontest points out that NEU and HPR speech are clearly more understandablethan HPO speech, both on the original and synthetic side. Differences of com-prehension between original and synthesized speech are interestingly ratherweak. The pleasantness test indicates a preference of the listeners for orig-inal NEU speech, followed by HPR and HPO speech, while all the types ofsynthetic speech are equivalently preferred. Despite the HMM modeling, theintonation and dynamics of the voice is well reproduced at synthesis time,as illustrated with the non-monotony test. A major problem with HMM-based speech synthesis is the naturalness of the generated speech comparedto the original speech. This is a known problem related in many studies.The naturalness test underlines again this conclusion. The fluidity test hasan “inverse” tendency compared to other tests. Indeed HPO speech has ahigher score than the others. This is due to the fact that HPO speech ischaracterized by a lower number of breaks and glottal stops, shorter phonedurations and higher speech rate (as proven in Section 3.2). All these ef-fects lead to an impression of fluidity in speech, while the opposite tendencyis observed in HPR speech. Finally, the pronunciation test correlates withthe comprehension test in the sense that the more pronunciation problemsare found, the harder the understandability of the message. Albeit NEU andHPR speech are perceived equivalently in this ACR test from the comprehen-sion and pronunciation points of view, the SUS test proved that HPR speechwas much more intelligible than NEU speech in adverse environments.
6. Conclusions
This paper focused on the analysis and synthesis of hypo (HPO) andhyperarticulated (HPR) speech, compared to neutral (NEU) speech. Inte-grating a continuous variable degree of articulation (DoA) within HMM-
31

0
1
2
3
4
5
Original - HPO Original - NEU Original - HPR Synthesis - HPO Synthesis - NEU Synthesis - HPR
Figure 10: ACR Test - Mean scores together with their 95% confidence intervals.
based speech synthesis is of interest in several applications: expressive voiceconversion in embedded systems or for video games, reading speed controlfor visually impaired people, improving intelligibility performance in adverseenvironments (e.g. GPS voice inside a moving car, train information in sta-tions), etc. This is also necessary in a more realistic system able to mimicmore accurately humans who constantly adapt their speaking style to thecommunication context.
For this, the paper was divided into three main parts. In the first one,we led a study on the speech modifications occuring when the speaker varieshis DoA. At the acoustic level, it was shown that both the vocal tract andglottal contributions are affected. More precisely, an increase of articulationis significantly reflected by an augmentation of the vocalic space in the F1-F2 plane, by higher F0 values, by a stronger harmonicity in speech and by aglottal flow containing more energy in the high frequencies. At the phoneticlevel, the main variations concern glottal stops, breaks and the phonemeSchwa /@/. Finally, although the speaking rate significantly increases whenthe DoA decreases, it turns out that the proportion between speech andpausing periods remains constant.
The second part of the paper aimed at developing a HMM-based speechsynthesis system incorporating a continuous tuning of the DoA. This goal wassubdivided into three tasks: i) building a HMM-based synthesizer for eachDoA using the full specific datasets; ii) for HPO and HPR speech, being ableto create a HMM-based synthesizer by adaptation of the NEU synthesizerand using a limited amount of data; iii) being able to continuously controlthe DoA by interpolating and extrapolating existing models. Both objectiveand subjective tests were used to validate each of these three tasks. Our
32

conclusions showed that: i) HPR speech is synthesized with a better quality;ii) about 7 minutes of HPO or 13 minutes of HPR speech are required toadapt correctly cepstral features, while only half of it can be used for pitchand duration adaptation; iii) the continuous modification of articulatoryefforts is correctly perceived by listeners, while keeping an overall qualitycomparable to what is produced by the NEU synthesizer.
In the third and last part, we have performed a comprehensive perceptualevaluation of the resulting flexible speech synthesizer. First, a SemanticallyUnpredictable Sentences (SUS) test revealed that playing on the articula-tion significantly improves the intelligibility of the synthesizer in adverseenvironments (both noisy and reverberant conditions). Secondly, an Abso-lute Category Rating (ACR) test was used to assess the synthesizer throughvarious voice dimensions. Although a loss is noticed between natural andsynthesized speech regarding its naturalness and segmental quality, severalperceptual features like comprehension, non-monotony and pronunciation arerelatively well preserved after statistical and parametric modeling.
The study described in this paper focused on the variations of the DoAproduced by a French male speaker. Nonetheless, the approach we adoptedand the methods we have developed can be transposed to a variety of speak-ing styles in various languages. In this way, our ongoing research activitiesencompass the possibility of controlling the DoA for any French speaker(male or female) for whom no recordings of HPR or HPO speech are avail-able. Once this will be done, our goal will be to transpose this flexibilityto other languages, which will probably raise some phonetic issues. Finally,our last target will be the application of these methods to other types ofexpressivity in speech (e.g. emotional speech with happy and sad data), oreven to modalities other than speech (e.g. expressive walk or singing voicesynthesis).
7. Acknowledgments
Benjamin Picart is supported by the “Fonds pour la formation a laRecherche dans l’Industrie et dans l’Agriculture” (FRIA). Thomas Drugmanis supported by the “Fonds National de la Recherche Scientifique” (FNRS).
References
Adda-Decker, M., de Mareuil, P.B., Lamel, L., 1999. Pronunciation variantsin french : schwa & liaison, in: 14th International Conference on Phonetic
33

Science (ICPhS), San Francisco.
Allen, J., Berkley, D., 1979. Image method for efficiently simulating small-room acoustics. Journal of the Acoustical Society of America (JASA) 65,943–950.
Anumanchipalli, G.K., Muthukumar, P.K., Nallasamy, U., Parlikar, A.,Black, A.W., Langner, B., 2010. Improving speech synthesis for noisyenvironments, in: Speech Synthesis Workshop 7 (SSW7), Kyoto, Japan.pp. 154–159.
Baker, R.E., Bradlow, A.R., 2009. Variability in word duration as a functionof probability, speech style, and prosody. Language and Speech 52, 391–413.
Beller, G., 2007. Influence de l’expressivite sur le degre d’articulation, in:RJC Parole, France.
Beller, G., 2009. Analyse et Modele Generatif de l’Expressivite - Applicationa la Parole et a l’Interpretation Musicale. Ph.D. thesis. Universite ParisVI - Pierre et Marie Curie, IRCAM.
Beller, G., Hueber, T., Schwarz, D., Rodet, X., 2006. Speech rates in frenchexpressive speech, in: Third International Conference on Speech Prosody,Dresden, Germany.
Beller, G., Obin, N., Rodet, X., 2008. Articulation degree as a prosodicdimension of expressive speech, in: Fourth International Conference onSpeech Prosody, Campinas, Brazil.
Benoıt, C., 1990. An intelligibility test using semantically unpredictable sen-tences: towards the quantification of linguistic complexity. Speech Com-munication 9, 293–304.
Bonardo, D., Zovato, E., 2007. Speech synthesis enhancement in noisy envi-ronments, in: Interspeech, pp. 2853–2856.
Borroff, M.L., 2007. A landmark underspecification account of the patterningof glottal stop. Ph.D. thesis. Stony Brook University, New York.
Bozkurt, B., Dutoit, T., 2003. Mixed-phase speech modeling and formantestimation, using differential phase spectrums, in: VOQUAL, pp. 21–24.
34

Browman, C.P., Goldstein, L., 1994. “targetless” schwa: an articulatoryanalysis. Laboratory Phonology II: Gesture, Segment, Prosody 4, 194–219.
Cernak, M., 2006. Unit selection speech synthesis in noise, in: IEEE Interna-tional Conference on Acoustics, Speech and Signal Processing (ICASSP),Toulouse, France.
Childers, D.G., Lee, C.K., 1991. Vocal quality factors: Analysis, synthesis,and perception. Journal of the Acoustical Society of America (JASA) 90,2394–2410.
Cooke, M., King, S., Kleijn, B., Stylianou, Y. (Eds.), 2012. The ListeningTalker - An interdisciplinary workshop on natural and synthetic modifica-tion of speech in response to listening conditions, Edinburgh, Scotland.
D’Alessandro, C., 2006. Voice source parameters and prosodic analysis. Wal-ter de Gruyter, Sudhoff. pp. 63–87.
Digalakis, V., Rtischev, D., Neumeyer, L., 1995. Speaker adaptation us-ing constrained reestimation of gaussian mixtures. IEEE Transactions onSpeech and Audio Processing 3, 357–366.
Drugman, T., Bozkurt, B., Dutoit, T., 2011. Causal-anticausal decomposi-tion of speech using complex cepstrum for glottal source estimation. SpeechCommunication 53, 855–866.
Drugman, T., Bozkurt, B., Dutoit, T., 2012. A comparative study of glottalsource estimation techniques. Computer Speech & Language, Elsevier 26,20–34.
Drugman, T., Dutoit, T., 2010. Glottal-based analysis of the lombard effect,in: Interspeech, Makuhari, Japan. pp. 2610–2613.
Drugman, T., Dutoit, T., 2012. The deterministic plus stochastic modelof the residual signal and its applications. IEEE Transactions on Audio,Speech, and Language Processing 20, 968–981.
Erro, D., Stylianou, Y., Navas, E., Hernaez, I., 2012. Implementation ofsimple spectral techniques to enhance the intelligibility of speech using aharmonic model, in: Interspeech, Portland.
35

Fant, G., Liljencrants, J., Lin, Q., 1985. A four parameter model of glottalflow, in: STL-QPSR4, pp. 1–13.
Ferguson, J., 1980. Variable duration models for speech, in: Proc. Symp.on the Application of Hidden Markov Models to Text and Speech, pp.143–179.
Gales, M., 1998. Maximum likelihood linear transformations for hmm-basedspeech recognition. Computer Speech & Language 12, 75–98.
Garnier, M., Bailly, L., Dohen, M., Welby, P., Loevenbruck, H., 2006a. Thelombard effect: a physiological reflex or a controlled intelligibility enhance-ment?, in: International Seminar on Speech Production (ISSP), Ubatuba,Brazil. pp. 255–262.
Garnier, M., Bailly, L., Welby, M.D.P., Loevenbruck, H., 2006b. An acousticand articulatory study of lombard speech. global effects at utterance level,in: International Conference on Spoken Language Processing (ICSLP),Pittsburgh, PA, USA. pp. 2246–2249.
Gordon, M., Ladefoged, P., 2001. Phonation types: a cross-linguisticoverview. Journal of Phonetics 29, 383–406.
Junqua, J., 1993. The lombard reflex and its role on human listeners. Journalof the Acoustical Society of America (JASA) 93, 510–524.
Jurafsky, D., Bell, A., Gregory, M., Raymond, W.D., 2001. Probabilisticrelations between words: Evidence from reduction in lexical production.Bybee, Joan and Paul Hopper (eds.). Frequency and the emergence oflinguistic structure , 229–254.
Kazumi, K., Nankaku, Y., Tokuda, K., 2010. Factor analyzed voice modelsfor hmm-based speech synthesis, in: IEEE International Conference onAcoustics, Speech and Signal Processing (ICASSP), Dallas, Texas. pp.4234–4237.
Keller, E., 2005. The analysis of voice quality in speech processing. LectureNotes in Computer Science, Springer-Verlag , 54–73.
Klatt, D., Klatt, L., 1990. Analysis, synthesis, and perception of voice qual-ity variations among female and male talkers. Journal of the AcousticalSociety of America (JASA) 87, 820–857.
36

Langner, B., Black, A.W., 2004. Creating a database of speech in noisefor unit selection synthesis, in: Speech Synthesis Workshop 5 (SSW5),Pittsburgh, USA. pp. 229–230.
Langner, B., Black, A.W., 2005. Improving the understandability of speechsynthesis by modeling speech in noise, in: IEEE International Confer-ence on Acoustics, Speech and Signal Processing (ICASSP), Philadelphia,Pennsylvania, USA.
Laver, J., 1994. Principles of Phonetics. Cambridge Textbooks in Linguistics,Cambridge University Press, Great Britain.
Lindblom, B., 1983. Economy of Speech Gestures. Spinger-Verlag, New-York.
Lombard, E., 1911. Le signe de l’elevation de la voix. Annales des Maladiesde l’Oreille et du Larynx 37, 101–119.
Lu, Y., Cooke, M., 2009. The contribution of changes in f0 and spectral tiltto increased intelligibility of speech produced in noise. Speech Communi-cation 51, 1253–1262.
Malfrere, F., Deroo, O., Dutoit, T., Ris, C., 2003. Phonetic alignement :speech-synthesis-based versus viterbi-based. Speech Communication 40,503–515.
de Mareuil, P.B., d’Alessandro, C., Raake, A., Bailly, G., Garcia, M.N.,Morel, M., 2006. A joint intelligibility evaluation of french text-to-speechsynthesis systems: the evasy sus/acr campaign, in: 5th International Con-ference on Language Resources and Evaluation (LREC), Genoa, Italy. pp.2034–2037.
Nicolao, M., Latorre, J., Moore, R.K., 2012. C2h: A computational modelof h&h-based phonetic contrast in synthetic speech, in: Interspeech, Port-land, Oregon, USA.
Nose, T., Tachibana, M., Kobayashi, T., 2009. Hmm-based style controlfor expressive speech synthesis with arbitrary speaker’s voice using modeladaptation. IEICE Transactions on Information and Systems 92, 489–497.
Oviatt, S., Levow, G.A., Moreton, E., MacEachern, M., 1998. Modelingglobal and focal hyperarticulation during human–computer error resolu-tion. Journal of the Acoustical Society of America (JASA) 104, 3080–3098.
37

Paliwal, K.K., Atal, B.S., 1993. Efficient vector quantization of lpc parame-ters at 24 bits/frame. IEEE Transactions on Speech and Audio Processing1, 3–14.
Pantazis, Y., Stylianou, Y., 2008. Improving the modeling of the noise partin the harmonic plus noise model of speech, in: IEEE International Confer-ence on Acoustics, Speech and Signal Processing (ICASSP), pp. 4609–4612.
Patel, R., Everett, M., Sadikov, E., 2006. Loudmouth: modifying text-to-speech synthesis in noise, in: 8th International ACM SIGACCESS Con-ference on Computers and Accessibility (Assets), Maltimore, Maryland,USA. pp. 227–228.
Picart, B., Drugman, T., Dutoit, T., 2010. Analysis and synthesis of hypoand hyperarticulated speech, in: Speech Synthesis Workshop 7 (SSW7),Kyoto, Japan. pp. 270–275.
Picart, B., Drugman, T., Dutoit, T., 2011a. Continuous control of the degreeof articulation in hmm-based speech synthesis, in: Interspeech, Firenze,Italy. pp. 1797–1800.
Picart, B., Drugman, T., Dutoit, T., 2011b. Perceptual effects of the degreeof articulation in hmm-based speech synthesis, in: NOLISP Workshop, LasPalmas, Gran Canaria. pp. 177–182.
Picart, B., Drugman, T., Dutoit, T., 2012. Assessing the intelligibility andquality of hmm-based speech synthesis with a variable degree of articula-tion, in: The Listening Talker (LISTA) workshop, Edinburgh, Scotland.
Pucher, M., Schabus, D., Yamagishi, J., Neubarth, F., Strom, V., 2010.Modeling and interpolation of austrian german and viennese dialect inhmm-based speech synthesis. Speech Communication 52, 164–179.
Raitio, T., Suni, A., Vainio, M., Alku, P., 2011. Analysis of hmm-basedlombard speech synthesis, in: Interspeech, Florence, Italy. pp. 2781–2784.
Roekhaut, S., Goldman, J.P., Simon, A.C., 2010. A model for varying speak-ing style in tts systems, in: Fifth International Conference on SpeechProsody, Chicago, IL, USA.
38

Sjolander, K., Beskow, J., 2000. Wavesurfer - an open source speech tool, in:Sixth International Conference on Spoken Language Processing (ICSLP),Beijing, China. pp. 464–467.
Sodersten, M., Hertegard, S., Hammarberg, B., 1995. Glottal closure, trans-glottal airflow, and voice quality in healthy middle-aged women. Journalof Voice 9, 182–197.
Stylianou, Y., 2001. Applying the harmonic plus noise model in concatenativespeech synthesis. IEEE Transactions on Speech and Audio Processing 9,21–29.
Summers, W.V., Pisoni, D., Bernacki, R., Pedlow, R., Stokes, M., 1988.Effects of noise on speech production: acoustic and perceptual analyses.Journal of the Acoustical Society of America (JASA) 84, 917–928.
Tachibana, M., Yamagishi, J., Onishi, K., Masuko, T., Kobayashi, T., 2003.Hmm-based speech synthesis with various speaking styles using model in-terpolation and adaptation. IEICE Technical Report 103, 37–42.
Tamura, M., Masuko, T., Tokuda, K., Kobayashi, T., 2001. Adaptationof pitch and spectrum for hmm-based speech synthesis using mllr, in:IEEE International Conference on Acoustics, Speech and Signal Processing(ICASSP), Salt Lake City, USA. pp. 805–808.
Tang, Y., Cooke, M., 2010. Energy reallocation strategies for speech en-hancement in known noise conditions, in: Interspeech, Makuhari, Japan.
Tokuda, K., Kobayashi, T., Masuko, T., Imai, S., 1994. Mel-generalizedcepstral analysis - a unified approach to speech spectral estimation, in:International Conference on Spoken Language Processing, pp. 1043–1046.
Valentini-Botinhao, C., Maia, R., Yamagishi, J., King, S., Zen, H., 2012a.Cepstral analysis based on the glimpse proportion measure for improv-ing the intelligibility of hmm-based synthetic speech in noise, in: IEEEInternational Conference on Acoustics, Speech and Signal Processing(ICASSP), Kyoto, Japan. pp. 3997–4000.
Valentini-Botinhao, C., Yamagishi, J., King, S., 2011. Can objective mea-sures predict the intelligibility of modified hmm-based synthetic speech innoise?, in: Interspeech.
39

Valentini-Botinhao, C., Yamagishi, J., King, S., 2012b. Mel cepstral coeffi-cient modification based on the glimpse proportion measure for improvingthe intelligibility of hmm-generated synthetic speech in noise, in: Inter-speech, Portland, Oregon, USA.
Wouters, J., 2001. Analysis and Synthesis of Degree of Articulation. Ph.D.thesis. Dept. of Computer Science and Engineering, Oregon Graduate In-stitute of Science & Technology.
Yamagishi, J., 2006. Average-Voice-Based Speech Synthesis. Ph.D. thesis.Tokyo Institute of Technology.
Yamagishi, J., Kobayashi, T., 2007. Average-voice-based speech synthesis us-ing hsmm-based speaker adaptation and adaptive training. IEICE Trans-actions Information and Systems 90, 533–543.
Yamagishi, J., Nose, T., Zen, H., Ling, Z., Toda, T., Tokuda, K., King, S.,Renals, S., 2009. A robust speaker-adaptive hmm-based text-to-speechsynthesis. IEEE Transactions on Audio, Speech, and Language Processing17, 1208–1230.
Yamagishi, J., Onishi, K., Masuko, T., Kobayashi, T., 2003. Modeling ofvarious speaking styles and emotions for hmm-based speech synthesis, in:Proceedings of Eurospeech, Switzerland. pp. 2461–2464.
Yegnanarayana, B., Rajendran, S., Worku, H.S., N., D., 2008. Analysis ofglottal stops in speech signals, in: Interspeech, pp. 1481–1484.
Yoshimura, T., Masuko, T., Tokuda, K., Kobayashi, T., Kitamura, T., 2000.Speaker interpolation for hmm-based speech synthesis system. Journal ofthe Acoustic Society of Japan (E) 21, 199–206.
Yuan, J., Liberman, M., Cieri, C., 2006. Towards an integrated understand-ing of speaking rate in conversation, in: Interspeech, Pittsburgh, PA, USA.pp. 541–544.
Zen, H., Tokuda, K., Black, A.W., 2009. Statistical parametric speech syn-thesis. Speech Communication 51, 1039–1064.
Zen, H., Tokuda, K., Masuko, T., Kobayashi, T., Kitamura, T., 2007. Ahidden semi-markov model-based speech synthesis system. IEICE Trans-actions on Information and Systems 90, 825–834.
40