analysis and management of uncertainties bali, indonesia, 9 – 13 september 2013 rodolfo avila
TRANSCRIPT
Analysis and Management of Uncertainties
Bali, Indonesia, 9 – 13 September 2013
Rodolfo AvilaRodolfo Avila
Outline
• Part 1. Basic concepts: Hazard, impact, probability, risk
• Part 2. Types of uncertainties
• Part 3. Management of uncertainties
2

PART 1. BASIC CONCEPTS
SADRWMS Methodology Report 3
Hazard
• A hazard is a situation or agent that poses a threat to humans, biota or the environment.
The higher the potential to cause harm or damage, the higher is the hazard.
Hazards cannot be avoided, but they can be controlled to avoid or reduce exposures and impacts
4
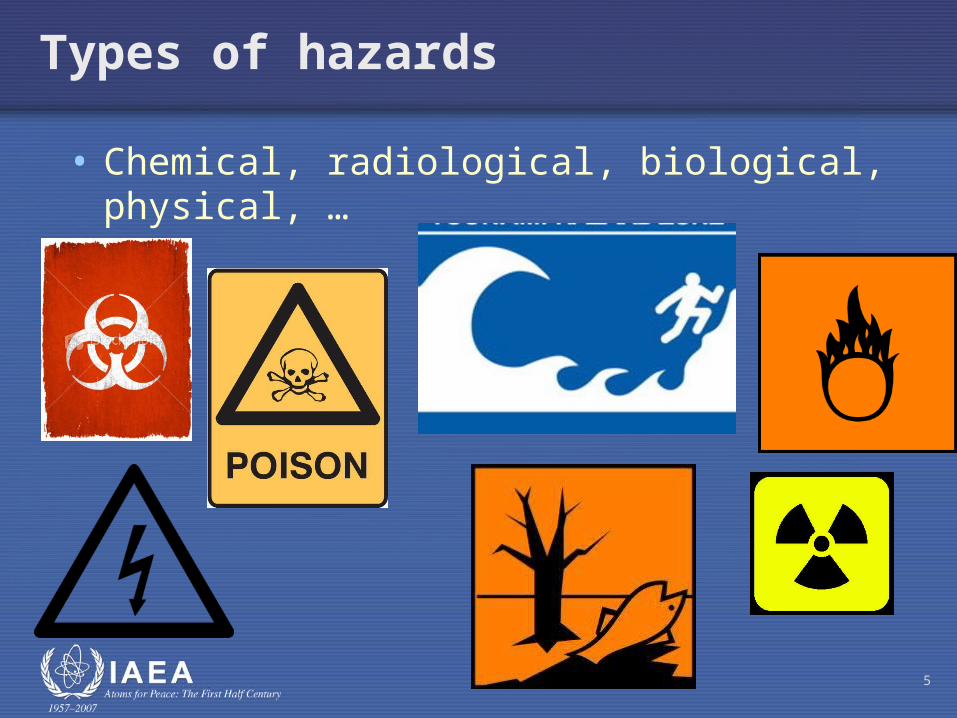
Types of hazards
• Chemical, radiological, biological, physical, …
5
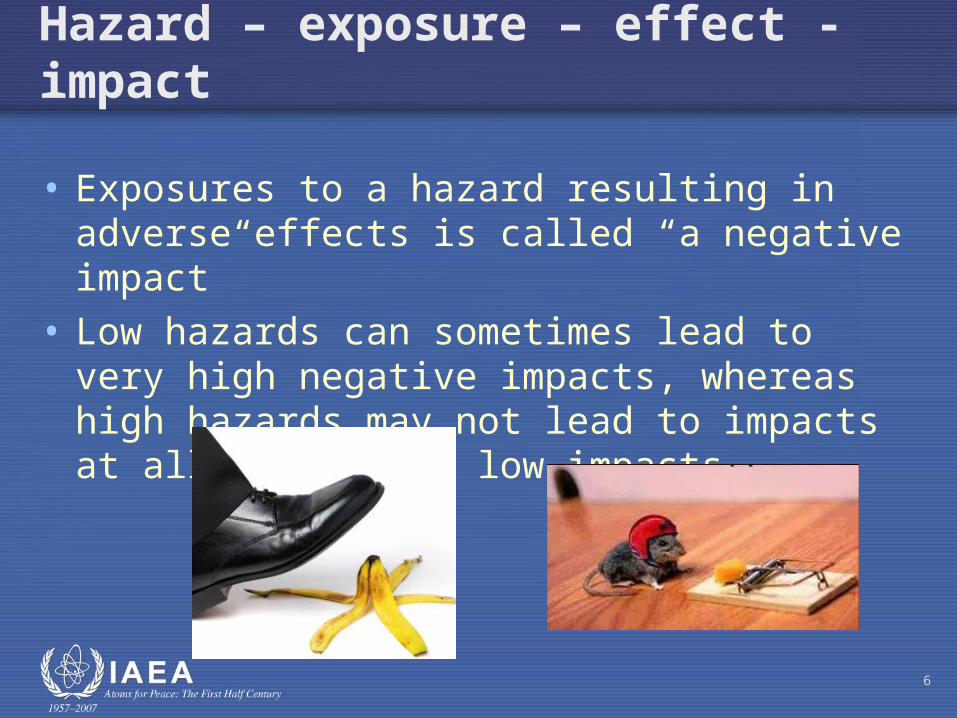
Hazard – exposure – effect - impact
• Exposures to a hazard resulting in adverse effects is called “a negative impact”
• Low hazards can sometimes lead to very high negative impacts, whereas high hazards may not lead to impacts at all or to very low impacts
6
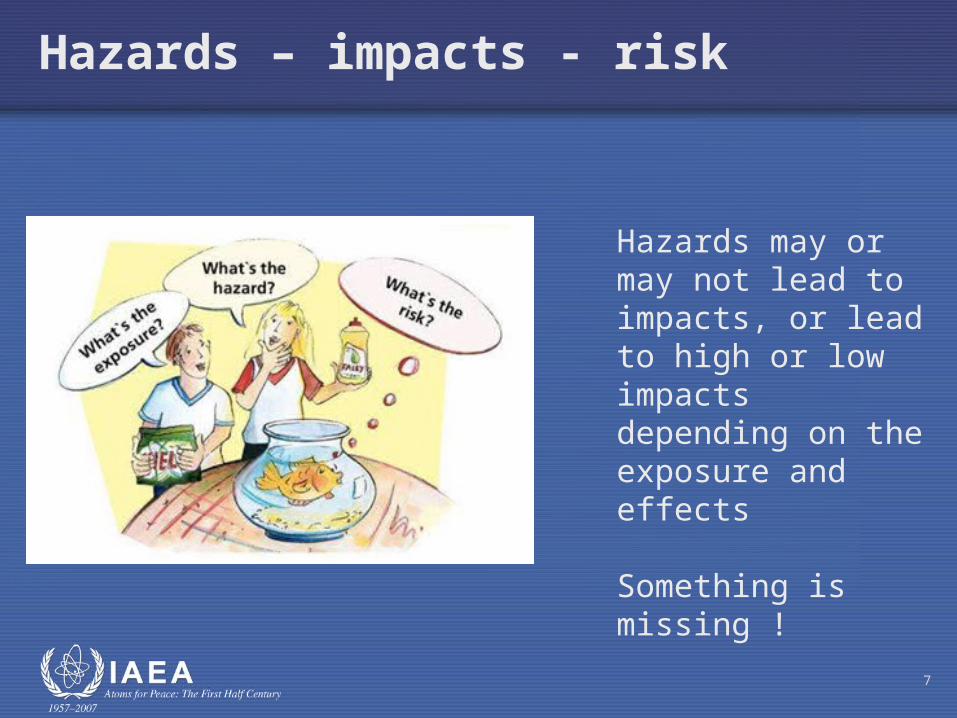
Hazards – impacts - risk
7
Hazards may or may not lead to impacts, or lead to high or low impacts depending on the exposure and effects
Something is missing !
Definition of Risk
The word risk derives from the early Italian “risicare” , which means to dare
Risk is the "possibility of loss or injury: peril.” (Webster Dictionary, 1999)
Antoine Arnauld 1662
Fear of harm ought to be proportional not merely to the gravity of harm, but also to the probability of the event(”La logique, ou l´art de penser” a bestseller at the time)
The concept of risk has (two) elements: the likelihood of something happening and the consequences if it happens
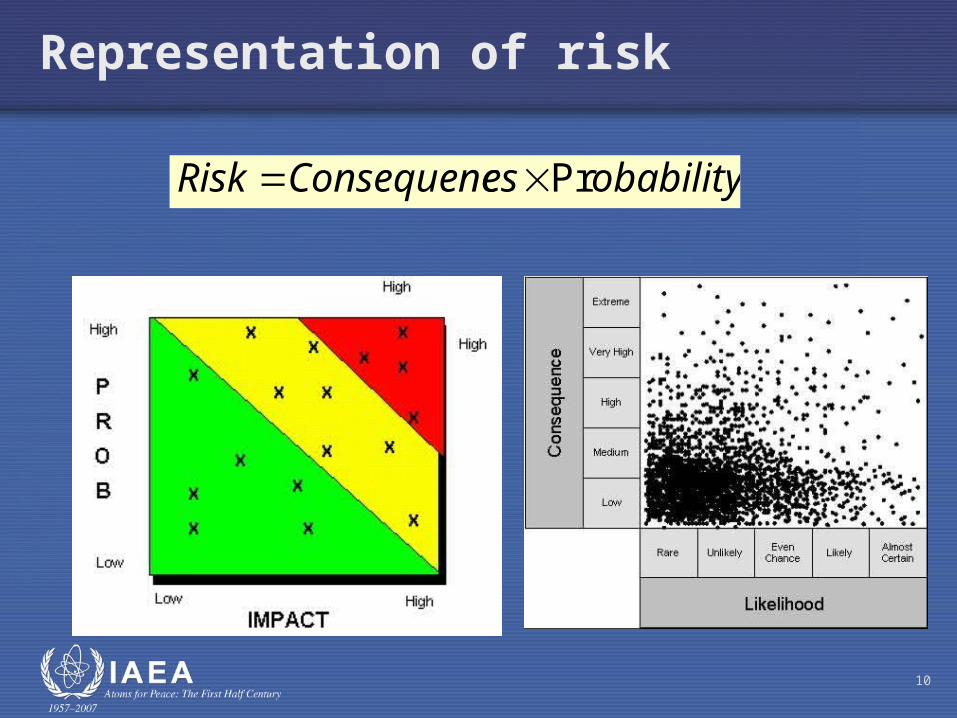
Representation of risk
10
obabilityesConsequencRisk Pr
11
What is probability?What is probability?
The ancient Greek word meant plausible or probable. Socrates defined it as ”likeness to truth”
Probability is a measure of our confidence that something is going to happen. Probable means to be expected with some degree of certainty
12
Conditional Conditional probabilitiesprobabilities
Any probability P(E) of an event E is conditional to some stipulated model or assumption (A1), it should strictly be written P(E|A1), i.e. the probability of E, given A1.
There may be other assumptions (A2, A3, A4, … Ai) in addition to the assumption A1 believed to be the most likely.
How can this fact be taken into account?
13
Example 1Example 1
Will a person survive the next twelve months?
From the age and sex we might get an answer from vital statistics, that will apply to the average person.
We may know the habits and conditions, which will make us to believe that the a higher or lower probability is more likely.
Someone with better insight could always assess a better value.
As uncertainties are eradicated the value would approach zero or unity
All estimates of probabilities are subjective and depend of knowledge and experience

14
””A priori” and ”a posteriori”A priori” and ”a posteriori”
A priori probability- estimated before the fact. Can be reliable ”only for the most part”
A posteriori probability- estimated after the fact. By taking a sufficient large sample, you can increase your confidence in the estimated probability to whatever degree you wish.
But, how reliable this probability is for predicting future events?
15
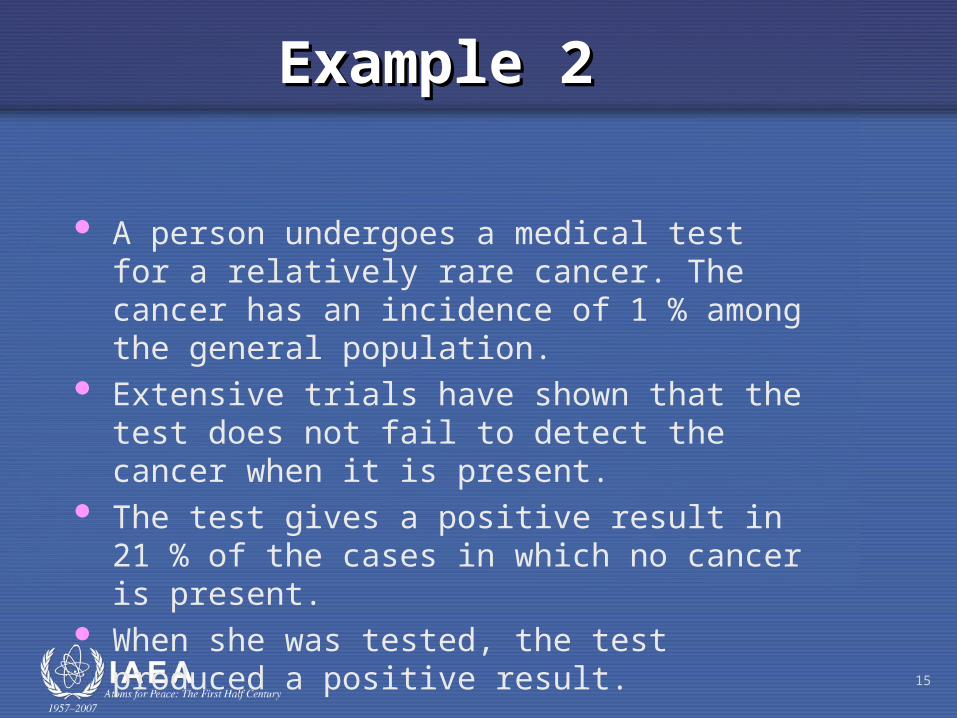
Example 2Example 2
A person undergoes a medical test for a relatively rare cancer. The cancer has an incidence of 1 % among the general population.
Extensive trials have shown that the test does not fail to detect the cancer when it is present.
The test gives a positive result in 21 % of the cases in which no cancer is present.
When she was tested, the test produced a positive result.
16
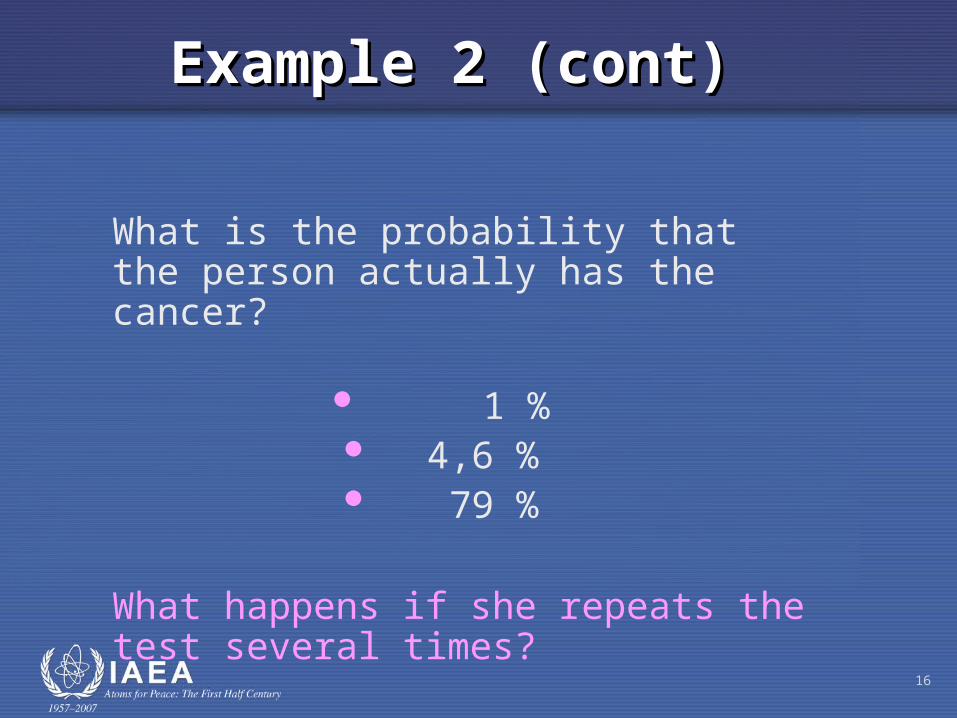
Example 2 (cont)Example 2 (cont)
What is the probability that the person actually has the cancer?
1 % 4,6 % 79 %
What happens if she repeats the test several times?
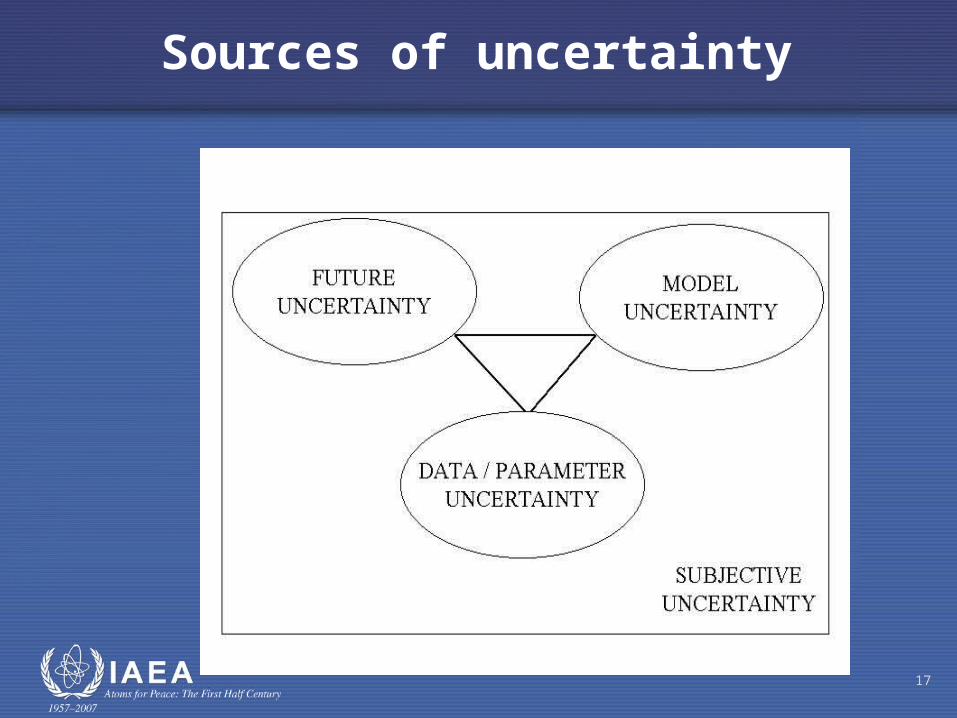
Sources of uncertainty
17
Future (System) Uncertainty
• Uncertainty due to our inability to make exact predictions of the future evolution of the system, the environment and of future human actions
18
Model Uncertainty
• Uncertainty in conceptual, mathematical and
computer models used to simulate the system behavior and evolution
19
Data/Parameter Uncertainty
• Uncertainty/variability in data and parameters used as inputs in modeling and dose calculations
• Can be represented using probability distributions
20
Management of uncertainties
• Uncertainty always exists in modelling any physical system
• Not possible to remove such uncertainties totally
• Instead need to manage them and reduce their effects
21
Approaches for Uncertainty Management
• Awareness – be aware of all major locations of uncertainty
• Importance – determine relative importance of various sources of uncertainty using sensitivity analysis
• Reduction – reduce uncertainties, e.g. through further data collation
• Quantification – quantify effects of uncertainties on model output using sensitivity analysis
22
Management of system uncertainty
• System uncertainty is usually managed by performing analysis for a set of scenarios of future evolution of the system
23
Management of Model Uncertainty
• Conceptual model: consider alternative conceptual models and collect further data
• Mathematical/computer model: use model verification, calibration and validation, and range of models
24
Management of Data/Parameter Uncertainty
• Five approaches can be used:• conservative/worse case approach
• best estimate and what if
• sensitivity analysis
• Probabilistic
• Can also be used to address model uncertainties
25
Conservative/worse case approach
• Use pessimistic parameter values to overestimate impact
• Danger of being so pessimistic as to be worthless and misleading
• Difficult to define the worst value, and prove that this is the worst one.
• Not always obvious what is conservative for a particular combination of parameters, exposure pathways and radionuclides
26
27
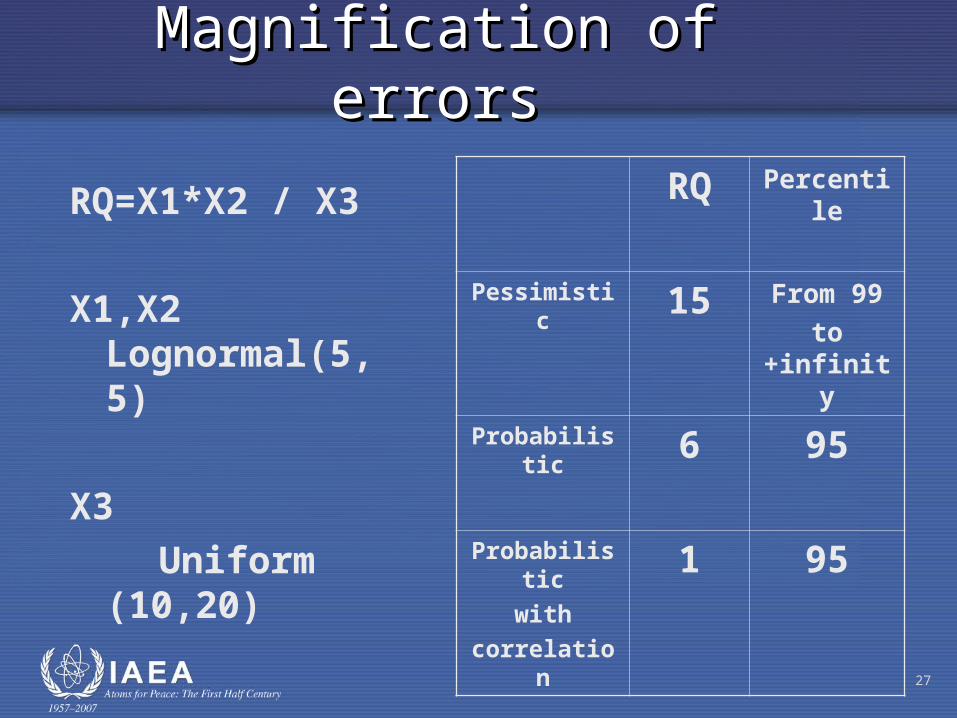
Magnification of errorsMagnification of errors
RQ=X1*X2 / X3
X1,X2 Lognormal(5,5)
X3
Uniform (10,20)
RQ Percentile
Pessimistic 15 From 99
to +infinity
Probabilistic 6 95
Probabilistic
with
correlation
1 95
28
Probabilistic methods - Random Probabilistic methods - Random variablesvariables
Random variables are used to describe aleatory events (from the Latin word aleatorius, which means games of chance), i.e. events whose outcome is uncertain
A discrete random variable can only take specific values from a set of values
A continuous variable can take any value within a defined range of values
29
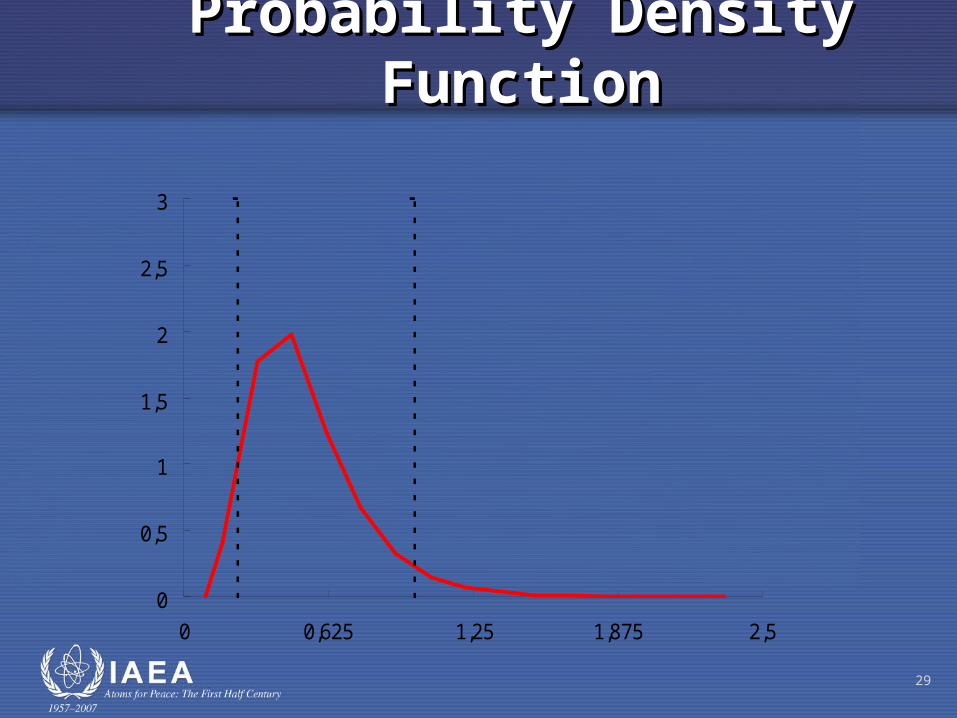
Probability Density FunctionProbability Density Function
0
0,5
1
1,5
2
2,5
3
0 0,625 1,25 1,875 2,5
30
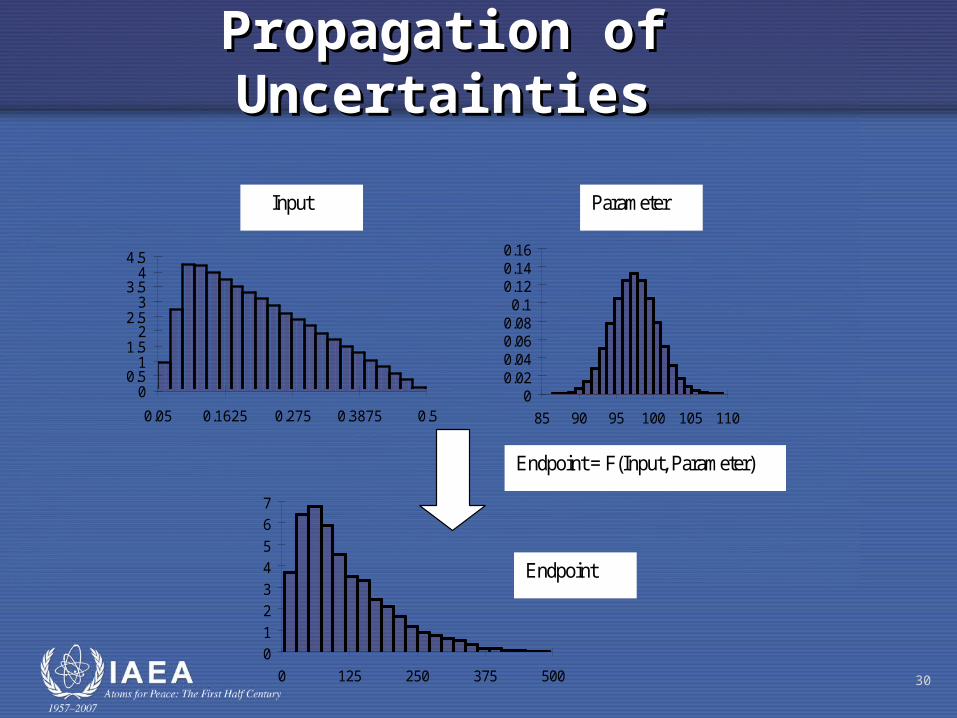
Propagation of UncertaintiesPropagation of Uncertainties
00.5
11.5
22.5
33.5
44.5
0.05 0.1625 0.275 0.3875 0.5
00.020.040.060.08
0.10.120.140.16
85 90 95 100 105 110
0
1
2
3
4
5
6
7
0 125 250 375 500
Input Parameter
Endpoint = F(Input, Parameter)
Endpoint
31
Main problems of the probabilistic approachMain problems of the probabilistic approach
1. Getting the probability distributions
2. Avoiding impossible combinations
32
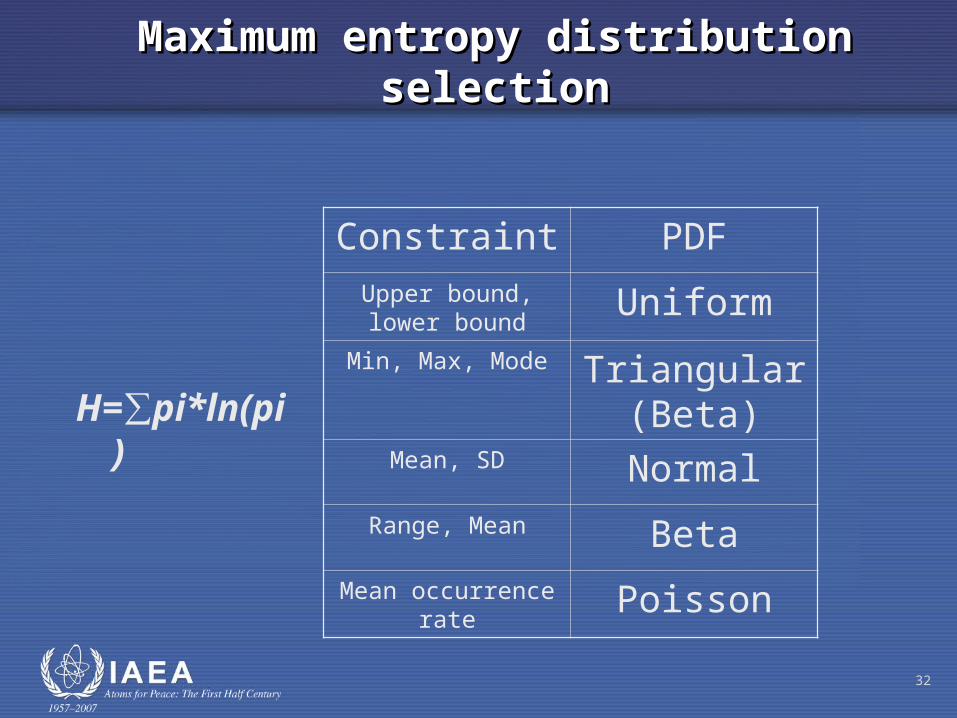
Maximum entropy distribution selectionMaximum entropy distribution selection
H=∑pi*ln(pi)
Constraint PDF
Upper bound, lower bound
Uniform
Min, Max, Mode Triangular (Beta)
Mean, SD NormalRange, Mean Beta
Mean occurrence rate
Poisson
33
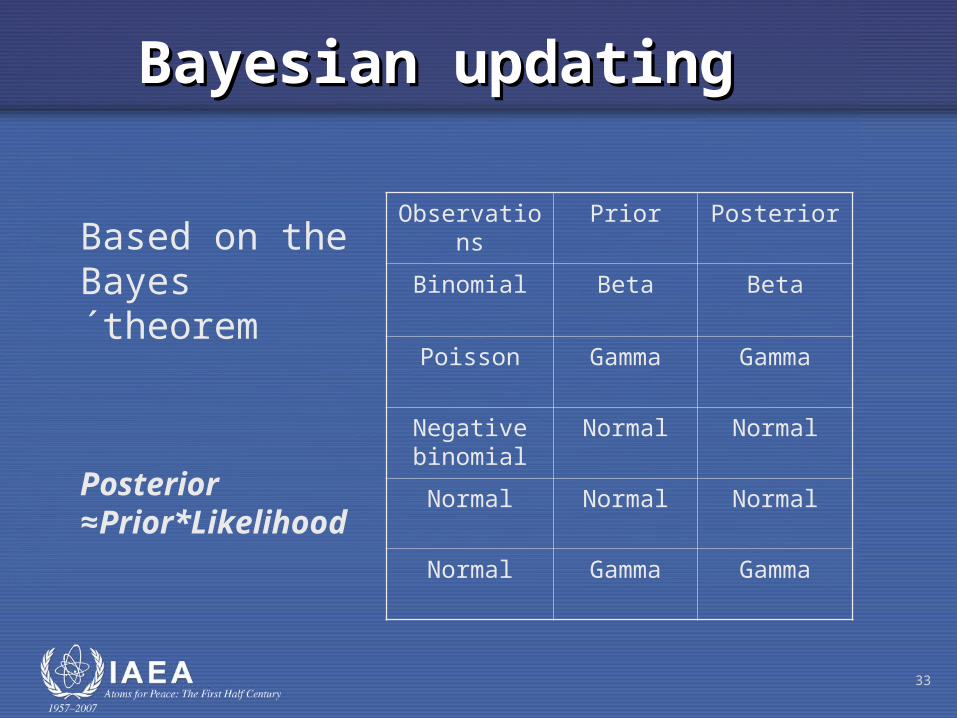
Bayesian updatingBayesian updating
Based on the Bayes´theorem
Posterior ≈Prior*Likelihood
Observations Prior Posterior
Binomial Beta Beta
Poisson Gamma Gamma
Negative binomial
Normal Normal
Normal Normal Normal
Normal Gamma Gamma
34
Sensitivity analysisSensitivity analysis
“Sensitivity analysis is the study of how the variation in the output of a model (numerical or otherwise) can be apportioned, qualitatively or quantitatively, to different sources of variation, and how the given model depends upon the information fed into it.”
(Andrea Saltelli, 2000)
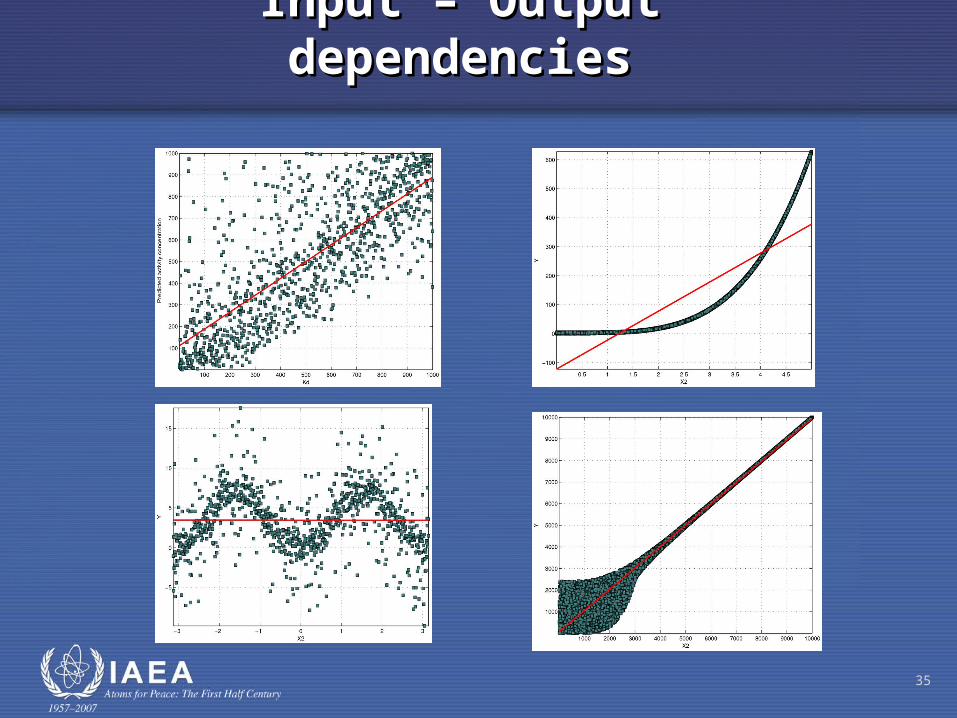
35
Input – Output dependenciesInput – Output dependencies
36
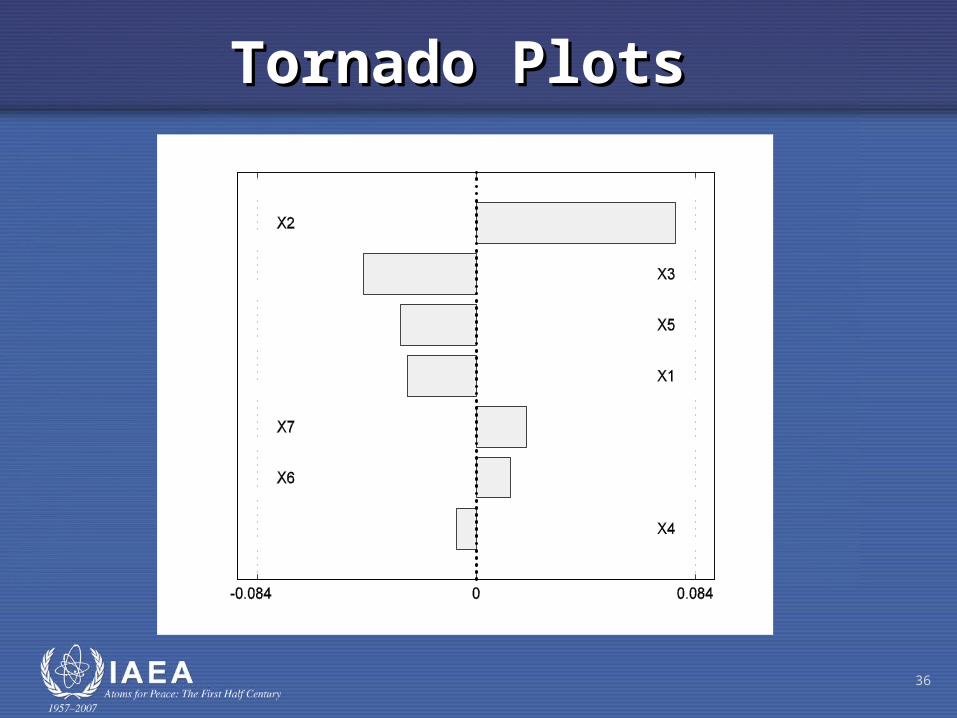
Tornado PlotsTornado Plots