analysis and prognosis of radiation exposure following the
TRANSCRIPT

General rights Copyright and moral rights for the publications made accessible in the public portal are retained by the authors and/or other copyright owners and it is a condition of accessing publications that users recognise and abide by the legal requirements associated with these rights.
Users may download and print one copy of any publication from the public portal for the purpose of private study or research.
You may not further distribute the material or use it for any profit-making activity or commercial gain
You may freely distribute the URL identifying the publication in the public portal If you believe that this document breaches copyright please contact us providing details, and we will remove access to the work immediately and investigate your claim.
Downloaded from orbit.dtu.dk on: Oct 31, 2021
Analysis and prognosis of radiation exposure following the accident at the Siberianchemical combine Tomsk-7
Vakulovski, S.M.; Shershakov, V.M.; Borodin, R.V.; Vozzhennikov, O.I.; Gaziev, Y.I.; Kosykh, V.S.;Makhon'ko, K.P.; Chumichev, V.B.
Publication date:1994
Document VersionPublisher's PDF, also known as Version of record
Link back to DTU Orbit
Citation (APA):Vakulovski, S. M., Shershakov, V. M., Borodin, R. V., Vozzhennikov, O. I., Gaziev, Y. I., Kosykh, V. S.,Makhon'ko, K. P., & Chumichev, V. B. (1994). Analysis and prognosis of radiation exposure following theaccident at the Siberian chemical combine Tomsk-7. Risø National Laboratory. Denmark. ForskningscenterRisoe. Risoe-R No. 750(EN)
TIDTTC^Æ^ T*HeSOOO<*t Risø-R-750(EN)
Analysis and Prognosis of Radiation Exposure Following the Accident at the Siberian Chemical Combine Tomsk-7 S.M. Vakulovski, V.M. Shershakov, R .V. Borodin, O.I. Vozzhennikov, Ya.I. Gaziev, VS. Kosykh, K.P Makhon'ko, and V.B. Chumichev
Risø National Laboratory, Roskilde, Denmark October 1994
Analysis and Prognosis of K**75*EN> Radiat ion Exposure Fo l lowing the Accident at the Siberian Chemical Combine Tomsk-7
S.M. Vakulovski, V.M. Sheishakov, R.V. Borodin, OX Vozzhennikov, YaX Gaziev, VS. Kosykh, K.E Makhonlco, and V.B. Chumichev
Scientific Production Association »Thyphoon«
Risø National Laboratory, Roskilde, Denmark October 1994
Abstract On the basis of the work (ground investigations and gamma aerial surveys)
carried out jointly by the Rosgidromet organizations and Berezovgeologiya, data on the radiation exposure in Russia were obtained shortly after the accident of April 6, 1993 already. These data were transmitted to interested institutions.
The measurements performed on April 11 and 12,1993 indicated that within the isolines of 10 /iR/h a contaminated area of up to 25 km in length and up to 6 km in width extended towards the northeastern direction. Thus, the contaminated area outside of the premises of the combine covered about 100 km2. The total amount of radioactive substances in this area was 530 - 590 Ci. Isotope composition of the radioactive trace was determined by ruthenium-103 (1%), ruthenium-106 (31%), zirconium-95 (22%), niobium-95 (45%) and plutonium-239 (0.02%).
Contamination heterogeneity is caused by the existence of "hot" particles with an activity of up to 10-11 Ci/particle.
In the contaminated area the gamma exposure rate varied between 14 and 42 /iR/h at 1 m height, yielding the maximum external radiation dose 100 mrem/year for the population of Georgievka. The Pu-239 inhalation dose of the population of Georgievka when passing the radioactive cloud did not exceed 1.5 mrem.
A prognosis was made with regard to water contamination of the rivers Samuska and Tom during the flood in spring. Furthermore, contamination of the air layer adjacent to the ground resulting from the wind transport of radionuclides in the summer months at Georgievka was predicted. The values were far below the limits fixed according to the valid radiation protection regulations. However, that radionuclide concentration of the snow water may exceed the limits specified for drinking water.
According to the data measured by the meteorological stations, the radioactive products were not entrained beyond the borders of the country. Source estimation was successfully obtained using RIMPUFF, the Rise on-line puff diffusion model, in backfitting mode.
The basic translation of this report from Russian into English was done by the translation office at Kernforschungszentrum Karlsruhe, Germany.
ISBN 87-550-1980-3 ISSN 0106-2840
Grafisk Service Risø • 1994
Contents
Introduction 5
1 Measures Taken by the Russian Federal Survey for Hydromete-orology and Environmental Monitoring After the Accident 5
2 Results of the Isotope Analysis of Snow and Soil Samples 7
3 Spread of the Radioactive Products in the Atmosphere and Contamination of the Ground Due to Their Deposition 13
4 Prognosis of Contamination Resulting from Secondary Wind Transport 19
5 Prognosis of Water Contamination 21 5.1 Estimated Radionuclide Concentration of the Samuska River 21 5.2 Contamination of the flood in spring 21 5.3 Estimation of radionuclide washout 22
6 Supply of Information for the Estimation of Radiation Exposure in the Area of the Siberian Chemical Combine 23 6.1 Information for the taking of appropriate measures during the first
hours after the accident 23 6.2 Systematization of the measured values and data processing for an
objective radiation analysis 29
Annex 1 1,2
References 44
Riso-R-750(EN) 3


Introduction
According to the report about the state of tadiation in the area »fleeted by the accident at th* Siberian chemical combine (Tomsk-7), which was submitted by the Commission of the Russian State Committee for States of Emergency (1], the N6102/2 facility of the radiochemical plant was destroyed on April 6, 1993 at 12-58- In this facility, a uranium solution had been prepared for extraction. During the explosion, part of the activity was released into the environment. It can be concluded from the activity data of the uranium solution published by the chemical combine that 500 Ci beta-active and 20 Ci alpha-active products including 19.3 Ci plutonium-239 had been contained in the facility prior to destruction.
Explosion resulted from the decomposition of the organic phase of the solution when interacting with concentrated nitric acid. The limited steam/gas volume released into the hall exploded. Thus, the extent of the damage was increased even further. Activity release into the atmosphere took place via the ventilation system, the pressure and vacuum lines, the 150 m high stack of building no. 205, the ventilation system and stack of building no. 201 as well as via the destroyed walk.
Immediately after Rosgidromet had been notified of the accident, measurements were started and radiation exposure in the area affected was analyzed in accordance with the regulations regarding The Measures to be Taken by the Rosgidromet Divisions in Case of Nuclear Accidents".
1 Measures Taken by the Russian Federal Survey for Hydrometeorology and Environmental Monitoring After the Accident
At 18-45 local lime Rosgidromet was informed about the accident. To determine the contaminated area, all hydrometeorological stations and aeronautical meteorological offices of the monitoring network established by Rosgidromet were ordered to measure the gamma dose rate and the meteorological parameters every hour. The data obtained were then to be made available to Rosgidromet and other interested institutions. These values albwed a preliminary estimation of the extent of contamination to be accomplished. It turned out that contamination was entirely local.
As far as geography is concerned, the contaminated area is slightly hilly with only small differences in altitude (30 m). In the northern part, the territory is mainly covered by coniferous forest with dense underwood. In the south, mixed forest as well as bushes and shrubs are prevailing. Population density amounts to 80%. Heights of 10 to 12 m are reached by the trees. About 20% of the territory is made up of swamps. Nearly 10% is under agricultural use. From east to west, the area is crossed by the Samuska river flowing in strong meanders. A maximum water flow rate of up to 70 m3/s is attained. The mean annual water flow rate is 10 m3/s. While in the northeastern part, the territory is mainly loamy (70%), soil f in the southwestern part is fo ad to be predominantly sandy.
The values measured by the synoptic aerological stations nearby, the meteorological data determined every 30 minutes in Tomsk (table 1.1) and the balloon data measured at Tomsk airport (table 1.2) led to the following conclusions:
Risø-R-750(EN) 5

TmUt 1.1. Data mtasand iy the Tomsk mttnwUfieal station »a Af ril S. 1993
Time
nm 11:30 12:00 12:30 13:00 13:30 14:00 14.30 15:00 15:30 16:00
Wind Dir.
(<*eg)
190 200 200 210 190 210 200 210 200 200 200
Wind Speed m/s
8-11 7-10 8-11 8-11 9-12 9-12 10-13 9-13 8-12 9-13 10-13
Air Temp.
•c -4 .3 -4 .0 -3 .8 -3 .5 -3 .2 -3 .2 -2 .9 -2 .6 - 2 . 3 -2 .0 -2 .0
Ret. Hum.
%
79 80 80 81 77 77 67 65 68 71 81
Preci-pita-tion
---------
15" - 1 7 *
Degree of
Cloudiness
10/3 cirrostratus
strato-cumulus clouds w
» » tr
w
w
ff
10/4 cirrostratus
strato-cumulus clouds
Table 1.2. Data mtasarti rSjr tkt Mloons
Time
11:00 14:00 17:00
altitude above ground (m) Ground Level dir. m/s
200 8 200 10 200 3
100 dir. m/s
210 7 200 9 200 9
200 dir. m/s
210 10 200 10 200 10
300 dir. m/s
220 10 210 10 210 10
400 dir. m/s
220 14 210 12 210 10
500 dir. m/s
220 15 210 15
600 dir. m/s
220 14 220 14
• Weather conditions at the site of the accident - stable southwestern wind (190 - 210 deg.), speed 8 - 1 3 m/s, temperature -3°C; precipitation in the form of wet snow was recorded after the accident at 15:30 local time;
• stratification - neutral.
For determining radiation exposure in the area surrounding the combine, two teams of experts of the Institute for Hydrometeorology and Environmental Monitoring, Division West Siberia (ZapSibgidromet), were established. The field measurements were performed at 16 villages and every 300 to 500 m on the roads from Tomsk to Samus and from Tomsk to Nelyubino. The highest contamination was found to exist on the road from Tomsk to Samus. Beginning at km 20, a strong increase in the gamma dose rate was observed. Maximum gamma dose rate was recorded at km 28.6, while high values were still measured up to km 31.
On the basis of the hydrometeorological data and the field measurements, the ZapSibgidromet and Rosgidromet experts were then able to determine the contaminated area within the 30-km zone surrounding the chemical combine. As assumed by the experts, the trace of the radioactive cloud was directed towards the northeast having a length of up to 20 km [2, 3].
Then, the trace dimensions as well as ground contamination inside the "spot" generated had to be determined more precisely. Appropriate methods had already been developed by the Rosgidromet divisions in close cooperation with the Russian Geological Committee when investigating the consequences of the accident at the
6 Risø-R-750(EN)
Chernobyl nuclear power piant. ia this <*»*, the measurements were carried otit by ZapSibgidromtt experts on 7 routes with a total length of 40 km under difficult conditions (deep snow in the taiga). Azimuthal determination of the gamma dose rate was accomplished every 100 m. In addition, 25 snow samples were taken and analyzed with regard to their concentrations of radionuclides and transuranium elements.
On behairof the Rosgidromet Institute for Global Climate and Ecology and the Russian Academy of Sciences, an aerial gamma survey was made of the 30-km zone surrounding the Tomsk-? chemical combine. Staff members of the stats-owned geological enterprise "Berezovgeologiya" took part in this work [3]. The plane used for this purpose (AN-2) was equipped with a few-channel spectrometer having a NaJ(T1)-o-crystal detector of 200 x 100 mm in size and a total volume of 25 I. This device also served for measuring the gamma dose rate. Sensitivity amounted to 410 pulses per second for I uR/h. Radionuclide composition was determined by recording gamma radiation in the following eight intervals of the energy spectrum: 0.62 - 0.T4 MeV, 054 - 0.65 MeV, 0.4 - 0.6 MeV, and 0.6 - 0.84 MeV for artificial radionuclides; the measurements for the natural radionuclides took place in the ranges close to the lines of 1.12, 176, 1.46 and 262 MeV.
Flight altitude was 70 to 100 m. Following the aerial survey measurements, by means of which the general direction of transport and fallout of the radioactive products was found, detailed mapping of the snow-corered contaminated area in the scale of 1:100,000 was achieved on April 12 and 13.1993 (distance between the measuring routes 1 km). The measuring routes were located at right angles to the axis of the radioactive trace and about 20 km long. The measurements started and ended outside of the trace. Thus, the outlines of the contaminated area could be identified. Calibration of the spectrometer installed in the plane was accomplished by repeated measurements. At the same time, snow samples were taken on the corresponding routes and the dose rate was measured using a dose meter of the type DRG-01. By comparison, a maximum root-mean-square error of the gamma dose rate measurements of 20% was determined.
The results of the gamma aerial survey and the comparative measurements at ground level were analyzed by the scientists involved in the activities and the experts of the Rosgidromet Institute for Global Climate and Ecology. They were found to be in good agreement.
2 Results of the Isotope Analysis of Snow and Soil Samples
From April 7 to April 12, 1993, isotope composition and concentration of the radioactive products deposited on the ground were determined by the ZapSi-bgidromet experts by means of 27 snow and 10 soil samples. In Fig. 2.1 the sampling is represented schematically. The samples were then analyzed in the laboratories of ZapSibgidromet and SPA "Typhoon", respectively.
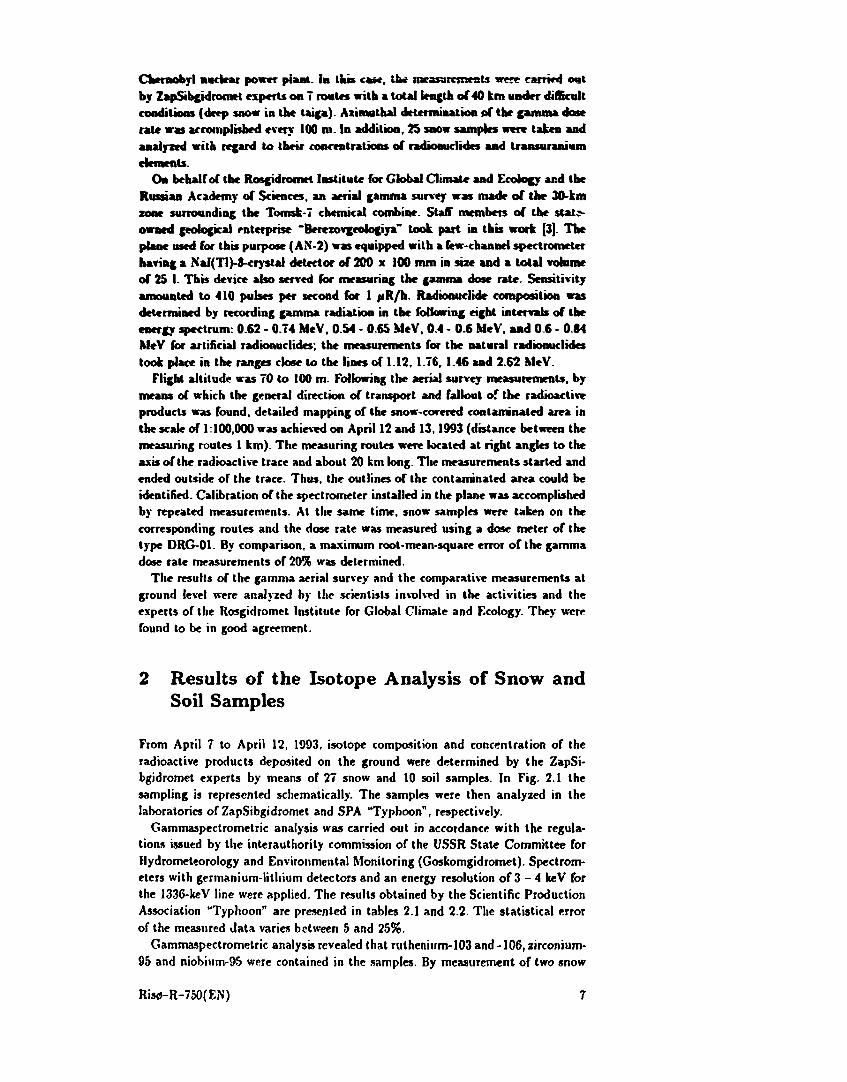
Gammaspectrometric analysis was carried out in accordance with the regulations issued by the interauthority commission of the USSR State Committee for Hydrometeorology and Environmental Monitoring (Goskomgidromet). Spectrometers with germanium-lithium detectors and an energy resolution of 3 - 4 keV for the 1336-keV line were applied. The results obtained by the Scientific Production Association "Typhoon" are presented in tables 2.1 and 2.2. The statistical error of the measured data varies between 5 and 25%.
Gammaspectrometric analysis revealed that ruthenium-103 and -106, zirconium-95 and niobium-95 were contained in the samples. By measurement of two snow
Ri*>-R-750(EN) 7

samples over a period of 6 hours, trace amounts of certain-144 and antimony- 125 (10 - SO mCi/km3) were detected. Separate ganunaspcctroinetric analysis of the suspended and dissolved fractions of the snow samples resulted in the finding that more than 80% of the activity was bound to the suspended fraction. Gamma spectrometry of molten snow samples without prior separation into a suspended and a dissolved fraction therefore yielded far too high results that could not be used for quantitative estimation of contamination. Nevertheless, the isotope composition and the share of the individual isotopes in total contamination can still be specified.
i HS-GDR on April 12,1993, jtR/k
Seunmtka
I *«—<"*» 1
i
NaoeshJal
road TOMSK-Samos
BT-150 it
yNa—OTka,|
Samitska
^ rVadeahsJa]
road TOMSK San«
<e) SPA "Typhoon*. B o a x i d i w t . O b a m k
Fé§mrt 2.1. Figure 2.1* skovs s schemutic reprtsention of tkt measuring routes, and figure 2.1b a schematic representation of Ike sampling on April 12, 1993.
Comparison of the values obtained by SPÅ "Typhoon" and ZapSibgidromet for the suspended and dissolved fraction of the soil and snow samples did not reveal any systematic deviations. However, a Kattering factor of 4-5 was reached. Scattering of the data can be explained by the inhomogeneous radioactivity of the samples, which is due to the existence of "hot" particles.
By means of gamma spectrometry of the soil samples, it was found out that the cesium-137 content exceeded gross contamination by a factor of 2-7. The latter had been caused by the emission A cesium-137 during the previous years of operation of the Siberian chemical combine. Existence of this contamination had been confirmed by the investigation results of the ZapSibgidromet experts in the years before the accident.
In numerous snow samples analyzed by SPA "Typhoon", also plutonium-239 and strontium-90 were identified. For plutonium-239 analysis, a method similar to that developed by the V.I. Vernadski Institute for Geochemistry and Analytical Chemistry was applied [4]. Plutonium-242 served as the tracer. The impurity components were removed by an anion exchange resin. Electrolytic separation of
8 Risø-R-750(EN)

T«Ur 21- S*»w mmd sød smmpUs tmktm n tå« mrt* éfftettd »j the mendtmt (Tmmsk-7)
Sample No.
3
4
7
8
9
5
Radiation
*R/k
70
120
100
131
123
77
Susp.-F Sol.-R
SoU
F R
F+R SoU
Total F R
F+R Soil
Total F R
F+R SoU
Total F R
F+R Soil
Total F R
F+R Soil
Activity. Ct/km*
Ru-103 Ru-106 Zr-95 Mb-95 Cs-137
00068 113 0.843 1.65 00o39 0.069 0.022 0.024 0.072 1.2 0.865 1.67 0.026 043 0.173 0347 0222 0.098 163 1.04 2.02 0.222 0.106 1.89 1.09 2.08 0.009 0.179 0.05 0.058 1.115 207 1.14 2.14 0.223 8.32 6.08 15.6 0.14 0.338 104 7.2 17.7 014 0.062 1.46 0.884 1.73 0.003 0.063 0.009 0016 0.065 1.52 0.893 1.75 0.061 1.36 0.949 1.98 0.435 0.125 2.88 1.84 3.73 0435 0.253 4.73 3.51 6.78 0 015 0.335 009 0137 0.268 506 3.60 691 0.086 1.99 150 344 0.271 0.354 7.05 510 10.3 0.271 0.21 4.40 324 10.0 0.006 0228 0.085 0.311 0.216 4.63 332 10.3 0.21 4.99 334 9.8 0.44
the sample to be counted took place on a stainless steel target. Alpha radiation of plutonium-239 was measured using a spectrometer of the type 570 A-450 R manufactured by the "ORTEC company. Strontium-90 was determined in accordance with the methods outlined in [5]. They had already been applied in 1990, when SPA "Typhoon" investigated intercalibrated IAEA samples with regard to their plutonium-239, plutonium-240 and strontium-90 contents. Agreement of the results with the basic values was found to be rather good.
The analytical results obtained with regard to the Pu-239 concentration of both suspensions of the particles contained in the snow water of the snow samples studied and filtered water samples are presented in table 2.3. According to the values indicated for the first five samples, at least 90% of the Pu-239 activity of the snow is bound to the water-insoluble, disperse phase of the radioactive fallout. A mean of 4% of the activity is found in the soluble phase only. For subsequent analysis, suspensions filtered from the snow water samples were applied. It is evident from the data given in table 2.3 that the densities of Pu-239 deposition on the snow exceeded 0.06 mCi x km"2. However, they were far below the maximum permissible ground contamination (100 mCi x km~J) specified in April 1986 after the Chernobyl accident.
Risø-R-750(EN) 9
TWAle t t Smøw stmpbs tdttm n tic mm tfftclti Af tic meaiemt (Tøtmsk-7)
Route
M-l
M-l
M-2
M-3
M-4
Sample No.
1
2
1
1
2
Georfievka, villafr boundary lieMpath Georfievka village boundary house No. 6 front yard
Radia- Susp.-F Date of tim Sol-R
sampling pR/n Total F+R
1204.93 30 F R
F+R 12.04.93 23 F
R F+R
12.04.93 72 F R
F+R 12.04.93 206 F
R F+R
11204 93 96 F R
F+R 0.7.04.93 F
R F+R
0804.93 F R
F+R
Activity, Ci/km3
Ru-103 Ru-106 Zr-95 Nb-95
0.021 0.286 0.18 0.465 0.02 0035
0.021 0.286 0.20 0.50 0061 1.304 0.993 1.97
0.018 0028 0.061 1.304 1.011 2.0 0.092 2.08 1.51 2.64
0.05 0.042 0071 0.092 2.13 1.55 2.91 0.137 3.01 2.11 3.67 0.034 0.843 0559 1.036 0.171 0.385 2.67 4.71 0.07 1.62 1.01 1.90 0.007 0.154 0098 0.195 0.077 1.77 1.11 2.095 0019 0.403 0.224 0.358
0.032 0013 0.027 0.019 0.435 0.237 0385 0.023 0.566 0.432 0.919
0.10 0.046 0107 0.023 0.666 0.478 103
TmUt i.S. Dtnstlf øf smrftct eøntmmtmmtiøn øf Ikt suøw Af plmtømimm-SSf
Ho. or designation of
the sample
3
4
7
8
9
M-1-1 M-1-2 M-2-1 M-2-2 M-4-2
Georgievka,6
Anal- fraction Surface eontamina Pu-239/Zr-95 Suspension (F) tkm of the snow activity ratio
Filtrate (R) mCi x km'3 %
F 0 3 0036 R 0.007 F 015 0.014 R 0.017 F 0.4 0.045 R 0.0032 F 1.2 0.037 R 0.043 F 1.2 0.037 R 0.023 F 0.06 0032 F 0.3 0.03 F 063 0.042 F 0.35 0.035 F 035 0.035 F 0.12 0.028
10 Ri*»-R-750(EN)

The values give« in table 2.3 (last column) are required lor the dctormiaatioa of the conversion factors. Using these factors, the Pu-239 content of the radioactive fallout may be calculated from the zirconium-95 activity that can be measured easily. The mean value of the Pu-239/Zr-95 activity ratios indicated in table 2.3 is 3.4 x 10~*. The root-mean-square error of the measurements and the mean value amounts to $ xlO~s and 2.6 x!0~*. respectively. From this it may be concluded that the mean value of the ratios above amounts to (3.4 ± 0.6) 10~4
with a probability of 0.95. The conversion factor from the zirconium-95 activity measured in a sample to its Pu-239 content range* from 1.6 x 10"* to 5.2 x 10~*. Thus, the most probable surface density at the sampling point of the snow sample M-3-I, the plutonium-239 content of which was not analyzed radiochemkaUy, was bund to be about 1 mCi x km"3. With a probability of 0.95, the value of 1.4 MfCi x km~2 was not exceeded.
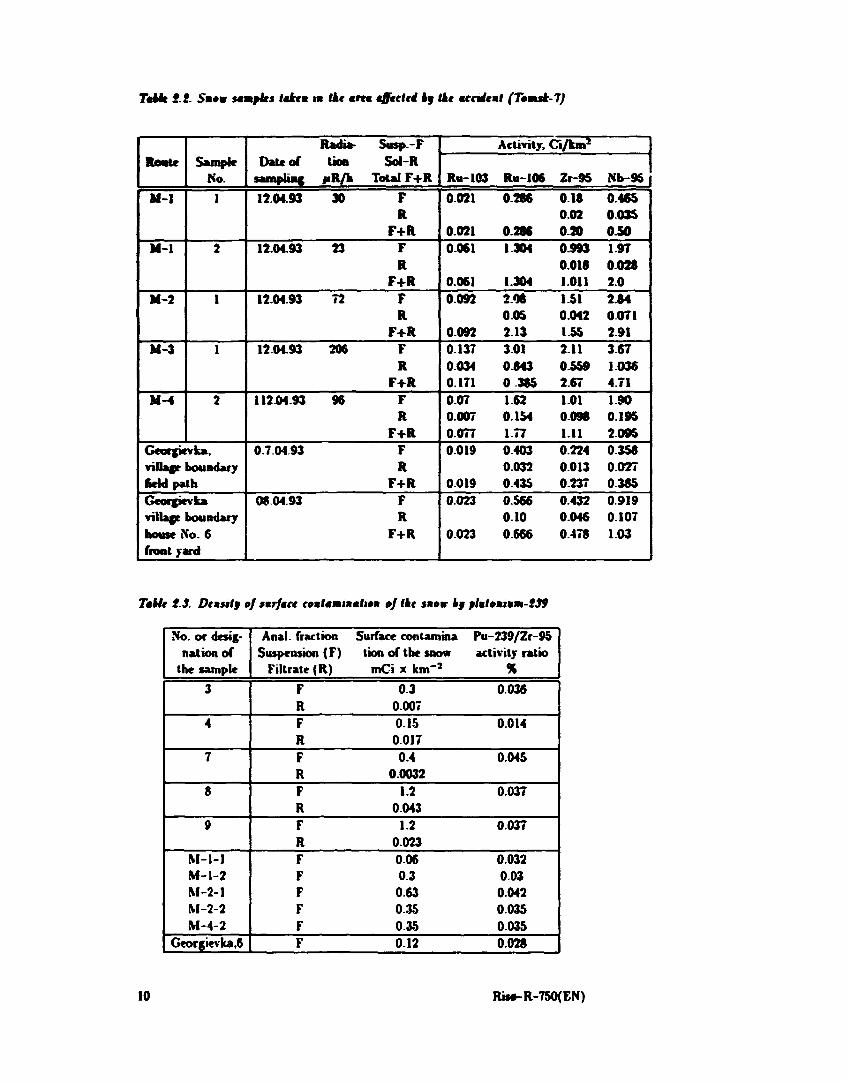
The snow sample M-3-1 (or to be more precise, the portion analyzed by SPA Typhoon'*) was applied for preliminary estimation of the surface density of uranium deposition in the controlled area. According to the data published by the Siberian chemical combine. $773 kg uranium had been contained in the 6102/2 facility prior to the accident [I]. This i due almost completely referred to uranium-23$. The fractions of the other uranium isotopes were extremely small. The uranium-238 content of the sample to be investigated was determined by means of neutron activation analysis. It was found that surface density of the uranium-238 deposition on the snow amounted to 4$0 g x km - 3 at the sampling point of sample M-3-1. Surface density of the alpha-activity resulting from uranium-238 was 0.16 mCi x km"-. This value may be derived from the known specific alpha-activity of uraaium-23Sof3.34 x I0~TCi x g"1. As the surface density of Pu-239 deposition on the snow amounted to about I mCi x km - 3 at thb point, the uranium-238/Pu-239 activity ratio of the atmospheric radioactive fallout was 0.16. This value corresponded to that of these radionuclides (0.15) in the source of radioactive emission into the atmosphere. The most important data obtained by the laboratory of the National Health Service with regard to the surface densities of the radioactive Pu-239 and uranium-238 depositions on the snow are reported about in [1] and summarized in table 2.4.
According to the data given in tables 2.3 and 2.4. the surface densities of plutonium-239 deposition on the snow at Grorgicvka are 0.12 mCi x km~3 and 0.20 mCi x km - 3 , respectively. Hence, a mean value of 0.16 mCi x km"3 is obtained. The deviations of the individual values measured from the mean value obviously result from macroscopic and microscopic inhomogeneilies of the plutonium-239 deposition field in the Grorgicvka area. These inhomogeneities may be caused by most of the alpha- and beta-active products being deposited on the surface of the snow in the form of "hot" particles having beta-activities of 10" " Ci/particie and more. According to preliminary estimates, the deposition density of these particles on the surface of the snow at the fringe of the Georgievka village (field path) amounted to about 4 x 10³ particles/m3. Now, the special features of ground contamination by "hot" radioactive particles and their physical and nuclear-physical characteristics shall be investigated. According to table 2, values of (6.5 - 7.5) mCi x km'3 were attained for the surface density of Pu-239 contamination at certain points in the snow. These values corresponded to those of the sections with the highest contamination. But even in these cases, the values were found to be far below the maximum permissible ground contamination by plutonium-239. At measuring points with the gamuia dose rate ranging from 160 to 1800 u R x h~', a mean value of the Pn-239/zirconinm-95 activity ratio of (1.0 ± 0.34) x 10"3
was obtained with a probability of 0.95. The individual values were found to be in the range of (1.0 ± 0.8) x 10° . Hence, they differed from the above estimates for less contaminated areas in the radioactive trace. It must he pointed out that so
Riw-R-750(F,N) I I
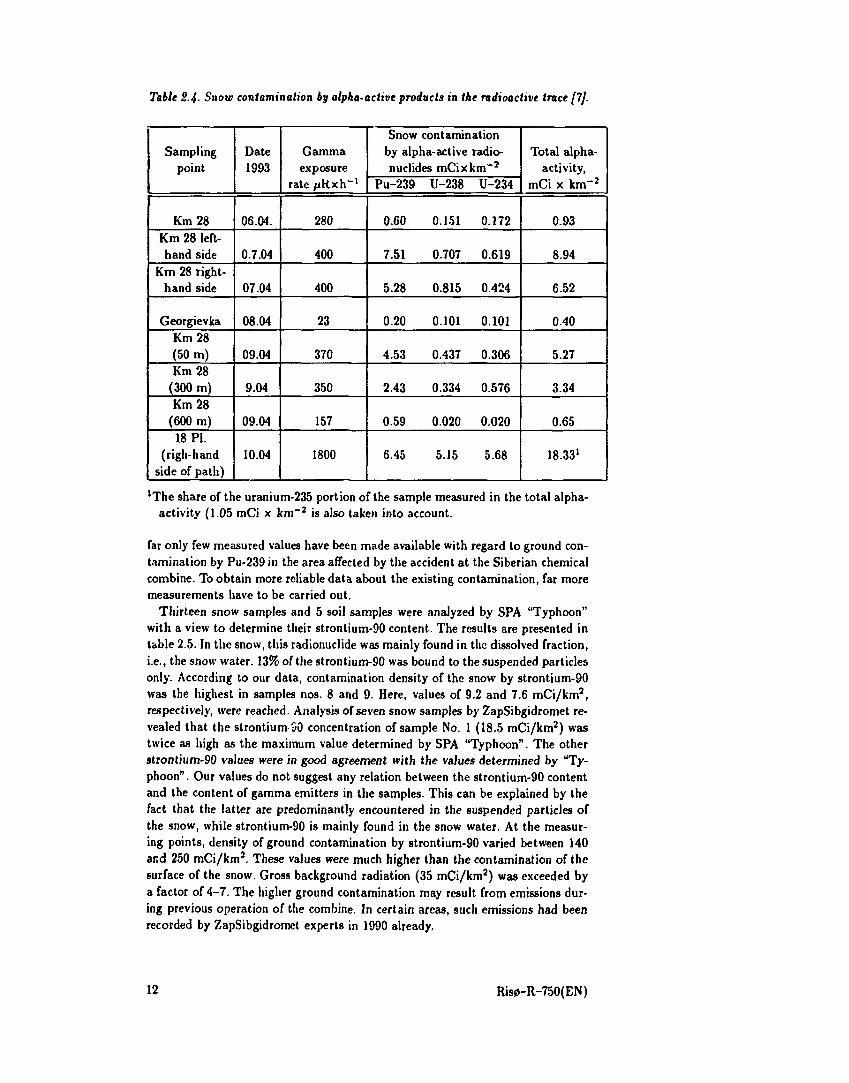
Table 2-4- Snow contamination by alpha-active products in the radioactive trace [7].
Sampling point
Km 28 Km 28 left-hand side
Km 28 right-hand side
Georgievka Km 28 (50 m) Km 28
(300 m) Km 28
(600 m) 18 PI.
(righ-hand side of path)
Date 1993
06.04.
0.7.04
07.04
08.04
09.04
9.04
09.04
10.04
Gamma exposure
rate /iHxh - 1
280
400
400
23
370
350
157
1800
Snow contamination by alpha-active radionuclides mCixkm"2
Pu-239 U-238 U-234
0.60 0.151 0.172
7.51 0.707 0.619
5.28 0.815 0.424
0.20 0.101 0.101
4.53 0.437 0.306
2.43 0.334 0.576
0.59 0.020 0.020
6.45 5.15 5.68
Total alpha-activity,
mCi x km - 2
0.93
8.94
6.52
0.40
5.27
334
0.65
18.331
The share of the uranium-235 portion of the sample measured in the total alpha-activity (1.05 mCi x km - 2 is also taken into account.
far only few measured values have been made available with regard to ground contamination by Pu-239 in the area affected by the accident at the Siberian chemical combine. To obtain more reliable data about the existing contamination, far more measurements have to be carried out.
Thirteen snow samples and 5 soil samples were analyzed by SPA "Typhoon" with a view to determine their strontium-90 content. The results are presented in table 2.5. In the snow, this radionuclide was mainly found in the dissolved fraction, i.e., the snow water. 13% of the strontium-90 was bound to the suspended particles only. According to our data, contamination density of the snow by strontium-90 was the highest in samples nos. 8 and 9. Here, values of 9.2 and 7.6 mCi/km2, respectively, were readied. Analysis of seven snow samples by ZapSibgidromet revealed that the strontium SO concentration of sample No. 1 (18.5 mCi/km2) was twice as high as the maximum value determined by SPA "Typhoon". The other strontium-90 values were in good agreement with the values determined by "Typhoon" . Our values do not suggest any relation between the strontium-90 content and the content of gamma emitters in the samples. This can be explained by the fact that the latter are predominantly encountered in the suspended particles of the snow, while strontium-90 is mainly found in the snow water. At the measuring points, density of ground contamination by strontium-90 varied between 140 and 250 mCi/km2. These values were much higher than the contamination of the surface of the snow. Gross background radiation (35 mCi/km2) was exceeded by a factor of 4-7. The higher ground contamination may result from emissions during previous operation of the combine. In certain areas, such emissions had been recorded by ZapSibgidromet experts in 1990 already.
12 Risø-R-750(EN)
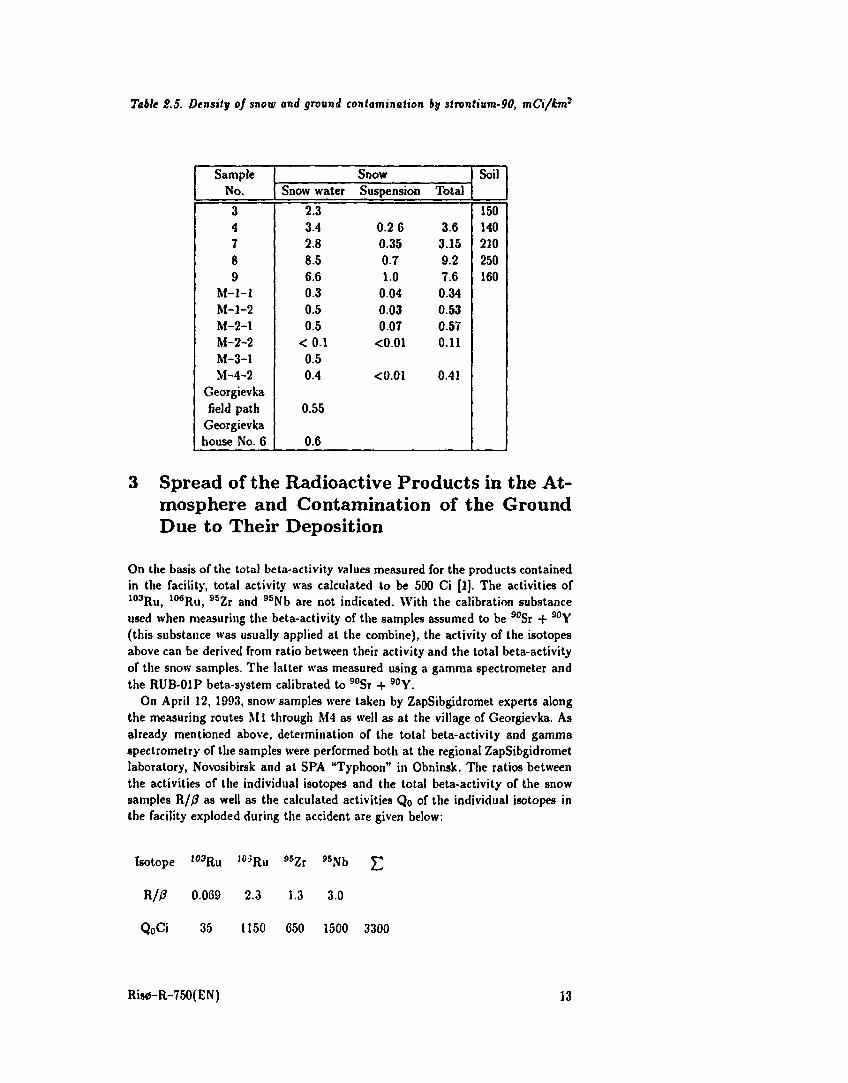
Table 2.5. Density of snow and ground contamination by stronttum-90, mCi/km?
Sample No.
3 4 7 8 9
M-l-1 M-l-2 M-2-1 M-2-2 M-3-1 M-4-2
Georgievka field path
Georgievka house No. 6
Snow water
2.3 3.4 2.8 8.5 6.6 0.3 0.5 0.5
<0.1 0.5 0.4
0.55
0.6
Snow Suspension
0.2 6 0.35 0-7 1.0
004 0.03 0.07
<0.01
<0.01
Total
3.6 3.15 9.2 7.6 0.34 0.53 0.57 0.11
0.41
Soil
150 140 210 250 160
3 Spread of the Radioactive Products in the Atmosphere and Contamination of the Ground Due to Their Deposition
On the basis of the total beta-activity values measured for the products contained in the facility, total activity was calculated to be 500 Ci [1]. The activities of 103Ru, 106Ru, 95Zr and 95Nb are not indicated. With the calibration substance used when measuring the beta-activity of the samples assumed to be 90Sr + 90Y (this substance was usually applied at the combine), the activity of the isotopes above can be derived from ratio between their activity and the total beta-activity of the snow samples. The latter was measured using a gamma spectrometer and the RUB-01P beta-system calibrated to 90Sr + 90Y.
On April 12, 1993, snow samples were taken by ZapSibgidromet experts along the measuring routes Ml through M4 as well as at the village of Georgievka. As already mentioned above, determination of the total beta-activity and gamma spectrometry of the samples were performed both at the regional ZapSibgidromet laboratory, Novosibirsk and at SPA "Typhoon" in Obninsk. The ratios between the activities of the individual isotopes and the total beta-activity of the snow samples R/0 as well as the calculated activities Q0 of the individual isotopes in the facility exploded during the accident are given below:
Isotope I03Ru 105Ru 95Zr 95Nb £
R/0 0.069 2.3 1.3 3.0
Q0Ci 35 1150 650 1500 3300
Risø-R-750(EN) 13

Hence, 3000 - 3500 Ci were contained in the facility prior to the explosion. Assuming that at least one third of the products contained in the facility was released, a release rate of Q ~ 103 Ci is obtained. As mentioned in the introduction, the roof of building 201 had been partly destroyed by the explosion. On the weather side, explosion had torn a hole of 250 m2 in size into the wall. The explosion products were released via this hole, the broken windows, the destroyed roof and the stack of building 201 as well as via the stack of the ventilation system of 150 m in height (building 205) [1]. The individual activities released by each of these sources are not known.
In the Tomsk area and in the 100-km zone surrounding the chemical combine, radioactive contamination is controlled regularly by the measuring and meteorological stations belonging to the ZapSibgidromet radiometrical network. Twenty-three dose control stations, 13 stations controlling radioactive fallout and one station for the control of the concentration of radioactive products in the air (Kolpashevo) are located in the Tomsk region. Following the accident at the chemical combine (Tomsk-7) with the release of radioactive products into the atmosphere, all stations of the ZapSibgidromet radiometrical network in the Tomsk region and in the adjacent areas of Novosibirsk and Kemerovo as well as the measuring stations of the Krasnoyarsk region were ordered in accordance with the valid regulations to carry out measurements of the gamma background until April 11, 1993. From April 6 to April 8, 1993, these measurements were carried out every hour. As of April 9, 1993, they took place every three hours. The gamma exposure rate measured by the measuring stations in the Tomsk region including the control stations in the 100-km zone surrounding the chemical combine was found to vary between 6 and 15 /*R/h on these days. The gamma exposure rates measured in the Tomsk area before and after the accident are presented in table 3.1. It is evident from the data below that gamma background in the 100-km zone did not change after the accident of April 6, 1993. The measuring stations located in the Novosibirsk and Kemerovo areas also did not record any changes of gamma background after April 6, 1993. The mean gamma exposure rates determined by the measuring stations of the radiometrical network from April 6 to April 11, 1993 varied between 7 and 13 /iR/h and 9 and 17 /*R/h in the Novosibirsk and the Kemerovo area, respectively.
The mean values determined by the measuring stations of the Krasnoyarskgi-dromet from April 6 to April 11, 1993 are presented in table 3.2. For comparison, the mean gamma exposure rates of March 1993 are indicated as well. It can be noticed that the gamma background values measured by the radiometrical measuring stations in the regions adjacent to the Tomsk area did not change after the accident.
The trajectories of air transport calculated for a period of 67 hours following the explosion are represented in Fig. 6.1 for three different altitudes. They indicate that transport took place towards the northern and northeastern direction on the first three days after the accident. However, an increase in the gamma background had not been recorded by any of the Rosgidromet radiometrical network stations located in the direction of these trajectories.
The most sensitive method for controlling the radioactive products released into the air during an accident is the sampling of the atmospheric fallout and aerosols. Radioactivity is measured daily by the stations belonging to the radiometrical network. According to the data transmitted to "Typhoon" by the stations determining the total beta-activity of the samples, a slight increase in the radioactivity concentration of the air and the precipitations was recorded by the Turukhansk station from April 8 to 10 only. On these days, atmospheric precipitation amounted to three times the mean value of the month of March. Concentration of radioactive aerosols was increased by a factor of 1.5 - 2. This, however, was still within the
14 Risø-R-750(EN)

Table S.l. Gamma exposure rates measured in the Tomsk region before and during the first days after the accident at the chemical combine, nR/h.
Control station
Molchanovo
Kozhevnikovo
Permomaiskoe
Krasnyi Yar
Baturino
Bolotnoe Tomsk
aeronau. station Tomsk
hydromet. station
Belyi Yar
Distance of Azi- Mean radiation muth value
source, km deg. 1992
140 325 12
65 250 15
100 45 9
70 335 7
130 5 11
105 205 10
30 120 14
20 220 9
205 0 12
April 1993
1-5 6 7 8 9 10 11
12-13 13 14 15 11 14 11
15 15 15 15 14 15 15
9-10 9 10 9 9 10 11
6-7 8 9 6 6 7 7
7-12 11 12 10 12 13 14
10 11 11 10 12 11 10
13-14 13 13 12 11 12 10
8-9 9 10 11 12 12 10
12-13 9 9 10 11 11
limits of fluctuation of the radioactive background. These increases were of no significance, as precipitations and concentrations of the same amounts had also been observed on some days in March. No radioactivity changes were recorded at the Norilsk station located north of Turukhansk. This means that radioactive contamination had a purely local character. The data measured until April 30,1993 allow the conclusion to be drawn that no radioactive products were entrained beyond the national borders.
Environmental monitoring after the accident was not only accomplished by the measuring stations, but also by the ZapSibgidromet experts who investigated the area directly near the site of the accident [2]. On April 7, measurements were carried out in the villages of Georgievka and Naumovka with a view to determine the end of the radioactive trace and the extent of contamination. On the next days, measurements were performed along nine footpaths in transverse direction to the trace and along it as well as along the fence surrounding the premises of the chemical combine. Between km 20 and km 31 of the road from Tomsk to Samus, the gamma background was measured on the untouched snow at a distance of 10 to 50 m from the road. The following gamma exposure rates were recorded:
Road section Gamma exposure rate, /iR/h
Km 20-28 12-30 Km 28-28.6 30-510 Km 28.6-28.9 510-180 Km 28.9-29.6 180-200 Km 29.6-31.1 200-20
Risø-R-750(EN) 15
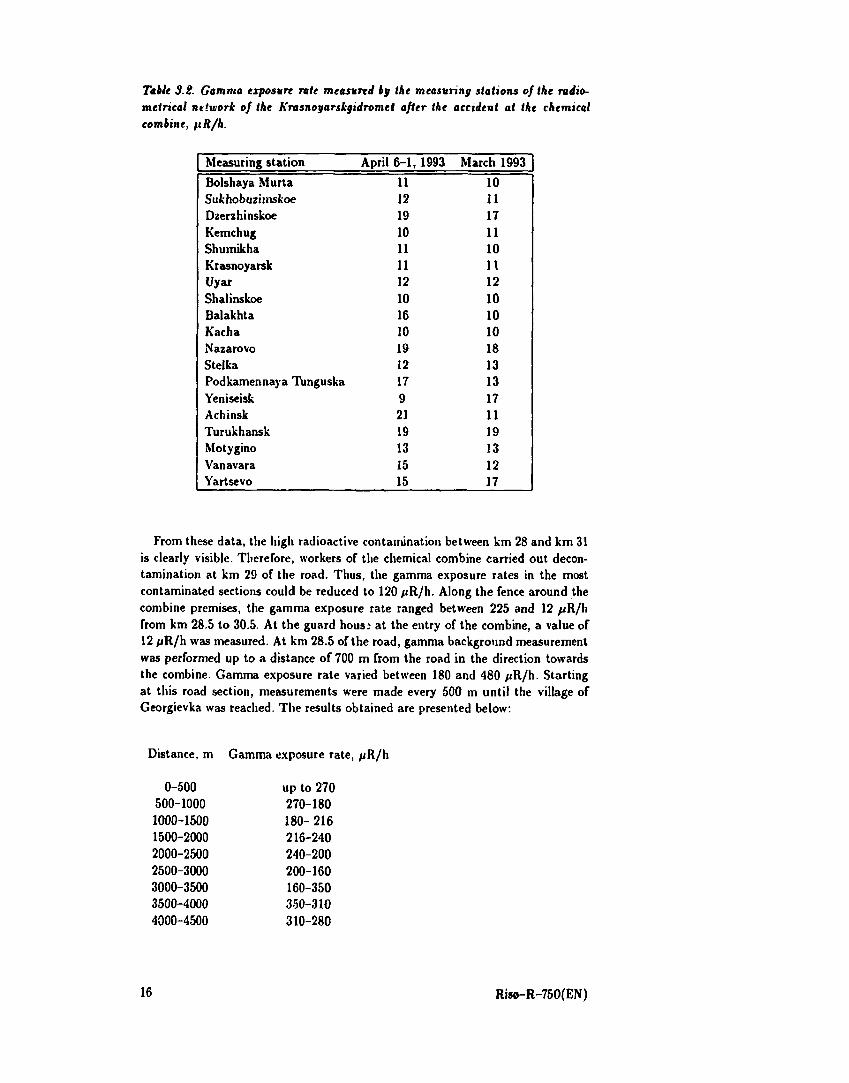
Table 3.2. Gamma exposure rate measured bu the measuring stations of the radio-metrical network of the Krasnoyarskgidromet after the accident at the chemical combine, fiR/h.
Measuring station
Bolshaya Murta Sukhobuzimskoe Dzerzhinskoe Kemchug Shumikha Krasnoyarsk Uyar Shalinskoe Balakhta Kacha Nazarovo Stelka Podkamennaya Tunguska Yeniseisk Achinsk Turukhansk Motygino Vanavara Yartsevo
April 6-1, 1993
11 12 19 10 11 11 12 10 16 10 19 12 17 9 21 19 13 15 15
March 1993
10 11 17 11 10
n 12 10 10 10 18 13 13 17 11 19 13 12 17
From these data, the high radioactive contamination between km 28 and km 31 is clearly visible. Therefore, workers of the chemical combine carried out decontamination at km 29 of the road. Thus, the gamma exposure rates in the most contaminated sections could be reduced to 120 ^R/h. Along the fence around the combine premises, the gamma exposure rate ranged between 225 and 12 ftR/h from km 28.5 to 30.5. At the guard hous; at the entry of the combine, a value of 12 jiR/h was measured. At km 28.5 of the road, gamma background measurement was performed up to a distance of 700 m from the road in the direction towards the combine. Gamma exposure rate varied between 180 and 480 fiR/h. Starting at this road section, measurements were made every 500 m until the village of Georgievka was reached. The results obtained are presented below:
Distance, m Gamma exposure rate, /iR/h
0-500 500-1000 1000-1500 1500-2000 2000-2500 2500-3000 3000-3500 3500-4000 4000-4500
up to 270 270-180 180- 216 216-240 240-200 200-160 160-350 350-310 310-280
16 Risø-R-750(EN)
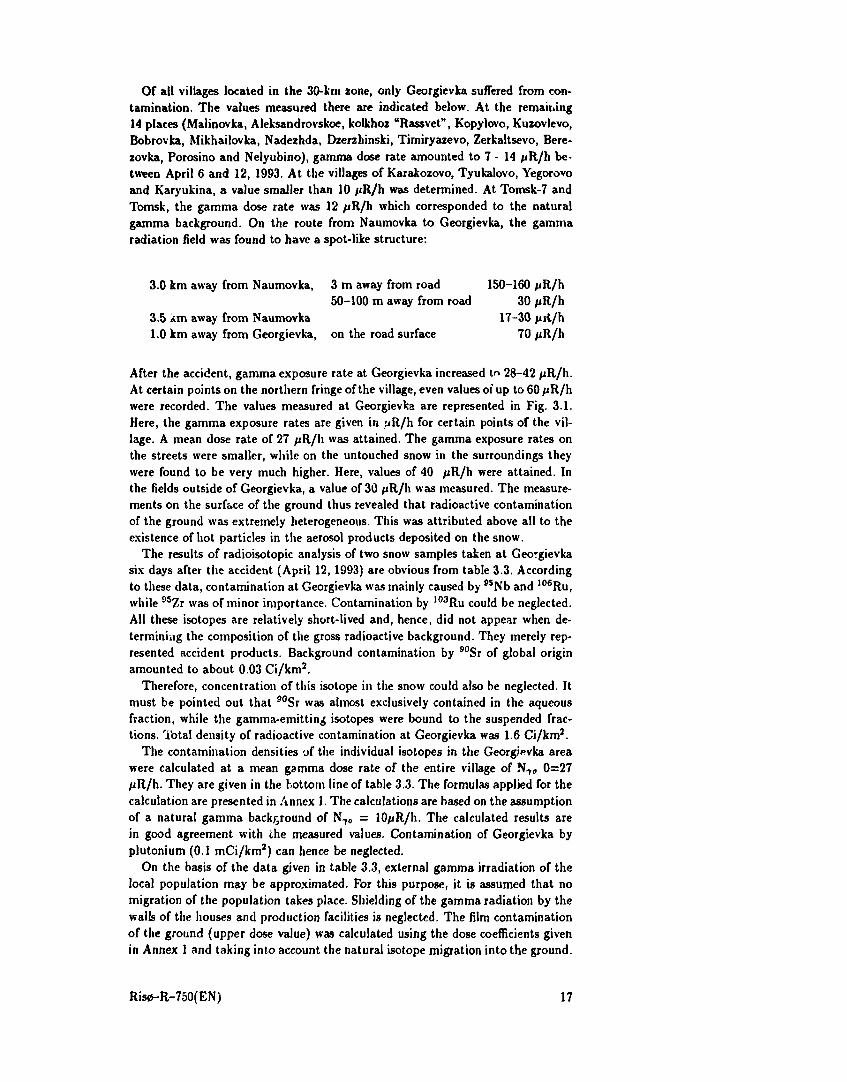
Of all viltages located in the 30-km zone, only Georgievka suffered from contamination. The values measured there are indicated below. At the remaining 14 places (Malinovka, Aleksandrovskoe, kolkhoz "Rassvet", Kopylovo, Kuzovlevo, Bobrovka, Mikhailovka, Nadezhda, Dzerzhinski, Timiryazevo, Zerkaltsevo, Bere-zovka, Porosino and Nelyubino), gamma dose rate amounted to 7 - 14 /iR/h between April 6 and 12, 1993. At the villages of Karakozovo, Tyukalovo, Yegorovo and Karyukina, a value smaller than 10 /iR/h was determined. At Tomsk-7 and Tomsk, the gamma dose rate was 12 /iR/h which corresponded to the natural gamma background. On the route from Naumovka to Georgievka, the gamma radiation field was found to have a spot-like structure:
3.0 km away from Naumovka, 3 m away from road 150-160 pR/h 50-100 m away from road 30 /iR/h
3.5 km away from Naumovka 17-30 /*it/h 1.0 km away from Georgievka, on the road surface 70 uR/h
After the accident, gamma exposure rate at Georgievka increased tr> 28-42 /iR/h. At certain points on the northern fringe of the village, even values of up to 60 /iR/h were recorded. The values measured at Georgievka are represented in Fig. 3.1. Here, the gamma exposure rates are given in f»R/h for certain points of the village. A mean dose rate of 27 /iR/h was attained. The gamma exposure rates on the streets were smaller, while on the untouched snow in the surroundings they were found to be very much higher. Here, values of 40 /iR/h were attained. In the fields outside of Georgievka, a value of 30 /iR/h was measured. The measurements on the surface of the ground thus revealed that radioactive contamination of the ground was extremely heterogeneous. This was attributed above all to the existence of hot particles in the aerosol products deposited on the snow.
The results of radioisotopic analysis of two snow samples taken at Georgievka six days after the accident (April 12, 1993) are obvious from table 3.3. According to these data, contamination at Georgievka was mainly caused by 95Nb and 106Ru, while 95Zr was of minor importance. Contamination by 103Ru could be neglected. AH these isotopes are relatively short-lived and, hence, did not appear when determining the composition of the gross radioactive background. They merely represented accident products. Background contamination by 90Sr of global origin amounted to about 0.03 Ci/km2.
Therefore, concentration of this isotope in the snow could also be neglected. It must be pointed out that 90Sr was almost exclusively contained in the aqueous fraction, while the gamma-emitting isotopes were bound to the suspended fractions. Total density of radioactive contamination at Georgievka was 1.6 Ci/km2.
The contamination densities of the individual isotopes in the Georgievka area were calculated at a mean gamma dose rate of the entire village of N7„ 0=27 /iR/h. They are given in the bottom line of table 3.3. The formulas applied for the calculation are presented in Annex 1. The calculations are based on the assumption of a natural gamma background of N7« = 10/iR/h. The calculated results are in good agreement with the measured values. Contamination of Georgievka by plutonium (0.1 mCi/km2) can hence be neglected.
On the basis of the data given in table 3.3, external gamma irradiation of the local population may be approximated. For this purpose, it is assumed that no migration of the population takes place. Shielding of the gamma radiation by the walls of the houses and production facilities is neglected. The film contamination of the ground (upper dose value) was calculated using the dose coefficients given in Annex 1 and taking into account the natural isotope migration into the ground.
Ris«t-R-750(EN) 17

<«) SPA "Typhoon", Xcsgidromet, Obninsk
Figure 3.1. Gamma dose rates at Georgievka on April IS, 1993, fiR/h.
Table 3.3. Density of snow contamination by individual radionuclides at Georgievka on April 12, 1993, Ci/km7.
Sampling point
House No. 6 front yard
Fringe of the village field path Mean values calculated according to Eqs. (7) & (12) Annex
Analyzed fraction of 103Ru 106Ru 95Zr 95Nb 90Sr 239Pu £ 7
the sample
auspension 0.023 0.566 0.432 0.919 0.0000 0.12xl0"3
water 0.000 0.100 0.046 0.107 0.0006 total 0.023 0.666 0.478 1.030 0.0006 0.12xl0"3
suspension 0.019 0.403 0.224 0.358 water 0.000 0.032 O.013 0.027 total 0.019 0.435 0.237 0.385
total 0.021 0.55 0.36 0.71 0.0006 0.12 x lO - 3 1.6 total 0.024 0.54 0.37 0.80 0.13xl0 - 3 1.7
18 Risø-R-750(EN)

The calculations are obvious from table 3.4 (6]. Reduction of the radiation dose due to the penetration of the isotopes into the soil when digging the gardens and ploughing the fields was not taken into consideration.
Table 8.4. External gamma irradiation of the Georgievka population by the radioactive products released during the accident and the natural gamma background over the period indicated, J0~3 rem.
Time, years
1 2 3
Ru-103
0.15-0.16 0.15-0.16 0.15-0.16
Ru-106
6.6-8.3 8.6-13 10-17
Zr-95+ Nb-95 12-14 12-14 12-14
Total
19-32 21-27
Nat. gamma background
70 140
3500
It is evident from the data above that external gamma irradiation of the population is less than 1% of the irradiation resulting from the natural gamma background even when staying permanently (for a period of 50 years) at Georgievka. The calculations were based on the assumptions of N7<> = 10 /iR/'.i and 1R = 0.8 rem (cSv)=0.87 rad (cGy) for air. External irradiation with 103Ru, 95Zr and 95Nb becomes obvious within a period of one year after the accident. Irradiation with the longer-lived 106Ru is steadily increasing. The shares of gamma irradiation of ,06Ru and 95Zr + 95Nb in the external irradiation are nearly the same, the contribution of ,03Ru can be neglected. It may therefore be concluded that external gamma irradiation does not represent any danger to the Georgievka population.
4 Prognosis of Contamination Resulting from Secondary Wind Transport
Judging from the geographical data of the contaminated area, about 10% of the territory is under agricultural use. This territory may be a source of air contamination, when the radionuclides deposited on the fields are transported by the wind. The greatest risk to the population consists in the intake of Pu-239 by inhalation. It therefore seems to be reasonable to estimate air contamination in the area under agricultural use. Air contamination may result from wind or mechanical transport of the deposited radionuclides. Mechanical transport takes place when the soil is cultivated using agricultural equipment or when traffic is passing. Now, air contamination resulting from wind erosion and mechanical impacts shall be estimated. According to the data obtained in the Chernobyl area [7], the intensity of wind transport of recently deposited radionuclides amounts to 10~9 m - 1 . Assuming that the area under agricultural use is ~ 10 km2 with the height of the layer near to the ground surface being 50 zm and the contamination density by gamma and beta emitters ~ 5 Ci/km2 (Georgievka), a maximum concentration of these emitters in the air near the ground surface of 5 x 10"16 Ci/1 is obtained. This value is smaller than the corresponding dose coefficients DKB of these radionuclides by four to five orders of magnitude. In our case, air contamination by Pu-239 was 6 x 10-20 Ci/1 (DKB = 3x 10"n Ci/1). This value was calculated at a contamination density of 8 x 10"4 Ci/km2. It allowed the conclusion to be drawn that contamination of the air due to wind transport of the radionuclide:: was insignificant and did not represent any danger to the population. Mechanical impacts may considerably intensify the wind transport of the radionuclides. The
Risø-R-750(EN) 19

maximum values measured for the intensity of wind transport of Pu-239 are 10 -<
s - 1 and 10"s s~l for passing traffic and ploughing of the fields, respectively [8]. Let us now assume that maximum air contamination is caused by public and
agricultural traffic passing in transverse direction to the wind. Thus, a stationary active source is generated, the intensity of which may be estimated as follows:
Q = I rap,
where
/ = traffic density, s - 1 ; r = minimum time interval between the individual clouds
generated by the traffic; it is calculated using the continuity condition of a jet;
a = intensity of wind transport of the radionuclides, s"1; p, = ground contamination density, Ci/km2.
The time r was calculated using the following equation:
ln(6u.r/e*o) = KOXX
where
b
u. *0
K
e t*xx
' • w
= = = = =
0.3 is the universal constant in the similarity theory of the Lagrangean turbulence characteristics; dynamic velocity, m/s; roughness parameter, m; von Kårman constant; base of natural logarithm; proportionality factor in the expression for the axial scattering parameter of the impurity.
In the calculations, a value of r ~ 9s was obtained at u, = 0.2 and z0 = 0.1 m. With the traffic density being 10 vehicles per hour and the width of the road 10 m, efficiency of the linear source amounts to
Q = 2x 10" I 3Ci/mxs.
At a distance of 100 m from the road, Pu-239 concentration then is 2 xlO - 1 8
Ci//. For comparison with DKQ, this value must be converted into the mean annual concentration. For this purpose, it is now assumed that the dry season, during which the risk of wind transport exists, lasts three months and that traffic is continuous over a period of eight hours a day. Then, a mean annual concentration of 1.5 xlO"19 Ci// (DKB = 3 x 10" n Ci//) is obtained.
As far as the mean effective equivalent dose was concerned, a value of 0.3 rem was calculated for a period of 50 years. Hence, it did not represent any danger to the population. Estimation of the influence of mechanical cultivation of the soil on the wind transport yields concentration values that are smaller than the above values by two orders of magnitude.
On the basis of the investigations performed, it must be noted that wind transport of the radionuclides does not lead to a dangerous radiation exposure of the population.
20 Risø-R-750(EN)

5 Prognosis of Water Contamination
5.1 Estimated Radionuclide Concentration of the Samuska River
Following the accident at the chemical combine, also part of the catchment of Samuska river, a subsidiary stream of the Tom river, was exposed to the »adioac-tive fallout. The area covered by the trace was about 100 km3. According to the analyses carried out by the experts of SPA "Typhoon", the gamma dose was mainly caused by Ru-103, Ru-106, Zr-95 and Nb-95. As far as the alpha emitters were concerned, Pu-239 was of major importance. Total activity outside of the controlled area of the combine was estimated to range from 300 to 500 Ci. A significant part of the fallout was found to occur in the controlled area. According to the estimations, the total activity released amounted to about 800 to 1000 Ci. For the calculations, a value of 1000 Ci can be used. Then, the activities of the individual radionuclides are as follows:
Ru-103 - 10 Ci Ru-106 - 300 Ci Zr-95 - 210 Ci Nb-95 - 470 Ci Pu-239 - 0.1-0.2 Ci
(Pu-239 fallout was estimated on the basis of the equation:
[Pu-239]/[Zr-9o] = 10"3 - 3.5 x lO"4).
5.2 Contamination of the flood in spring
The fallout mainly deposited on the snow. Therefore, considerable washout of the radionuclides was expected to take place in the Samuska and Tom rivers when the snow would be melting. The parameters of the flood in spring, which were predicted by the ZapSibgidromet experts, are obvious from table 5.1.
Risø-R-750(EN) 21
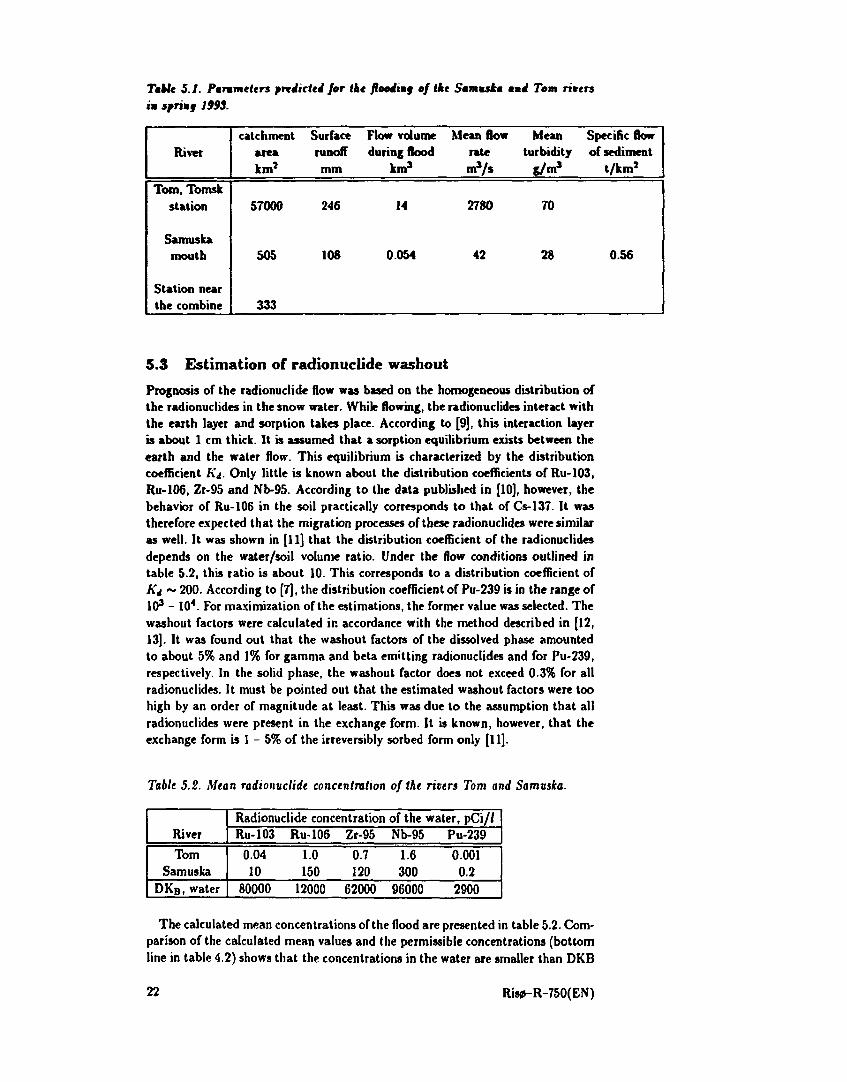
TMe S.I. Parameters prxdicttd for the flooding of the Smmnskm mni Tom rivers in spring 1993.
River
Tom, Tomsk station
Samuska mouth
Station near the combine
catchment area km2
57000
505
333
Surface runofT mm
246
108
Flow volume during flood
km3
14
0.054
Mean flow rate m3/s
2780
42
Mean turbidity
g/«n3
70
28
Specific flow of sediment
t/km2
0.56
5.3 Estimation of radionuclide washout
Prognosis of the radionuclide flow was based on the homogeneous distribution of the radionuclides in the snow water. While flowing, the radionuclides interact with the earth layer and sorption takes place. According to [9], this interaction layer is about 1 cm thick. It is assumed that a sorption equilibrium exists between the earth and the water flow. This equilibrium is characterized by the distribution coefficient AY Only little is known about the distribution coefficients of Ru-103, Ru-106, Zr-95 and Nb-95. According to the data published in [10], however, the behavior of Ru-106 in the soil practically corresponds to that of Cs-137. It was therefore expected that the migration processes of these radionuclides were similar as well. It was shown in [11] that the distribution coefficient of the radionuclides depends on the water/soil volume ratio. Under the flow conditions outlined in table 5.2, this ratio is about 10. This corresponds to a distribution coefficient of I<d ~ 200. According to [7], the distribution coefficient of Pu-239 is in the range of 103 - 104. For maximization of the estimations, the former value was selected. The washout factors were calculated in accordance with the method described in [12, 13]. It was found out that the washout factors of the dissolved phase amounted to about 5% and 1% for gamma and beta emitting radionuclides and for Pu-239, respectively. In the solid phase, the washout factor does not exceed 0-3% for all radionuclides. It must be pointed out that the estimated washout factors were too high by an order of magnitude at least. This was due to the assumption that all radionuclides were present in the exchange form. It is known, however, that the exchange form is 1 - 5% of the irreversibly sorbed form only [11].
Table 5.2. Mean radionucliit concentration of the rivers Tom and Samuska.
River
Tom Samuska
DKB, water
Radionuclide concentration of the water, pCi// Ru-103 Ru-106 Zr-95 Nb-95 Pu-239
0.04 1.0 0.7 1.6 0.001 10 150 120 300 0.2
80000 12000 62000 96000 2900
The calculated mean concentrations of the flood are presented in table 5.2. Comparison of the calculated mean values and the permissible concentrations (bottom line in table 4.2) shows that the concentrations in the water are smaller than DKB
22 Risø-R-750(EN)

by a factor of I0 : - 10* even under the most unfavorable washout conditions. It must be taken into consideration that the limit value DKB was calculated for the annual standardized water consumption with the internal irradiation being 5 x 10⁻³ Sv.
6 Supply of Information for the Estimation of Radiation Exposure in the Area of the Siberian Chemical Combine
Supply of information for the analysis of radiation exposure in the area affected by the accident depended on the data available and could be divided into two stages:
A. Analysis of the situation, estimation of the release parameters and determination of preliminary data on the possibly contaminated area and the radiation exposure, estimation of a possible transport beyond the national borders. In this stage, data measured at ground level were not yet available. Therefore, numerous calculations were carried out on the basis of a physko-mathematical simulation of radioactivity spread in the environment using preliminary findings about the source.
B. Systematization of the data with the aim of setting up a diagram of radioactive contamination of the environment soon after the accident as a function of time and space-It is the objective of this stage to estimate the statistical reliability of all values measured when investigating the contaminated area and to make use of these data when determining (more precisely) the radionuclide composition of the emissions and their quantitative ratio. Furthermore, a map of contamination in this area shall be prepared (gamma dose rate at ground level, contamination densities of all radionuclides identified in the samples).
As ground measurements were carried out outside of the premises of the chemical combine only, calculations were performed for the entire contaminated area including the combine site. Radioactivity spread in the area as a function of space and time then allowed to estimate the possible individual doses when passing the radioactive cloud.
6.1 Information for the taking of appropriate measures during the first hours after the accident
On April 6, 1993 at about 17.00 local time, SPA "Typhoon" was informed by Rosgidromet about the accident at the chemical combine. For information, Ros-gidromet also transmitted the following data on the release:
• Nuclide composition: Pu-239, U-238;
• total activity released: 2 - 5 Ci;
• activity released into the environment via the destroyed walls of the buildings (height of release up to 30 m);
• duration of the release about 15 min.
On the basis of weather forecasts, possible trajectories were determined for the movement of the radioactive cloud at various heights (ground level,. 700 - 800 m and about 1500 m). They are represented in Fig. 6.1.
Riso-R-750(EN) 23

Fifmrt $.1
By simulating the atmospheric transport of Pu-239. radioactivity concentration of the cloud was found to have been decreased to insignificant values due to diffusion and deposition processes within a period of 3.5 hours after the accident. According to the simulation data, maximum Pu-239 concentration of the cloud 3.5 hours after the accident amounted to I.5E-17 Ci/I (permissible concentration 3.0E-I7 Ci/I) at a distance of 110 km from the source and a height of 1 m. Thus, transport of significant radionuclide concentrations (exceeding DKB) beyond the national borders could be excluded.
The values of ground contamination by Pu-239, which were obtained by simulating the atmospheric transport and deposition of the radioactivity, are represented in Fig. 6.3. The gamma aerial survey data obtained later confirmed that the predictions based on the simulation had been very precise.
For simulation, the "Gaussian club'* model developed by the data processing center of SPA Typhoon" according to the method described in [M] was applied. Simulation was performed for a source with a height of 30 m (building, where the accident occurred), a release duration of 15 min. and a total Pu-239 activity released of 5 Ci-
After the receipt of the message, an "express " analysis of the accident was carried out by SPA "Typhoon". The results were then processed and transmitted to Rosgidromet at 20.00 Moscow time on April 6, 1993.
The first data on the radiation exposure were received by SPA "Typhoon" on April 7 and 8, 1993- Gamma dose rates at ground level near the building affected (30 /iR/h), at km 28 of the road from Tomsk to Sanuis and at Naumovka (14 /iR/h) and Georgievka (40 - 60 «R/h) were measured by expert teams of ZapSibgidromet and Rosgidromet. On the basis of the first analyses of snow samples, radionuclide
24 Risø-R-750(EN)

composition of the release could he determined more accurately:
Nb-95 - 36%; Ru 106 - 38%; Ru-103 - 1%; Zr-95 - 23%.
The following main source parameters were determined more precisely acd recommended far simulation by the Rosgidromrt experts:
• Release height 15 - 150 m (the source was simulated by two simultaneous releases at heights of 15 - 30 m (50% of the total activity) and 150 - 200 m (50% of the total activity), respectively);
• deposition rate 0.01 - 0.19 m/s;
• duration of the release 10 - 15 mm.;
• total activity released 150 - 400 Ci.
Oft the basis of the data recommended by the Rasgtdroraet experts, contamination density of the roost important radionuclides was calculated. The map plotted for the contamination density of Nb-95 is shown in Pig. 6.4 (the source was simulated by two simultaneous releases from the building affected (release height 30 m, 50% of the total activity) and the ventilation pipe (height 200 m, 50% of the total activity), respectively, at a deposition rate of the radioactive products of 0-15 m/s and an assumed total Nb-95 activity released of 400 Ci).
Fi§mn S.t.
Risø-R-750(EN) 25

(c) 8PA 'Typhoon", Rotgidronnt. OhwiiuX
Figure 6.S.
IGEORGIEVKA ^
^ izoliae 10 Ci/km2
*Sol*rovka* •*. <a Malinovka
^Kalinino Kuskoyo , Vivrørgi**«
iKudrovo'
'PostaJkovo
"asstvét
WBM TraftggnT figdfrwn«!.gfriintfi /tyure 5.̂ -
26 Risø-R-750(EN)
84* 45' 85f 15' 56" 55'
' . / I MKP/MaC Dubrovk«
56? 30"
66* 55'
156* 30' 84* 45' 8 ? IS'
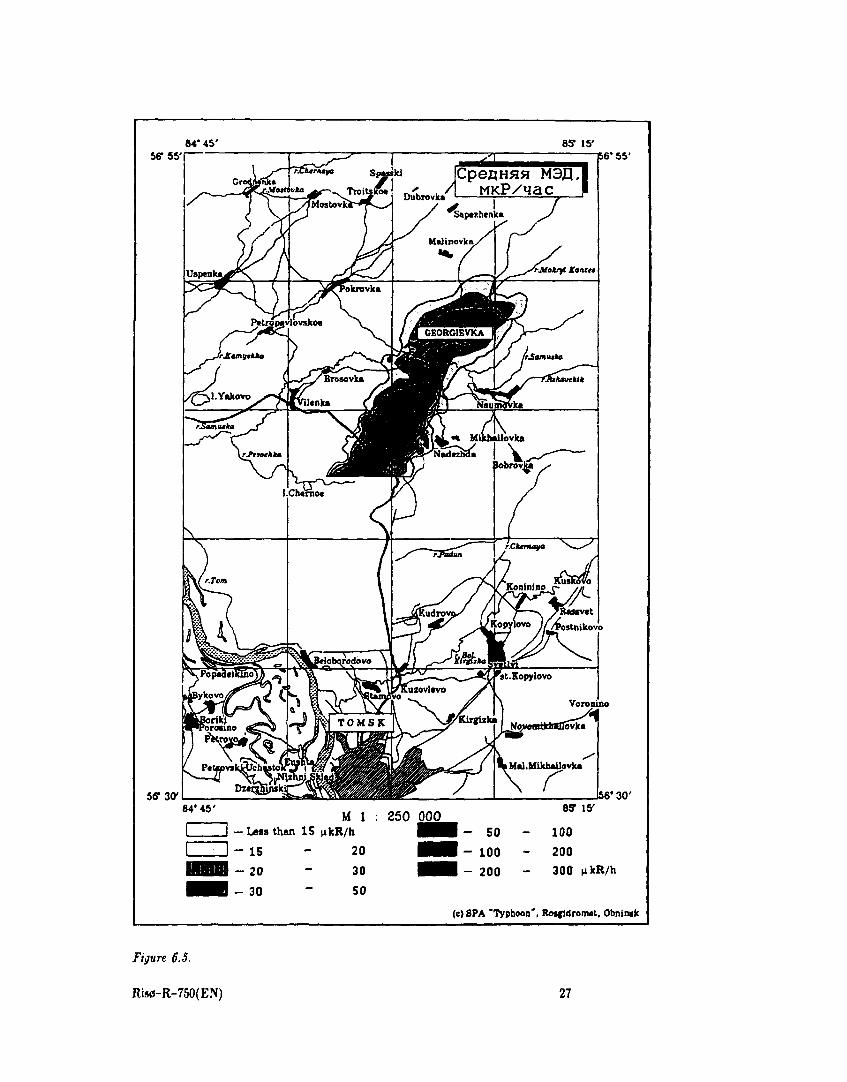
M 1 : 250 000 - Less than 15 ukR/h H H - 50 - 100 - 1 5 20 H H - 100 200 - 2 0 ~ 30 H H - 200 - 300 ukR/h - 3 0 ~ 50
(c) SPA "Typhoon", RosfidroriMt, Obniiuk
Figure 6.5.
Risø-R-750(EN) 27

84" 45' 85* 15' 56" 55'
serz<y
•66' 55'
J56* 30' 84* 45' sy \&
M 1 : 250 000
I I - Lmthan IS ukR/h H H — SO - 100
I- '•• 1 ~ IS - 20 H H - 100 - 200
- 20 30 H H - 200 300
- 30 ~ 50 H H - 300 - 500 »kR/h (c) SPA "Tgrpkeei*, RocffMnMwt, Obaink
Figure 6.6. TOMSK - Synthesized map of the distribution of the gamma exposure rate foR/h).
28 Risø-R-750(EN)
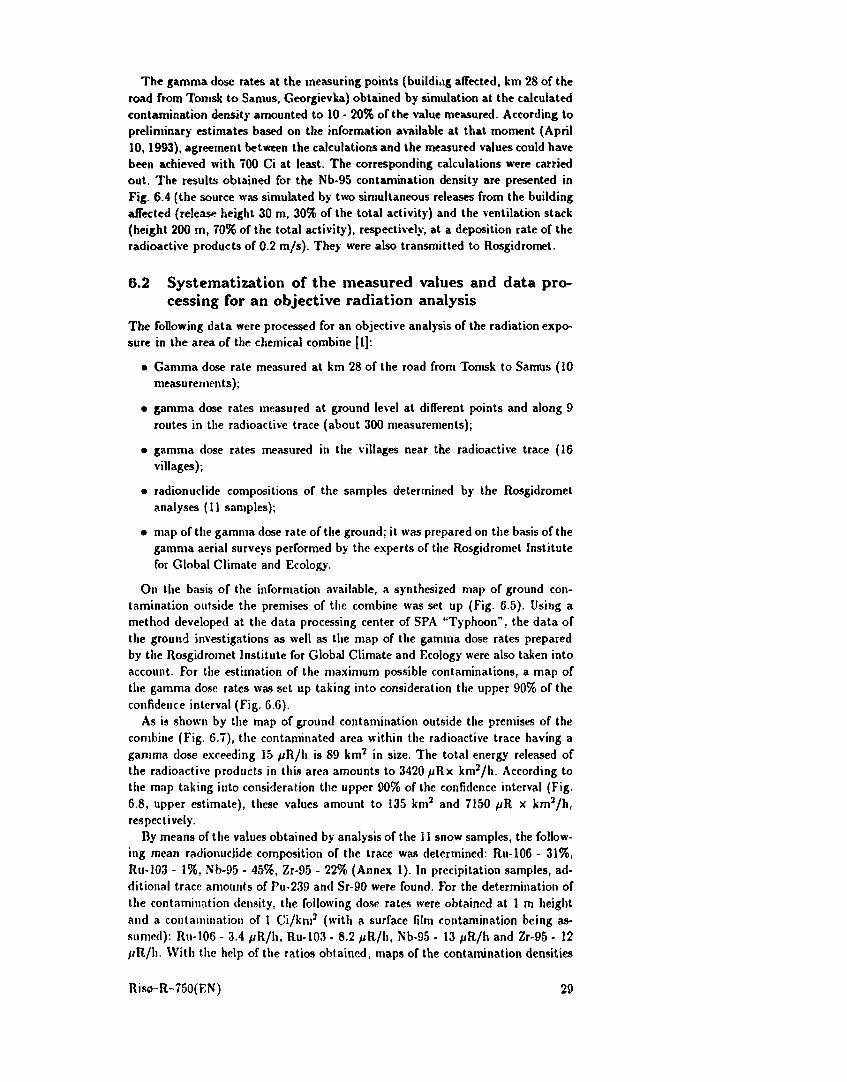
The gamma dose rates at the measuring points (building affected, km 28 of the road from Tomsk to Samus, Georgievka) obtained by simulation at the calculated contamination density amounted to 10 - 20% of the value measured. According to preliminary estimates based on the information available at that moment (April 10,1993), agreement between the calculations and the measured values could have been achieved with 700 Ci at least. The corresponding calculations were carried out. The results obtained for the Nb-95 contamination density are presented in Fig. 6.4 (the source was simulated by two simultaneous releases from the building affected (release height 30 m, 30% of the total activity) and the ventilation stack (height 200 m, 70% of the total activity), respectively, at a deposition rate of the radioactive products of 0.2 m/s). They were also transmitted to Rosgidromet.
6.2 Systematization of the measured values and data processing for an objective radiation analysis
The following data were processed for an objective analysis of the radiation exposure in the area of the chemical combine [1]:
• Gamma dose rate measured at km 28 of the road from Tomsk to Samus (10 measurements);
• gamma dose rates measured at ground level at different points and along 9 routes in the radioactive trace (about 300 measurements);
• gamma dose rates measured in the villages near the radioactive trace (16 villages);
• radionuclide compositions of the samples determined by the Rosgidromet analyses (11 samples);
• map of the gamma dose rate of the ground; it was prepared on the basis of the gamma aerial surveys performed by the experts of the Rosgidromet Institute for Global Climate and Ecology.
On the basis of the information available, a synthesized map of ground contamination outside the premises of the combine was set up (Fig. 6.5). Using a method developed at the data processing center of SPA "Typhoon", the data of the ground investigations as well as the map of the gamma dose rates prepared by the Rosgidromet Institute for Global Climate and Ecology were also taken into account. For the estimation of the maximum possible contaminations, a map of the gamma dose rates was set up taking into consideration the upper 90% of the confidence interval (Fig. 6.6).
As is shown by the map of ground contamination outside the premises of the combine (Fig. 6.7), the contaminated area within the radioactive trace having a gamma dose exceeding 15 ftR/h is 89 km2 in size. The total energy released of the radioactive products in this area amounts to 3420 /<Rx km2/h. According to the map taking into consideration the upper 90% of the confidence interval (Fig. 6.8, upper estimate), these values amount to 135 km2 and 7150 fiR x km2/h, respectively.
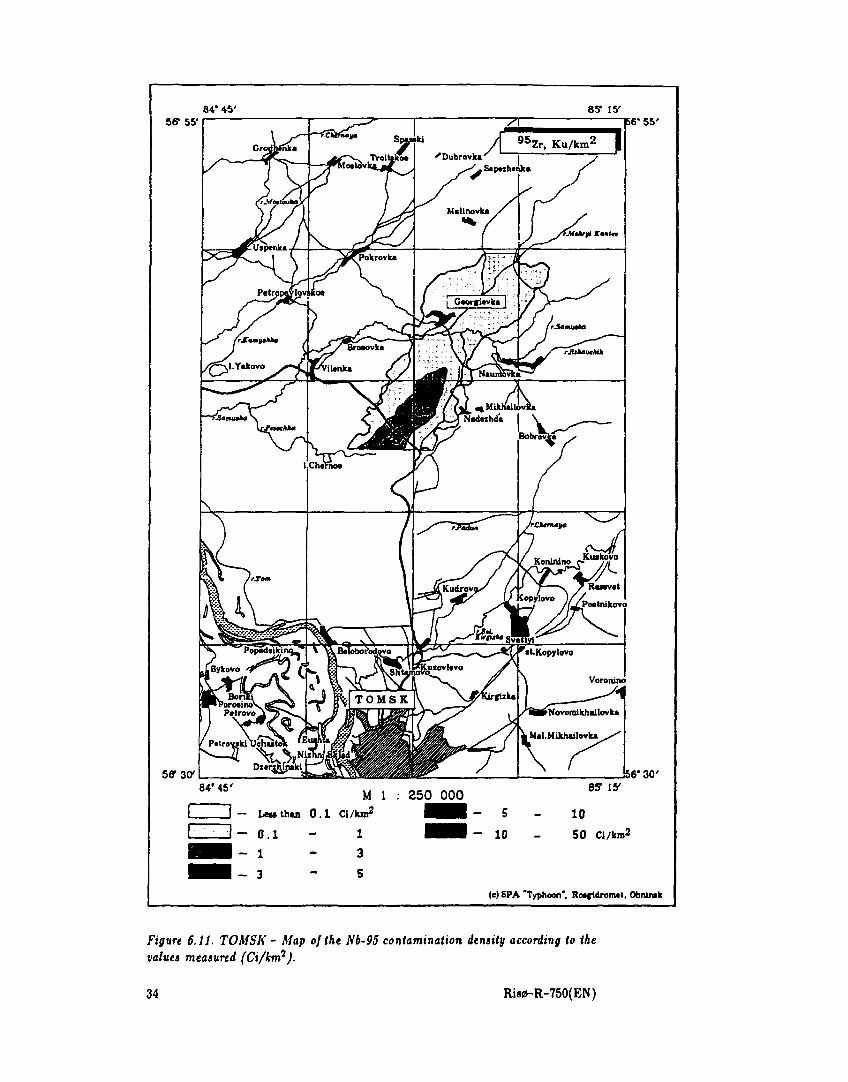
By means of the values obtained by analysis of the 11 snow samples, the following mean radionuclide composition of the trace was determined: Ru-106 - 31%, Ru-103 - 1%, N'b-95 - 45%, Zr-95 - 22% (Annex 1). In precipitation samples, additional trace amounts of Pu-239 and Sr-90 were found. For the determination of the contamination density, the following dose rates were obtained at 1 m height and a contamination of 1 Ci/knr (with a surface film contamination being assumed): Ru-106 - 3.4 /iR/h, Ru-103 - 8.2 //R/h, Nb-95 - 13 /iR/h and Zr-95 - 12 //R/h. With the help of the ratios obtained, maps of the contamination densities
Riso-R~750(EN) 29
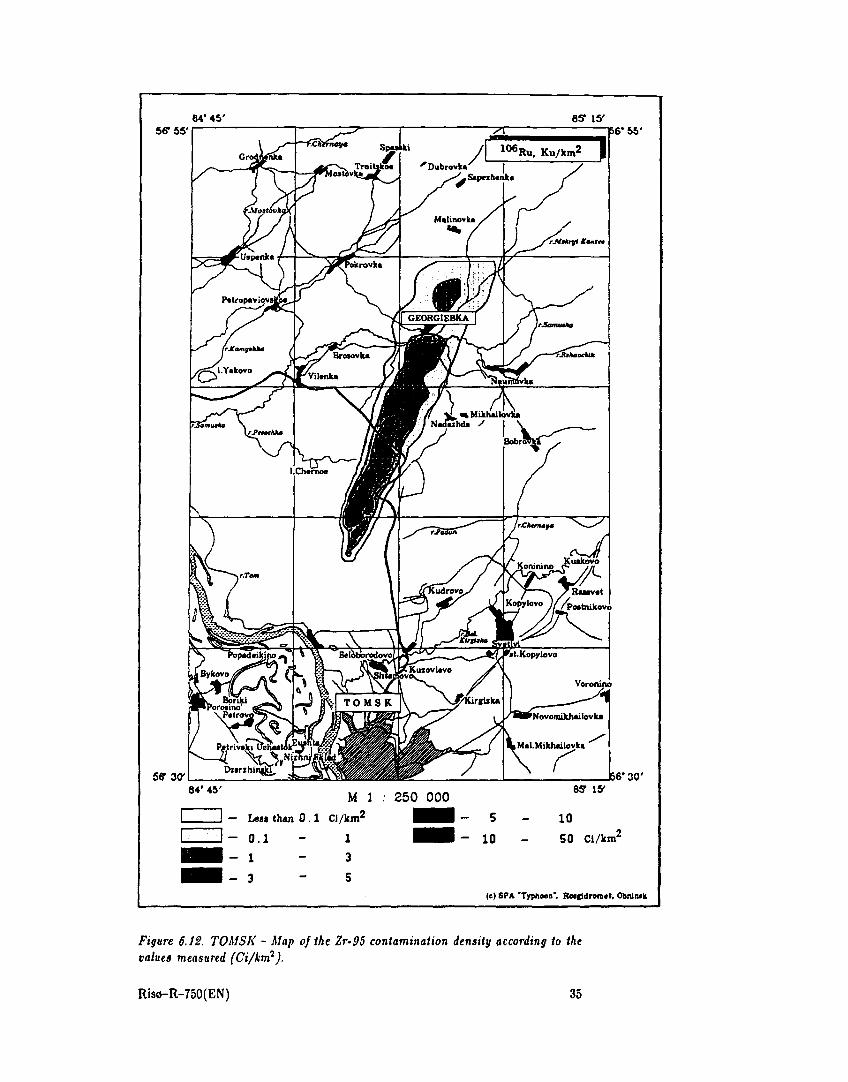
of the major radionuclides were prepared (Figs. 6.9 through 6.11). The total of the radioactive products in the area covered by the trace is 350 (730) Ci. For the individual radionuclides, the following values are obtained: Ru-106 - 105 (220) Ci, Ru-103 - 5 (10) Ci, Nb-95 - 165 (345) Ci, Zr-95 - 75 (155) Ci. The estimates taking into account 90% of the confidence interval are given in brackets. To estimate the radionuclide concentration released, a model developed by the data processing center of SPA "Typhoon" was applied for the reproduction of the source parameters. On the basis of the information processed, solution of the inverse problem led to the following estimates of the radionuclide content released: Ru-106 - 300 Ci, Ru-103 - 10 Ci, Nb-95 - 470 Ci and Zr-95 - 210 Ci. Hence, a total activity of 990 Ci was released. For the estimation of the Pu-239 content released (0.2 Ci), the Zr-95/Pu-239 activity ratio of 1000 determined by sample analysis was used.
The ground contamination densities are represented in Figs. 6.12 through 6.15 for the most important radionuclides. They were obtained by simulation taking into account the estimated radionuclide concentrations released. For these calculations, a stochastic model was applied. It was also developed by the data processing center of SPA "Typhoon". Simulation was accomplished for two sources (building afTected (height of the source up to 30 m) and ventilation stack (height of the source up to 200 m), respectively) assuming that 50% of the total activity was released by the lower source and that radioactive fallout from the cloud amounted to 0.2 m/s.
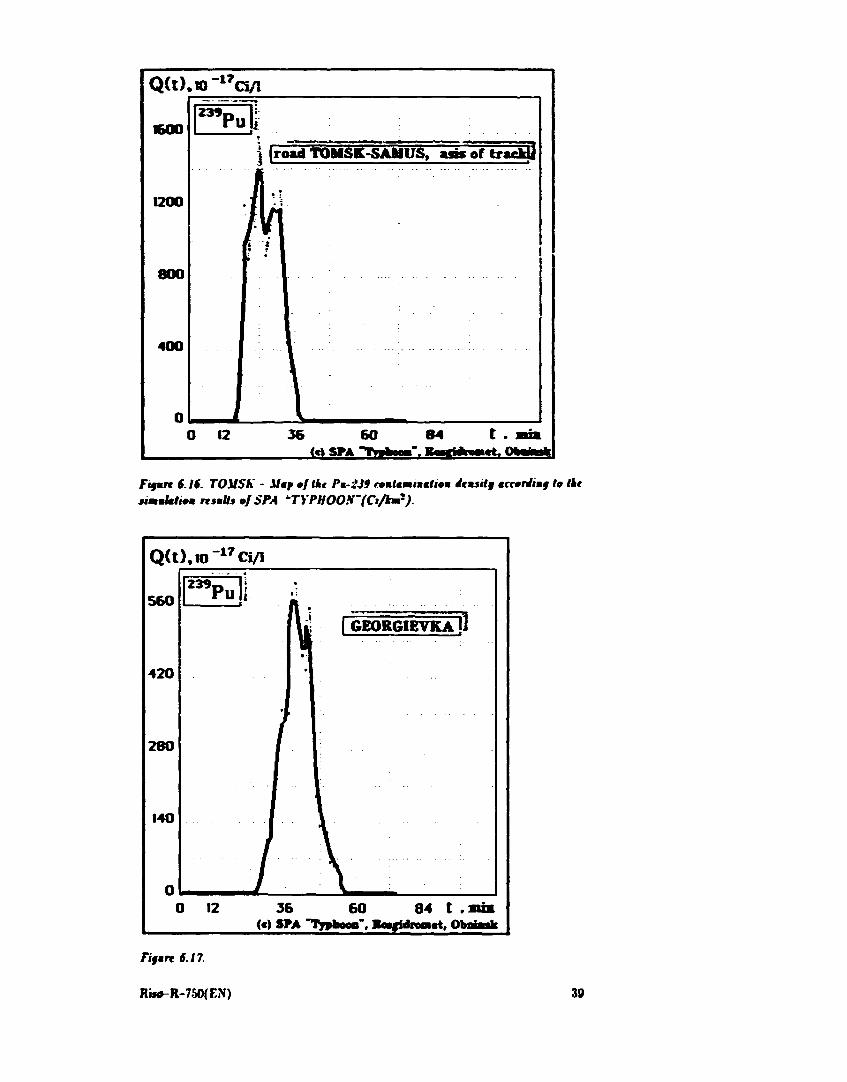
Variation of the Pu-239 concentration in the cloud at an altitude of 1 m on the road from Tomsk to Samus and in the village of Georgievka is shown in Fig. 6.16 and Fig. 6.17, respectively. The concentrations of the most important radionuclides calculated as a function of time and space by simulation allowed the individual effective dose equivalent to be estimated for the population of Georgievka when passing the radioactive cloud (Fig. 6.18). The integral dose for 1 hour is about 1 mrem. Here, the share of Pu-239 in the dose due to inhalation is 0.5 mrem. The dose values were calculated in accordance with the method described in [15].
30 Risø-R-750(EN)

~z 1 1 L__l
i**tti urn E^wl Y///A
- 10 - 15 - 20 - 30 - 50 -100 - 2 0 0
- 15 - 20 - 30 - 50 -100 - 2 0 0 -300
:y/-,;.;-.;>;f»;f.;>;>;>;>;>;>;>;>;>;*.-;-.'- . / i
liflig (c) SPA "Typhoon", Rosgidromtt, Obninak
Figure 6.7.
Figure 6.8.
Risø-R-750(EN) 31

84" 45' ay 15' 56* 55'
l 0 6Ru. Ku/km2
56* 3<y
156*55'
156*30' 84* 45'
M 1 : 250 000 - less than 0.1 Ci/kro2 i H H - 5
3 - o.i - i 1 - 1 - 3 1 - 3 - 5
(c) SPA "Typhoon", ftuffidromet, Obninik
Figure 6.9. TOMSK - Map of the gamma dost rates as determined by the aerial surveys.
32 Risø-R-750(EN)

84* 45' 85? 15' 5ff 55'
9 5 Nb, Ku/km2
Sff 3<y
156'55'
156" 30' 84' 45' M 1 : 250 000
- Less than 0 .1 Ci/km2 I H H - 5
- 0.1 • • - 10 - 1 - 3
- 3 - 5
sy \sf
10
50 Ci/km2
(e) SPA "Typhoon", Roaftdroratt. Obniiuk
Figure 6.10. TOMSK - Map ofihe Ru-106 contamination density according to the values measurtd (Ci/km7).
Riso-R-750(EN) 33
84* 45' 85" 15' 56f 55'
/ 95Zr, Ku/km2
5ff 3C
B6* 55'
56' 30' 84* 45' 85" 15'
M 1 : 250 000 - Lew than 0.1 Ci/lun2 H H - 5 - 1 0
- 0 . 1 - 1 H H - 10 50 Ci/kn.2
- 1 - 3
- 3 - 5 (e) SPA 'Typhoon*, Ro*ridrom«t, Obninik
Figure 6.11. TOMSK - Map of the Nb-95 contamination density according to the values measured (Ci/km?).
34 Risø-R-750(EN)
84* 45' 85* IS' 5ff55'
Dubrovk* | .Stpezhtnk«
56* SO
BS* 55'
66* 30' 85" IS'
50 Ci/knT
(c) SPA "Typhoon', Roaiidrore«*, Obnliuk
Figure 6.12. TOMSK - Map of the Zr~95 contamination density according to the values measured (Ci/km7).
Riso-R-750(EN) 35
84*45' es* t5' 56T55'
j \ 95NVKu/km2 I - 'D>brovk« / =
5ff 3C
B6*55'
66" 30'
84* 45' M 1 : 250 000
- Lew than 0.1 Ci/km2 I ^ H - 5
- 0.1 - I H I - 10 - 1 - 3
- 3 " 5
95 i y
10
50 Ci/km2
(e) SPA 'Tyybwa*. RMfMnaat, Obnlmk
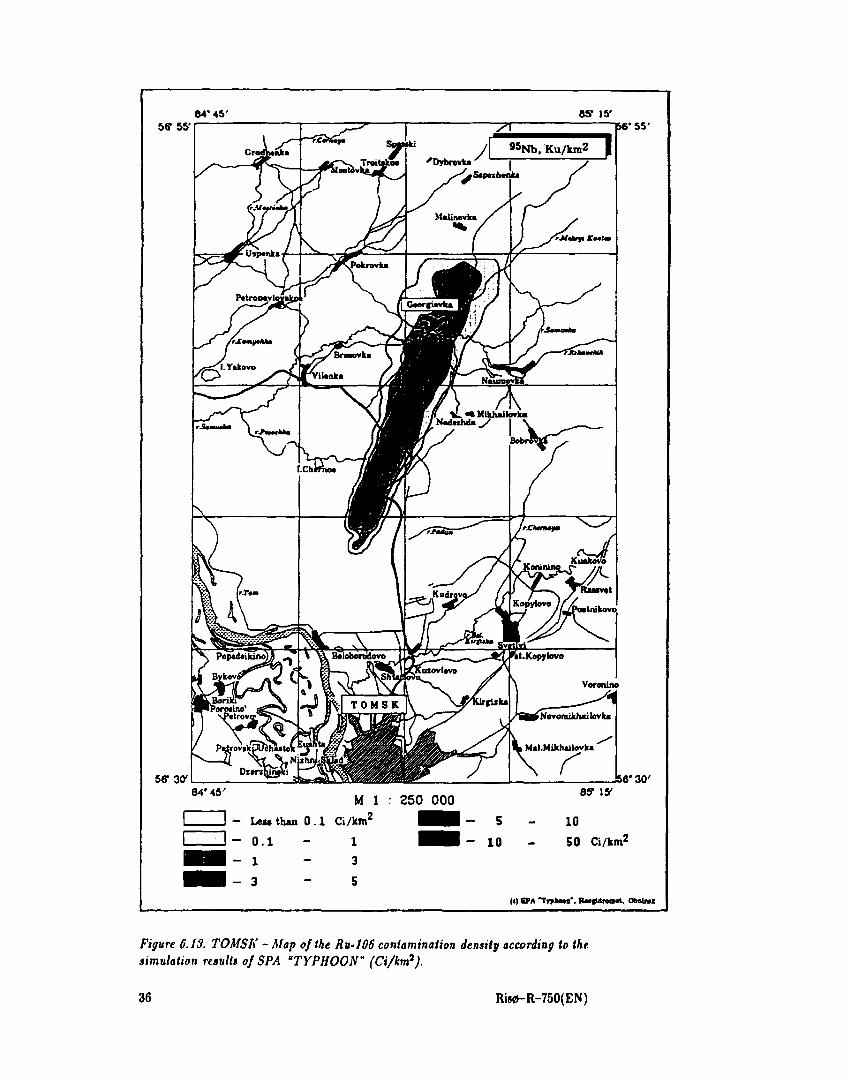
Figure 6.13. TOMSK - Map of ike Ru-106 contamination density according to the simulation results of SPA "TYPHOON" (Ci/km7).
36 Risø-R-750(EN)
84*45' ay is' 56-55' 7 T
A »Zr. K u / k m * I ' M m t a 7 j = r
5F301
B6*55'
156*30' 64*45
M 1 ; 250 000 - Less than 0.1 Ci/km2 DHH ~ 5
I I - o.i i ^ H - io M - 1 - 3 • • - 3
«ff IS'
10 SO Ci/km2
(OVA "Tyfkm", Kw(U»tMl. Otoian
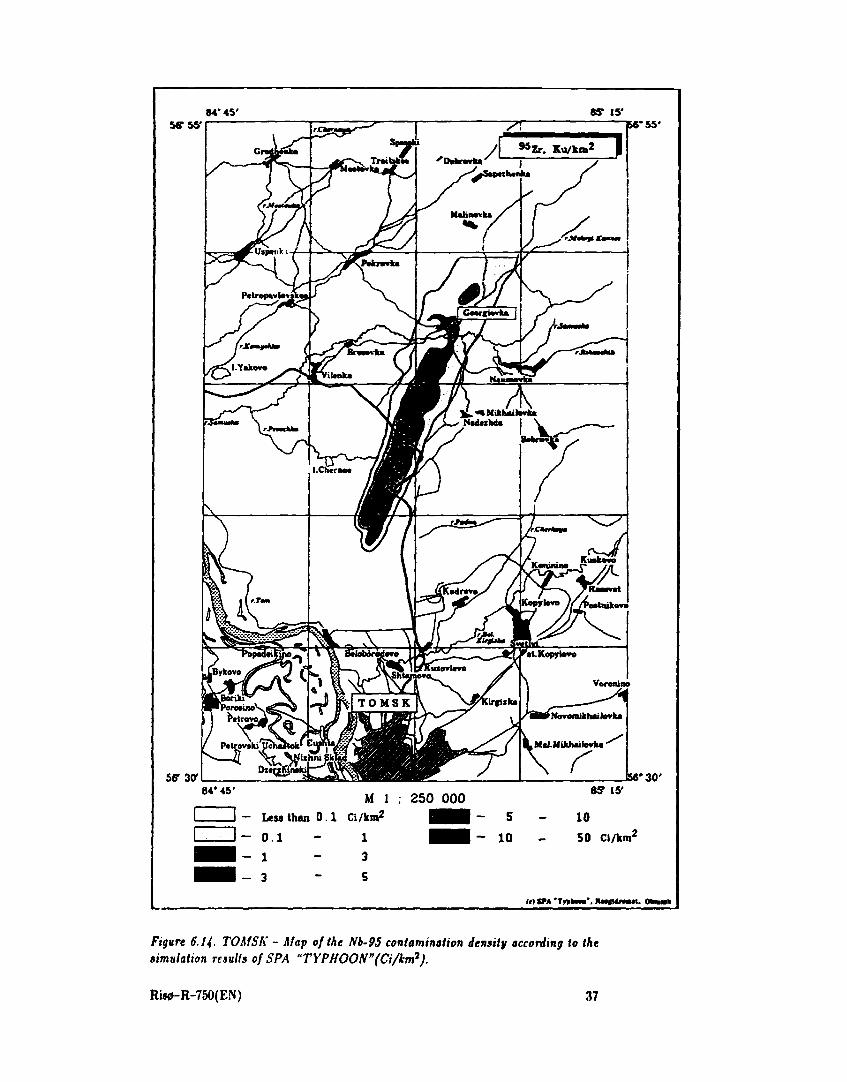
Figure 6.14- TOMSK - Map of the Nb-95 contamination density according io the simulation results of SPA "TYPHOON''(Ci/km2).
Risø-R-750(EN) 37
W45' sew
BS 1ST
59 3a
SC* SV
fee* 30' 84*46' M 1 : 250 000
- USM than 0.0001 Ci/Ju»2 B i -ooooi - oooi H i - 0.001 - 0.003 WM
- 0.003 - 0.005
0.005 - 0.01 0.01 - 0.05 0.05 - 0.1 cv*.*
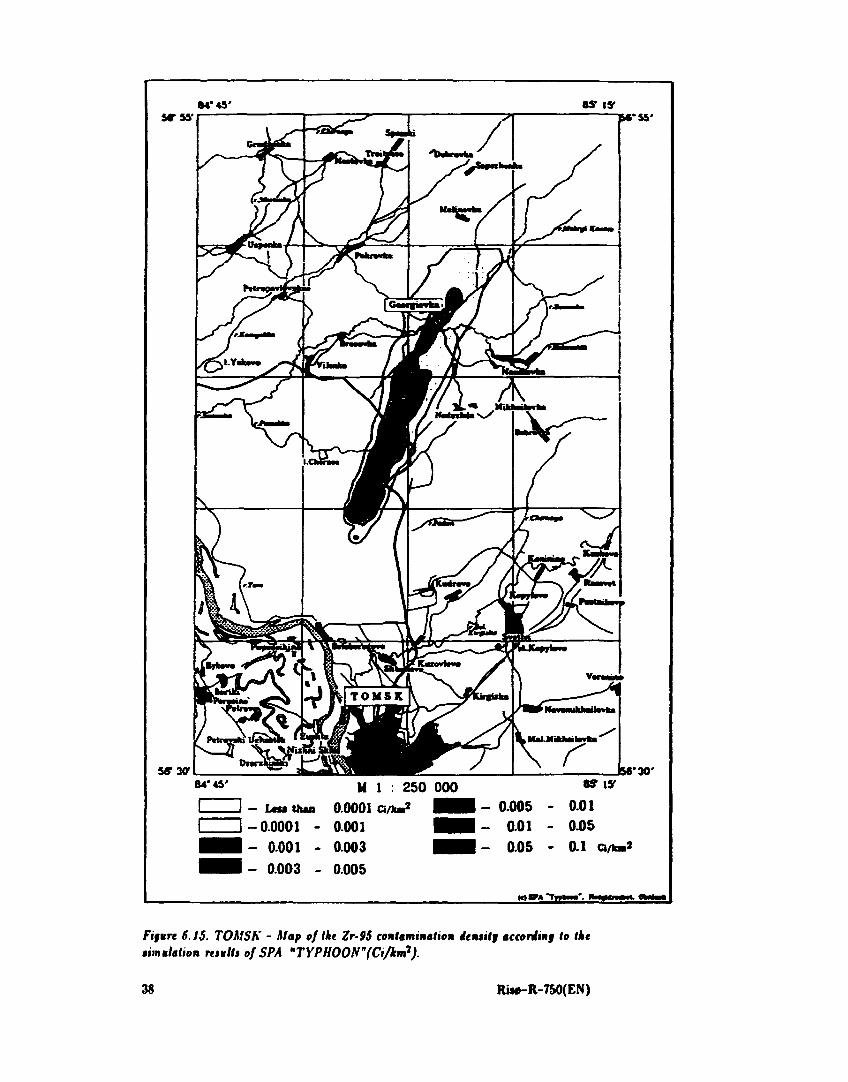
Figure 6.15. TOMSK - Map of the Zr-95 contamination iensitw according to the simulation results of SPA "TYPHOON" (Ci/km7).
38 Risø-R-750(EN)
Q(t).w-17Ci/i
1600
1200
800
400
I |ro~ad T0MS&-SAMUS, ansoftracklj
0 12 36 60 <ciS»A
84 t .
Fi§mn 6.16. TOMSK - M*p øftkt Pm-2J9 tømtmmtmmtiøm étnsilj accørJtmf to Ike ummUhø* rtsmlls øf SPA ^TYPH00S-(Ci/kmr).
Q(t) ,10" 1 7Ci/ l
Fifun 6.17.
Rw*-R-750(F,N)
S60
420
280
140
0
r ......
*"Pu «
1 - 5 GEORGIEVKAII
O 12 3 6 6 0 <«) SPA "Typhoon",
8 4 t . •t , Obnbnk
39

84* 45' 8S 15' 5ff 55'
SffW
»6* 55'
156* 30' 8 4 ' 4 5 ' M 1 : 250 000
- Less than 5 »Sv B^^M — 50 5 - 10
- 10 - 20
- 20 - 50
(c) SPA "Typhoon*. Roafidroraot. Obni/wk
Figure 6.18. TOMSK - Individual effective dose equivalent according to the simulation results of SPA "Typhoon" (Sv).
40 Risø-R-750(EN)

Concluding Remarks
1. On the basis of the work (ground investigations and gamma aerial surveys) carried out jointly by the Rosgidromet organizations and Berezovgeologiya, data on the radiation exposure in Russia were obtained shortly after the accident of April 6, 1993 already. These data were transmitted to interested institutions as well as to local and central public information authorities.
2. The measurements performed on April 11 and 12, 1993 indicated that within the isolines of 10 j*R/h a contaminated area of up to 25 km in length and up to 6 km in width extended towards the northeastern direction. Thus, the contaminated area outside of the premises of the combine covered about 100 km3.
3. The total amount of radioactive substances in this area was 530 - 590 Ci. Isotope composition of the radioactive trace was determined by ruthenium-103 (1%), ruthenium-106 (31%), zirconium-95 (22%), niobium-95 (45%) and plutonium-239 (0.02%).
4. A typical feature of the contamination is its considerable heterogeneity. It is caused by the existence of "hot" particles with an activity of up to 10-11 Ci/particle.
5. The small village of Georgievka is situated in the contaminated area. Here, gamma exposure rate varied between 14 and 42 jiR/h at 1 m height. Conservative estimation of the maximum external radiation dose of the population of Georgievka yielded a value of 100 mrem/year.
6. The Pu-239 inhalation dose of the population of Georgievka when passing the radioactive cloud did not exceed 1.5 mrem.
7. A prognosis was made with regard to water contamination of the rivers Samuska and Tom during the flood in spring. Furthermore, contamination of the air layer adjacent to the ground resulting from the wind transport of radionuclides due to agricultural work or the passing of vehicles in the summer months at Georgievka was predicted. The values were far below the limits fixed in accordance with the valid radiation protection regulations. At the same time, it must be pointed out, however, that radionuclide concentration of the snow water may exceed the limits specified for drinking water. Water contamination should therefore be measured in wells or small closed natural waters.
8. According to the data measured by the meteorological stations, the radioactive products were not entrained beyond the borders of the country.
Risø-R-750(EN) 41

Annex 1
Calculation of the Factors of Conversion of the Dose Rate Distribution of the Ground into the Contamination Density of Individual Radionuclides
On the basis of the gamma aerial survey of the contaminated area, a map was set up illustrating the distribution of the gamma exposure rate of the ground. For the preparation of maps of ground contamination by individual radionuclides, the factors of conversion of the total dose rate Ny into the surface contamination density of each t-th radiosiotope Ai must be known:
Ai^BiN, (1)
Dose rate of the ground is determined by adding the gamma radiations of the individual isotopes
N^Y^KiAi (n=l ,2 , . . . ,n ) , (2) i
where A\ is the dose coefficient in (/iR/h)/(Ci/knr). With the activity share of each t-th isotope in the total contamination density A being pi = Ai/A, equation (2) may also be expressed as follows:
n
Ny =A^KiPi = AK . (3)
Here, A" = J^KtPi is related to the actual mixture of n isotopes investigated.
From this, the total ground contamination density by all isotopes may be derived:
A=\Y,I<iPi\ *•, = *"•,• (4)
As Ai = pi A, the following formula for the calculation of the ground contamination density by the t-th isotope is obtained from (4):
Ai = -^—N, (5)
i
Hence, the factors of conversion of the gamma dose rate into the surface contamination density can be represented as follows:
(6) v=[Y,KiPi) ; Bi=Pi(J2i<iPi)
Obviously, the conversion factors B and Bi are dependent on the isotope composition of the gamma emitters and their dose factors only.
Let us now determine the formula for the conversion of the gamma exposure rate of the ground measured N0y into the density of isotope contamination of the surface >), for the radioactive trace generated following the accident at the chemical combine on April 6, 1993.
Sampling of the snow and simultaneous measurements of the dose rate in the contaminated area were performed by ZapSibgidromet experts along the routes Ml - M4 both away from and near the road from Tomsk to Samus (up to 50 m) as well as in the most contaminated section at km 28. As the snow near the road had already begun to thaw, samples were also taken from the upper soil layer.
All samples were observed to have stable isotopic ratios. The activities of the individual isotopes in percent are given below.
42 Risø-R-750(EN)

Isotope ,03Ru 106Ru 95Zr 9SNb i 1 2 3 4
Mean value for routes M1-M4 1.5 32.4 22.8 43.3 Mean value for km 28 13 298 20.8 48.1
Mean value 1.4 31.1 21.8 457
For the calculation of the dose coefficients A', on the basis of the experimental data, equation system (2) with four unknown quantities A'i, Å'2, A'3 and A'4 must be solved. Unfortunately, the measurements of Ai near the road turned out to be too small, which obviously had to be attributed to partial penetration of the isotopes into the soil. Correct sampling of the ground was very difficult due to the partly molten snow. Snow samples taken in the taiga far away from the road indicated that practically the entire activity was concentrated on the upper 1 -2 cm of the snow layer [23]. Due to the very small number of measured values available and the strong fluctuations of the results for A,, which were caused by the existence of "hot" particles in the samples, 95Zr and 95Nb could only be approximated, A'3 a A'4 = 17(/iR/h)/(Ci/km2). This nearly corresponds to the theoretical value of A' = 14 which was determined when calculating the radiation exposure after the Chernobyl accident [24]. For 103Ru and 106Ru, estimations of this type could not be performed on the basis of the data measured in the Tomsk trace, as the values of A\ and A'2 were too small. For this reason, the theoretical values of Ki for film contamination of an infinite, homogeneously contaminated plane indicated in [15] were applied in the following calculations:
Isotope 103Ru I06Ru 95Zr 95Nb
A',(,iR/h)/(Ci/km2) 8.2 3.4 12 13
Using these values of A'j and the above values of p,-, a total of the radioactive products of the Tomsk accident of A' = 9.7(/iR/h)/(Ci/km2) is obtained. This corresponds to a value of B = 0.115 (Ci/km2)/(/iR/h).
According to (1) and (6), ground contamination density of the individual isotopes can be calculated as follows:
For 103Ru At = 1.4 • 10"3(iV7o - N^) . (7)
For 106Ru /12 = 3.2 • l O - ^ o - JV7<>) . (8)
For 95Zr A3 = 2.2- 10_2(iV,o - N^) . (9)
For 95Nb Æ, = 4.7 • l O - 2 ^ - N1<p) . (10)
For the total of these isotopes
/l = 0.115(Ar70-jVV,) , (11)
where N^Q is the dose rate measured and JV1# the gamma background in (iR/h. The density of radioactive contamination of the ground is denoted by Ai or A in Ci/km2.
In accordance with the isotopic ratio 239,240puy>&52r = 3.4 xlO - 4 , the formula for the estimation of the contamination density of the ground by these isotopes has the form of
Rist»-R-750(EN) 43

Aru = 7.G\0-6(N^0-N1+) Ci/km2 . (12)
In March 1993 already, an aerial survey of the gamma background had been carried out by ZapSibgidromet along several routes. On the basis of the values obtained, a gamma background of N\^ a lOjjR/h can be selected for the formulas (7) through (12).
References
1. Vladimirov V.A., Nedelchuk I.P., Subbotin G.I., Gorev S.S., Vasnev V.D., Bashevoi S.I. (1933). Report about the state of radiation in the area affected by the accident at the Siberian chemical combine (Tomsk-7), April 13,1993 (in Russian). In coordination with the Ministry of Atomic Energy, the Ministry of Health, the Ministry of Environmental Protection, Rosgidromet, and the Committee for States of Emergency of the Tomsk region. Confirmed by the chairman of the Russian State Committee for States of Emergency, S. Shoigu, April 15, 1993.
2. Ivanov A.B., Nosov A.V., Reut B.Ya., Verbitski B.B., Popov Yu.S. (1993). Information on the results of the express analysis of radiation exposure in the surroundings of the Siberian chemical combine "Tomsk-7" (in Russian). April 15, 1993.
3. Tsybikov N.A., Zinenko V.I., Vozzhennikov O.I., Artemov E.M., Chirkov V.A. (1993). Preliminary estimation and prognosis of radiation exposure resulting from the accident at the Siberian chemical combine (Tomsk 7) (in Russian). Report. Novosibirsk, 1993.
4. Pavlotskaya F.I., Goryachenkova T.A., Fedorova Z.M. et al. (1984). Method of plutonium determination in the soil (in Russian). Radiokhimiya, 26, No. 4, 460- 466.
5. Instructions and methods for the estimation of radiation exposure in a contaminated area (in Russian). Confirmed by the president of the Interauthority Commission for Environmental Radiation Control, Yu.A. Izrael.
6. Manual of Protective Action Guides and Protective Actions for Nuclear Incidents. - US EPA, Washington, 1991.
7. Garger E.K. et al. (1990). Estimation of the parameters of the wind transport of radionuclides in the surroundings of the Chernobyl nuclear power plant (in Russian). Meteorologiya i gidrologiya, 1, 5-10.
8. Transuranium elements in the environment (in Russian). Translation from English, ed. U.S. Henson. Moscow, Energoatomizdat, 1985, 344 pp.
9. Koloskov I.A., Pisarev V.V., Sinitsina Z.L. (1986). Washout of Sr-90 from various soils and grounds (in Russian). Pochvovedenie, 2, 34-45.
10. Chernobyl: Radioactive contamination of the environment (in Russian). Ed. Yu.S. Izrael, Leningrad, Gidrometeoizdat, 1990, 250 pp.
11. Borzilov V.A., Vozzhennikov O.I. et al. (1989). Physico-mathematical simulation of the washout processes of long-lived radionuclides from waters in the 30-km zone surrounding the Chernobyl nuclear power plant (in Russian). Meieorologiya i gidrologiya, 1, 5-13.
12. Vozzhennikov O.I. et al. (1990). Chamber model for the prognosis of water contamination (in Russian). Vodnye nsuriy, 6, 94-97.
44 Risø-R-750(EN)

13. Vozzhennikov O.I., Dragolyubova I.V. (1992). Self-purification rate of the soil layer after a nuclear power plant accident (in Russian). In: "Ecological aspects of nuclear accidents" (in Russian), Moscow, Energoatomizdat, 1992, 131-141.
14. Mikkelsen, T, Larsen, S.E. (1984). Description of RISO PUFF Diffusion Model, Nuclear Technology, 67, 56-65.
15. Methods for the calculation of the spread of radioactive substances from a nuclear power plant and the irradiation of the population in the surroundings (in Russian). Technical standard 38.220.56-84. Interatomenergo, Moscow, Energoatomizdat, 1984.
Risø-R-750(EN) 45

Bibliographic Data Sheet Riso-R-750(EN)
Title and authors)
Analysis and prognosis of radiation exposure following the accident at the Siberian chemical
combine Tomsk-?
S.M. Vakulovski, V.M. Shershakov, R.V. Borodin, O 1 Vozzhennikov, Ya.l. Gaziev, V.S. Kosylch, K.P. Makhon'ko, and V.B. Chumichev
ISBN I55R
87-550-1980-3 0106-2840 Dept. or group Date
Meteorology and Wind Energy October 1994
Groups own reg. number(s) Project/contract No.
Pages Tables illustrations References
47 13 20 15
Abstract (Max. 2000 char.)
On the basis of the work (ground investigations and gamma aerial surveys) carried out jointly by the Rosgidromet organizations and Berezovgeologiya, data on the radiation exposure in Russia were obtained shortly after the accident of April 6, 1993 already. These data were transmitted to interested institutions. The measurements performed on April 11 and 12, 1993 indicated that within the isolines of 10 pR/h a contaminated area of up to 25 km in length and up to 6 km in width extended towards the northeastern direction. Thus, the contaminated area outside of the premises of the combine covered about 100 km3. The total amount of radioactive substances in this area was 530 - 590 Ci. Isotope composition of the radioactive trace was determined by ruthenium-103 (1ft), ruthenium-106 (31%), zirconium-95 (22%), niobium-95 (45%) and plutonium-239 (0.02%). Contamination heterogeneity is caused by the existence of "hot" particles with an activity of up to 10-11 Ci/particle. In the contaminated area the gamma exposure rate varied between 14 and 42 pR/h at 1 m height, yielding the maximum external radiation dose 100 mrem/year for the population of Georgjevka. The Pu-239 inhalation dose of the population of Georgievka when passing the radioactive cloud did not exceed 1.5 mrem. A prognosis was made with regard to water contamination of the rivers Samuska and Tom during the flood in spring. Furthermore, contamination of the air layer adjacent to the ground resulting from the wind transport of radionuclides in the summer months at Georgievka was predicted. The values were far below the limits fixed according to the valid radiation protection regulations. However, that radionuclide concentration of the snow water may exceed the limits specified for drinking water. According to the data measured by the meteorological stations, the radioactive products were not entrained beyond the borders of the country. Source estimation was successfully obtained using RIMPUFP, the Risø on-line puff diffusion model, in backfitting mode.
Descriptors 1NIS/EDB
ACCIDENTS; ALPHA-BEARING WASTES; ATMOSPHERIC CIRCULATION; ATMOSPHERIC PRECIPITATIONS; EXPLOSIONS; FISSION PRODUCT RELEASE; FUEL REPROCESSING PLANTS; HYDROLOGY; MATHEMATICAL MODELS; METEOROLOGY; MONITORING; ORGANIC SOLVENTS; R CODES; RADIATION DOSES; RUSSIAN FEDERATION; SURFACE CONTAMINATION
Available on request from: Risø Library, Risø National Laboratory (Risø Bibliotek, Forskningscenter Risø) P.O. Box 49, DK-4000 Roskilde, Denmark Phone (+45) 46 77 46 77, ext. 4004/4005 • Telex 43 116 • Fax (+45) 46 75 56 27

Objective The objective of Risø's research is to provide industry and society with new potential in three main areas:
• Energy technology and energy planning • Environmental aspects of energy, industrial and plant production • Matenals and measuring techniques for industry
As a special obligation Risø maintains and extends the knowledge required to advise the authorities on nuclear matters.
Research Profile Risø's research is long-term and knowledge-oriented and directed toward areas where there are recognised needs for new solutions in Danish society. The programme areas are:
• Combustion and gasification " Wind energy • Energy technologies for the future • Energy planning • Environmental aspects of energy and industrial production • Environmental aspects of plant production • Nuclear safety and radiation protection " Materials tvith new physical and chemical properties • Structural materials ' Optical measurement techniques and information processing
Transfer of Knowledge The results of Risø's research are transferred to industry and authorities through:
• Research co-operation • Co-operation in R&D consortia • R&D clubs and exchange of researchers • Centre for Advanced Technology • Patenting and licencing activities
To the scientific world through:
• Publication activities • Co-operation in national and international networks • PhD- and Post Doc. education
Key Figures
Risø has a staff of just over 900, of which more than 300 are scientists and 80 are PhD and Post Doc. students. Risø's 1995 budget totals DKK 476m, of which 45% come from research programmes and commercial contracts, while the remainder is covered by government appropriations.
m IK
Risø-R-750(EN) ISBN 87-550-1980-3 ISSN 0106-2840
Available on request from: Risø Library Risø National Laboratory PO. Box 49, DK-4000 Roskilde, Denmark Phone +45 46 77 46 77, ext. 4004/4005 Telex 43116, Fax +45 46 75 56 27