analysis and programming system for bioacoustics · analysis and programming system for...
TRANSCRIPT

SIGNAL 5tm
Analysis and programming system for bioacoustics
SIGNAL 5 provides a rich and powerful graphical environment for viewing, measuring, and manipulating signals.

SIGNAL 5 is easy to learn and convenient to use. Many actions, such as opening and displaying a sound file, can be performed simply using drag and drop.
Multiple graph windows display anunlimited number of signals simultaneously. A crosshair cursor provides measurement, zooming, storage, and data logging; a trackingcursor
tracks the function values
a power spectrum or pitch contour, and astre box
of
tch zooms spectrogram sections.
,
ph
d for even called from SIGNAL
rograms.
Graph properties can be changed interactively, including font size, captionscustom axis labels, axis range, and axis intervals, and saved to recreate the gralater. Custom graph layouts can be composed from graphs of any types and sizes, using drag-and-drop, then savereuse, and p

Draw high-resolution spectrograms in 256 colors or grey levels. SIGNAL automatically detects monitor capabilities and draws spectrograms at maximum screen resolution for detailed viewing.
The gradient spectrogram can display low-level spectrogram features in high relief, using mathematical differentiation and topographical shading.
The browser window displays current signal buffers and graph windows in a tree view similar to the previous SIGNAL buffer directories. Signals can be graphed, listed, copied, deleted, and saved to disk directly from the tree, using drag-and-drop and menus.

analysis.
The most common operations are presented on the main SIGNAL toolbar.
Every SIGNAL operation is available from an extensive menu system which presents a detailed dialog showing command parameters and their interaction (in the figure, as the user alters FFT length, SIGNAL automatically reports changing frequency and time resolution). Online help is available for every dialog to explain every parameter in the dialog.
SIGNAL operations can also be performed by entering SIGNAL commands in the console window, as in SIGNAL 3 and 4. SIGNAL commands are the basis for writing programs for automated data

luding
in a
pectrum.
A full set of tools for signal editing allows signals to be manipulated for analysis or playback. Signal segments can be extracted, inserted, deleted, concatenated, rescaled in amplitude, and reversed in time. Some editing commands can be applied directly to spectrograms, for example, to edit them prior to sound comparison or display.
Signal measurement tools can measure the amplitude characteristics of waveforms, power spectra and spectrograms, incmaximum, minimum, average, and RMS values, and the point and coordinate locations of these features. Examples include: the sound energy in a time waveform or amplitude envelope, the time location of a sound level maximum, the peak amplitude and frequency of a power spectrum, or the maximum and minimum frequencies and times in a spectral contour. Measurementscan be performed over individual eventssequence, or individual peaks within a power s
A spectral contour extracts a signal's time-varying pitch behavior into a mathematical function. Spectral contours capture a sound's complete spectral shape, and are a powerful analysis tool for tonal and harmonic signals. They can be measured, manipulated, used in sound synthesis, and compared statistically – for example, to extract and measure frequency-time features such as minima and maxima, frequency-time slope, frequency range, and signal duration; for similarity analysis of tonal, harmonic or noisy sounds; and to isolate, manipulate, and re-synthesize tonal and harmonic sound features.

SIGNAL includes a built-in log file that can be customized by the user. With the log design wizard, the researcher can specify the number of columns, data types and measurement types. The log file can store screen measurements from the crosshair cursor and calculated values from user programs. The log file can be exported to a spreadsheet or statistical program for further analysis.
file
rs in
arison.
SIGNAL can export sound, image, and measurement files. Sound files can be read and written in SIGNAL, .WAV, AIFF, and headerless binary format. A mathematical resampler can adjust sample rates to accommodate different sound hardware, such as PC and Macintosh sound chips. Graphs can be automatically captured and saved as bitmap (.BMP) files. And measurement files can be exported in text format to spreadsheet and statistics programs.
SIGNAL and RTS can exchange graphics, signals and measurements. You can store RTS measurements in the SIGNAL logfile, export sound segments to SIGNAL for analysis, anddisplay SIGNAL buffean unlimited number of RTS windows for comp

-
CORMAT (Correlation Matrix) automatically performs cross-correlation analysis between every pair of sounds within a data set of unlimited size. Correlation can be calculated between amplitude envelopes, spectral contours, power spectra, or spectrograms. CORMAT performs frequency shifting and time expansion to remove differences in absolute frequency and sound duration from the correlation – two important pitfalls of spectrogram cross-correlation.
CORMAT produces a triangularsimilarity matrix for statistical analysis, such as multidimensional scaling or other cluster analysis.
SIGNAL provides multiple techniques for analyzing, manipulating and resynthesizing natural sounds, including zero-crossing analysis, Hilbert transforms, spectrogram contour detection (which automatically detects pitch contours from a spectrogram) and drawing by mouse. Sounds can be shifted in frequency, expanded or compressed in time, manipulated in amplitude, and segments can be inserted, removed or re-ordered. Manipulation capabilities vary with sound type such as tonal, harmonic or noisy.

tition,
tm.
Acquisition and playback can be flexibly and precisely configured for a wide variety of I/O tasks. SIGNAL 5 supports Data Translation, National Instruments and Windows sound cards.
Programmable sound acquisition provides timed, scheduled or continuous recording to memory or disk.
Programmable sound playback allows for stimulus selection, repevariation, timing and scheduling. Playback stimuli can be composed on the fly based on random selection, user input, or experimental inputs. These capabilities are further extended by Experiment Maker
ental stimuli.
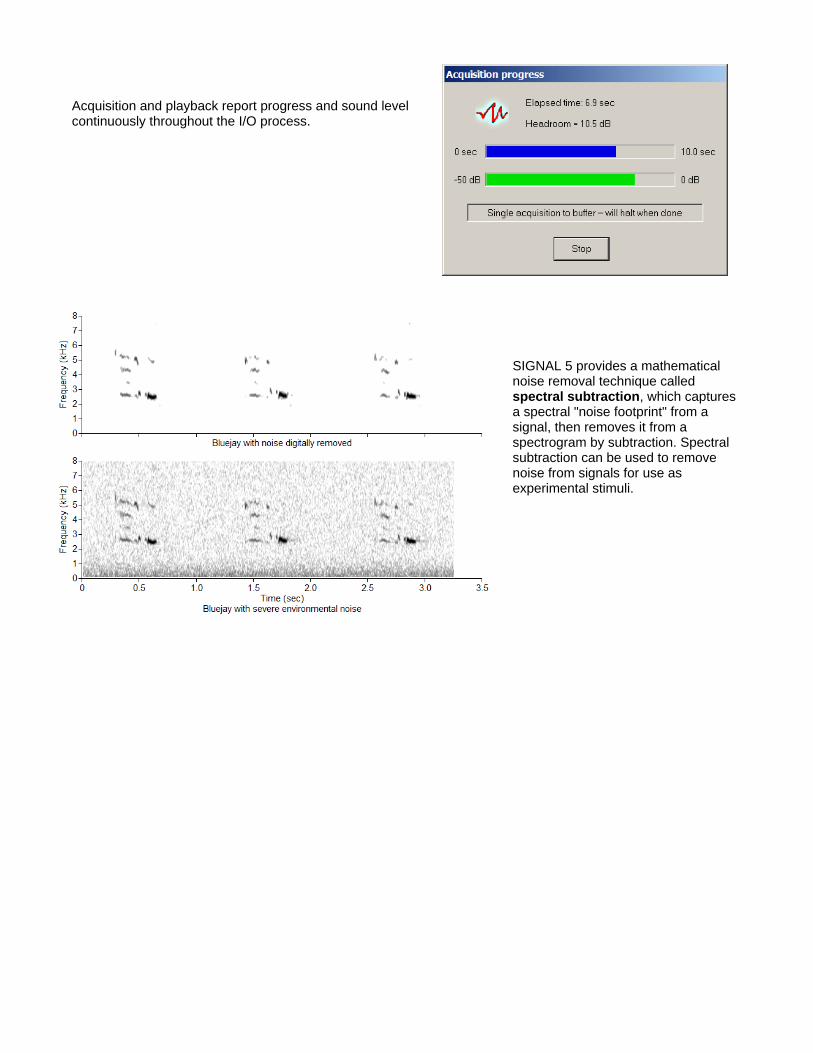
Acquisition and playback report progress and sound level continuously throughout the I/O process.
SIGNAL 5 provides a mathematical noise removal technique called spectral subtraction, which captures a spectral "noise footprint" from a signal, then removes it from a spectrogram by subtraction. Spectral subtraction can be used to remove noise from signals for use asexperim

L
The SIGNAL programming language allows users to write programs to perform complex analyses automatically. This is one of SIGNAL's outstanding capabilities. Programs can range from simple helpers to extended analyses of large data sets.
SIGNAL 5 was designed for maximum compatibility with SIGNAL 4 and SIGNAL 3. A built-in converter will convert older SIGNAprograms to SIGNAL 5 automatically.
The simple program in the figure will automatically loop through an entire sound file set - read a file, calculate the smoothed power spectrum, measure maximum frequency and amplitude, and store those values in a measurement file. And this program can be created for you by the SIGNAL macro recorder!
A macro recorder logs every SIGNAL keyboard command, all menu commands, and most drag and drop operations, automatically translating them into SIGNAL commands. Users can create command files simply by using the menus and dragging signals around the screen!
New users can learn the SIGNAL language quickly by using the menus, then studying the recorded output to learn the corresponding SIGNAL commands. Experienced users can use the recorder to conveniently construct SIGNAL programs.
Macros can also be assigned to function keys for use as keyboard shortcuts. You can create your own commands and execute them with a single keystroke.
The GUI toolkit enables the user to write programs that interact via Windows-like elements such as message boxes, radio buttons, list boxes, and edit boxes. These applications can receive user input through GUI elements, perform SIGNAL operations, then present results through GUI elements and the SIGNAL graph window.

On-line help provides definitions of all commands, parameters and menus. It also provides acoustic background theory and examples.
The highly regarded SIGNAL Reference Guide is a 1000-page guide to the SIGNAL language; bioacoustic measurement; essential applications such sound synthesis, sound similarity and sound modeling; and bioacoustic theory such as spectransforms and digital sampling. Bioacoustic lab courses have been taught from this guide. First published in 1996 and continually revised and expanded since then.
tral

AL
TUTOR is a 30-chapter interactive learning program that teaches all major SIGNfunctionalities by example. TUTOR teaches SIGNAL commands, menus, techniques and the associated bioacoustic theory. TUTOR presents a SIGNAL technique, describes its theory and usage, prompts the user for input, then displays and discusses the results.
TUTOR covers:
• SIGNAL techniques such as sound acquisition, display, and editing
• bioacoustic analysis principles such as sound sampling, Fourier transforms, and frequency resolution
• advanced research techniques, such as sound similarity; sound synthesis; and analysis of frequency contours.
Engineering Design Berkeley, CA USA Tel 510-524-4476 [email protected] www.engdes.com
4-27-2011